Article

The Technical and Economic Feasibility of the CENTEC Floating Offshore Wind Platform

by
Almudena Filgueira-Vizoso
1,
Laura Castro-Santos
2,*,
David Cordal Iglesias
3,
Félix Puime-Guillén
4,
Isabel Lamas-Galdo
5,
Ana Isabel García-Diez
2,
Emre Uzunoglu
6,
Hugo Díaz
6 and
C. Guedes Soares
6,*
1
Escola Politécnica de Enxeñaría de Ferrol, Campus Industrial de Ferrol, Departamento de Química, Universidade da Coruña, Esteiro, 15471 Ferrol, Spain
2
Escola Politécnica de Enxeñaría de Ferrol, Campus Industrial de Ferrol, Departamento de Enxeñaría Naval e Industrial, Universidade da Coruña, Esteiro, 15471 Ferrol, Spain
3
Escola Politécnica de Enxeñaría de Ferrol, Campus Industrial de Ferrol, Universidade da Coruña, Esteiro, 15471 Ferrol, Spain
4
Campus Industrial de Ferrol, Departamento de Empresa, Facultade de Economía e Empresa, Elviña, Universidade da Coruña, 15071 A Coruña, Spain
5
Escola Politécnica de Enxeñaría de Ferrol, Campus Industrial de Ferrol, Departamento de Ciencias da Navegación e Enxeñaría Mariña, Universidade da Coruña, Esteiro, 15471 Ferrol, Spain
6
Centre for Marine Technology and Ocean Engineering (CENTEC), Instituto Superior Tecnico, Universidade de Lisboa, 1049-001 Lisbon, Portugal
*
Authors to whom correspondence should be addressed.
J. Mar. Sci. Eng. 2022, 10(10), 1344; https://doi.org/10.3390/jmse10101344
Submission received: 1 September 2022 / Accepted: 16 September 2022 / Published: 21 September 2022
(This article belongs to the Special Issue Offshore Wind Energy)

Abstract

:
This paper defines a methodology for the economic feasibility analysis of a floating offshore wind farm composed of tensioned leg platforms, which are part of the EU ARCWIND research project. In this context, the phases and subphases of its life-cycle process are considered to deal with aspects such as bathymetry, characteristics of the platforms, distance from the farm to shore, distance from the farm to port and offshore wind speed. All the costs and other external parameters such as capital cost, electric tariff, interest rate, percentage of financing and corporate tax have been analysed to calculate the internal rate of return, net present value, discounted pay-back period and levelized cost of energy of the farm. This work studies a farm composed of TLP offshore wind platforms designed by CENTEC and located at Ribadeo in Spain. Results indicate the costs and the economic feasibility of this platform for deep waters. They indicate that the platform is economically feasible for the location selected.

1. Introduction

Wind energy is produced onshore and offshore. Taking advantage of the fact that 70% of the planet’s surface is covered by water and that a small percentage of wind energy is offshore, for example, in Europe in 2020, 16.4% of electricity demand was covered with wind energy, and within this 13.4% was onshore [1]; only the remaining 3% was offshore.
The production of offshore wind energy is made by fixed and floating platforms. Within the fixed ones, mention can be made of monopiles [2,3,4], tripod [5,6,7], tripilote, gravity [8,9] and jacket [10], and within the floating ones the main ones are: Semi-submersible [11], TLP (tensioned leg platform) [12] and Spar [13].
This paper describes a method of determining the economic feasibility analysis of a floating offshore wind farm [14,15,16,17] composed of CENTEC-TLP (tension leg platform) devices, which are part of the ARCWIND research project. For this purpose, the phases and subphases of its life-cycle process were considered, taking into account several inputs for this implementation: bathymetry, characteristics of the platforms, distance from farm to shore, distance from farm to port and offshore wind speed. Therefore, the method proposed allows the user vary some important inputs in order to know their influence in the main economic parameters. This is important because the majority of the studies consider general costs but not specific ones. All the costs and other external parameters such as capital cost, electric tariff, interest rate, percentage of financing and corporate tax have been taken into account to calculate the cash flows of the farm. This was the basis for calculating the main economic feasibility parameters: internal rate of return (IRR), net present value (NPV), discounted pay-back period (DPBP) and levelized cost of energy (LCOE) of the considered offshore wind farm [18,19,20,21,22,23,24]. Different researchers have developed methodologies for calculating the LCOE, and this calculation can be applied to different sectors, for example, Ueckerdt et al. [21] analyse as system LCOE allow the economic comparison of generating technologies and deriving optimal quantities in particular for VRE (variable renewable sources), Johnston et al. [22] review the challenges of accurately estimating levelized cost of energy (LCOE) for offshore wind outlining differing approaches to calculating LCOE, the factors influencing this, and the impact of variation in LCOE calculation. This paper studies a farm composed of the TLP offshore wind platform designed by CENTEC and located at Ribadeo in the northwest of Spain. Results will indicate the economic feasibility of the TLP platform.

2. Materials and Methods

2.1. Technical Feasibility

The CENTEC-TLP is a steel hull with a DTU-10MW turbine. The platform is detailed in [25]. It may be regarded as a free-float capable TLP. It attains this behaviour through a towing mode that resembles the behaviour of a barge platform. Once towed to the location, it is then installed to perform as a TLP [26].
The tension leg platform is overall lighter than other hulls as it replaces the reliance on hull form to attain stability using mooring lines. When it comes to the offshore wind sector, most works [12,27] try to use the SeaStar hull form [28] to keep the low mass advantage. This idea originates from the older MIT/NREL design [29]. However, this hull form is limited in application. Even in the oil and gas sector, only 5 of over 30 TLPs prefer this geometry [30], with the latest installation being in 2007. Despite a large number of designs, the impracticality of the hull form is apparent: there are no demo projects with TLPs despite both SPAR and Semisubmersible hull forms [31] being installed and operational as wind farms already.
Despite the large number of works using the SeaStar, the conventional TLP form is Conoco Phillips’ Hutton in 1984, similar to a floating production system (e.g., [32]) regarding its use of ring pontoons underwater. This hull form is more suitable for addressing the technical challenges imposed by the wind industry. TLP’s disadvantages are primarily associated with the stages up to when it is installed and operational. Its instability without its mooring lines forces alternative solutions such as additional barges.
At this point, it should be considered that multiple offshore wind platforms need to be installed on farms. For this reason, the oil-and-gas-sector experience does not translate well into the offshore wind case. It may be economically feasible to carry one platform to the installation location at a high price for oil and gas. On the other hand, when it comes to offshore wind, this operation may need to be repeated up to 100 times, depending on the size of the wind farm. Hence, the hiring costs of specialized vessels accumulate. For similar reasons, recent studies emphasize improving production speeds using modular production methods (e.g., tension leg platforms as explained in [33,34]).
Another problem lies in the towing locations. The assumption that the structure needs to be towed into the installation area using standard vessels after being assembled at the shore, signifies that it needs to have small motions in waves. The movements should be limited so that the high centre of gravity of the turbine and the tower do not impose stability issues. It needs to also do that at a low draft so that the hull can be towed from most ports. For instance, a draft of 20 m would significantly limit the locations where the platform can be towed from considering that the average draft of ports is below 10 m. Another consideration is the commercial availability of mooring lines used and the maximum stress allowance imposed by [35]. The goal is to adhere to regulations without requiring specially produced mooring lines.
The CENTEC-TLP addresses the problems listed above through its hull form. It acts as a stable barge when towed, and once installed, it performs as a TLP. Its dynamics in both forms have been experimentally and numerically verified [26,36,37].

2.2. Economic Feasibility

2.2.1. Economic Feasibility Parameters Analysed

The objective of this section is to carry out the economic feasibility analysis of the TLP platform. The economic viability of the project can be calculated by different highly effective methods. To determine the economic viability of this project, the Cash Flow is calculated throughout its useful life, as well as various economic parameters:
-
Net Present Value (NPV).
-
Internal Rate of Return (IRR).
-
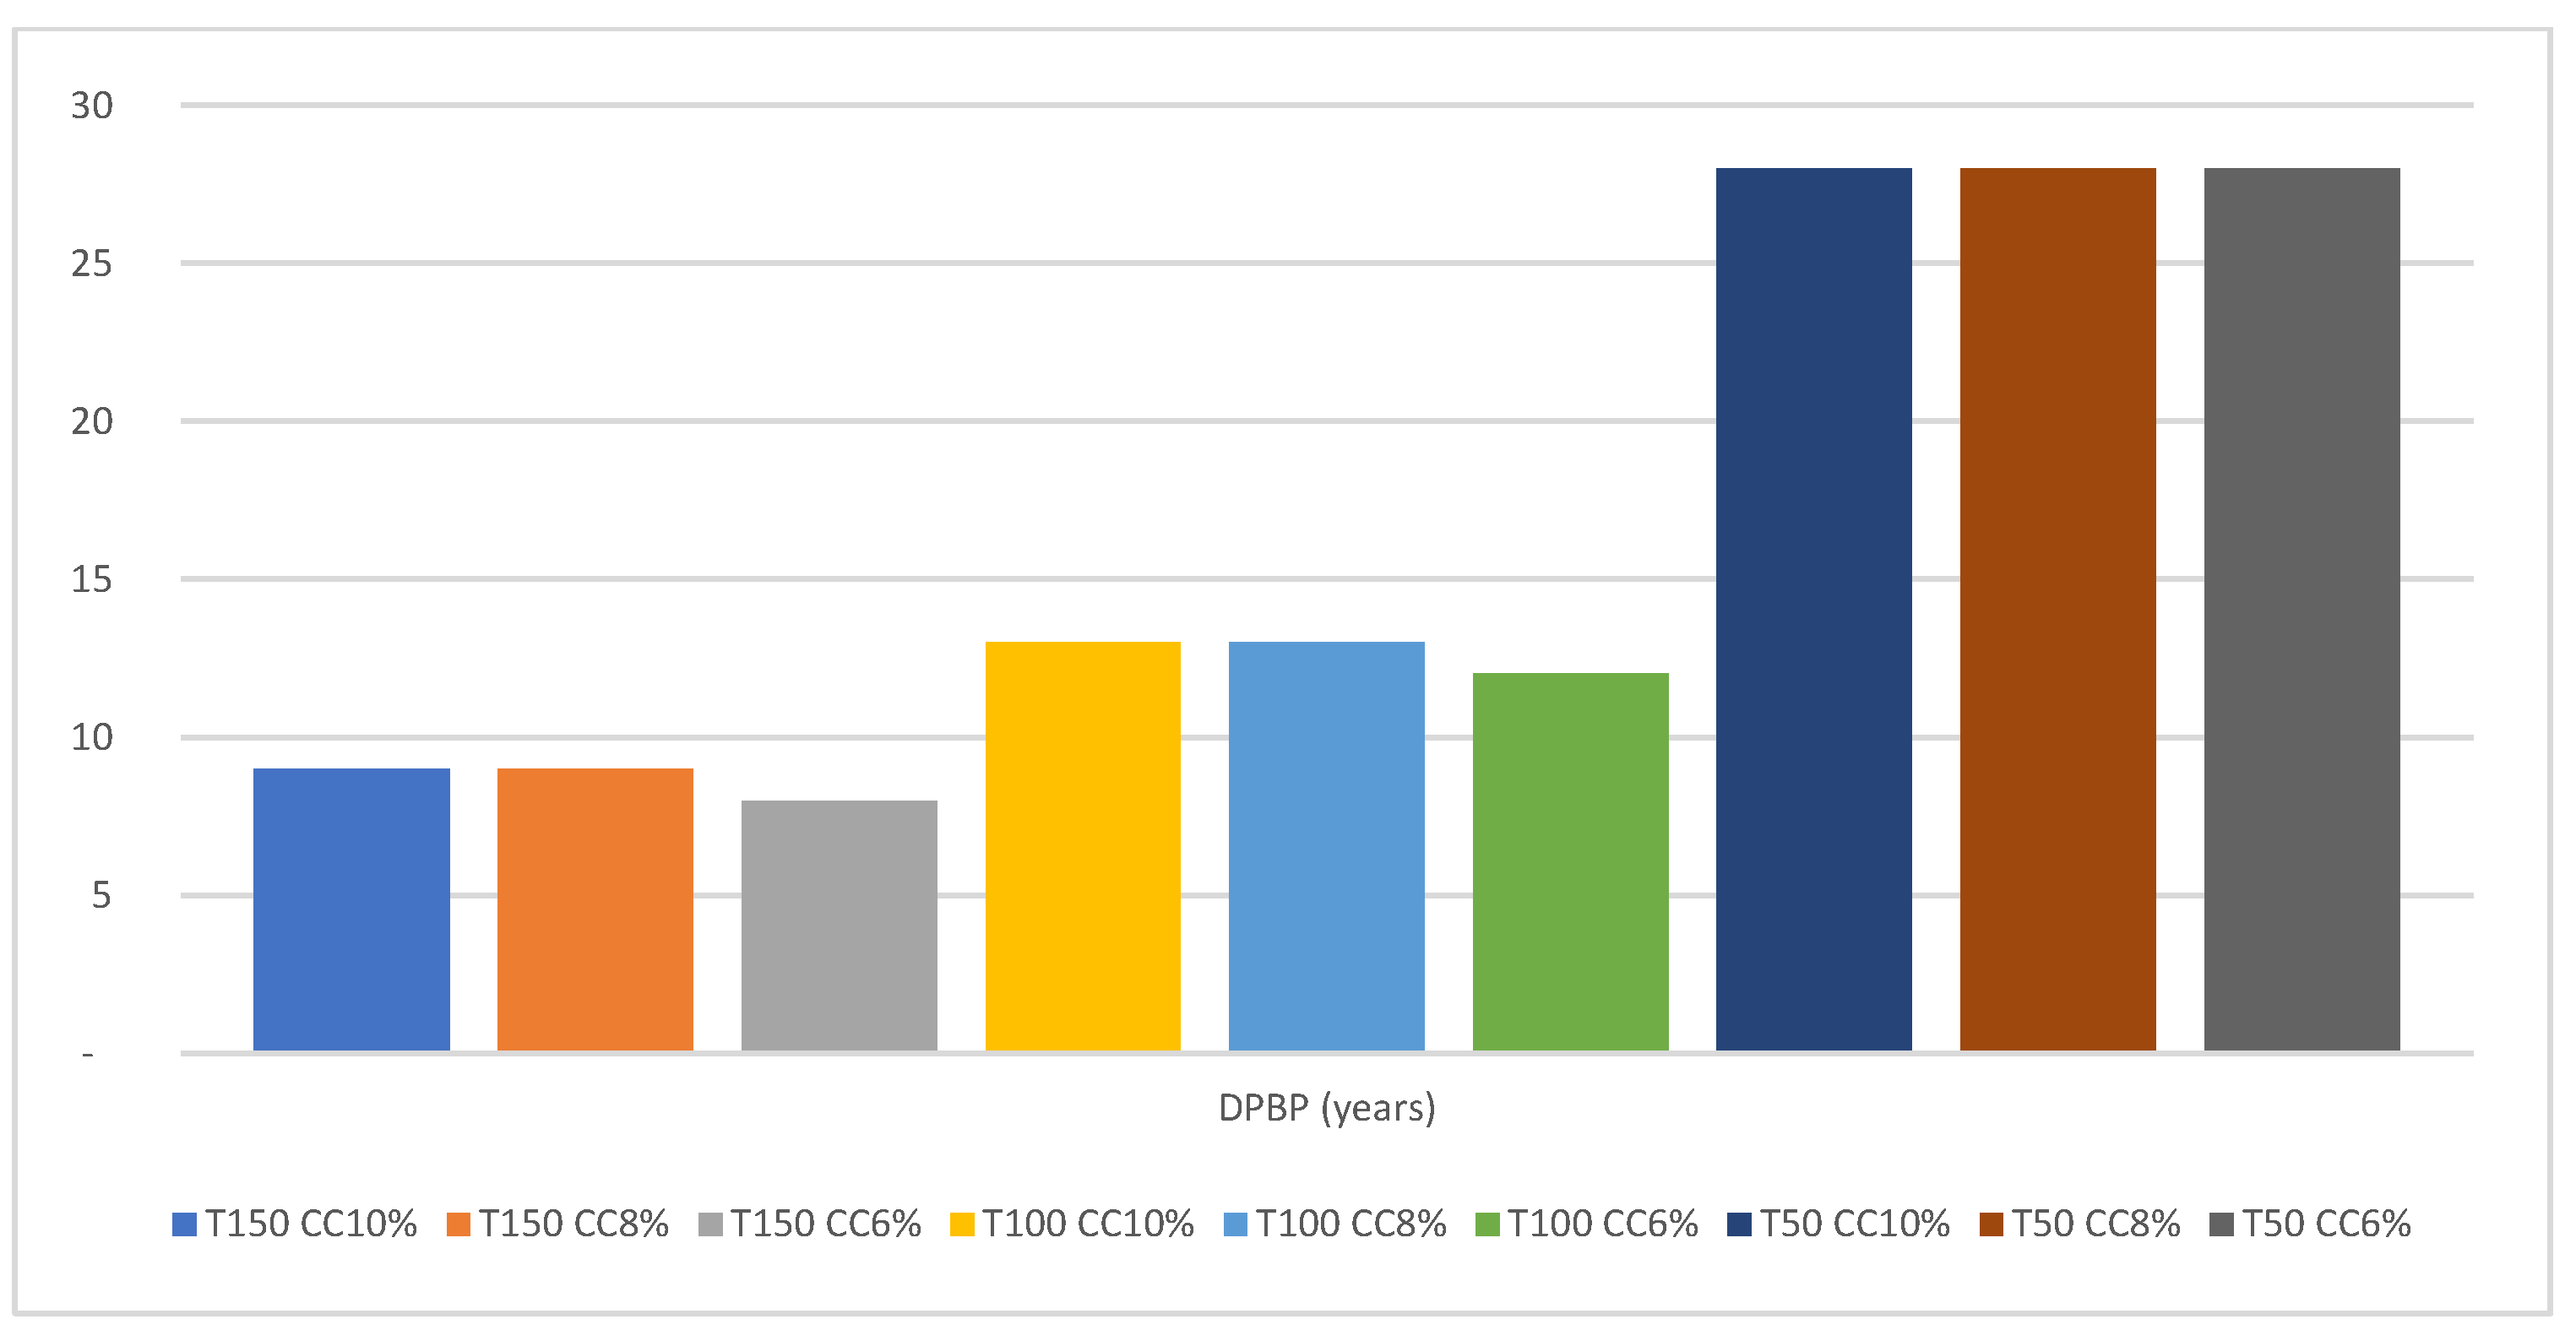
Discounted Pay-Back Period (DPBP).
-
Levelized Cost Of Energy (LCOE)

2.2.2. Net Present Value (NPV)

The Net Present Value (NPV), in €, is the net value of the cash flows of the floating offshore wind farm, taking into account its discount from the beginning of the investment [38,39,40]. It is dependent on the cash flow in year t (CFt), the discount rate (r) and the initial investment (G0), as Equation (1) is shown.
N P V = G 0 + t = 1 n C F t 1 + r t
The discount rate (r) considered for the financed project is the WACC (weighted average cost of capital). It was calculated using the equation.
-
NPV > 0. The investment will generate earnings above the required return (r). This will imply that the acceptance of the project is recommended
-
NPV < 0. The investment produces returns below the required minimum return (r). It is not recommended to accept the project.
-
NPV = 0. The project does not add monetary value above the required profitability (r). The decision must be based on other criteria such as obtaining a better position in the market.

2.2.3. Internal Rate of Return (IRR)

The internal rate of return is the interest generated by the project throughout its useful life. Mathematically, it is defined as the discount rate that cancels the NPV, that is, the interest rate that makes the future flow of funds financially equivalent to the initial outlay.
G 0 + t = 1 n C F t 1 + I R R t = 0
The economic feasibility of the project will depend on the IRR:
-
IRR < k. The profitability obtained from the project is less than the minimum required, so the investment is not recommended.
-
IRR > k. The profitability of the project is above the minimum required, therefore, it is recommended to decide to invest.
-
IRR = k. The profitability is the same as that required, the same happens as in the case where the NPV = 0, the decision is conditioned by other factors

2.2.4. Discounted Pay-Back Period (DPBP)

Discounted pay-back period (DPBP), in years, considers the cash flow of each year with the respective discount rate and adds it to all the previous cash flows with their respective discount rate, accumulating its NPV. When this sum is equal to or greater than the initial investment, this is the year of the DPBP, as Equation (3) is shown. The best DPBP is as low as possible.
t = 1 n C F t 1 + r t G 0
The conditions regarding the feasibility of the project are:
-
DPBP <<< t. The initial outlay takes less time to recover than the life of the project (t). Accept project.
-
DPBP = t. The initial outlay takes to recover the same as the life of the project (t). Indifferent.
-
DPBP > t. The initial outlay takes longer to recover than the life of the project (t). Reject the project.

2.2.5. Levelized Cost of Energy (LCOE)
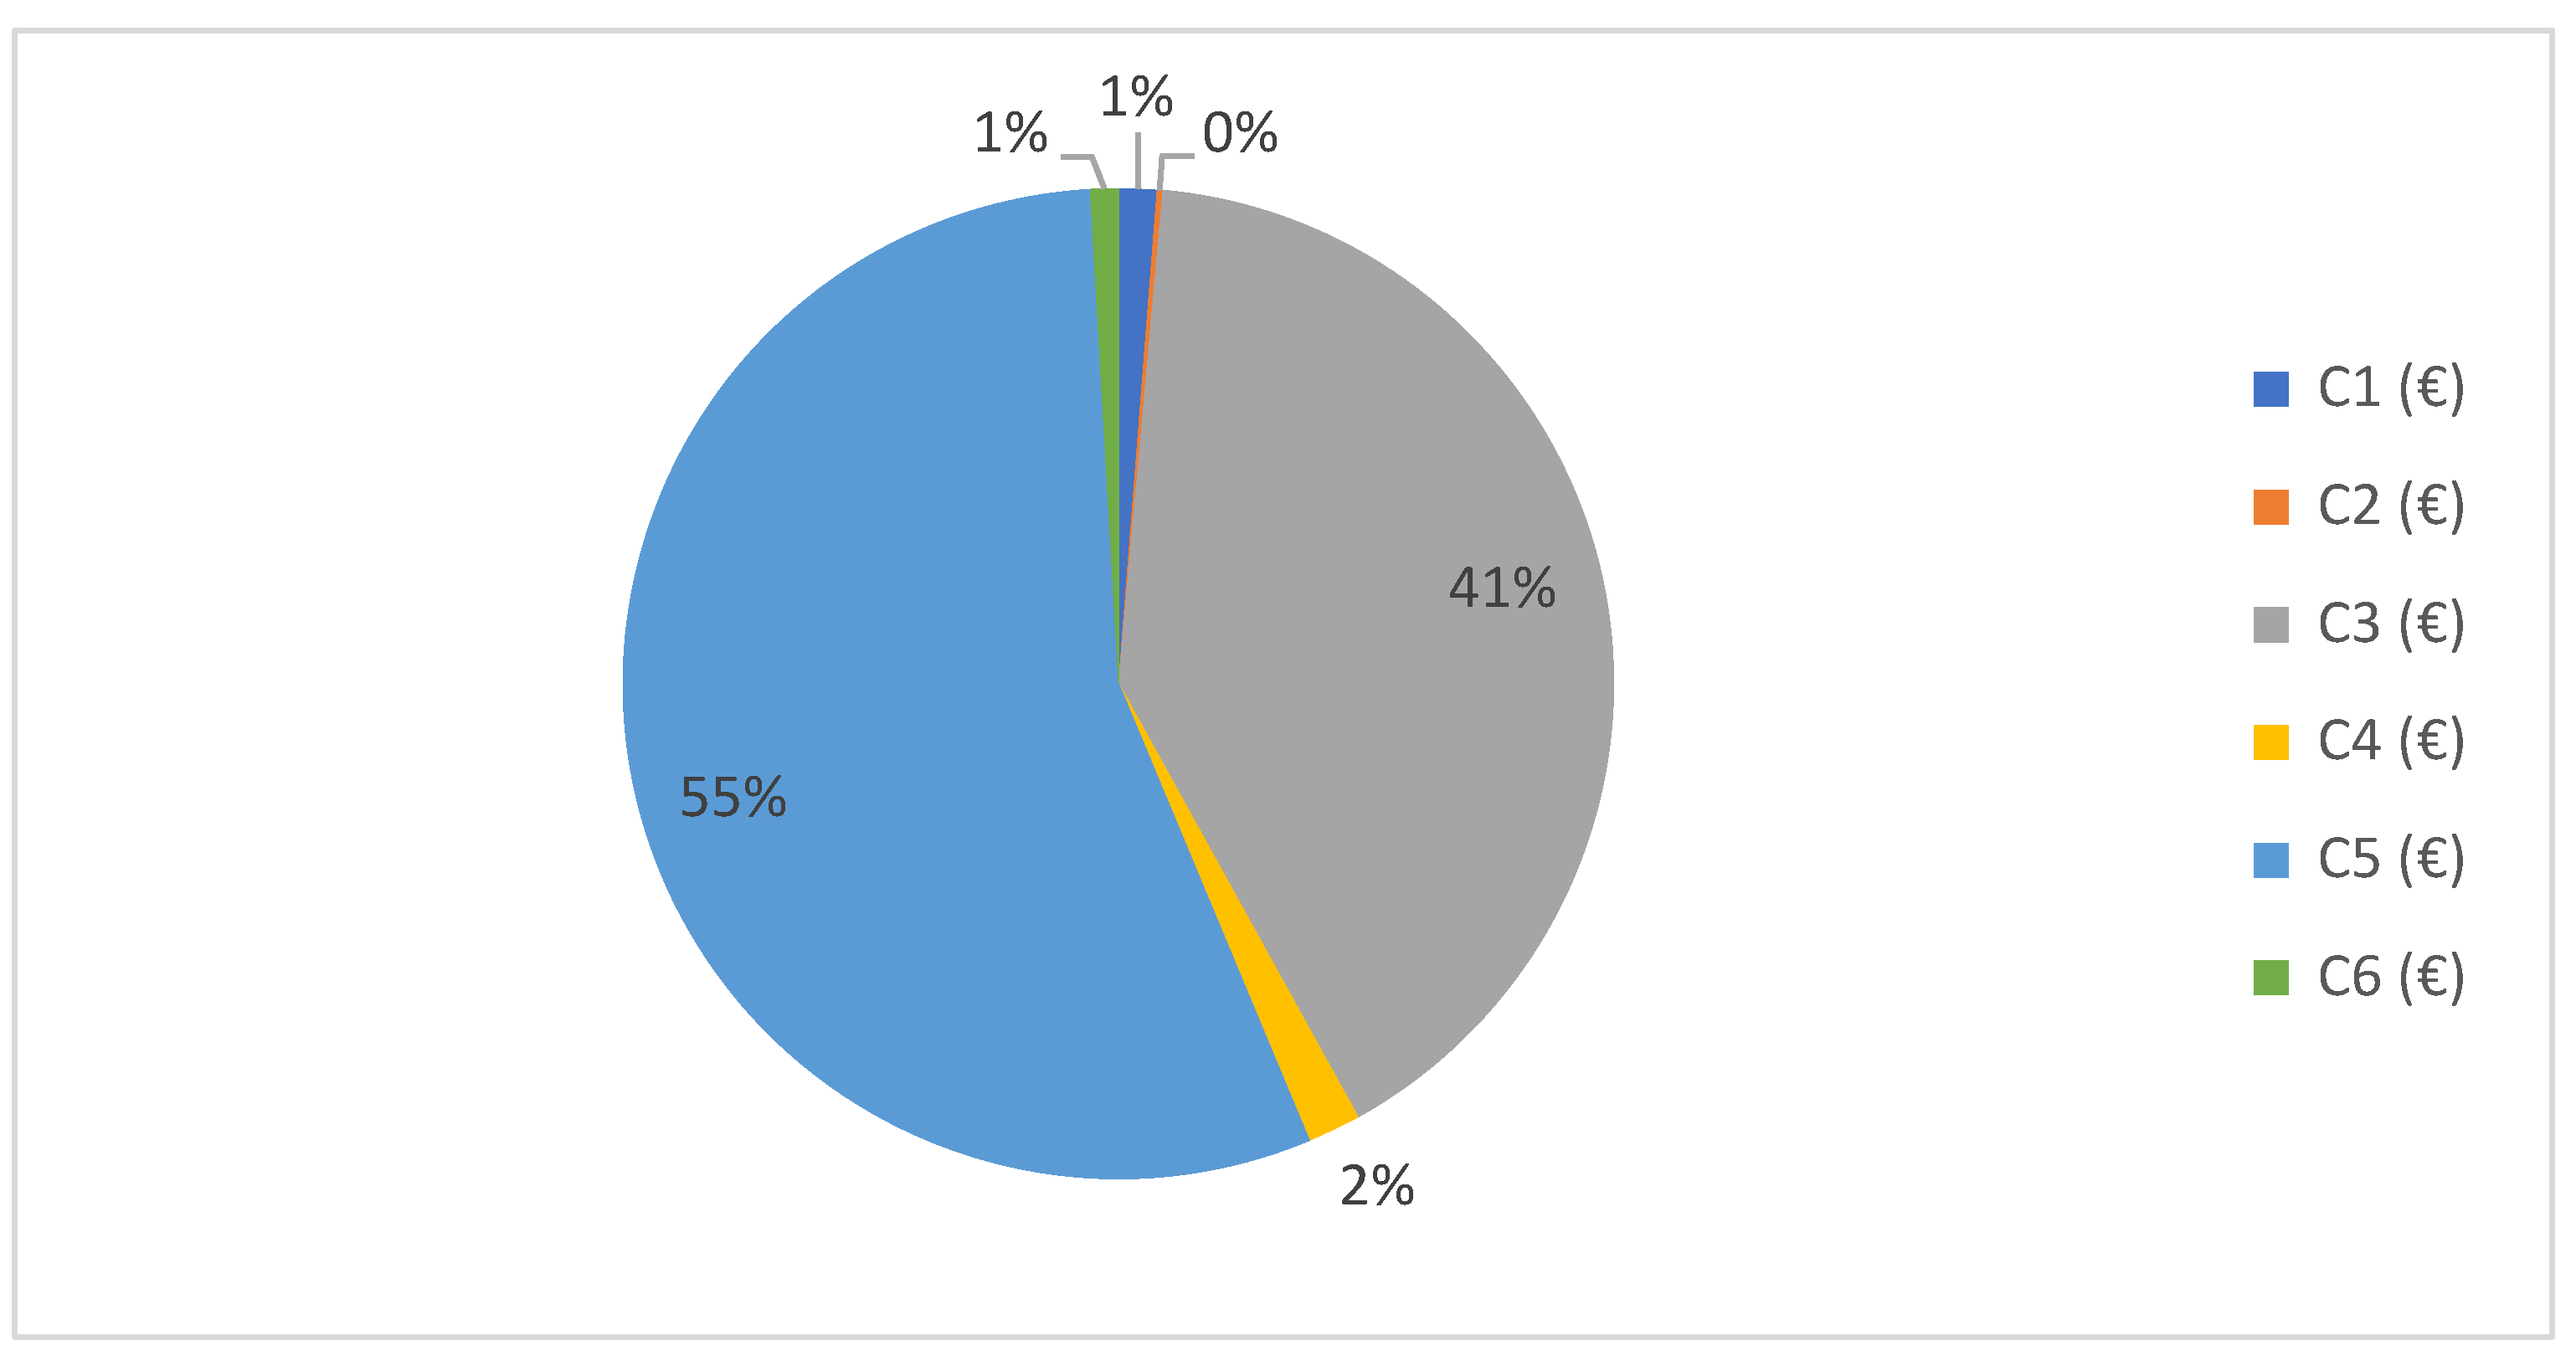
The levelized cost of energy (LCOE), in €/MWh, has been calculated considering the total costs of the farm (LCCt) in €, the energy produced by the floating offshore wind farm (Et) in MWh/year and the capital cost of the project (r) [41].
L C O E = t = 0 t = N f a r m L C C t 1 + r t t = 0 t = N f a r m E t 1 + r t
The total costs of the farm for the year t LCCt are calculated in the next sub-section of the paper (LCCt is CAPEX + OPEX). On the other hand, the energy production of the floating offshore wind farm (En) in kWh/year has been estimated by multiplying the energy produced by each offshore wind turbine by the number of wind turbines (NWT) [41]. The energy produced by one offshore wind turbine is dependent on the total hours per year (factor 8.76), the reduction due to losses (η), the power curve of the offshore wind turbine (PPC(v)) and the Weibull density probability function (pWeibull), whose value will depend on the wind speed (v), the wind scale parameter (cw) and the wind shape parameter (kw) of the location of the European Atlantic Arc selected.
E n = N W T · 8.76 · η · 0 v c u t o u t P P C v · p W e i b u l l ( v ; c w ; k w ) d v
where:
p W e i b u l l v ; c w ; k w = k w c w · v c w k w 1 · e v c w k w
The power curve (PPC) will be integrated into three zones which depend on the power of the wind turbine in MW and on the characteristic wind speed (in m/s) [41]: cut-in wind speed, rated wind speed and cut-out wind speed (vcut−out).

2.2.6. Costs

The total cost of the farm (see Equation (5)) is necessary for calculating the LCOE and some aspects of the cash flow [14,42,43]. The costs are divided into the phases in which the wind farm passes during its life cycle. Each phase is formed by several subphases, which are determined by the components or factors that must be considered to obtain the costs in each case. In this way, the total cost of of an offshore wind farm is obtained from Equation (1) (Castro-Santos & Diaz-Casas, 2014).
LCC = C1 + C2 + C3 + C4 + C5 + C6
where:
-
C1: Conception and definition cost.
-
C2: Design and development cost.
-
C3: Manufacturing cost.
-
C4: Installation cost.
-
C5: Exploitation cost.
-
C6: Dismantling cost.
It is important to notice that there are costs that exist during all the years of the project such as the exploitation cost and other costs that are considered only in the initial years of the project, when it is been built (conception and definition cost, design and development cost, manufacturing cost and installation cost). Finally, there are costs, such as the dismantling cost, that are expended in the last year of the project (Nfarm).
The main cost items are shown in Table 1.
Conception and definition costs (C1) depend on legal aspects (C11) and offshore wind farm certification costs (C12). Particularities and differences between legal aspects exist for the countries where the offshore wind farm could be located. Therefore, it would be advisable to go deeper into each case so that the costs would vary.
C1 = C11 + C12
The legal aspects’ cost (C11) depends on the offshore site renting (OffshoreSiteR) and the number of wind devices (Nplatforms).
C11 =OffshoreSiteR · Nplatforms
The offshore wind farm certification cost (C12) depends on the cost of the offshore wind farm certification (C121), the meteorological research cost (C122), the environmental impact assessment (C123), the geophysical campaign cost (C124), the geotechnical campaign cost (C125) and the initial insurances project cost (C126).
C12 = C121 + C122 + C123 + C124 + C125 + C126
where:
C121 = (1 + EPCIC) · OffshoreSiteR · Nplatforms
C122 = (1 + EPCIC) · (Cemet + Csmet + Csamet)
C123 = (1 + EPCIC) · EvaluationReportCost · Nplatforms · TurbineP
C124 = (1 + EPCIC) · GeophysicalDailyCost · GeophysicalDays · Nplatforms
C125 = (1 + EPCIC) · GeotechnicalDailyCost · GeotechnicalDays · Nplatforms
C126 = Cinsurance · Nplatforms · TurbineP
The design and development cost (C21) depends on the travelling costs for the preparation of the project (TravellingCosts), the number of staff for the project enterprise (Staff), the staff average cost per year (AverageCostY), the number of years until year 0 of the project (Years0) and the office renting per month (OfficeRentingM).
C2 = C21
where:
C21 = (1 + TravellingCosts) · (12 · Staff · AverageCostY · Years0 · OfficeRentingM)
On the other hand, manufacturing costs (C3) will be explained from the sub-phases that constitute an offshore wind farm. The manufacturing costs depend on generator manufacturing costs (C31), floating platform manufacturing cost (C32), mooring manufacturing cost (C33), anchoring manufacturing cost (C34) and electric system manufacturing cost (C35).
C3 = C31 + C32 + C33 + C34 + C35
The generator manufacturing cost (C31) depends on the costs of turbine components (ComponentsCost10MWturbine), the ratio of power and size of the turbine considered (RatioWTGPriceCosts) and the number of platforms (Nplatforms).
C31 = ComponentsCost10MWturbine · RatioWTGPriceCosts · Nplatforms
The floating platform manufacturing cost (C32) depends on the platform engineering cost (C321), the tank testing cost (C322), the manufacturing facilities—civil work costs (C323), the manufacturing facilities—renting on harbour area cost (C324), the manufacturing facilities—other costs (C325), the materials and manufacturing costs of externals (C326), the substructure assembly cost of external works (C327), the harbour’s internal towing cost (C328), the divers (harbour operations) cost (C329), the external access cost (C3210), the tower internals costs (C3211), the J tubes-cable access cost (C3212), the ballast (if any) system cost (C3213), the communication system cost (C3214), the emergency system (if any) cost (C3215), the lighting and other signs cost (C3216), the monitoring system cost (C3217), the safety equipment cost (C3218) and the crew transfer vessels during construction cost (C3219).
C32 = C321 + C322 + C323 + C324 + C325 + C326 + C327 + C328 + C329 + C3210 + C3211 + C3212 + C3213 + C3214 + C3215 + C3216 + C3217 + C3218 + C3219
where:
C321 = FEED + DetailDesignCosts
C322 = TankTestingInplace + TankTestingTransport
C323 = PreliminaryWorksYardCosts + OneDrydockCost · Ndrydocks
C324 = C3241 + C3242 + C3243 + C3244
C325 = Nplatforms · PreparingSeabedCost
C326 = TotalMaterialCostPlatform
C327 = CraneDrydockConstructionCostYT + CraneDrydockSupportCostYT
C 328 = H a r b o u r I n t e r n a l T o w i n g Y e a r s · T u g M o b D e m o b C o s t + N p l a t f o r m s H a r b o u r I n t e r n a l T o w i n g Y e a r s · 2.5 + T u g R e n t i n g D a y s Y
C329 = Nplatforms · NDiversPlat · DiverDailyCost · DiverDaysIntervention
C3210 = Nplatforms · NAccessesPlat · PlatformAccessCost
C3211 = NInternalsTower · TowerInternalsCost · Nplatforms
C3212 = 0
C3213 = Nplatforms · NJTubesPlat · JTubeCost
C3214 = 0
C3215 = ReductionFactorBallast · Nplatforms · TotalBallastCostPlat
C3216 = Nplatforms · NSetsCommunicationPlat · ReductionFactorCommunication · CommunicationSystemCost1
C3217 = 0
C3218 = Nplatforms · NSetsLightingPlat · LightingSystemCost1 · ReductionFactorLighting
C3219 = Nplatforms · PlatformMonitoringCost + StructuralMonitoringCost
The mooring manufacturing cost (C33) depends on the mooring lines engineering and project management (PM) cost (C331), the tendon engineering and PM cost (if any) (C332), the mooring lines manufacturing cost (C333), the connector manufacturing cost (C334), the chain stopper, fairlead manufacturing cost (C335), the bending shoe fairlead, rotatory chain fairlead or similar cost (C336), the mooring lines monitoring cost (C337), the temporary buoys and/or other auxiliary components cost (C338) and the tendon manufacturing and shipping cost (if any) (C339):
C33 = C331 + C332 + C333 + C334 + C335 + C336 + C337 + C338 + C339
The anchoring manufacturing cost (C34) depends on the anchoring engineering and PM cost (C341) and the anchor construction cost (C342):
C34 = C341 + C342
The electric system manufacturing cost (C35) depends on the electric cable manufacturing cost (C351) and the substation manufacturing cost (C352):
C35 = C351 + C352
Given the characteristics of offshore wind farms, related to the remote location from the coast, the installation of the components is an important part of its life cycle. In addition, several aspects related to the floating condition of the TLP platform must be considered to define an effective installation strategy from an economic point of view.
The costs of this phase are divided according to the elements of which an offshore wind farm is composed. In this sense, the installation costs (C4) depend on generator installation costs (C41), platforms installation costs (C42), mooring and anchoring installation costs (C43) and electric cable installation costs (C44):
C4 = C41 + C42 + C43 + C44
The cost of installing the offshore wind turbines (C41) is divided into the installation at port (C411), the transport (C412) and the installation offshore (C413):
C41 = C411 + C412 + C413
The cost of installing the floating TLP platforms (C42) depends on the onshore commission cost (C421), the offshore platform commissioning cost (C422) and other costs-lifting equipment and miscellaneous costs (C423):
C42 = C421 + C422 + C423
The cost of installing the mooring and anchoring of the TLP platforms (C43) depends on the anchor installation cost (C431), the mooring line installation cost (C432), the tendon installation cost (if any) (C433) and other costs-miscellaneous (C434):
C 43 = C a b a r g e + C a t u g + C a a M O D + C a a p u m p s a n d d i v e r s · N a n c h o r i n g T i n s t b a r g e
The cost of installing the electric system (C44) depends on the cost associated with the burial cable intertidal area for 1 platform (BurialCableCost1Plat), the cost associated with the HDD horizontal drilling for 1 platform (HDDCost1Plat), the cost associated with the dynamic cable installation for 1 platform (DynamicCableInstallationCost1Plat), the number of platforms (Nplatforms), the export cable installation cost (ExportCableInstallationCost), the cable mechanical protection cost (CableMechanicalProtectionCost), the cable burial (intertidal area) cost (CableBurialIntertidalAreaCost), the inter array cable commissioning cost (InterarrayCableCommissioningCost) and the export cable commissioning cost (ExportCableCommissioningCost):
C 44 = ( N p l a t f o r m s · ( B u r i a l C a b l e C o s t 1 P l a t + H D D C o s t 1 P l a t + C a b l e O n s h o r e C i v i l W o r k s C o s t 1 P l a t ) ) + D y n a m i c C a b l e I n s t a l l a t i o n C o s t 1 P l a t · N p l a t f o r m s + E x p o r t C a b l e I n s t a l l a t i o n C o s t + C a b l e M e c h a n i c a l P r o t e c t i o n C o s t + C a b l e B u r i a l I n t e r t i d a l A r e a C o s t + I n t e r a r r a y C a b l e C o m m i s s i o n i n g C o s t + E x p o r t C a b l e C o m m i s s i o n i n g C o s t
The operation and maintenance costs are an important part of the life cycle of an offshore wind farm since it will be the most durable phase in time and in which many factors must be considered: the logistic capacity, distance to the coast, the reliability of the turbine components, etc.
Operation and maintenance costs (C5) can be disaggregated into assurance costs (C51), administration and operations cost (C52), maintenance cost (C53), onshore logistics (C54) and offshore logistics (C55). Materials, replacements, consumables and others are maintenance costs that must be considered. The costs of offshore logistics operations depend on the use of barges, marine cranes and helicopters:
C5 = C51 + C52 + C53 + C54 + C55
where:
C52 = C521 + C522 + C523 + C524
C53 = C531 + C532 + C533 + C534
C54 = Nfarm · C54year
C55 = Nfarm · C55year
where:
C55year = C551year + C552year + C553year + C554year
Once the life of the components that make up the offshore wind farm has come to an end, the last phase of the life cycle begins the dismantling [44]. For this task, it is required to disconnect the mooring system. In addition, heavy decoupling operations of floating turbines must be carried out, as well as the transport of structures to the coast. Therefore, dismantling costs (C6) depend on generator dismantling costs (C61), the floating platform dismantling costs (C62), mooring and anchoring dismantling costs (C63) and electric systems dismantling costs (C64):
C6 = C61 + C62 + C63 + C64
where:
C61 = PDturbine · (C41 + C42)
C62 = 0
C63 = PDmooring · C43
C64 = PDcable · C44cable + PDsubstation · C44sube

3. Case Study

The CENTEC-TLP is composed of lower pontoons that help to stabilize the transport phase and act as the primary buoyancy bodies in the installed form (see Figure 1). The overall width of the platform is 49.5 m, with a draft of 20 m when installed. During the towing phase, the draft lowers to 3.85 m, making it possible to place the platform into the water in most ports without being concerned with port-side draft limitations. The structural integrity is provided by the support braces. It uses 3 mooring lines per corner. Detailed sizing information of the platform is available in [25].
Regarding the offshore wind turbine, the DTU 10 MW Reference Wind Turbine has been selected. Its main characteristics are: 10 MW of rated power, 4 m/s cut in wind speed, 25 m/s cut out wind speed, 11.4 m/s rated wind speed, 3 blades, 178.3 m rotor diameter, 5.6 m hub diameter and 119 m hub height.
An objective of the Arcwind project is to identify optimal locations for floating wind projects in the European Atlantic region promising offshore wind development area, as identified in previous studies [45,46,47,48] Nine locations have been defined in the Spanish coastal area and further known constraints have been identified, the locations selection methodology is presented and discussed by Díaz and Guedes Soares [49].
These nine locations are subsequently ranked using an in-house evaluation modelling tool against several criteria to establish the optimum location within Spain. The main characteristics of the Ribadeo location are shown in Table 2.
The nine zones identified during the site selection study [49] as most suitable for the development of commercial-scale floating wind farms, were pragmatically characterized for their compliance with a set of defined technical and environmental parameters. The key constraints considered immovable for offshore wind farm development were as follows; offshore wind resource, the Exclusive Economic Zone (EEZ), water depths, proximity to other maritime activities and distance to environmental protected areas. Further constraints were also considered within the analysis, such as the proximity to underwater lines, proximity to maritime routes, visual impact, distance to the electrical grid and wave conditions. Due to the significant level of constraints considered, exclusion zones were established. This approach considers the main factors that prevent the sustainable deployment of a floating wind farm within the European waters guaranteeing the viability of the achieved locations.
The resultant areas after applying the exclusion criteria cover 1275 km2 of the total area evaluated necessitating a secondary assessment of these areas based on the proposed evaluation criteria. Therefore, the entire space proposed would suppose a total installation of around 500 floating wind turbines. Figure 2 identifies some of the restrictions involved in the process of location identification. It shows the identified nine locations based on the site selection assessment.
The best location within Spain’s EEZ was selected using multicriteria decision-making techniques that ranked the floating wind farm areas proposed based on criteria and experts’ opinions [50,51,52]. Applying these assumptions to the nine locations, the Ribadeo location was identified as the most suitable for the installation of floating turbines. Figure 1, Figure 2 and Figure 3 visualize this area.
This study is focused on the technical and economic feasibility of the CENTEC-TLP concept for the Ribadeo location (see Figure 2). Ribadeo is located on the Galician Coast, Northwest of Spain (latitude, longitude: 43.837, −7.326). The wind farm location is characterized by an average wind velocity of 9.3 m/s and wind potential of 4923 h/yr. Moreover, other details that show the huge potential of the area are presented in Table 1. Figure 2 shows three maps: (1) the map of restrictions to install offshore wind farms in Spanish waters; (2) the floating offshore wind farms proposed (in green); and (3) the Ribadeo floating offshore wind farm, which is the final location selected for this study.
Several scenarios were considered in the present case study for the different locations of the farms. These scenarios were defined considering three electric tariffs (50 €/MWh, 100 €/MWh and 150 €/MWh), due to the permanent change in the electric rates in Europe during the last months [53], and three capital costs (6%, 8% and 10%) [54].
The initial variables are shown in Table 3.

4. Results

4.1. Technical Overview

The technical validation of CENTEC-TLP was carried out both numerically and experimentally. This section summarises the previous publications discussing the performance of the TLP before proceeding with the economics. The towing dynamics are explained in [26]. It was tested experimentally in waves up to 3 m of significant wave height with speeds up to 5 knots. The motions of the platform under these scenarios show that the pitching angle is limited to 0.7 degrees. Given that the platform has stability up to 10 degrees, its motion dynamics allow a large weather window to tow it to the location. Without the platform motions being a limiting factor, other concerns such as the installation process and the owing performance of the tugboats gain prevalence. The platform also has low wave resistance, allowing it to be towed using lower-powered tugboats.
After the platform is towed and installed, the primary factor for tension leg platforms is the mooring line tensions. The dynamics explained in [55] show that the platform can withstand the 50-year extreme weather in the selected installation area as well as the below and above rated operational conditions. As the structure is a TLP, its pitching angles are limited to values under a unit degree. Hence, it is not affected by the platform pitch related power production issues as explained in [56]. The verification of both the towing and motion performance leaves the platform’s economic feasibility as the deciding factor, which is detailed in the following sections.

4.2. Economic Results

Regarding the total costs of the farm (see Figure 3), the farm has a C1 of EUR 54.16 M, a C2 of EUR 8.23 M, a C3 of EUR 1769.83 M, a C4 of EUR 74.85 M a C5 of EUR 2419.85 M and a C6 of EUR 39.51 M. They represent the 1.2% of C1, the 0.2% of C2, the 40.5% of C3, the 1.7% of C4, the 55.4% of C5 and the 0.9% of C6.
Regarding LCOE (see Figure 4), this case study gives values of EUR 76.67/MWh, EUR 71.71/MWh and EUR 67.03/MWh for an electric tariff of EUR 150/MWh and 10, 8 and 6% of capital cost respectively. In addition, it gives values of EUR 62.77/MWh, EUR 58.42/MWh and EUR 54.33/MWh for an electric tariff of EUR 100/MWh and 10, 8 and 6% of capital cost respectively. finally, it gives values of EUR 80.08/MWh, EUR 73.89/MWh and EUR 68.11/MWh for an electric tariff of EUR 50/MWh and 10, 8 and 6% respectively.
The LCOE usually does not depend on the electric tariff considered. However, in the present model, it depends indirectly because the LCOE has been calculated considering the WACC (weighted average cost of capital), which depends directly on the own resources of the enterprise. These own resources have been calculated considering the total initial investment (C1, C2, C3, C4 and C6) and the investment in working capital. Particularly, the investment in working capital has been calculated considering an investment of two months of the incomes of the project (tariff*energy produced), which makes the LCOE depend indirectly on the electricity tariff.
Regarding NPV (see Figure 5), this case study gives values of EUR 1800.44 M, EUR 2180.77 M and EUR 2636.45 M for an electric tariff of EUR 150/MWh and 10, 8 and 6% of capital cost respectively. In addition, it gives values of EUR 258.33 M, EUR 330.86 M and EUR 418.11 M for an electric tariff of EUR 100/MWh and 10, 8 and 6% of capital cost respectively. Finally, it gives values of EUR −898.35 M, EUR −849.96 M and EUR −782.90 M for an electric tariff of EUR 50/MWh and 10, 8 and 6% respectively. As it is observed, a higher capital cost gives values of NPV lower. Therefore, the farm will be economically feasible in terms of NPV for a tariff of EUR 150/MWh and a tariff of EUR 100/MWh, because its value is higher than 0.
Regarding IRR (see Figure 6), this case study gives values of 14.74% for an electric tariff of EUR 150/MWh, 11.25% for an electric tariff of EUR 100/MWh and 0.44% for an electric tariff of EUR 50/MWh, being its value independent on the capital cost considered. Therefore, the farm will be economically feasible in terms of IRR for a tariff of EUR 150/MWh and a tariff of EUR 100/MWh, because its value is higher than the WACC considered.
Regarding DPBP (see Figure 7), this case study gives values of 9 years, 9 years and 8 years for an electric tariff of EUR 150/MWh and 10, 8 and 6% of capital cost respectively. In addition, it gives values of 13 years, 13 years and 12 years for an electric tariff of EUR 100/MWh and 10, 8 and 6% of capital cost respectively. Finally, it gives values of 28 years for all the capital costs considered (10, 8 and 6%). As is observed, a higher electric tariff gives values of DPBP lower. Therefore, the farm will be economically feasible in terms of DPBP for a tariff of EUR 150/MWh and for a tariff of EUR 100/MWh, because its values (from 8 to 13 years) are lower than the life cycle of the project (25 years).

5. Discussion

This work has described the methodology for calculating the economic feasibility of a floating offshore wind farm composed of TLP platforms. For this purpose, firstly the life-cycle costs have been analysed. In this context, the costs have been divided into the costs of each life-cycle stage of the process: conception and definition cost, design and development cost, manufacturing cost, installation cost, exploitation cost and dismantling cost.
Secondly, the main economic feasibility indicators have been calculated taking into account the cash flows of the project: internal rate of return (IRR), net present value (NPV), discounted pay-back period (PBP) and levelized cost of energy (LCOE).
The case study analysed is based on the TLP platform designed by the CENTEC. One farm of 880 MW has been considered for this platform located along the Atlantic Coast of the European Union. It has been located in Ribadeo (the North Area of the North-West region of Galicia, in Spain). Eighteen case studies have been analysed considering different scenarios in terms of three different electric tariffs and three different costs of capital.
Results indicate how important is the electric tariff to determine the values of IRR, NPV and DPBP. The best result is obtained for an electric tariff of EUR 150/MWh and a cost of capital of 6%. It has values of 18.34% of IRR, EUR 2636.45 M of NPV and 8 years of DPBP. Regarding their values of LCOE, the farm has a minimum value of EUR 54.33/MWh. It makes the platform economically feasible for the location selected because the internal rate of return is higher than the capital cost, the net present value is higher than zero and the discounted pay-back period is lower than the life cycle of the project.
The values of LCOE are similar to other authors, which go from GBP 49.28/MWh to GBP 72.74/MWh for the minimum values of Anastasia Ioannou et al. [57] or which go from USD 60/MWh to USD 110/MWh for Maira Bruck et al. [58], for instance.
The method proposed is important to help all the stakeholders (investors, facilities, enterprises, etc.) to do deep analysis in economic terms of the TLP platform selected.

Author Contributions

Conceptualization, A.F.-V., D.C.I., F.P.-G., I.L.-G., A.I.G.-D. and L.C.-S.; Investigation, A.F.-V., D.C.I., L.C.-S., E.U., H.D.; Methodology, A.F.-V., D.C.I., L.C.-S., E.U., H.D.; Resources, A.F.-V., D.C.I., L.C.-S., E.U., H.D.; Supervision, C.G.S.; Writing—original draft, A.F.-V., L.C.-S., D.C.I., F.P.-G., I.L.-G., A.I.G.-D., E.U., H.D., C.G.S.; Writing—review & editing, C.G.S. All authors have read and agreed to the published version of the manuscript.

Funding

This research was funded by EAPA_344/2016 ARCWIND project, co-financed by the European Regional Development Fund through the Interreg Atlantic Area Programme. This work contributes to the Strategic Research Plan of the Centre for Marine Technology and Ocean Engineering (CENTEC), which is financed by the Portuguese Foundation for Science and Technology (Fundação para a Ciência e Tecnologia—FCT) under contract UIDB/UIDP/00134/2020.

Institutional Review Board Statement

Not applicable.

Informed Consent Statement

Not applicable.

Data Availability Statement

Not applicable.

Conflicts of Interest

The authors declare no conflict of interest.

References

  1. WindEurope. Wind Europe Wind Energy in Europe 2020. Statistics and the Outlook for 2021–2025; WindEurope: Brussels, Belgium, 2020. [Google Scholar]
  2. Negro, V.; López-Gutiérrez, J.S.; Esteban, M.D.; Alberdi, P.; Imaz, M.; Serraclara, J.M. Monopiles in Offshore Wind: Preliminary Estimate of Main Dimensions. Ocean Eng. 2017, 133, 253–261. [Google Scholar] [CrossRef]
  3. Gideon, R.A.; Bou-Zeid, E. Collocating Offshore Wind and Wave Generators to Reduce Power Output Variability: A Multi-Site Analysis. Renew. Energy 2021, 163, 1548–1559. [Google Scholar] [CrossRef]
  4. Yeter, B.; Garbatov, Y.; Guedes Soares, C. Uncertainty Analysis of Soil-Pile Interactions of Monopile Offshore Wind Turbine Support Structures. Appl. Ocean Res. 2019, 82, 74–88. [Google Scholar] [CrossRef]
  5. Plodpradit, P.; Dinh, V.N.; Kim, K. Du Coupled Analysis of Offshore Wind Turbine Jacket Structures with Pile-Soil-Structure Interaction Using FAST v8 and X-SEA. Appl. Sci. 2019, 9, 1633. [Google Scholar] [CrossRef]
  6. AREVA Technical Data the Evolution of the Proven Offshore M5000-135.5000. Available online: http://windturbine.co.kr/homepage/data/file/submenu4_1/622063319_JICPZj5z_AREVAwind_M5000_uk.pdf (accessed on 20 September 2022).
  7. Yeter, B.; Garbatov, Y.; Guedes Soares, C. Fatigue Damage Assessment of Fixed Offshore Wind Turbine Tripod Support Structures. Eng. Struct. 2015, 101, 518–528. [Google Scholar] [CrossRef]
  8. Esteban, M.D.; Couñago, B.; López-Gutiérrez, J.S.; Negro, V.; Vellisco, F. Gravity Based Support Structures for Offshore Wind Turbine Generators: Review of the Installation Process. Ocean Eng. 2015, 110, 281–291. [Google Scholar] [CrossRef]
  9. Wu, X.; Hu, Y.; Li, Y.; Yang, J.; Duan, L.; Wang, T.; Adcock, T.; Jiang, Z.; Gao, Z.; Lin, Z.; et al. Foundations of Offshore Wind Turbines: A Review. Renew. Sustain. Energy Rev. 2019, 104, 379–393. [Google Scholar] [CrossRef]
  10. Lee, Y.S.; González, J.A.; Lee, J.H.; Kim, Y.I.; Park, K.C.; Han, S. Structural Topology Optimization of the Transition Piece for an Offshore Wind Turbine with Jacket Foundation. Renew. Energy 2016, 85, 1214–1225. [Google Scholar] [CrossRef]
  11. Cermelli, C.; Roddier, D.; Aubault, A. WindFloat: A Floating Foundation for Offshore Wind Turbines—Part II: Hydrodynamics Analysis. In Proceedings of the Ocean Engineering; Ocean Renewable Energy, Ocean Space Utilization, Parts A and B., ASME, Honolulu, HI, USA, 31 May–5 June 2009; Volume 4, pp. 135–143. [Google Scholar]
  12. Oguz, E.; Clelland, D.; Day, A.H.; Incecik, A.; López, J.A.; Sánchez, G.; Almeria, G.G. Experimental and Numerical Analysis of a TLP Floating Offshore Wind Turbine. Ocean Eng. 2018, 147, 591–605. [Google Scholar] [CrossRef]
  13. Rahman, I.M.M.; Begum, Z.A.; Yahya, S.; Lisar, S.; Motafakkerazad, R.; Cell, A.S.-P. Advances in Renewable Energy and Sustainable Systems; Nova Science Publishers: Hauppauge, NY, USA, 2016; ISBN 6312317269. [Google Scholar]
  14. Castro-Santos, L.; Filgueira-Vizoso, A.; Carral-Couce, L.; Formoso, J.Á.F. Economic Feasibility of Floating Offshore Wind Farms. Energy 2016, 112, 868–882. [Google Scholar] [CrossRef]
  15. Castro-Santos, L.; Filgueira-Vizoso, A.; Lamas-Galdo, I.; Carral-Couce, L. Methodology to Calculate the Installation Costs of Offshore Wind Farms Located in Deep Waters. J. Clean. Prod. 2018, 170, 1124–1135. [Google Scholar] [CrossRef]
  16. Castro-Santos, L.; deCastro, M.; Costoya, X.; Filgueira-Vizoso, A.; Lamas-Galdo, I.; Ribeiro, A.; Dias, J.M.; Gómez-Gesteira, M. Economic Feasibility of Floating Offshore Wind Farms Considering Near Future Wind Resources: Case Study of Iberian Coast and Bay of Biscay. Int. J. Environ. Res. Public Health 2021, 18, 2553. [Google Scholar] [CrossRef]
  17. Kikuchi, Y.; Ishihara, T. Upscaling and Levelized Cost of Energy for Offshore Wind Turbines Supported by Semi-Submersible Floating Platforms. J. Phys. Conf. Ser. 2019, 1356, 012033. [Google Scholar] [CrossRef]
  18. Castro-Santos, L.; Filgueira-Vizoso, A.; Piegari, L. Calculation of the Levelized Cost of Energy and the Internal Rate of Return Using GIS: The Case Study of a Floating Wave Energy Farm. In Proceedings of the ICCEP 2019—7th International Conference on Clean Electrical Power: Renewable Energy Resources Impact, Otranto, Italy, 2–4 July 2019. [Google Scholar]
  19. Castro-Santos, L.; Filgueira-Vizoso, A.; Lamas-Galdo, I.; Álvarez-Feal, C.; Carral-Couce, L. Influence of the Discount Rate in the Economic Analysis of a Floating Offshore Wind Farm in the Galician Region of the European Atlantic Area. In Proceedings of the Volume 10: Ocean Renewable Energy, American Society of Mechanical Engineers, Madrid, Spain, 17–22 June 2018. [Google Scholar]
  20. Cordal-Iglesias, D.; Filgueira-Vizoso, A.; Baita-Saavedra, E.; Graña-López, M.Á.; Castro-Santos, L. Framework for Development of an Economic Analysis Tool for Floating Concrete Offshore Wind Platforms. J. Mar. Sci. Eng. 2020, 8, 958. [Google Scholar] [CrossRef]
  21. Ueckerdt, F.; Hirth, L.; Luderer, G.; Edenhofer, O. System LCOE: What Are the Costs of Variable Renewables? Energy 2013, 63, 61–75. [Google Scholar] [CrossRef]
  22. Johnston, B.; Foley, A.; Doran, J.; Littler, T. Levelised Cost of Energy, A Challenge for Offshore Wind. Renew. Energy 2020, 160, 876–885. [Google Scholar] [CrossRef]
  23. Pawel, I. The Cost of Storage—How to Calculate the Levelized Cost of Stored Energy (LCOE) and Applications to Renewable Energy Generation. Energy Procedia 2014, 46, 68–77. [Google Scholar] [CrossRef]
  24. Review: Costo Nivelado de La Energía (LCOE): Nuevo Enfoque Para El Análisis de Proyectos de Energía. Available online: https://repositorio.utdt.edu/handle/20.500.13098/11261 (accessed on 1 September 2022).
  25. Uzunoglu, E.; Guedes Soares, C. Hydrodynamic Design of a Free-Float Capable Tension Leg Platform for a 10 MW Wind Turbine. Ocean Eng. 2020, 197, 106888. [Google Scholar] [CrossRef]
  26. Mas-Soler, J.; Uzunoglu, E.; Bulian, G.; Guedes Soares, C.; Souto-Iglesias, A. An Experimental Study on Transporting a Free-Float Capable Tension Leg Platform for a 10 MW Wind Turbine in Waves. Renew. Energy 2021, 179, 2158–2173. [Google Scholar] [CrossRef]
  27. Robertson, A.N.; Jonkman, J.M.; Goupee, A.J.; Coulling, A.J.; Prowell, I.; Browning, J.; Masciola, M.D.; Molta, P. Summary of Conclusions and Recommendations Drawn from the DeepCWind Scaled Floating Offshore Wind System Test Campaign. In Proceedings of the ASME 2013 32nd International Conference on Ocean, Offshore and Arctic Engineering, American Society of Mechanical Engineers, Nantes, France, 9–14 June 2013; p. V008T09A053. [Google Scholar]
  28. Kibbee, S.; Chianis, J.; Davies, K.; Sarwono, B. A Mini-Platform for Deepwater—the SeaStar TLP. In Proceedings of the 4th Offshore Symposium on Tension Leg Platform Technology, Houston, TX, USA, 24–25 February 1995; The Society of Naval Architects and Marine Engineers: Houston, TX, USA, 1995. [Google Scholar]
  29. Sclavounos, P.D.; Tracy, C.; Lee, S. Floating Offshore Wind Turbines: Responses in a Seastate, Pareto Optimal Designs and Economic Assessment. In Proceedings of the 27th International Conference on Offshore Mechanics and Arctic Engineering, Estoril, Portugal, 15–20 June 2007; pp. 1–20. [Google Scholar] [CrossRef] [Green Version]
  30. Souza, R.D.; Aggarwal, R. The Tension Leg Platform Technology—Historical and Recent Developments. In Proceedings of the Offshore Technology Conference, Rio de Janeiro, Brasil, 29–31 October 2013; pp. 1–18. [Google Scholar]
  31. Roddier, D.; Cermelli, C.; Aubault, A.; Weinstein, A. WindFloat: A Floating Foundation for Offshore Wind Turbines. J. Renew. Sustain. Energy 2010, 2, 033104. [Google Scholar] [CrossRef]
  32. Lee, J.Y.; Koo, B.J.; Samsung Heavy Industries Co. Ltd; Clauss, G.; Berlin, T.U. Automated Design of a Tension Leg Platform with Minimized Tendon Fatigue Damage and Its Verification by a Fully Coupled Analysis. Ship Technol. Res. 2007, 54, 11–27. [Google Scholar] [CrossRef]
  33. Yatish, T.S. Modular Wind Energy Systems. In Modular Systems for Energy and Fuel Recovery and Conversion; CRC Press Taylor & Francis Group: Boca Raton, FL, USA, 2019; pp. 371–409. ISBN 978-0-367-23512-3. [Google Scholar]
  34. Zavvar, E.; Chen, B.Q.; Uzunoglu, E.; Guedes Soares, C. Stress Distribution on the CENTEC-TLP in Still Water and Rated Wind Speed. In Trends in Maritime Technology and Engineering; CRC Press: Boca Raton, FL, USA, 2022; pp. 519–527. [Google Scholar]
  35. DNVGL-ST-0119; Floating Wind Turbine Structures. DNV-GL: Bærum, Norway, 2018.
  36. Vittori, F.; Pires, O.; Azcona, J.; Uzunoglu, E.; Guedes Soares, C.; Zamora Rodríguez, R.; Souto-Iglesias, A. Hybrid Scaled Testing of a 10MW TLP Floating Wind Turbine Using the SiL Method to Integrate the Rotor Thrust and Moments. In Developments in Renewable Energies Offshore; Guedes Soares, C., Ed.; Taylor & Francis Group: London, UK, 2021; pp. 417–423. ISBN 9780367681319. [Google Scholar]
  37. Uzunoglu, E.; Soares, C.G. An Integrated Design Approach for a Self-Float Capable Tension Leg Platform for Wind Energy. In Developments in Maritime Technology and Engineering; Guedes Soares, C., Santos, T.A., Eds.; Taylor & Francis Group: London, UK, 2021; pp. 673–682. ISBN 9780367773779. [Google Scholar]
  38. Short, W.; Packey, D.; Holt, T. A Manual for the Economic Evaluation of Energy Efficiency and Renewable Energy Technologies; National Renewable Energy Laboratory: Golden, CO, USA, 1995. [Google Scholar]
  39. Castro-Santos, L.; Martins, E.; Guedes Soares, C. Cost Assessment Methodology for Hybrid Floating Offshore Renewable Energy Platforms. Renew. Energy 2016, 97, 866–880. [Google Scholar] [CrossRef]
  40. Castro-Santos, L.; Silva, D.; Bento, A.R.; Salvação, N.; Guedes Soares, C. Economic Feasibility of Floating Offshore Wind Farms in Portugal. Ocean Eng. 2020, 8, 58. [Google Scholar] [CrossRef]
  41. Castro-Santos, L.; Diaz-Casas, V. Economic Influence of Location in Floating Offshore Wind Farms. Ocean Eng. 2015, 107, 13–22. [Google Scholar] [CrossRef]
  42. Castro-Santos, L.; Bento, A.R.; Silva, D.; Salvação, N.; Guedes Soares, C. Economic Feasibility of Floating Offshore Wind Farms in the North of Spain. J. Mar. Sci. Eng. 2020, 8, 18. [Google Scholar] [CrossRef]
  43. Green, R.; Vasilakos, N. The Economics of Offshore Wind. Energy Policy 2011, 39, 496–502. [Google Scholar] [CrossRef]
  44. Colmenar-Santos, A.; Campíñez-Romero, S.; Pérez-Molina, C.; Mur-Pérez, F. Repowering: An Actual Possibility for Wind Energy in Spain in a New Scenario without Feed-in-Tariffs. Renew. Sustain. Energy Rev. 2015, 41, 319–337. [Google Scholar] [CrossRef]
  45. Salvação, N.; Guedes Soares, C. Wind Resource Assessment Offshore the Atlantic Iberian Coast with the WRF Model. Energy 2018, 145, 276–287. [Google Scholar] [CrossRef]
  46. Salvação, N.; Bernardino, M.; Guedes Soares, C. Assessing Mesoscale Wind Simulations in Different Environments. Comput. Geosci. 2014, 71, 28–36. [Google Scholar] [CrossRef]
  47. Campos, R.M.; Guedes Soares, C. Spatial Distribution of Offshore Wind Statistics on the Coast of Portugal Using Regional Frequency Analysis. Renew. Energy 2018, 123, 806–816. [Google Scholar] [CrossRef]
  48. Campos, R.M.; Guedes Soares, C. Assessment of Three Wind Reanalyses in the North Atlantic Ocean. J. Oper. Oceanogr. 2017, 10, 30–44. [Google Scholar] [CrossRef]
  49. Díaz, H.; Guedes Soares, C. An Integrated GIS Approach for Site Selection of Floating Offshore Wind Farms in the Atlantic Continental European Coastline. Renew. Sustain. Energy Rev. 2020, 134, 110328. [Google Scholar] [CrossRef]
  50. Díaz, H.; Guedes Soares, C. A Multi-Criteria Approach to Evaluate Floating Offshore Wind Farms Siting in the Canary Islands (Spain). Energies 2021, 14, 865. [Google Scholar] [CrossRef]
  51. Diaz, H.; Guedes Soares, C. A Novel Multi-Criteria Decision-Making Model to Evaluate Floating Wind Farm Locations. Renew. Energy 2021, 185, 431–454. [Google Scholar] [CrossRef]
  52. Diaz, H.; Palos Teixeira, A.; Guedes Soares, C. Application of Fuzzy and Monte Carlo Analytic Hierarchy Processes for Ranking Floating Wind Farm Locations. Ocean Eng. 2022, 245, 110453. [Google Scholar] [CrossRef]
  53. Rokicki, T.; Bórawski, P.; Gradziuk, B.; Gradziuk, P.; Mrówczyńska-Kamińska, A.; Kozak, J.; Guzal-Dec, D.J.; Wojtczuk, K. Differentiation and Changes of Household Electricity Prices in EU Countries. Energies 2021, 14, 6894. [Google Scholar] [CrossRef]
  54. Baita-Saavedra, E.; Cordal-Iglesias, D.; Filgueira-Vizoso, A.; Morató, À.; Lamas-Galdo, I.; Álvarez-Feal, C.; Carral, L.; Castro-Santos, L. An Economic Analysis of An Innovative Floating Offshore Wind Platform Built with Concrete: The SATH® Platform. Appl. Sci. 2020, 10, 3678. [Google Scholar] [CrossRef]
  55. Uzunoglu, E.; Guedes Soares, C. Response Dynamics of a Free-Float Capable Tension Leg Platform for a 10 MW Wind Turbine at the Northern Iberian Peninsula. In Developments in Renewable Energies Offshore; Guedes Soares, C., Ed.; Taylor & Francis Group: London, UK, 2021; pp. 408–416. ISBN 9780367681319. [Google Scholar]
  56. Tran, T.T.; Kim, D.H. The Platform Pitching Motion of Floating Offshore Wind Turbine: A Preliminary Unsteady Aerodynamic Analysis. J. Wind Eng. Ind. Aerodyn. 2015, 142, 65–81. [Google Scholar] [CrossRef]
  57. Ioannou, A.; Angus, A.; Brennan, F. Stochastic Prediction of Offshore Wind Farm LCOE through an Integrated Cost Model. Energy Procedia 2017, 107, 383–389. [Google Scholar] [CrossRef]
  58. Bruck, M.; Sandborn, P.; Goudarzi, N. A Levelized Cost of Energy (LCOE) Model for Wind Farms That Include Power Purchase Agreements (PPAs). Renew. Energy 2018, 122, 131–139. [Google Scholar] [CrossRef]
Figure 1. Hull form of CENTEC—TLP.
Jmse 10 01344 g001
Figure 2. Floating wind map in Spain. (1) Some restrictions present in Spanish waters. (2) Floating wind farm proposed. (3) Ribadeo floating wind farm.
Jmse 10 01344 g002
Figure 3. Total cost results. Being C1 (conception and definition cost), C2 (design and development cost), C3 (manufacturing cost), C4 (installation cost), C5 (exploitation cost) and C6 (dismantling cost).
Jmse 10 01344 g003
Figure 4. LCOE results.
Jmse 10 01344 g004
Figure 5. NPV results.
Jmse 10 01344 g005
Figure 6. IRR results.
Jmse 10 01344 g006
Figure 7. DPBP results.
Jmse 10 01344 g007
Table 1. Main variables.
VariableConceptUnits
EPCICEPCIC stands for Engineering, Procurement, Construction, Installation & Commissioning (contract)%
OffshoreSiteROffshore site renting
NplatformsNumber of floating platformsplatforms
CemetMeteorological structure cost
CsmetMeteorological sensors cost
CsametAuxiliary meteorological systems cost
EvaluationReportCostEvaluation report cost€/MW
TurbinePPower of the wind turbineMW
GeophysicalDailyCostGeophysical campaign cost (bathymetry, sub bottom profiler, garbage, wreck detections, etc.)€/day
GeophysicalDaysDuration of the geophysical campaigndays
GeotechnicalDailyCostGeotechnical campaign cost (CPT: cone penetration tests)€/day
GeotechnicalDaysDuration of the geotechnical campaigndays
CinsuranceInsurances coefficient€/MW
TravellingCostsTravelling costs of the preparation of the project-
StaffNumber of staff of the project enterprisestaff
AverageCostYStaff average cost per year€/year
Years0Number of years until year 0years
OfficeRentingMOffice renting per month€/month
RatioWTGPriceCostsRatio between wind turbine generator price and its costs-
NplatformsNumber of floating platformsplatforms
FEEDDrafting Costs
DetailDesignCostsDetailed design costs
TankTestingInplaceTank testing-inplace cost (based on other similar projects)
TankTestingTransportTank testing-transport cost (based on other similar projects)
PreliminaryWorksYardCostsPreliminary works at yard Costs
OneDrydockCostOne dry dock costs
NdrydocksNumber of drydocksdocks
C3241Renting on harbour area cost for foundations
C3242Renting on harbour area cost for generator
C3243Renting on harbour area cost for office
C3244Renting on wet harbour area cost
PreparingSeabedCostCost of preparing the seabed for one unit
TotalMaterialCostPlatformTotal cost of the materials of the platforms considering scale economy
CraneDrydockConstructionCostYTCrane dry dock construction cost
CraneDrydockSupportCostYTCrane dry dock support cost
HarbourInternalTowingYearsNumber of years neccesary for the harbour internal towingsyears
TugMobDemobCostCost of mob or demob the tug
BollarPullTugDRDaily rate associated with a bollard pull tug (65 tonnes)€/day
NDiversPlatNumber of divers per platformdivers
DiverDailyCostDaily cost associated with one diver€/day
DiverDaysInterventionDays that the diver need for each interventiondays
NAccessesPlatNumber of accesses per platform-
PlatformAccessCostPlatform access cost (1 unit)€/platform
NInternalsTowerNumber of internals per tower-
TowerInternalsCostTower internals cost (1 unit)€/platform
NJTubesPlatNumber of J-tubes per platformj-tubes
JTubeCostJ-tube cost (per unit)€/j-tube
ReductionFactorBallastReduction factor (economy of scale) for the ballast system-
TotalBallastCostPlatTotal Ballast Cost platform
NSetsCommunicationPlatNumber of sets (communication system) per platform-
ReductionFactorCommunicationCost of 1 communication system
CommunicationSystemCost1Reduction factor (economy of scale) for the communication system-
NSetsLightingPlatNumber of sets (lighting system) per platform-
LightingSystemCost1Cost of 1 lighting system
ReductionFactorLightingReduction factor (economy of scale) for the lighting system-
PlatformMonitoringCostPlatform monitoring cost (inclinometer and others) (1 platform)€/platform
StructuralMonitoringCostStructural monitoring cost
C33+ C34Mooring and anchoring manufacturing cost
C351Electric cable manufacturing cost
C352Substation manufacturing cost
C411Cost of installation of turbines at port
C412Cost of the transport of the turbines
C413Cost of installation of turbines offshore
C42Cost of installing the floating TLP platforms
CabargeCost of installing mooring and anchoring of a barge per day€/day
CatugCost of installing mooring and anchoring of a tug per day€/day
CaaMODCost of labour per day for installing mooring and anchoring€/day
CaapumpsanddiversCost of divers€/day
NanchoringNumber of anchorsanchors
TinstbargeTime of installing mooring and anchoringAnchors/day
BurialCableCost1PlatCost associated with the burial cable intertidal area for 1 platform€/platform
HDDCost1PlatCost associated with the HDD horizontal drilling for 1 platform€/platform
DynamicCableInstallationCost1PlatCost associated with the dynamic cable installation for 1 platform€/platform
ExportCableInstallationCostExport cable installation cost
CableMechanicalProtectionCostCable mechanical protection cost
CableBurialIntertidalAreaCostCable burial (intertidal area) cost
InterarrayCableCommissioningCostInterarray cable commissioning cost
ExportCableCommissioningCostExport cable commisioning cost
C51Cost of assurance
C521Data acquisition (SCADA) cost
C522SAP & Maritime coordination costs
C523Meteorological prediction cost
C524Administration cost
C531Turbine maintenance cost
C532Export cable and grid connection maintenance
C533Interarray cable survey and repairs cost
C534Substructure maintenance
NfarmNumber of years of life-cycle of the farmYears
C54yearOnshore logistics costs per year€/year
C551yearWorkboats costs per year€/year
C552yearHelicopter costs per year€/year
C553yearCrane barge service costs per year€/year
C554yearOffshore accommodation (if any) cost€/year
PDturbinePercentage of dismantling turbine and platform-
PDmooringPercentage of dismantling mooring-
PDcablePercentage of dismantling cable-
PDsubstationPercentage of dismantling substation-
Table 2. Main characteristics of the Ribadeo floating wind farm.
ItemValueUnits
Water depth150m/s
Wave conditions2.15m
Marine currents0.51m/s
Distance to local electrical grid18.60km
Distance from coastal
facilities
89.50km
Distance from shore17.61km
Distance from maritime routes1.50km
Distance from protected
areas
10.92km
Area of the territory405km2
Wind farm capacity880MW
Number of 10 MW turbines88-
Table 3. Main variables.
VariableValueUnits
EPCIC0%
OffshoreSiteR100,000
Nplatforms88platforms
Cemet2,338,480
Csmet467,696
Csamet116,924
EvaluationReportCost2500€/MW
TurbineP10MW
GeophysicalDailyCost15,000€/day
GeophysicalDays2days
GeotechnicalDailyCost35,000€/day
GeotechnicalDays3days
Cinsurance33,877.2€/MW
TravellingCosts0.15-
Staff15staff
AverageCostY65,000€/year
Years07years
OfficeRentingM4000€/month
RatioWTGPriceCosts--
Nplatforms88platforms
FEED3,877,520
DetailDesignCosts5,028,000
TankTestingInplace125,000
TankTestingTransport75,000
PreliminaryWorksYardCosts5,000,000
OneDrydockCost3,550,000
Ndrydocks1docks
C324117,104,140.9
C324282,125
C324354,750
C3244862,312.5
PreparingSeabedCost200,000
TotalMaterialCostPlatform312,052,35
CraneDrydockConstructionCostYT2,940,000
CraneDrydockSupportCostYT1,900,000
HarbourInternalTowingYears2years
TugMobDemobCost3000
BollarPullTugDR18,000€/day
NDiversPlat2divers
DiverDailyCost1500€/day
DiverDaysIntervention2days
NAccessesPlat1-
PlatformAccessCost175,000€/platform
NInternalsTower1-
TowerInternalsCost125,000€/platform
NJTubesPlat1j-tubes
JTubeCost40,000€/j-tube
ReductionFactorBallast0.8-
TotalBallastCostPlat0
N_SetsCommunicationPlat1-
ReductionFactorCommunication75,000
CommunicationSystemCost10.8-
NSetsLightingPlat1-
LightingSystemCost120,000
ReductionFactorLighting0.8-
PlatformMonitoringCost20.000€/platform
StructuralMonitoringCost90.000
C33 + C34268,712,67
C35160,901,417
C35215,000.000
C411132,285
C4127,002,858.21
C41314,744,889
C4212,414,616
Cabarge7500€/day
Catug22,502€/day
CaaMOD5656€/day
Caapumpsanddivers0€/day
Nanchoring1056anchors
Tinstbarge3Anchors/day
BurialCableCost1Plat25,000€/platform
HDDCost1Plat0€/platform
DynamicCableInstallationCost1Plat100,000€/platform
ExportCableInstallationCost8,000,000
CableMechanicalProtectionCost80,000
CableBurialIntertidalAreaCost1,000,000
InterarrayCableCommissioningCost100,000
ExportCableCommissioningCost100,000
C5122,618,239
C5216,750,000
C52233,000,000
C5233,575,000
C52419,250,000
C531630,300
C53216,654,000
C53319,250,000
C534115,500,000
Nfarm25Years
C54year1,210,000€/year
C551year5,500,000€/year
C552year4,950,000€/year
C553year17,600,000€/year
C554year33,000,000€/year
PDturbine70%-
PDmooring90%-
PDcable10%-
PDsubstation90%-
Publisher’s Note: MDPI stays neutral with regard to jurisdictional claims in published maps and institutional affiliations.

