Evaluation of Measured Data from Tests of Tested Fuels on a Test Device at Steady State Mode with the LOMBARDINI LDW 502 Test Engine
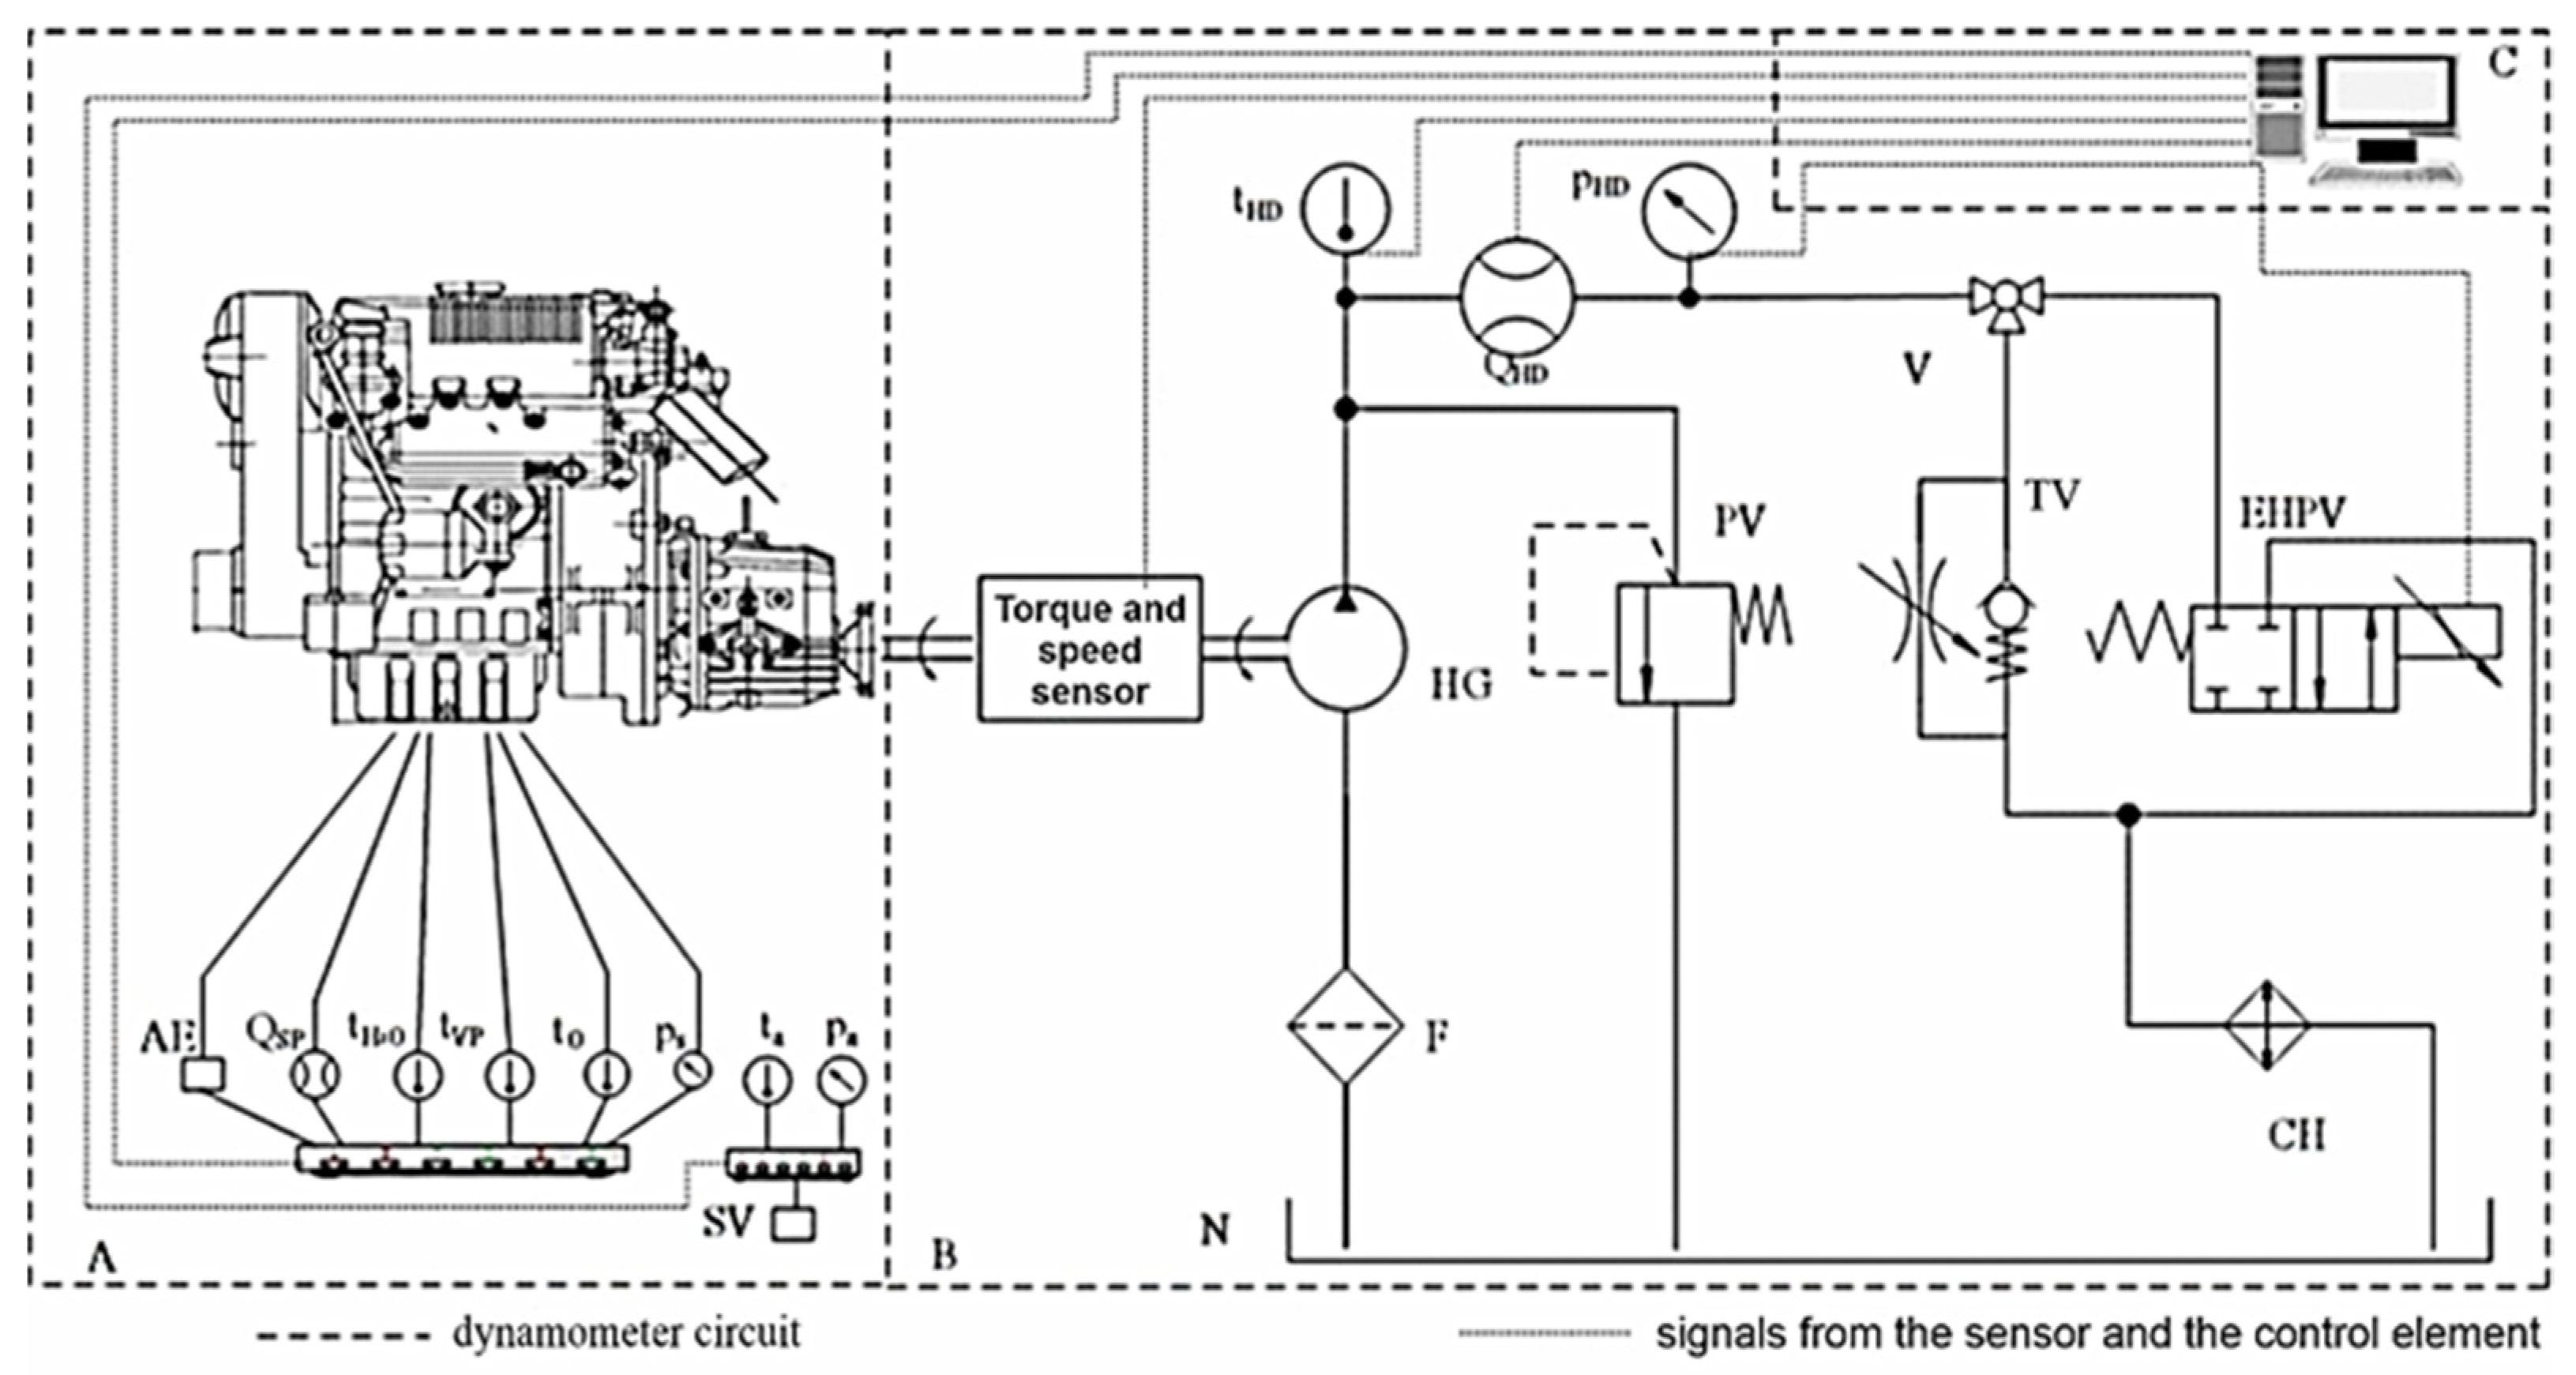
Statistically, the minimum number of measurements was calculated to be three. We performed seven measurements for each tested fuel. The correction factor was calculated according to Formula (1), valid for EGG 80/1269, which is used for non-supercharged engines. If the motor has no engine factor, the parameter is specified according to the engine type, the engine factor is set at 0.3 also in accordance with the manufacturer’s recommendations. The operating conditions for the tests were as follows:
The engine temperature during the measurement ranged from 80 to 92 °C, and the speed range during loading was from 1200 to 3200 min−1. The tests were performed according to ISO 2288, STN 30 0415, and STN ISO 789-1 (30 0411).
Based on the measured data of the tested fuels, the graphical dependences of the compared samples of biofuels with the reference fuel were constructed. The results of the measurements are recorded in graphical form in
Figure 2,
Figure 3,
Figure 4,
Figure 5 and
Figure 6.
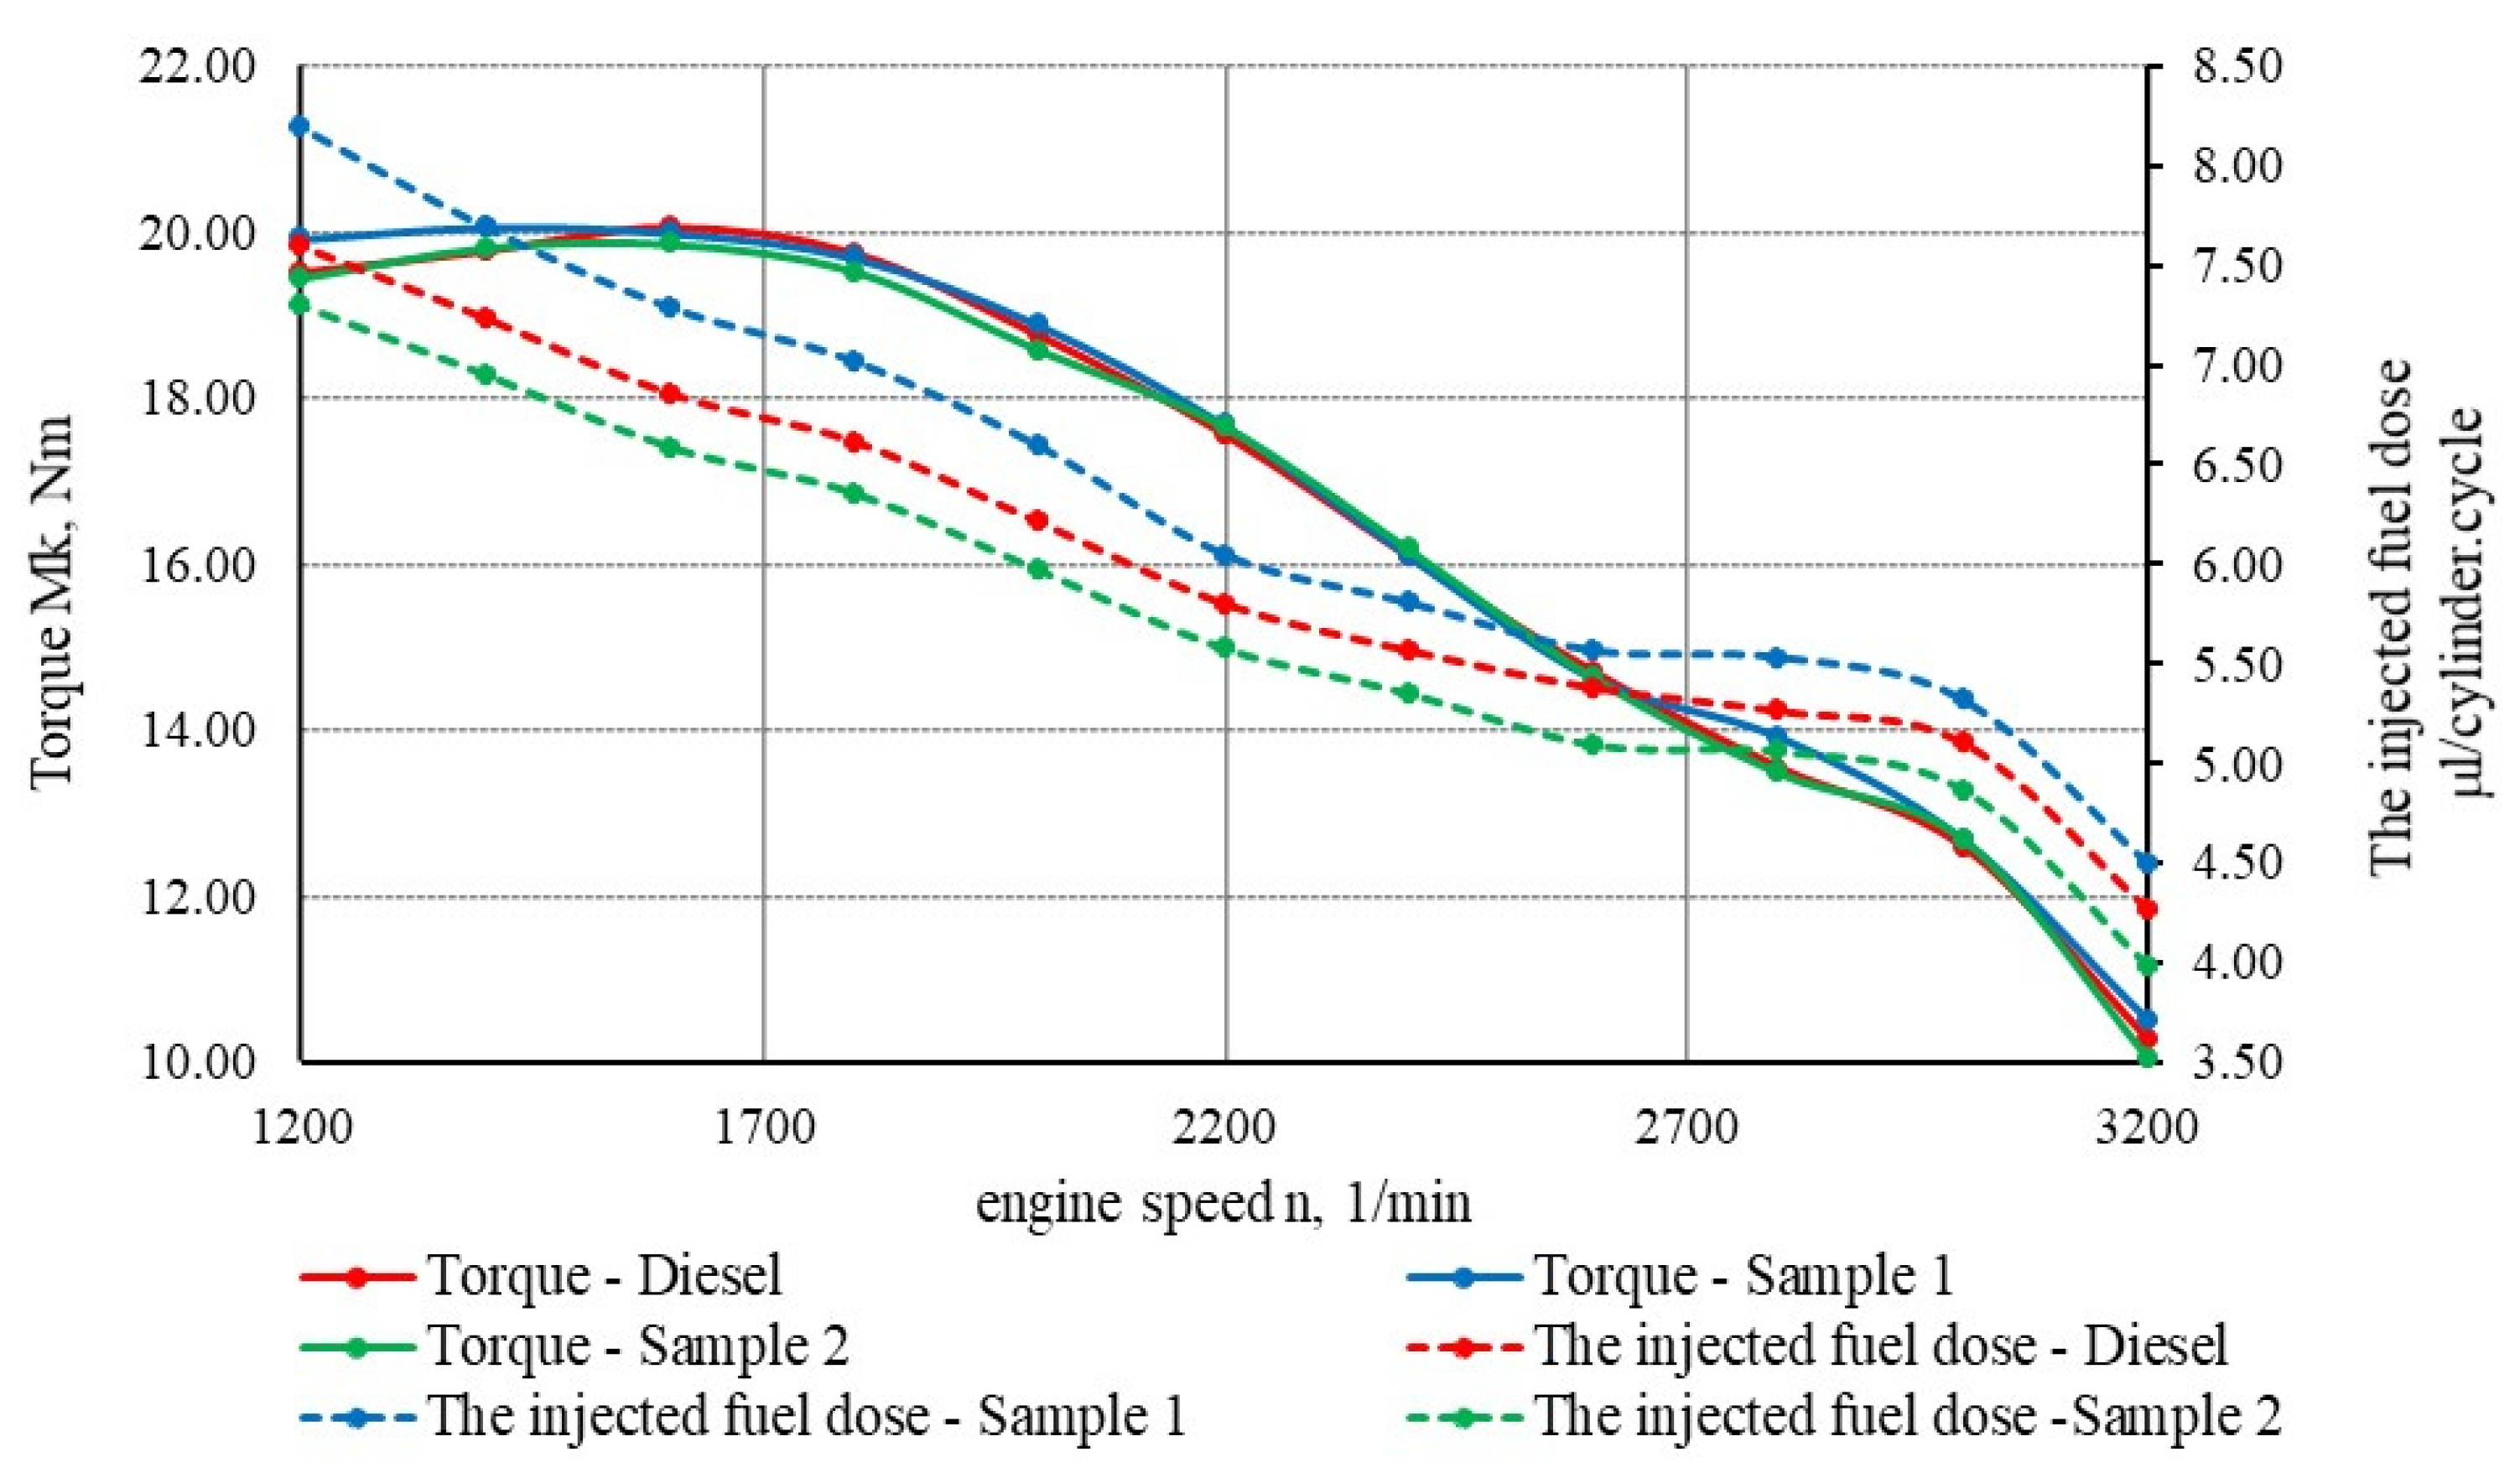
Figure 2 shows the relationship of torque and fuel injection to rpm for diesel fuels SAMPLE 1 and SAMPLE 2. It can be seen from the graphic expression that there are minimal differences between the individual fuels, both during the torque curves and in the achieved torque values. The torque values for SAMPLE 1 fuel were increased by 2.4% at 3200 rpm compared to diesel fuel; however, in the speed range at maximum torque, a decrease of 0.3% was recorded, which is a negligible value. It is worth mentioning the recorded value of torque at the speed of 2800 rpm and the course of the torque curve from the speed of 1600 rpm to the speed of 1200 rpm for the mentioned tested fuel. The increase in torque at 2800 rpm as a linear course of torque in the speed range from 1600 to 1200 rpm is due to the amount of fuel injected per cycle, which is directly proportional to the hourly fuel consumption
Mp and inversely proportional to the engine speed
n and the density of the fuel ρ.
When comparing SAMPLE 2 fuel with the reference diesel fuel (
Figure 2), minimal differences were found during the torque, as well as in the achieved values. The range of torque reduction for SAMPLE 2 fuel is from 0.33 to 2% compared to diesel.
Figure 2.
Comparison of the course of torque and injected fuel dose with tested fuels on the LOMBARDINI LDW 502 engine.
Figure 2.
Comparison of the course of torque and injected fuel dose with tested fuels on the LOMBARDINI LDW 502 engine.
Regarding the comparison of the injected fuel dose per cylinder and cycle (
Figure 2), for SAMPLE1, the value increased from 3% to 7% compared to the reference diesel. In contrast, with SAMPLE 2 fuel, there was a reduction in the fuel injection in the range of 4% to 7% compared to diesel.
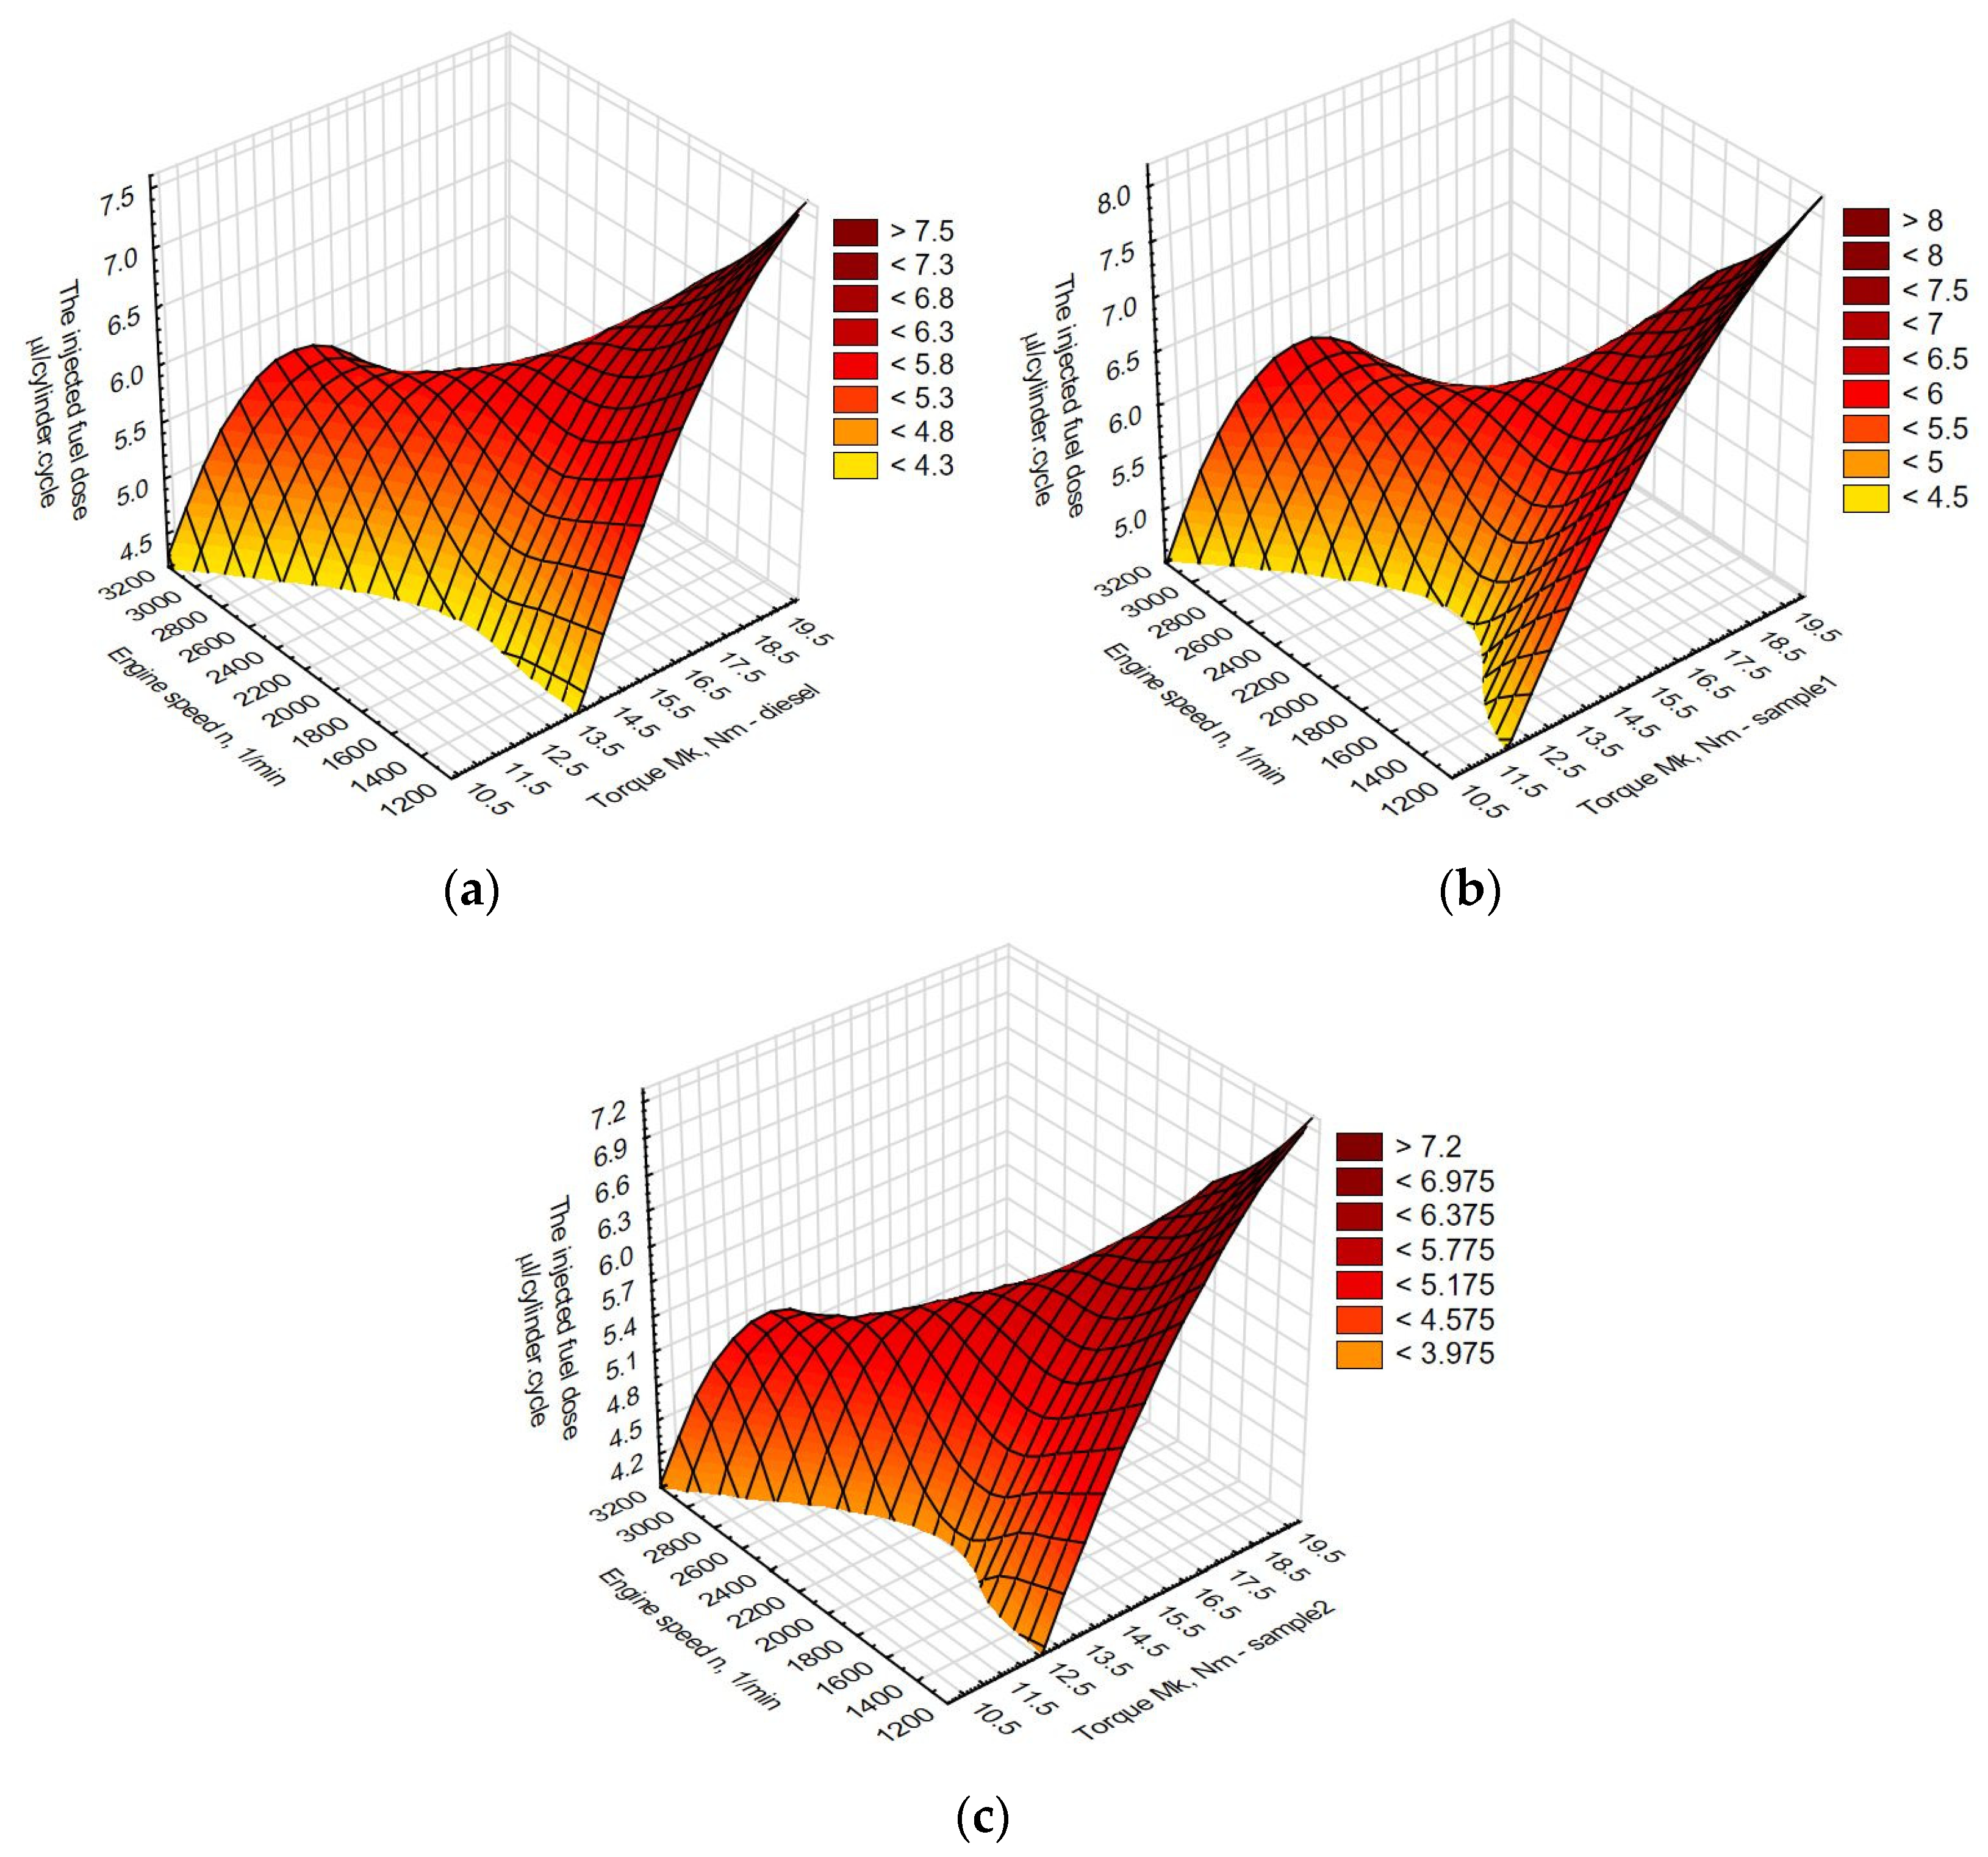
As indicated above, the amount of fuel injected per cylinder and cycle is significantly affected by the bulk density of the fuel. which is also confirmed by the relationship for the calculation of the injected fuel dose (11):
where:
Vv is the fuel injection, μL/cylinder·cycle;
Ρ is the fuel density, kg·dm−3;
Mp is the hourly fuel consumption, kg·h−1.
The interdependencies between the rpm, torque, and injected dose for the tested fuels in a 3D view on the LOMBARDINI LDW 502 engine are shown in
Figure 3.
Figure 3.
Interdependence of rpm, torque, and injection. (a) DIESEL, (b) SAMPLE 1, (c) SAMPLE 2.
Figure 3.
Interdependence of rpm, torque, and injection. (a) DIESEL, (b) SAMPLE 1, (c) SAMPLE 2.
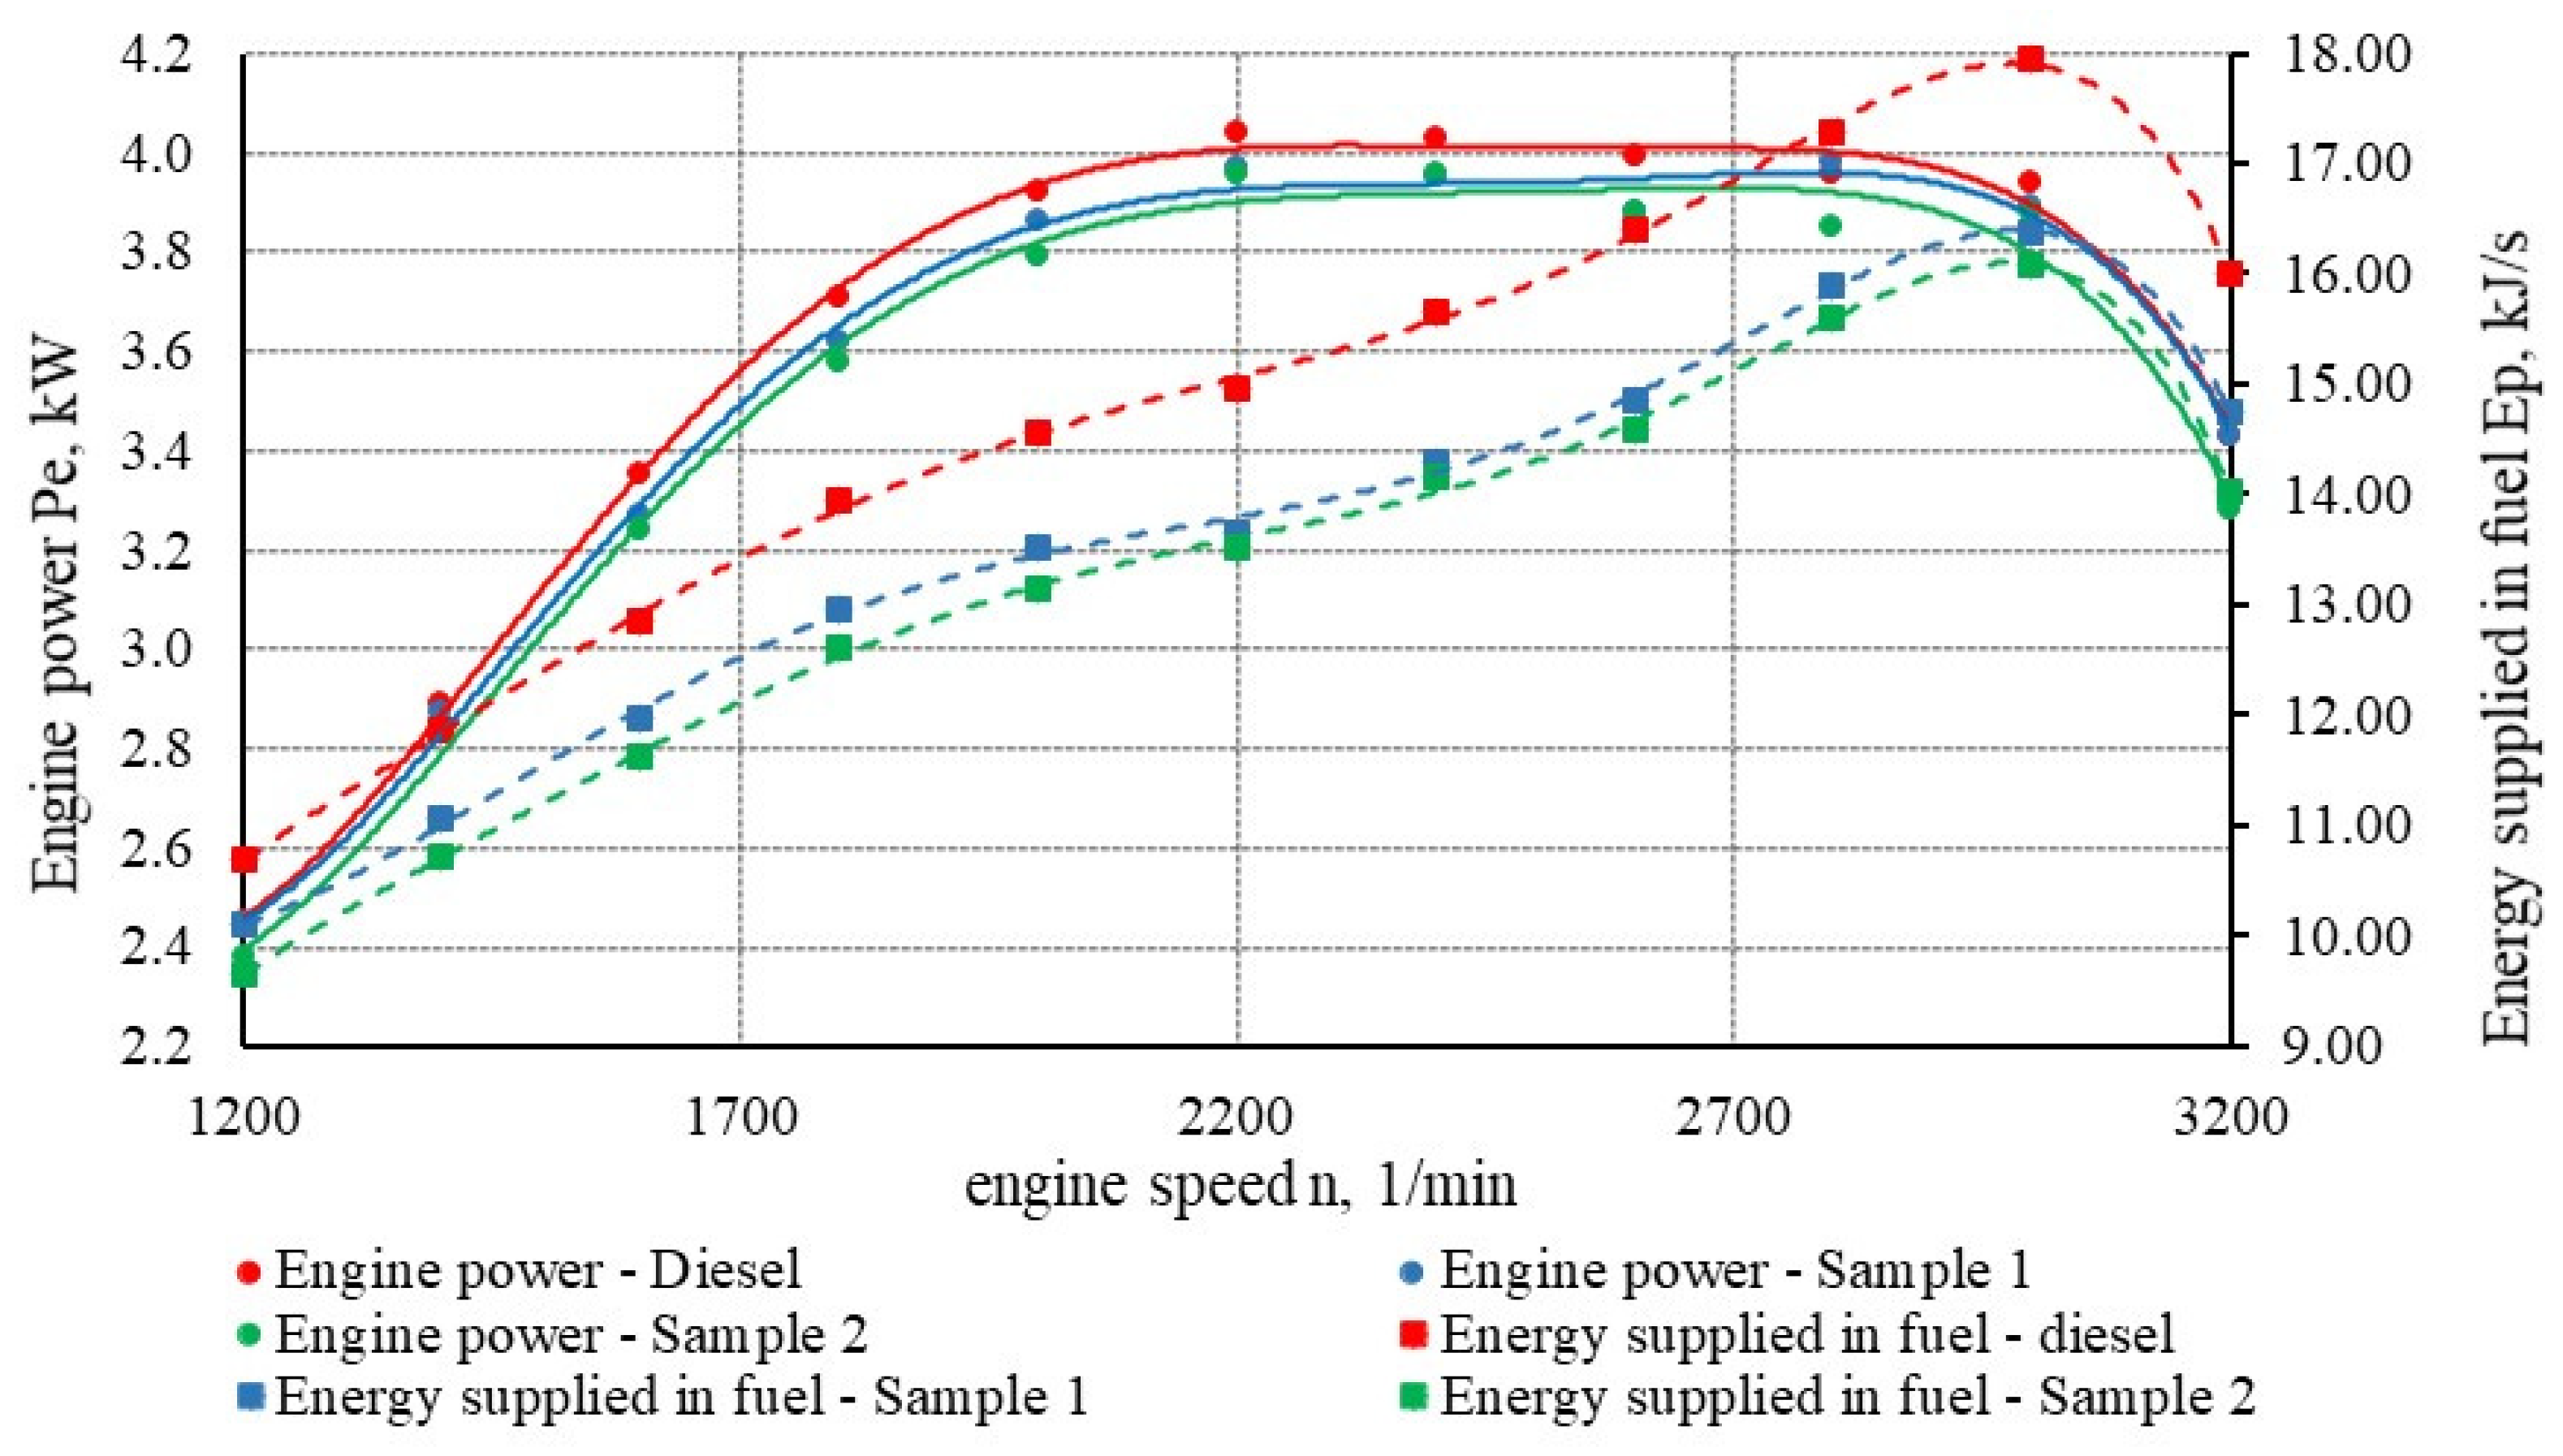
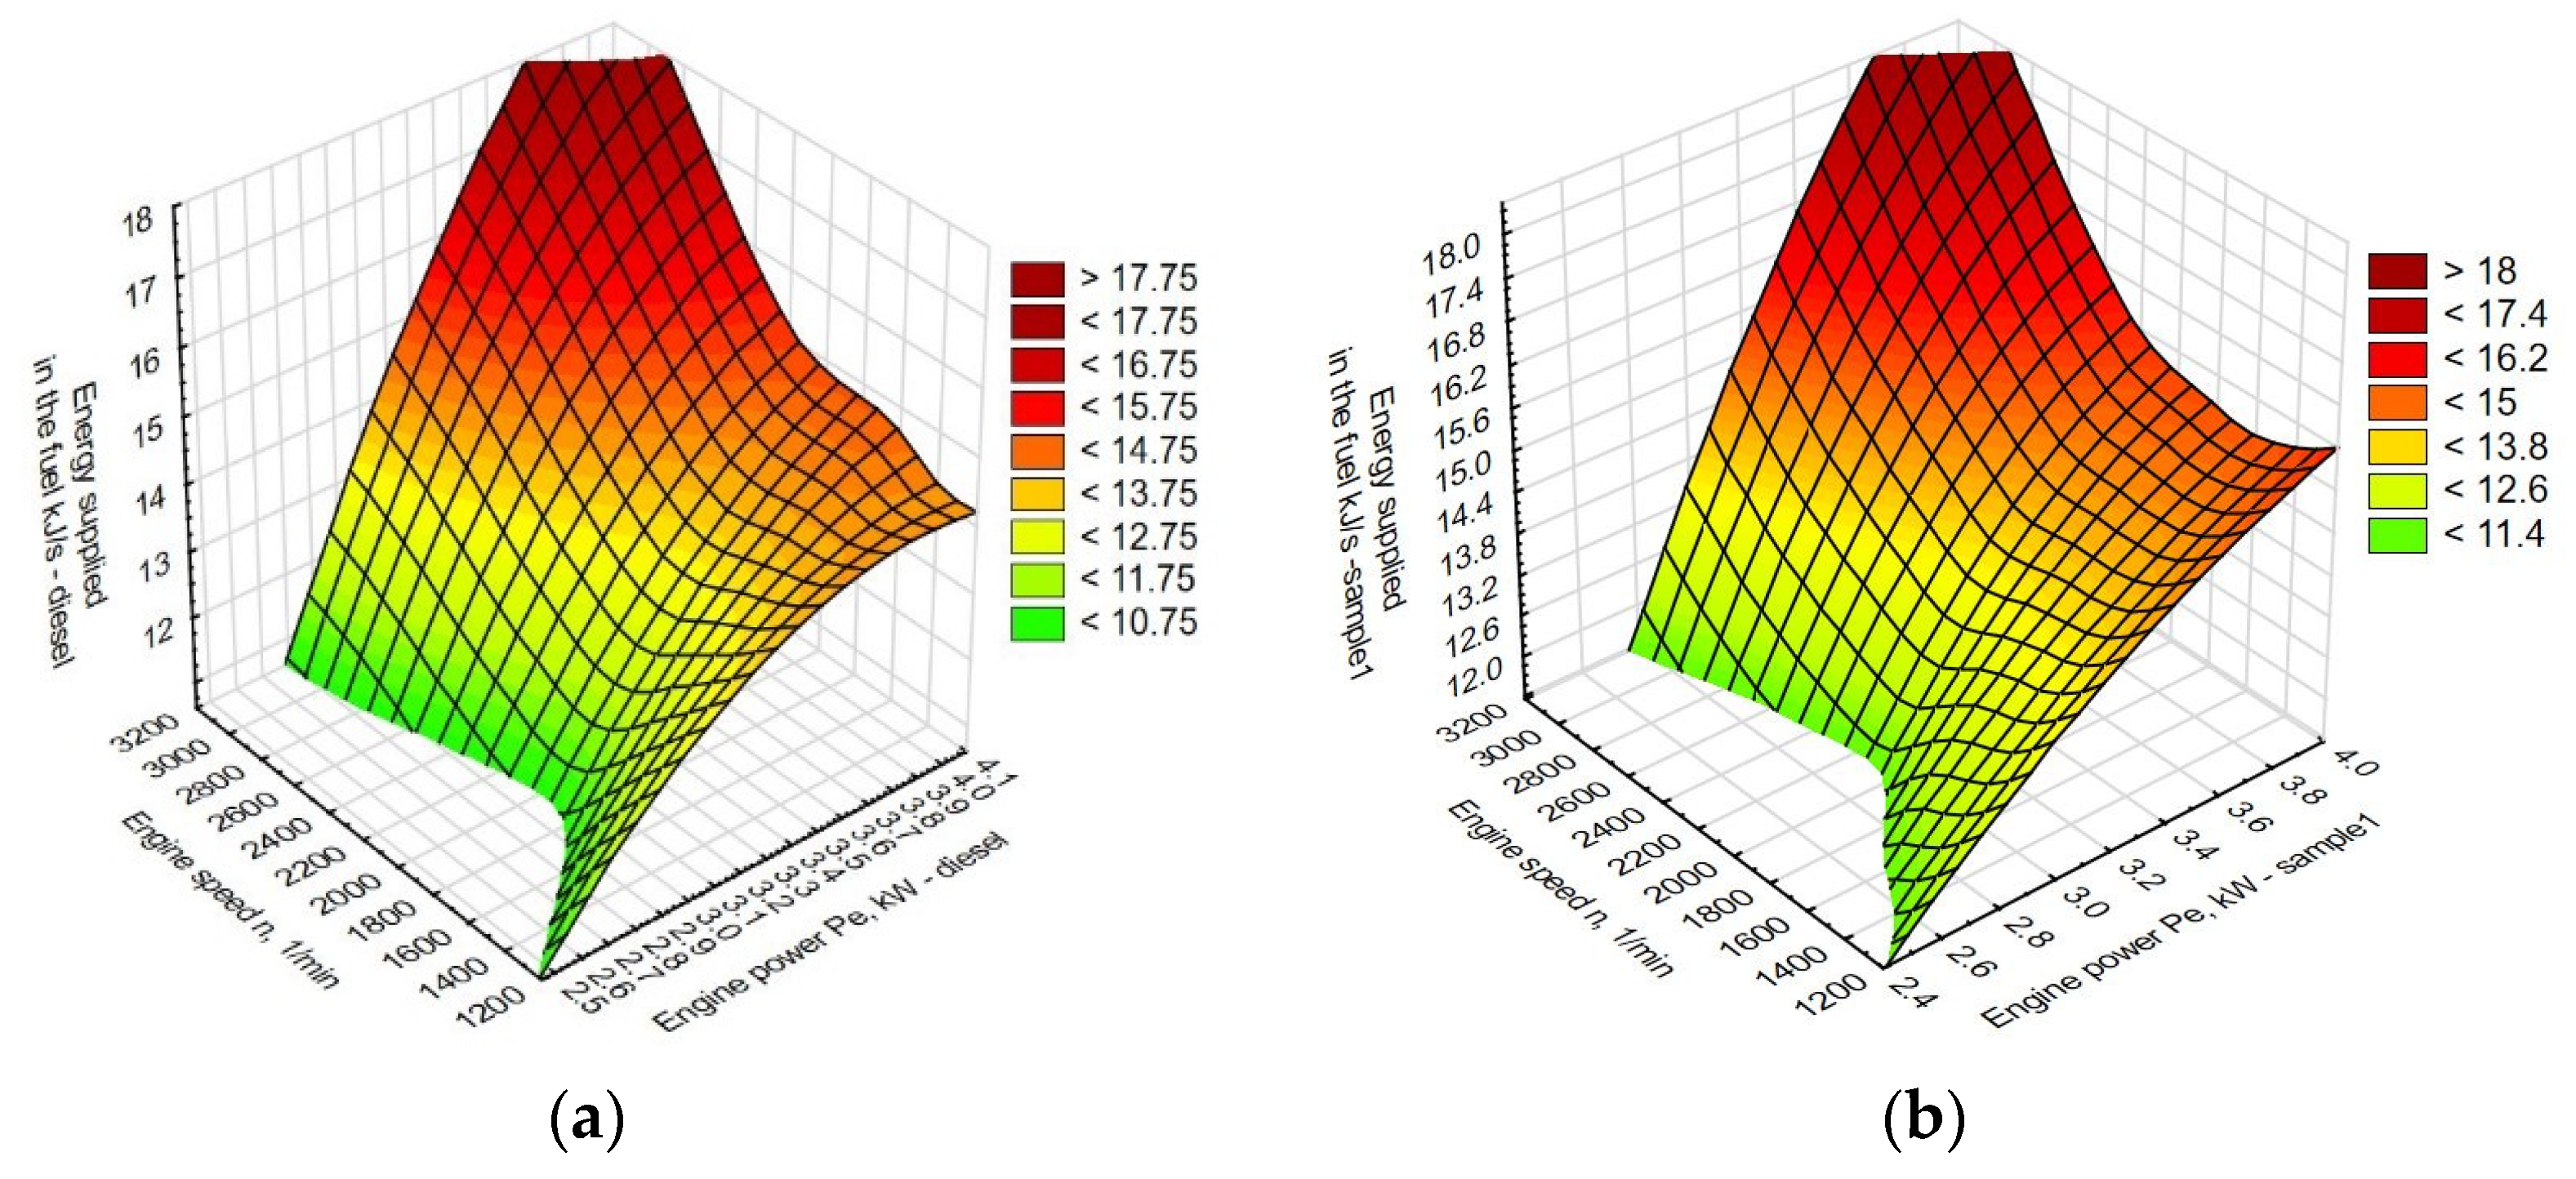
An evaluation of the tested biofuels was also performed on the basis of a mutual comparison of the achieved effective power
Pe and energy supplied in the fuel
Ep. The results of the mutual comparison are shown in graphical form in
Figure 4. From the external speed characteristic of the LOMBARDINI LDW 502 engine (
Figure 4), it can be seen that the effective engine power is constant in the speed range from 2000 to 3000 rpm.
When comparing the achieved power on the LOMBARDINI LDW 502 engine when applying SAMPLE 1 fuel, it can be stated that in the rpm range at which the above-mentioned diesel engine achieves constant values of effective power, there was a decrease in power ranging from 1.76% to 2.84% compared to diesel. In the speed range from 1200 to 2000 rpm, a decrease in power from 0.5% to 2.5% was recorded.
A decrease in effective power was also observed when SAMPLE 2 fuel was applied. In the speed range from 2000 to 3000 rpm, a decrease in effective power in the range from 2% to 3% was recorded. At 3200 rpm, power decreased by approximately 5% and in the speed range from 1200 to 2000 rpm, a decrease in power from 3% to 4% was recorded.
When comparing the energy supplied in the fuel
Ep (
Figure 4), it can be seen that the highest value is reached by the fuel curve–SAMPLE 1. Compared to diesel fuel, the curve of energy supplied in the fuel with the above-mentioned alternative fuel is higher in the range from 2% to 6%. A lower decrease in the compared indicator was recorded for fuel SAMPLE 2. For this fuel, a decrease in the energy supplied in the fuel in the range from 2% to 6% was recorded compared to diesel. The indicator ‘energy supplied in fuel
Ep’ is affected by the hourly fuel consumption and the lower heat value of the fuel, as expressed by the relationship (9).
Figure 4.
Comparison of the course of power and energy delivered in the fuel with the tested fuels on the LOMBARDINI LDW 502 engine.
Figure 4.
Comparison of the course of power and energy delivered in the fuel with the tested fuels on the LOMBARDINI LDW 502 engine.
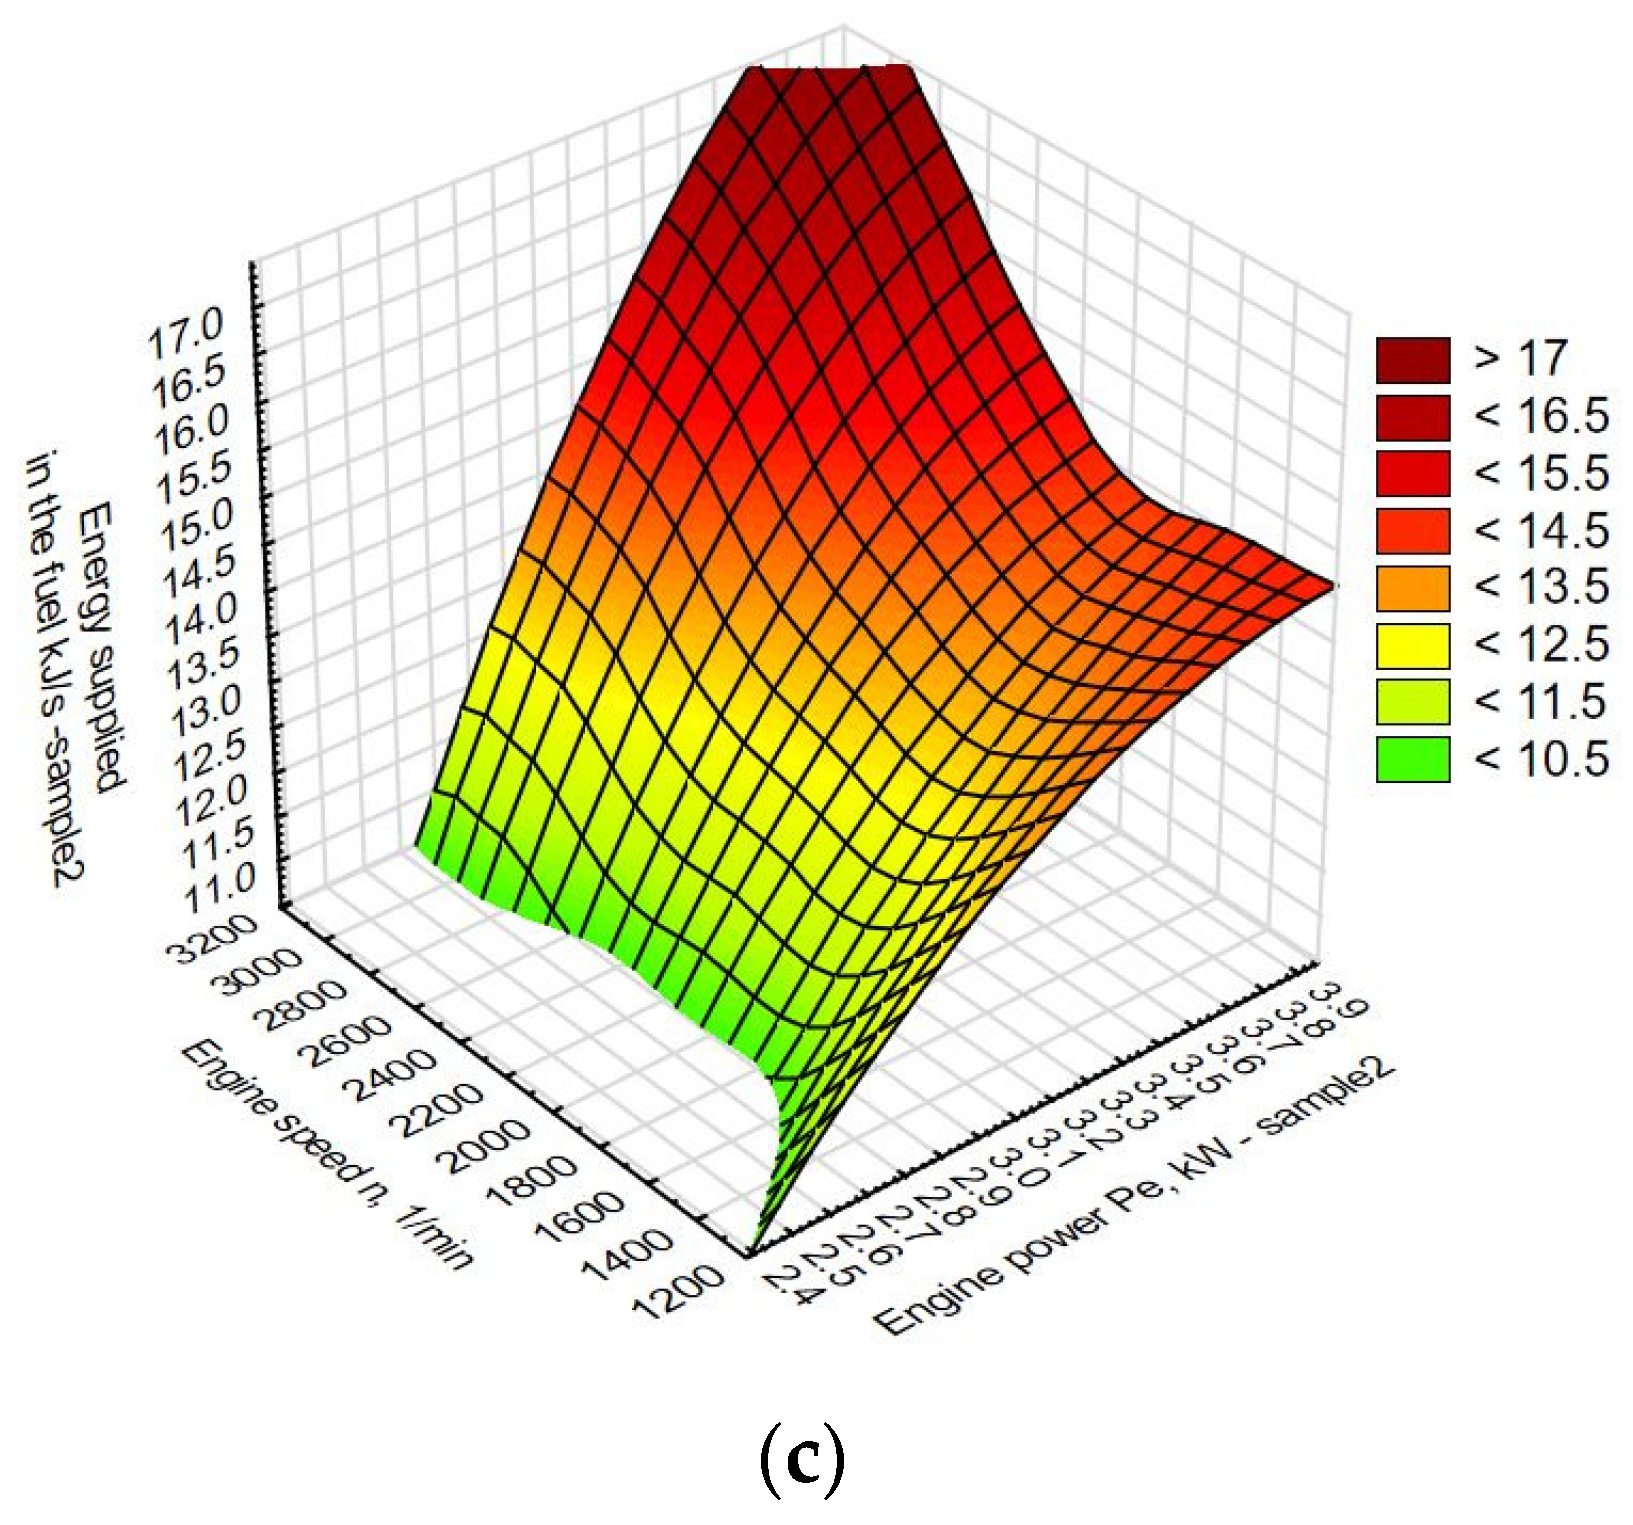
The interdependencies between the rpm, torque, and injected dose in the 3D view for the fuels tested on the LOMBARDINI LDW 502 engine are shown in
Figure 5.
Figure 5.
Interdependence of rpm, power, and energy supplied in the fuel. (a) DIESEL, (b) SAMPLE 1, (c) SAMPLE 2.
Figure 5.
Interdependence of rpm, power, and energy supplied in the fuel. (a) DIESEL, (b) SAMPLE 1, (c) SAMPLE 2.
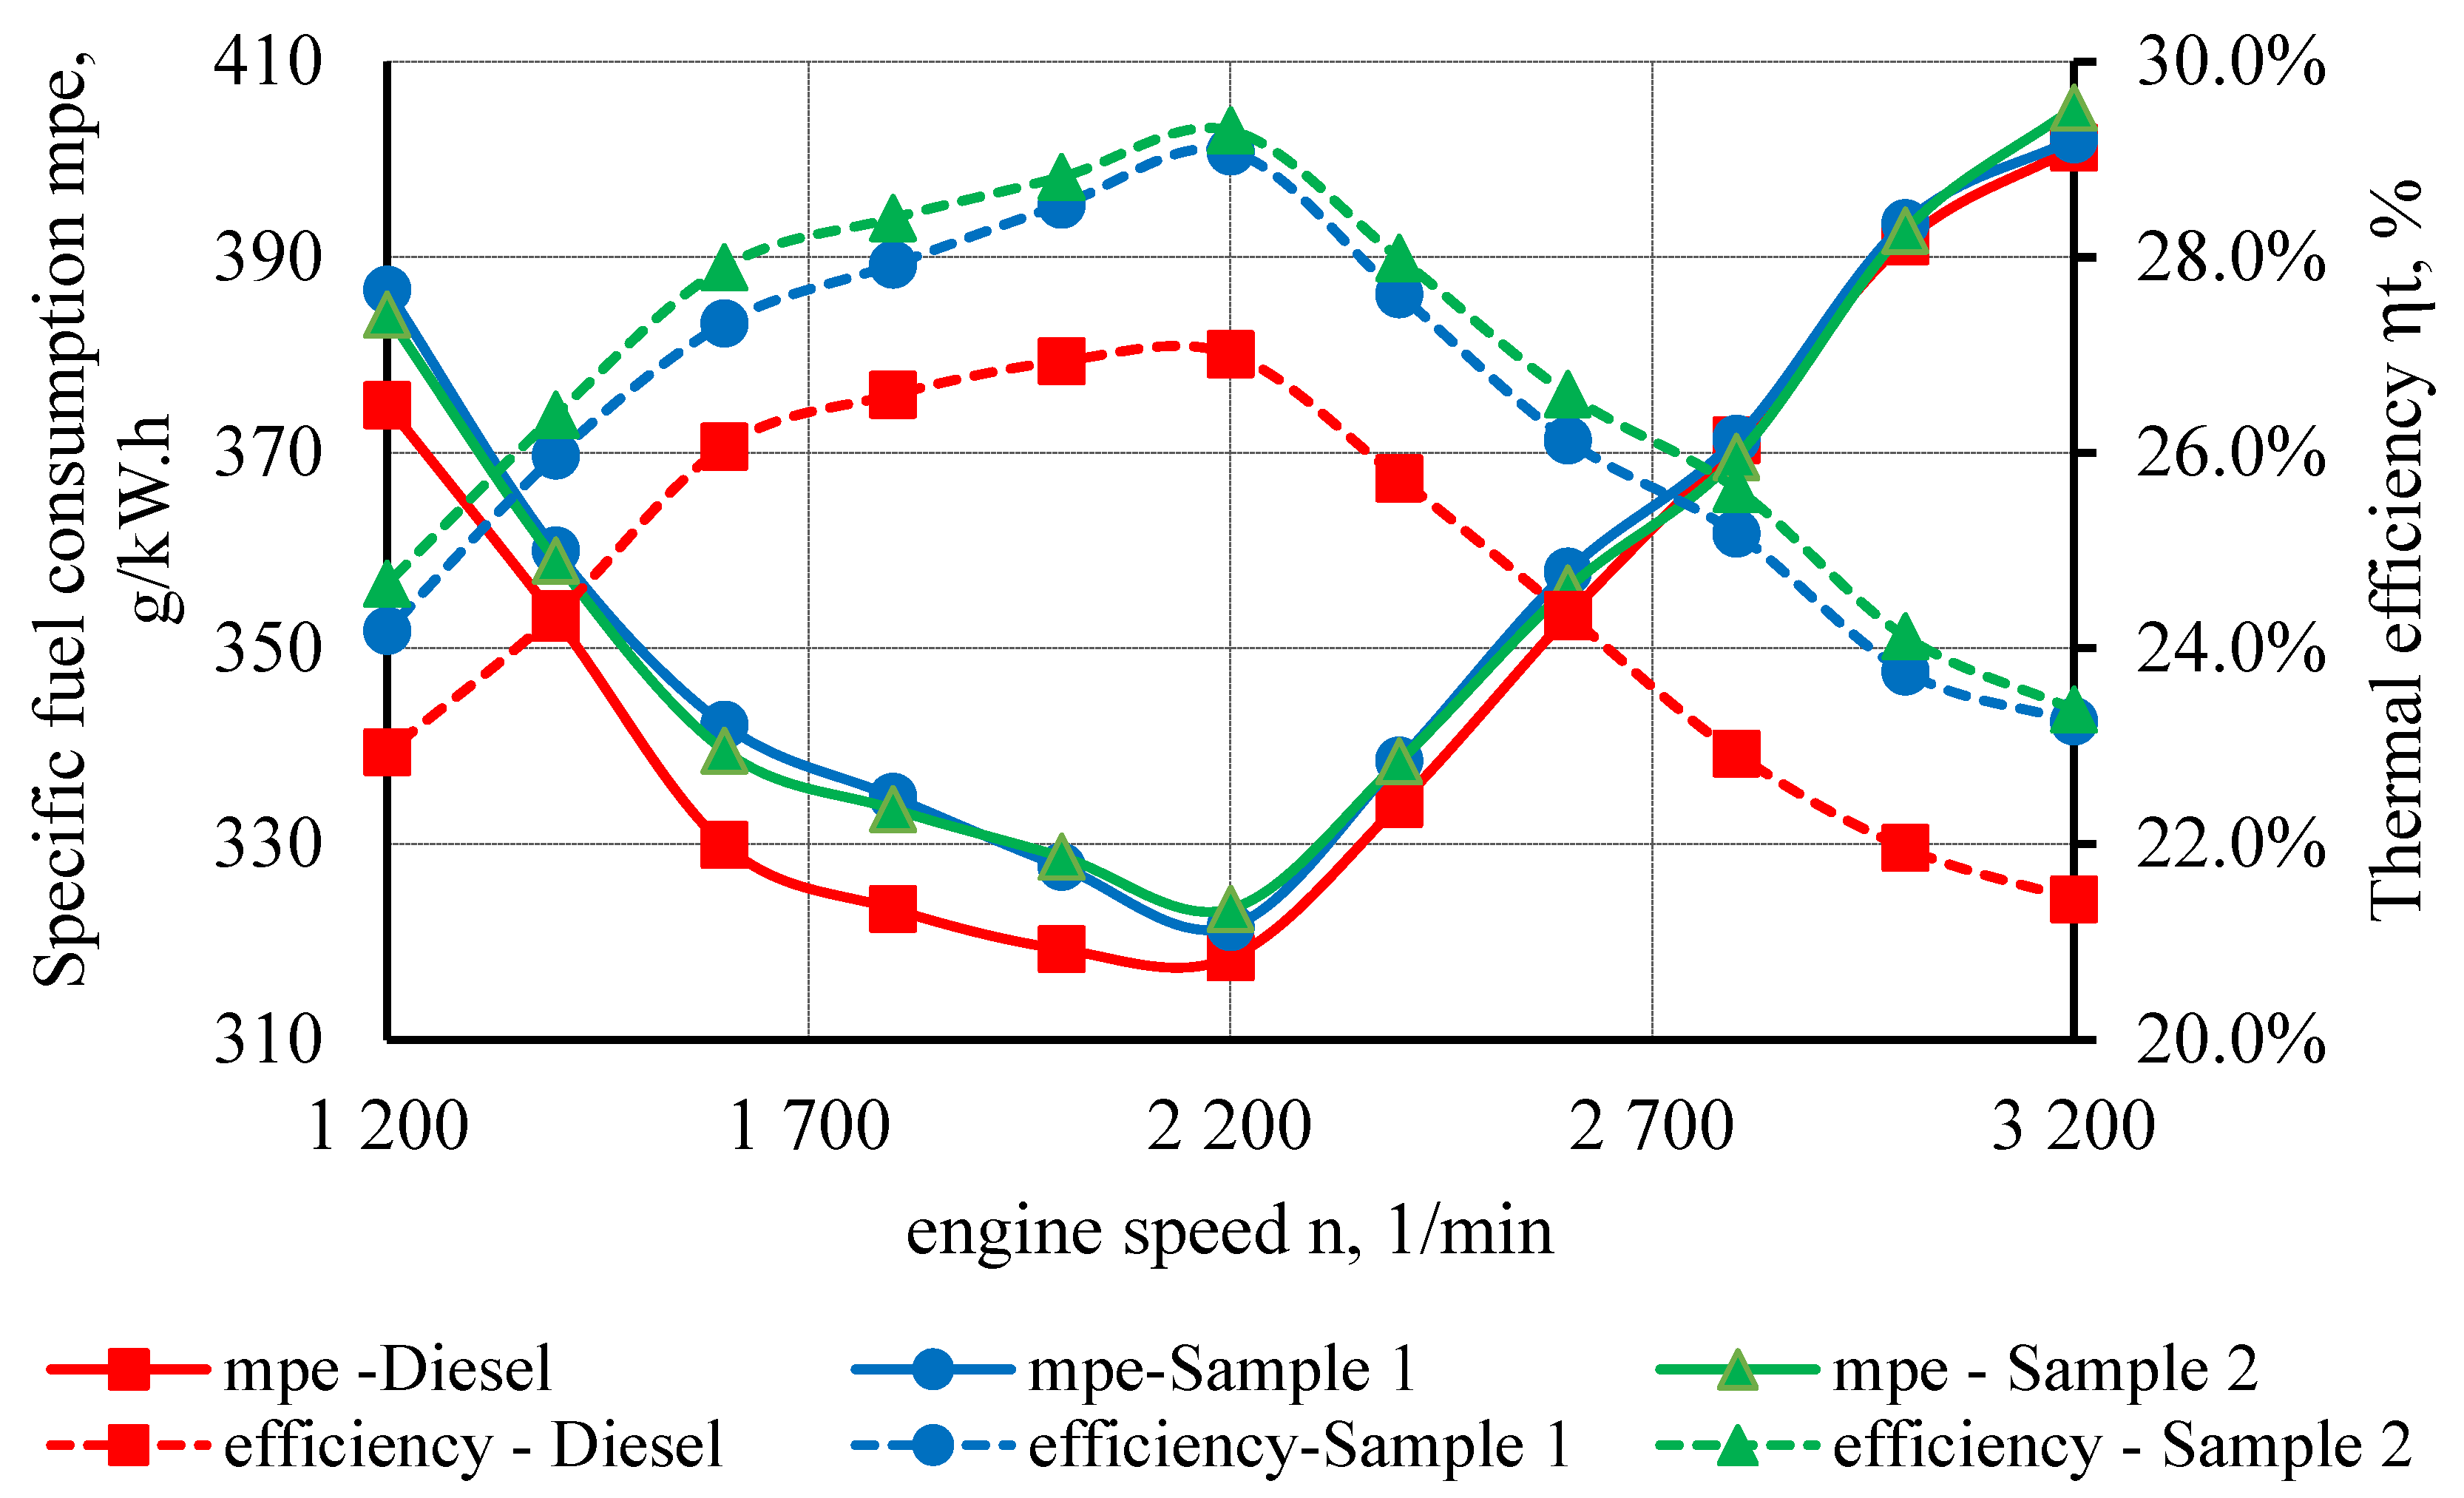
Other indicators that were evaluated from the point of view of biofuel testing are the specific fuel consumption
mpe and the thermal efficiency of the CI engine
ηc (
Figure 6).
The reference diesel fuel reached the lowest value of specific fuel consumption compared to the compared samples of biofuels. In the SAMPLE 1 sample, the value of specific fuel consumption was higher, in the range from 9% to 12%. The highest difference in specific consumption was recorded in the speed range from 1200 to 2000 rpm.
The values of specific consumption with SAMPLE 2 fuel were higher compared to diesel, in the range from 0.7% to 4%. The highest difference in specific consumption was recorded as in the previous case in the speed range from 1200 to 2000 rpm.
When comparing the tested fuels from the point of view of the thermal efficiency of the LOMBARDINI LDW 502 engine, it can be stated that the highest efficiency was achieved by the diesel engine at 2200 rpm at all tested fuels. The results were calculated from the measured values according to Formulae (9) and (10). At the indicated rpm, the combustion engine operates with the lowest specific fuel consumption. The highest thermal efficiency at 2200 rpm was achieved by the combustion engine with diesel fuel. In the SAMPLE 2 fuel tests, a decrease in thermal efficiency of only 1.4% was recorded at 2200 rpm. Compared to diesel, the value of thermal efficiency decreased from 27% to 26.6%.
Figure 6.
Comparison of the course of specific fuel consumption and thermal efficiency with tested fuels on the LOMBARDINI LDW 502 engine.
Figure 6.
Comparison of the course of specific fuel consumption and thermal efficiency with tested fuels on the LOMBARDINI LDW 502 engine.
When SAMPLE 1 was applied, the value of the thermal efficiency compared to diesel was reduced by 5.6% at 2200 rpm.
The course, as well as the size of the thermal efficiency of the diesel engine is given by the ratio of effective power and energy supplied in the fuel, as given by the relation
ηc, which is given in
Section 2.5.
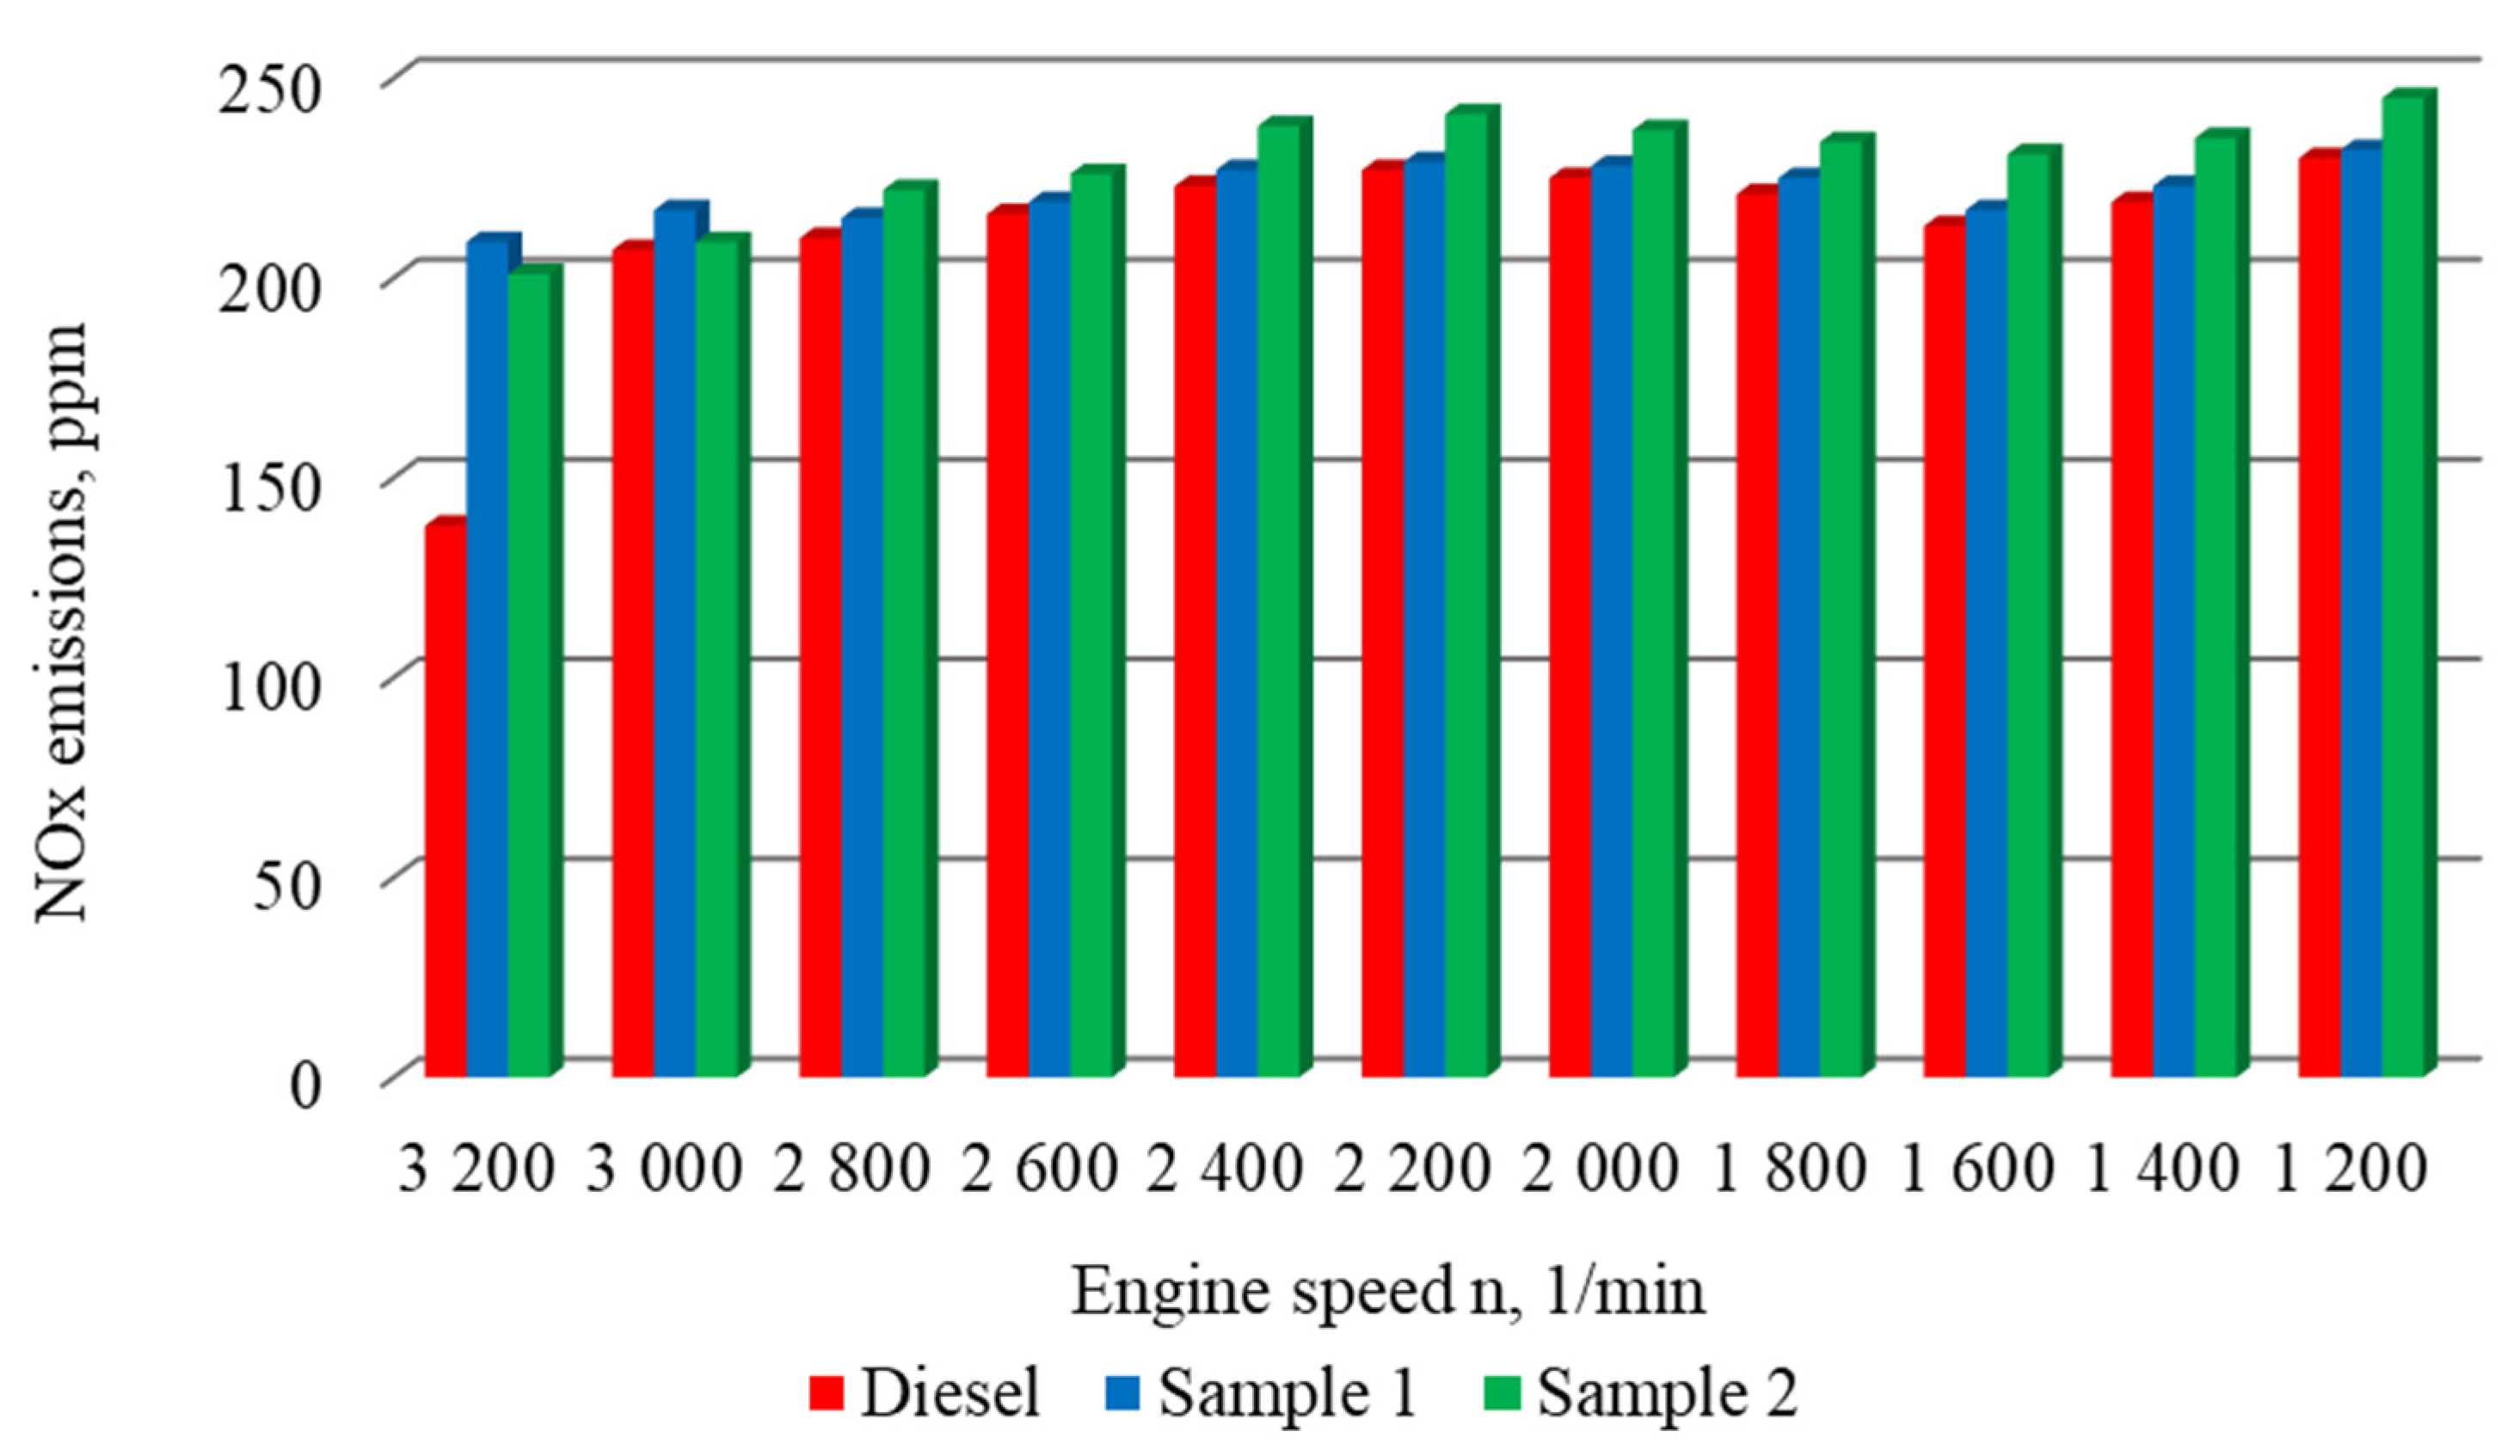
From the measured smoke data, it is clear that the range of the MAHA MDO–2 Lon Euro did not allow measurement of the smoke values for SAMPLE 1 and SAMPLE 2 fuels at individual load points of the diesel engine. For this reason, NO
X emission values were monitored and recorded as the LOMBARDINI LDW 502 diesel engine was gradually loaded. A comparison of the measured NO
X emissions from diesel and two alternative fuels is shown in
Figure 7.
It was not possible to assess the emission state from the point of view of the absorption coefficient on the tested internal combustion engine. The reason was the low values of the absorption coefficient in the tested samples, which the measuring device could not detect.
A situation in which the analyzer is unable to evaluate the absorption coefficient values also occurs in vehicles equipped with after-treatment devices (EURO 5, EURO 6). Due to the impossibility of assessing the emission state of the diesel engine by measuring the absorption coefficient caused by exhaust gas filtration, it was necessary to find another alternative method of assessing the emission state of the diesel engine. This study focused on NOx emissions in accordance with the requirements of the biofuel sample manufacturer. In the future, NOx emissions may be used to assess the emission status of an internal combustion engine together with methods for detecting malfunctioning, damaged, or dismantled exhaust after-treatment devices.
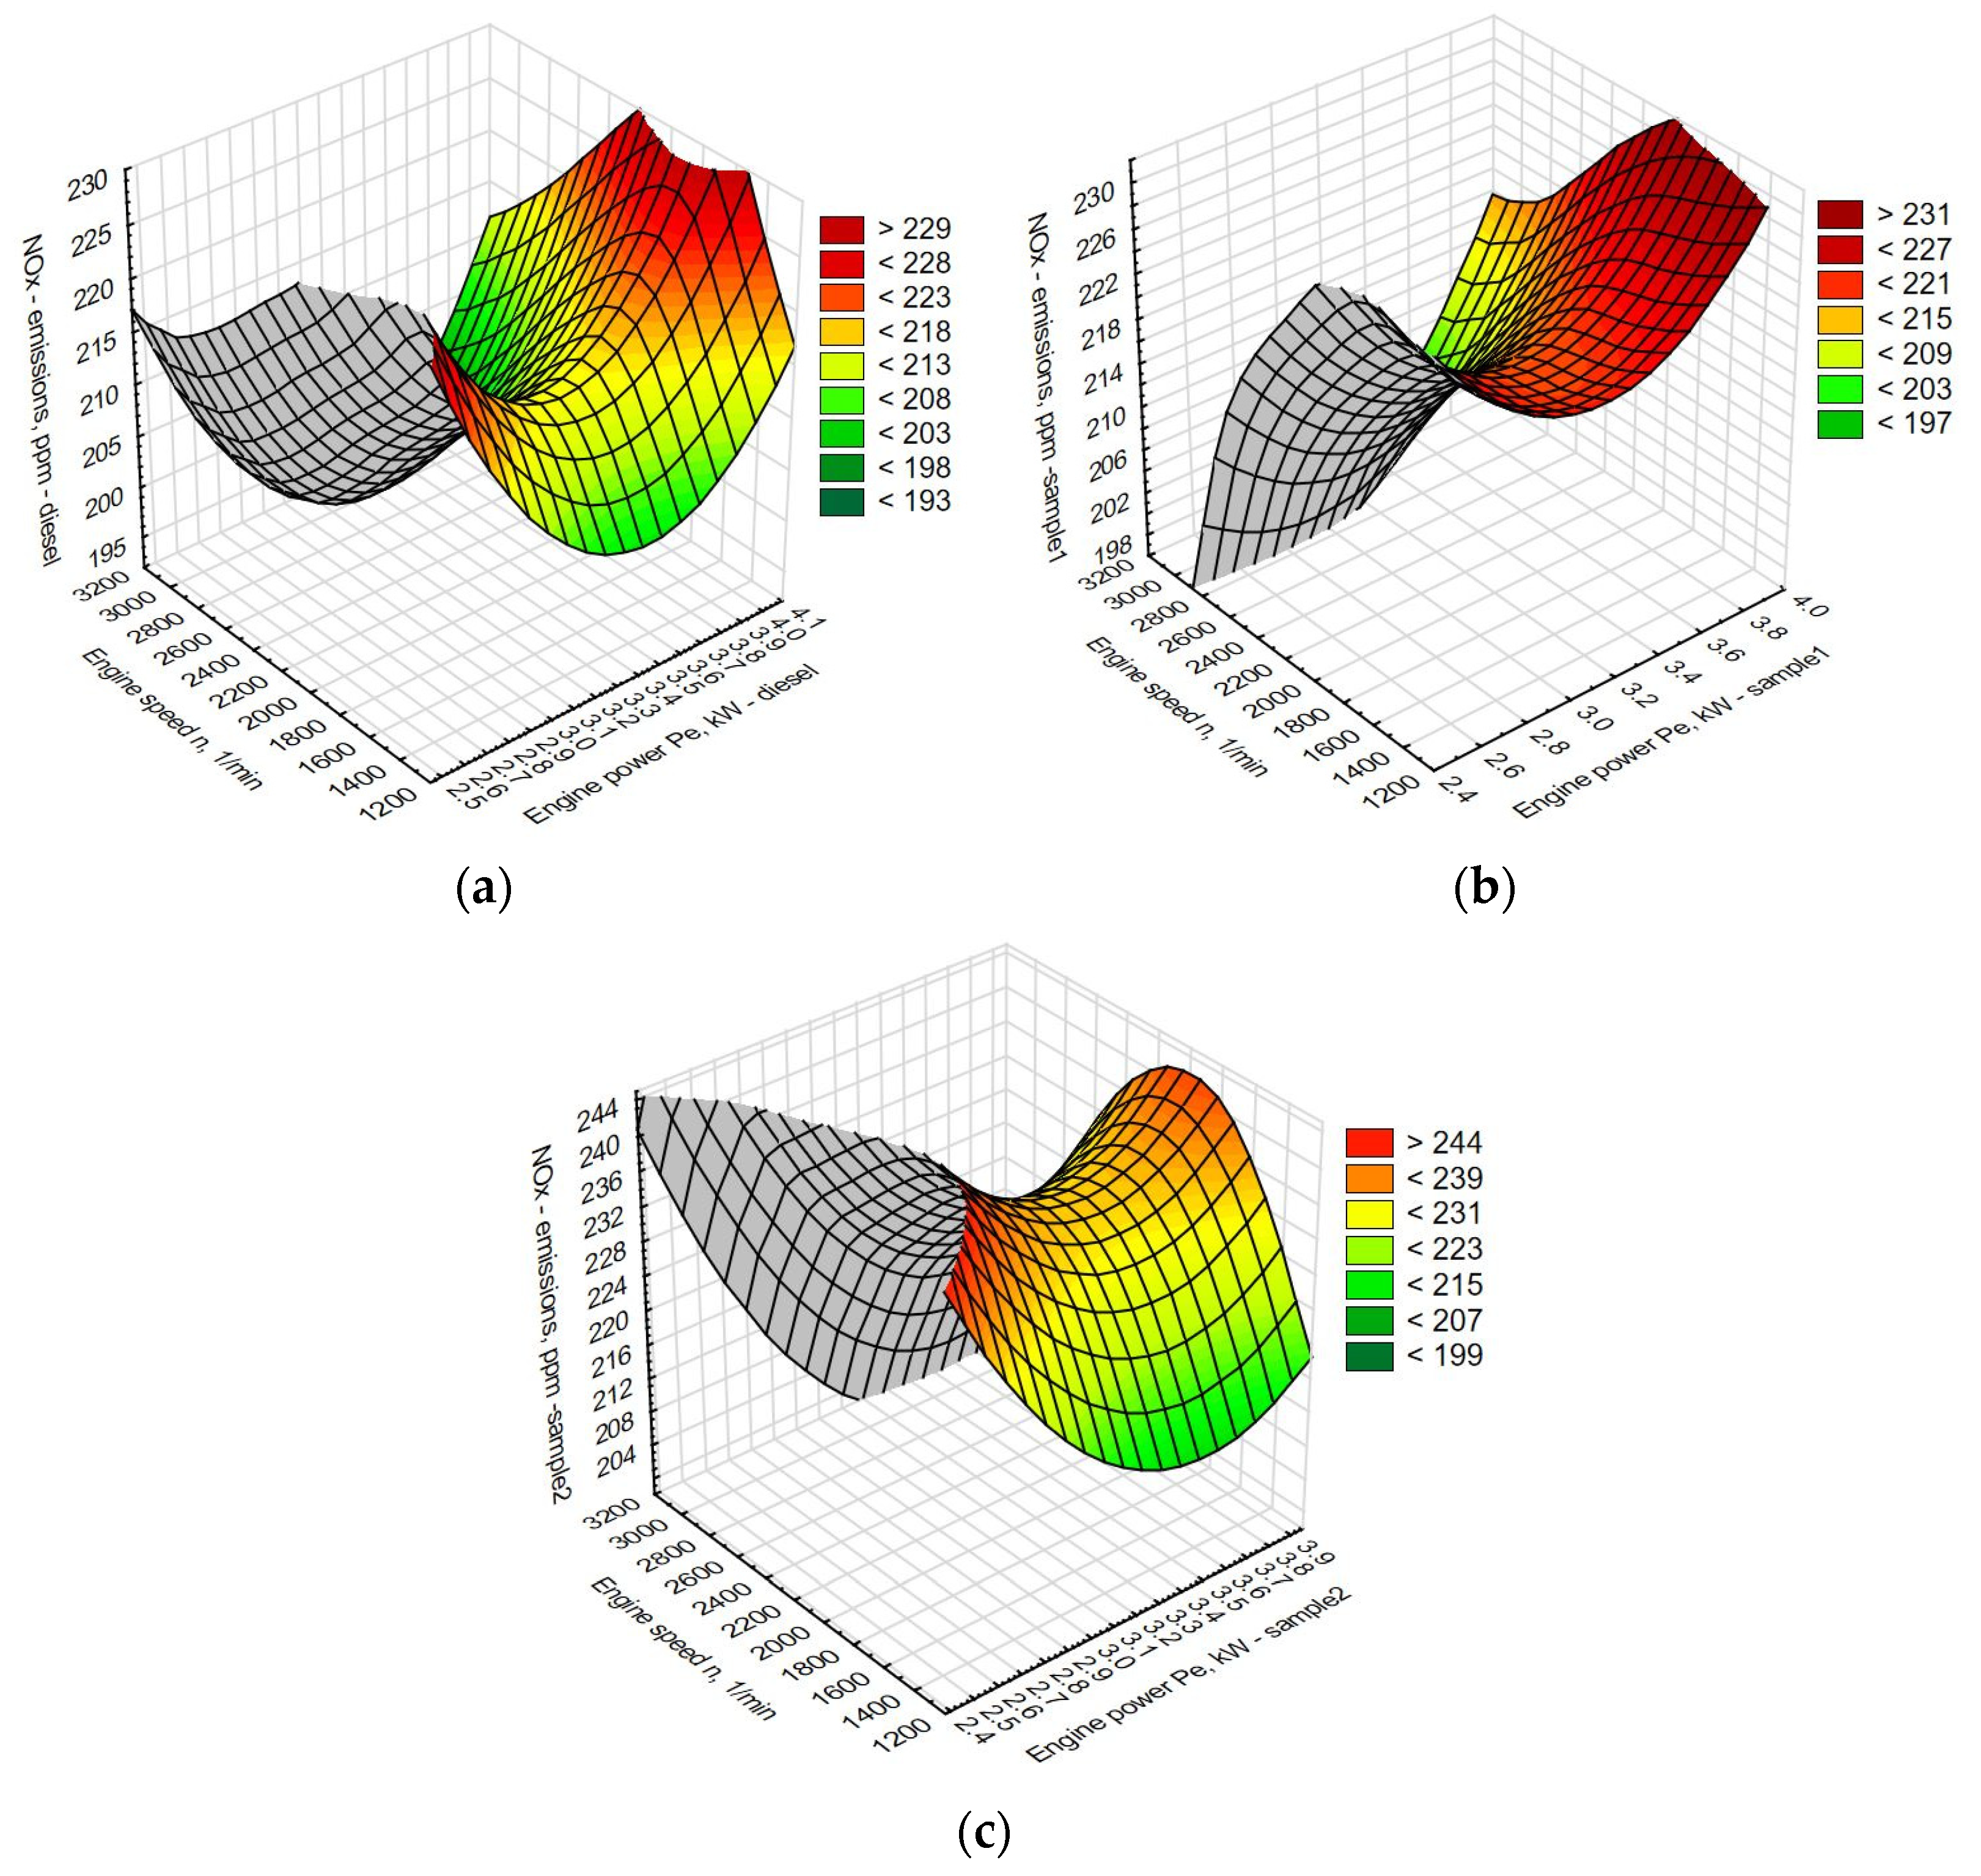
As can be seen from the graphical comparison of the measured emissions of nitrogen oxides NO
X (
Figure 7) under the load of the diesel engine, it can be stated that nitrogen oxides are higher for both tested alternative fuels than for the reference fuel. The average value of nitrogen oxides recorded when loading the LOMBARDINI LDW 502 powered by diesel reached 212 ppm. The measured value is 4.5% lower than the average value of NO
X emissions with the alternative fuel SAMPLE 1 and 7.42% lower than the average NO
X emissions of the alternative fuel SAMPLE 2 (
Figure 8).
Figure 7.
Comparison of NOX emissions with tested fuels on the engine LOMBARDINI LDW 502 under its load.
Figure 7.
Comparison of NOX emissions with tested fuels on the engine LOMBARDINI LDW 502 under its load.
Figure 8.
Interdependence of speed, corrected power, and NOX emissions. (a) DIESEL, (b) SAMPLE 1, (c) SAMPLE 2.
Figure 8.
Interdependence of speed, corrected power, and NOX emissions. (a) DIESEL, (b) SAMPLE 1, (c) SAMPLE 2.


 ,
, 


