Factors Driving Rice Land Change 1989–2018 in the Deli Serdang Regency, Indonesia

Abstract
:1. Introduction
2. Materials and Methods
2.1. Study Area
2.2. Data Preparation and Processing
2.3. Methodology
3. Results and Discussion
3.1. Land Use Change
3.2. Land Suitability Classification for Rice
3.3. Factors Affecting Rice land Change
4. Conclusions
Author Contributions
Funding
Acknowledgments
Conflicts of Interest
References
- Ma, T.; Li, X.; Bai, J.; Ding, S.; Zhou, F.; Cui, B. Four decades’ dynamics of coastal blue carbon storage driven by land use/land cover transformation under natural and anthropogenic processes in the Yellow River Delta, China. Sci. Total Environ. 2019, 655, 741–750. [Google Scholar] [CrossRef] [PubMed]
- Vitali, A.; Urbinati, C.; Weisberg, P.J.; Urza, A.K.; Garbarino, M. Effect of Natural and Anthropogenic Drivers on Land-Cover and Treeline Dynamics in the Apennines (Italy). J. Veg. Sci. 2017, 29, 189–199. [Google Scholar] [CrossRef]
- Hong, N.M.; Chu, H.J.; Lin, Y.P.; Deng, D.P. Effects of land cover changes induced by large physical disturbances on hydrological responses in Central Taiwan. Environ. Monit. Assess. 2010, 166, 503–520. [Google Scholar] [CrossRef] [PubMed]
- Shu, C.; Xie, H.; Jiang, J.; Chen, Q. Is Urban Land Development Drive by Economic Development or Fiskal Revenue Stimuli in China. Land Use Policy 2018, 77, 107–115. [Google Scholar] [CrossRef]
- Jia, Z.; Ma, B.; Zhang, J.; Zeng, W. Simulating Spatial-Temporal Changes of Land-Use Based on Ecological Redline Restrictions and Landscape Driving Factors: A Case Study in Beijing. Sustainability 2018, 10, 1299. [Google Scholar] [CrossRef]
- Meyfroidt, P.; Lambin, E.F.; Erb, K.H.; Hertel, T.W. Globalization of land use: Distant drivers of land change and geographic displacement of land use. Curr. Opin. Environ. Sustain. 2013, 5, 438–444. [Google Scholar] [CrossRef]
- Oduwaye, L. Globalization and Urban Land Use Planning: The Case of Lagos, Nigeria. In Proceedings of the Real Corp 2013, Rome, Italy, 20–23 May 2013; pp. 1193–1200. [Google Scholar]
- Nigro, J.; Thome, K.; Lachir, A.; Zhang, P.; Bounoua, L. Mapping urbanization in the United States from 2001 to 2011. Appl. Geogr. 2018, 90, 123–133. [Google Scholar]
- Vliet, J.V.; Eitelberg, D.A.; Verburg, P.H. A global analysis of land take in cropland areas and production displacement from urbanization. Glob. Environ. Chang. 2017, 43, 107–115. [Google Scholar] [CrossRef]
- Lindarto, D.; Sirojuzilam, S.; Badaruddin, B.; Aulia, D.N. The place character as land use change determinant in Deli Serdang. IOP Conf. Ser. Earth Environ. 2018, 126, 012080. [Google Scholar] [CrossRef] [Green Version]
- Alatas, A. Trend Produksi dan Ekspor Minyak Sawit (CPO) Indonesia. AGRARIS: J. Agribus. Rural Dev. Res. 2015, 1, 114–124. [Google Scholar] [CrossRef] [Green Version]
- Dewanta, A.S.; Arfani, R.N.; Erfita. Elasticity and competitiveness of Indonesia’s palm oil export in India market. Econ. J. Emerg. Mark. 2016, 8, 148–158. [Google Scholar]
- Margono, B.A.; Potapov, P.V.; Turubanova, S.; Stolle, F.; Hansen, M.C. Primary forest cover loss in Indonesia over 2000–2012. Nat. Clim. Chang. 2014, 4, 730–735. [Google Scholar] [CrossRef]
- Firman, T. Major issues in Indonesia’s urban land development. Land Use Policy 2004, 21, 347–355. [Google Scholar] [CrossRef]
- BPS-DeliSerdang. Deli Serdang Regency in Figure 2018; Rilis Grafika: Medan, Indonesia, 2018. [Google Scholar]
- Shrestha, R.P. Land Degradation and Biodiversity Loss in Southeast Asia. In Land Use, Climate Change and Biodiversity Modelling: Perspectives and Applications, 1st ed.; Trisurat, Y., Shrestha, R.P., Alkemade, R., Eds.; Information Science Reference: Hershey, PA, USA, 2011; pp. 303–327. [Google Scholar]
- Trisurat, Y.; Shrestha, R.P.; Alkemade, R. Linkage between biodiversity, land use informatics and climate change. In Land Use, Climate Change and Biodiversity Modeling: Perspectives and Applications, 1st ed.; Trisurat, Y., Shrestha, R.P., Alkemade, R., Eds.; Information Science Reference: Hershey, PA, USA, 2011; pp. 1–22. [Google Scholar]
- Yang, J.; Ji, X.; Deane, D.C.; Wu, L.; Chen, S. Spatiotemporal Distribution and Driving Factors of Forest Biomass Carbon Storage in China: 1977–2013. Forest 2017, 8, 263. [Google Scholar] [CrossRef]
- Wu, W.-B.; Yu, Q.-Y.; Peter, V.H.; You, L.-Z.; Yang, P.; Tang, H.-J. How Could Agricultural Land Systems Contribute to Raise Food Production Under Global Change? J. Integr. Agric. 2014, 13, 1432–1442. [Google Scholar] [CrossRef]
- Nara, P.; Mao, G.; Yen, T. Climate Change Impacts on Agricultural Products in Thailand: A Case Study of Thai Rice at the Chao Phraya River Basin. APCBEE Proc. 2014, 8, 136–140. [Google Scholar] [CrossRef] [Green Version]
- Li, W.-J.; Tang, H.-J.; Qin, Z.-H.; You, F.; Wang, X.-F.; Chen, C.-L.; Ji, J.; Liu, X.-M. Climate Change Impact and Its Contribution Share to Paddy Rice Production in Jiangxi, China. J. Integr. Agric. 2014, 13, 1565–1574. [Google Scholar] [CrossRef]
- Bhatti, S.S.; Tripathi, N.K.; Nitivattananon, V.; Rana, I.A.; Mozumder, C. A multi-scale modeling approach for simulating urbanization in a metropolitan region. Habitat Int. 2015, 50, 354–365. [Google Scholar] [CrossRef] [Green Version]
- Dang, A.N.; Kawasaki, A. Integrating biophysical and socio-economic factors for land-use and land-cover change projection in agricultural economic regions. Ecol. Model. 2017, 344, 29–37. [Google Scholar] [CrossRef]
- Verburg, P.H.; Soepboer, W.; Veldkamp, A.; Limpiada, R.; Espaldon, V. Modeling the Spatial Dynamics of Regional Land Use: The CLUE-S Model. Environ. Manag. 2002, 30, 391–405. [Google Scholar] [CrossRef]
- Carvalho, F.P. Agriculture, pesticides, food security and food safety. Environ. Sci. Policy 2006, 9, 685–692. [Google Scholar] [CrossRef]
- Hewitt, R.; Hernandez-Jimenez, V. Developing Regions, Fragmented Landscapes: The Struggle for Sustainability in Madrid. Sustainability 2010, 2, 1252–1281. [Google Scholar] [CrossRef]
- Ray, D.K.; Mueller, N.D.; West, P.C.; Foley, J.A. Yield Trends Are Insufficient to Double Global Crop Production by 2050. PLoS ONE 2013, 8, e66428. [Google Scholar] [CrossRef] [PubMed]
- Perdinan, P.; Dewi, N.W.S.; Dharma, A. Lesson learnt from Smart Rice Actions in Indonesia. Future Food J. Food Agric. Soc. 2018, 6, 9–20. [Google Scholar]
- Syaukat, Y. The Impact of Climate Change on Food Production and Security and Its Adaptation Programs in Indonesia. Int. Soc. Southeast Asian Agric. Sci. 2011, 17, 40–51. [Google Scholar]
- Ariyanti, D.; Kroeze, C.; Saad, A. Indonesia palm oil production without deforestation and peat conversion by 2050. Sci. Total Environ. 2016, 557–570, 562–570. [Google Scholar] [CrossRef] [PubMed]
- Siagian, D.R.; Marbun, T.; Hermanto, C.; Alcantara, A.J. Landuse Conversion Impact Assessment on Landscape Provisioning Service for Rice Sufficiency in Langkat Regency, Indonesia. Procedia Environ. Sci. 2015, 24, 3–14. [Google Scholar] [CrossRef] [Green Version]
- USGS. 2018. Available online: https://earthexplorer.usgs.gov/ (accessed on 7 June 2018).
- Abburu, S.; Golla, S.B. Satellite Image Classification Methods and Techniques: A Review. Int. J. Comput. Appl. 2015, 119, 20–25. [Google Scholar] [CrossRef]
- Enderle, D.I.M.; Weih, R.C., Jr. Integrating Supervised and Unsupervised Classification Methods to Develop a More Accurate Land Cover Classification. J. Ark. Acad. Sci. 2005, 59, 65–73. [Google Scholar]
- Thakur, N.; Maheshwari, D. A Review of Image Classification Techniques. Int. Res. J. Eng. Technol. 2017, 4, 1588–1591. [Google Scholar]
- Foody, M.G. Status of land cover classification accuracy assessment. Remote Sens. Environ. 2002, 80, 185–201. [Google Scholar] [CrossRef]
- Tilahun, A.; Teferie, B. Accuracy Assessment of Land Use Land Cover Classification using Google Earth. Am. J. Environ. Prot. 2015, 4, 193–198. [Google Scholar] [CrossRef]
- Mahmon, N.A.; Ya’Acob, N.; Yusof, A.L. Differences of image classification techniques for land use and land cover classification. In Proceedings of the 2015 IEEE 11th International Colloquium on Signal Processing and Its Applications (CSPA 2015), Kuala Lumpur, Malaysia, 6–8 March 2015. [Google Scholar]
- Manandhar, R.; Odeh, I.O.A.; Ancev, T. Improving the Accuracy of Land Use and Land Cover Classification of Landsat Data Using Post-Classification Enhancement. Remote Sens. 2009, 1, 330–344. [Google Scholar] [CrossRef] [Green Version]
- Handavu, F.; Chirwa, P.W.C.; Syampungani, S. Socio-economic factors influencing land-use and land-cover changes in the miombo woodlands of the Copperbelt province in Zambia. For. Policy Econ. 2019, 75–94. [Google Scholar] [CrossRef]
- Bachri, S.; Rofi; Sulaeman, Y. SPKL: Program Komputer Untuk Evaluasi Kesesuaian Lahan. In Proceedings of the Prosiding Seminar Informatika Pertanian-Information Technology for Sustainable Agroindustry, Jatinagor, Indonesia, 12–13 November 2015. [Google Scholar]
- Djaenudin, D.; Marwan, H.; Subagjo, H.; Hidayat, A. Petunjuk Teknis Evaluasi Lahan untuk Komoditas Pertanian; BBSDLP: Bogor, Indonesia, 2011; pp. 30–34. [Google Scholar]
- Dhokhikah, Y.; Trihadiningrum, Y.; Sunaryo, S. Community participation in household solid waste reduction in Surabaya, Indonesia. Resour. Conserv. Recycl. 2015, 102, 153–162. [Google Scholar] [CrossRef]
- Othman, M.; Ash’aari, Z.H.; Mohamad, N.D. Long-term Daily Rainfall Pattern Recognition: Application of Principal Component Analysis. Procedia Environ. Sci. 2015, 30, 127–132. [Google Scholar] [CrossRef] [Green Version]
- Zurovec, O.; Cadro, S.; Sitaula, B.K. Quantitative assessment of vulnerability to climate change in rural municipalities of Bosnia and Herzegovina. Sustainability 2017, 9, 1208. [Google Scholar] [CrossRef]
- Pandey, P.P.; Manandhar, S.; Kazama, F. Climate Change Vulnerability Assessment. In Climate Change and Water Resources; Shrestha, S., Babel, M.S., Pandey, V.P., Eds.; CRC Press: Boca Raton, FL, USA, 2014; pp. 183–208. ISBN 978-1-4665-9467-8. [Google Scholar]
- Adam, A.H.M.; Elhag, A.M.H.; Salih, A.M. Accuracy Assessment of Land Use & Land Cover Classificatio (LU/LC) “Case study of Shomadi area-Renk County-Upper Nile State, South Sudan”. Int. J. Sci. Res. Publ. 2013, 3, 1–6. [Google Scholar]
- Suparto, A. Land and water resources development in Indonesia. Available online: http://www.fao.org/docrep/005-/ac623e/ac623e0g.htm. (accessed on 22 August 2018).
- Irawan, B. Konversi lahan sawah: Potensi dampak, pola pemanfaatannya, dan faktor determinan. Forum Penelitian Agro Ekonomi 2005, 23, 1–19. [Google Scholar] [CrossRef]
- Segah, H.; Limin, S.; Hirano, T.; Tani, H.; Kasahara, T. Forest Fire Impact Monitoring in Peat Swamp Area Using Satellite data; Case Study in Central Kalimantan, Indonesia. J. Agric. Meteorol. 2016, 60, 415–420. [Google Scholar] [CrossRef]
- Bathrellos, G.D.; Gaki-Papanastassiou, K.; Skilodimou, H.D.; Skianis, G.A.; Chousianitis, K.G. Assessment of Rural Community and Agricultural Development using Geomorphological-Geological Factors and GIS in Trikala Prefecture (Central Greece). Stoch Environ. Res. Risk Assess. 2013, 27, 573–588. [Google Scholar] [CrossRef]
- El-Khoury, A.; Seidou, O.; Lapen, D.R.; Sunohara, M.; Zhenyang, Q.; Mohammadian, M.; Daneshfar, B. Prediction of land-use conversions for use in watershed-scale hydrological modeling: A Canadian case study. Can. Geogr. 2014, 58, 499–516. [Google Scholar] [CrossRef]
- Zhao, X.; Pu, J.; Wang, X.; Chen, J.; Yang, L.E.; Gu, Z. Land-Use Spatio-Temporal Change and Its Driving Factors in an Artificial Forest Area in Southwest China. Sustainability 2018, 10, 4066. [Google Scholar] [CrossRef]
- Roy, R.; Chan, N.W.; Xenarios, S. Sustainability of rice production systems: An empirical evaluation to improve policy. Environ. Dev. Sustain. 2016, 18, 257–278. [Google Scholar] [CrossRef]
- Uuemaa, E.; Antrop, M.; Roosaare, J.; Marja, R. Landscape Metrics and Indices: An Overview of Their Use in Landscape Research Living Reviews in Landscape Research. Living Rev. Landsc. Res. 2009, 3, 1–28. [Google Scholar] [CrossRef]
- Gupta, D.K.; Bhatia, A.; Kumar, A.; Das, T.K.; Jain, N.; Tomer, R.; Sandep, K.M.; Fagodiya, R.K.; Dubey, R.; Pathak, H. Mitigation of greenhouse gas emission from rice-wheat system of the Indo-Gangetic plains: Through tillage, irrigation and fertilizer management. Agric. Ecosyst. Environ. 2016, 230, 1–9. [Google Scholar] [CrossRef]
- Rumanti, I.A.; Hairmansis, A.; Nugraha, Y.; Nafisah; Susanto, U.; Wardana, P.; Subandiono, R.E.; Zaini, Z.; Sembiring, H.; Khan, N.I.; et al. Development of tolerant rice varieties for stress-prone ecosystems in the coastal deltas of Indonesia. Field Crops Res. 2018, 223, 75–82. [Google Scholar] [CrossRef]
- Chartzoulakis, K.; Bertaki, M. Sustainable Water Management in Agriculture under Climate Change. Agric. Agric. Sci. Procedia 2015, 4, 88–98. [Google Scholar] [CrossRef] [Green Version]
- Lopulisa, C.; Rismaneswati; Ramlan, A.; Suryani, I. The emerging roles of agricultural insurance and farmers cooperatives on sustainable rice productions in Indonesia. IOP Conf. Ser. Earth Environ. Sci. 2018, 157, 012070. [Google Scholar] [CrossRef]


| Land Use Type | Characterization |
|---|---|
| Forest | Land covered by forest, mangrove, and highly dense vegetation |
| Plantation | Land covered by oil palm, rubber, cacao, and sugarcane |
| Mixed Vegetation | Land covered by a mixture of trees and the others of low dense-covered vegetation |
| Rice land | Land covered by rice, distributed on low and high land |
| Urban | Land covered by the high and low density of buildings, roads, housing, or others infrastructure |
| Waterbody | Land covered by water, e.g., river, seashore, lake, dam, and fishpond |
| Barren | Land covered by nothing: no vegetation and no infrastructure |
| Characteristic | Rice land Classification | |||
|---|---|---|---|---|
| S1 | S2 | S3 | N | |
| Slope (%) | 0–3 | 3–8 | 8–15 | >15 |
| Elevation (m) | 0–400 | 400–700 | 700–1200 | >1200 |
| Soil Texture | Moderately Fine | Medium | Moderately Coarse | Coarse |
| Soil Depth (cm) | >50 | 40–50 | 25–40 | <25 |
| pH | 5.9–7.5 | 5.4–5.9 | 4.5–5.4 | <4.5; >7.5 |
| Organic C (%) | >3 | 1.2–3 | 0.8–1.2 | <0.8 |
| Total N (%) | >0.5 | 0.2–0.5 | 0.1–0.2 | <0.8 |
| C/N | <8 | 8–10 | 10–15 | >15 |
| P2O5 (mg/100 g) | >40 | 20–40 | 15–20 | <15 |
| K2O (mg/100 g) | >60 | 30–60 | 16–30 | <16 |
| Land Use | 1989 | 1994 | 2003 | 2009 | 2018 | |||||
|---|---|---|---|---|---|---|---|---|---|---|
| PA (%) | UA (%) | PA (%) | UA (%) | PA (%) | UA (%) | PA (%) | UA (%) | PA (%) | UA (%) | |
| Forest | 91.7 | 88 | 95.7 | 81.5 | 94.9 | 86.1 | 90.7 | 82.9 | 96.3 | 86.7 |
| Plantation | 90 | 90 | 92.3 | 85.7 | 79.2 | 86.4 | 78.1 | 89.3 | 86.7 | 86.7 |
| Mixed Veg | 70 | 100 | 69.6 | 94.1 | 76.9 | 83.3 | 83.3 | 71.4 | 77.3 | 80.9 |
| Rice | 91.3 | 84 | 87.5 | 82.4 | 88.9 | 80 | 86.1 | 88.1 | 86.1 | 83.8 |
| Urban | 84.6 | 91.7 | 78.6 | 84.6 | 78.1 | 89.3 | 85.7 | 82.8 | 91.7 | 94.3 |
| Waterbody | 100 | 83.3 | 75 | 75 | 81.3 | 86.7 | 76.9 | 83.3 | 81.3 | 92.8 |
| Barren | 83.3 | 100 | 100 | 83.3 | 100 | 100 | 100 | 66.7 | 88.8 | 88.8 |
| OA (%) | 88.5 | 84.3 | 85.1 | 84.6 | 87.5 | |||||
| κ Coef. | 0.86 | 0.81 | 0.82 | 0.81 | 0.85 | |||||
| Land Use | Total Area (ha) | ||||
|---|---|---|---|---|---|
| 1989 | 1994 | 2003 | 2009 | 2018 | |
| Forest | 91,300 | 89,524 | 77,141 | 72,961 | 63,393 |
| Plantation | 37,611 | 39,752 | 53,584 | 66,130 | 82,137 |
| Mixed Vegetation | 14,090 | 24,697 | 23,772 | 17,659 | 17,174 |
| Rice | 88,000 | 80,836 | 79,406 | 75,863 | 66,009 |
| Urban | 6504 | 9317 | 13,755 | 14,609 | 20,834 |
| Waterbody | 18,613 | 11,572 | 8743 | 9482 | 6888 |
| Barren | 1409 | 1831 | 1127 | 824 | 793 |
| Total | 257,528 | 257,528 | 257,528 | 257,528 | 257,528 |
| Suitability Level | 1989 | 2018 | Change from 1989 to 2018 | |
|---|---|---|---|---|
| (ha) | (ha) | (ha) | (ha/year) | |
| Moderately Suitable | 32,126 | 24,641 | −7485 | −258 |
| Low Suitable | 51,946 | 40,518 | −11,428 | −394 |
| Unsuitable | 3928 | 850 | −3078 | −106 |
| Total | 88,000 | 66,009 | −21,991 | |
| Land Use | Total Area in 1989 (ha) | Total Area in 2018 (ha) | ||||
|---|---|---|---|---|---|---|
| S2 | S3 | N | S2 | S3 | N | |
| Forest | 22,117 | 32,042 | 37,140 | 14,239 | 13,369 | 36,086 |
| Plantation | 10,657 | 24,104 | 2851 | 23,649 | 50,164 | 8324 |
| Mixed Vegetation | 3015 | 8068 | 3007 | 3273 | 10,426 | 3475 |
| Rice land | 32,126 | 51,946 | 3928 | 24,641 | 40,158 | 850 |
| Urban | 1909 | 4588 | 8 | 7826 | 12,720 | 288 |
| Waterbody | 7886 | 8488 | 2239 | 4452 | 2318 | 118 |
| Barren | 574 | 818 | 17 | 204 | 539 | 50 |
| Total | 78,284 | 130,054 | 49,190 | 78,284 | 130,054 | 49,190 |
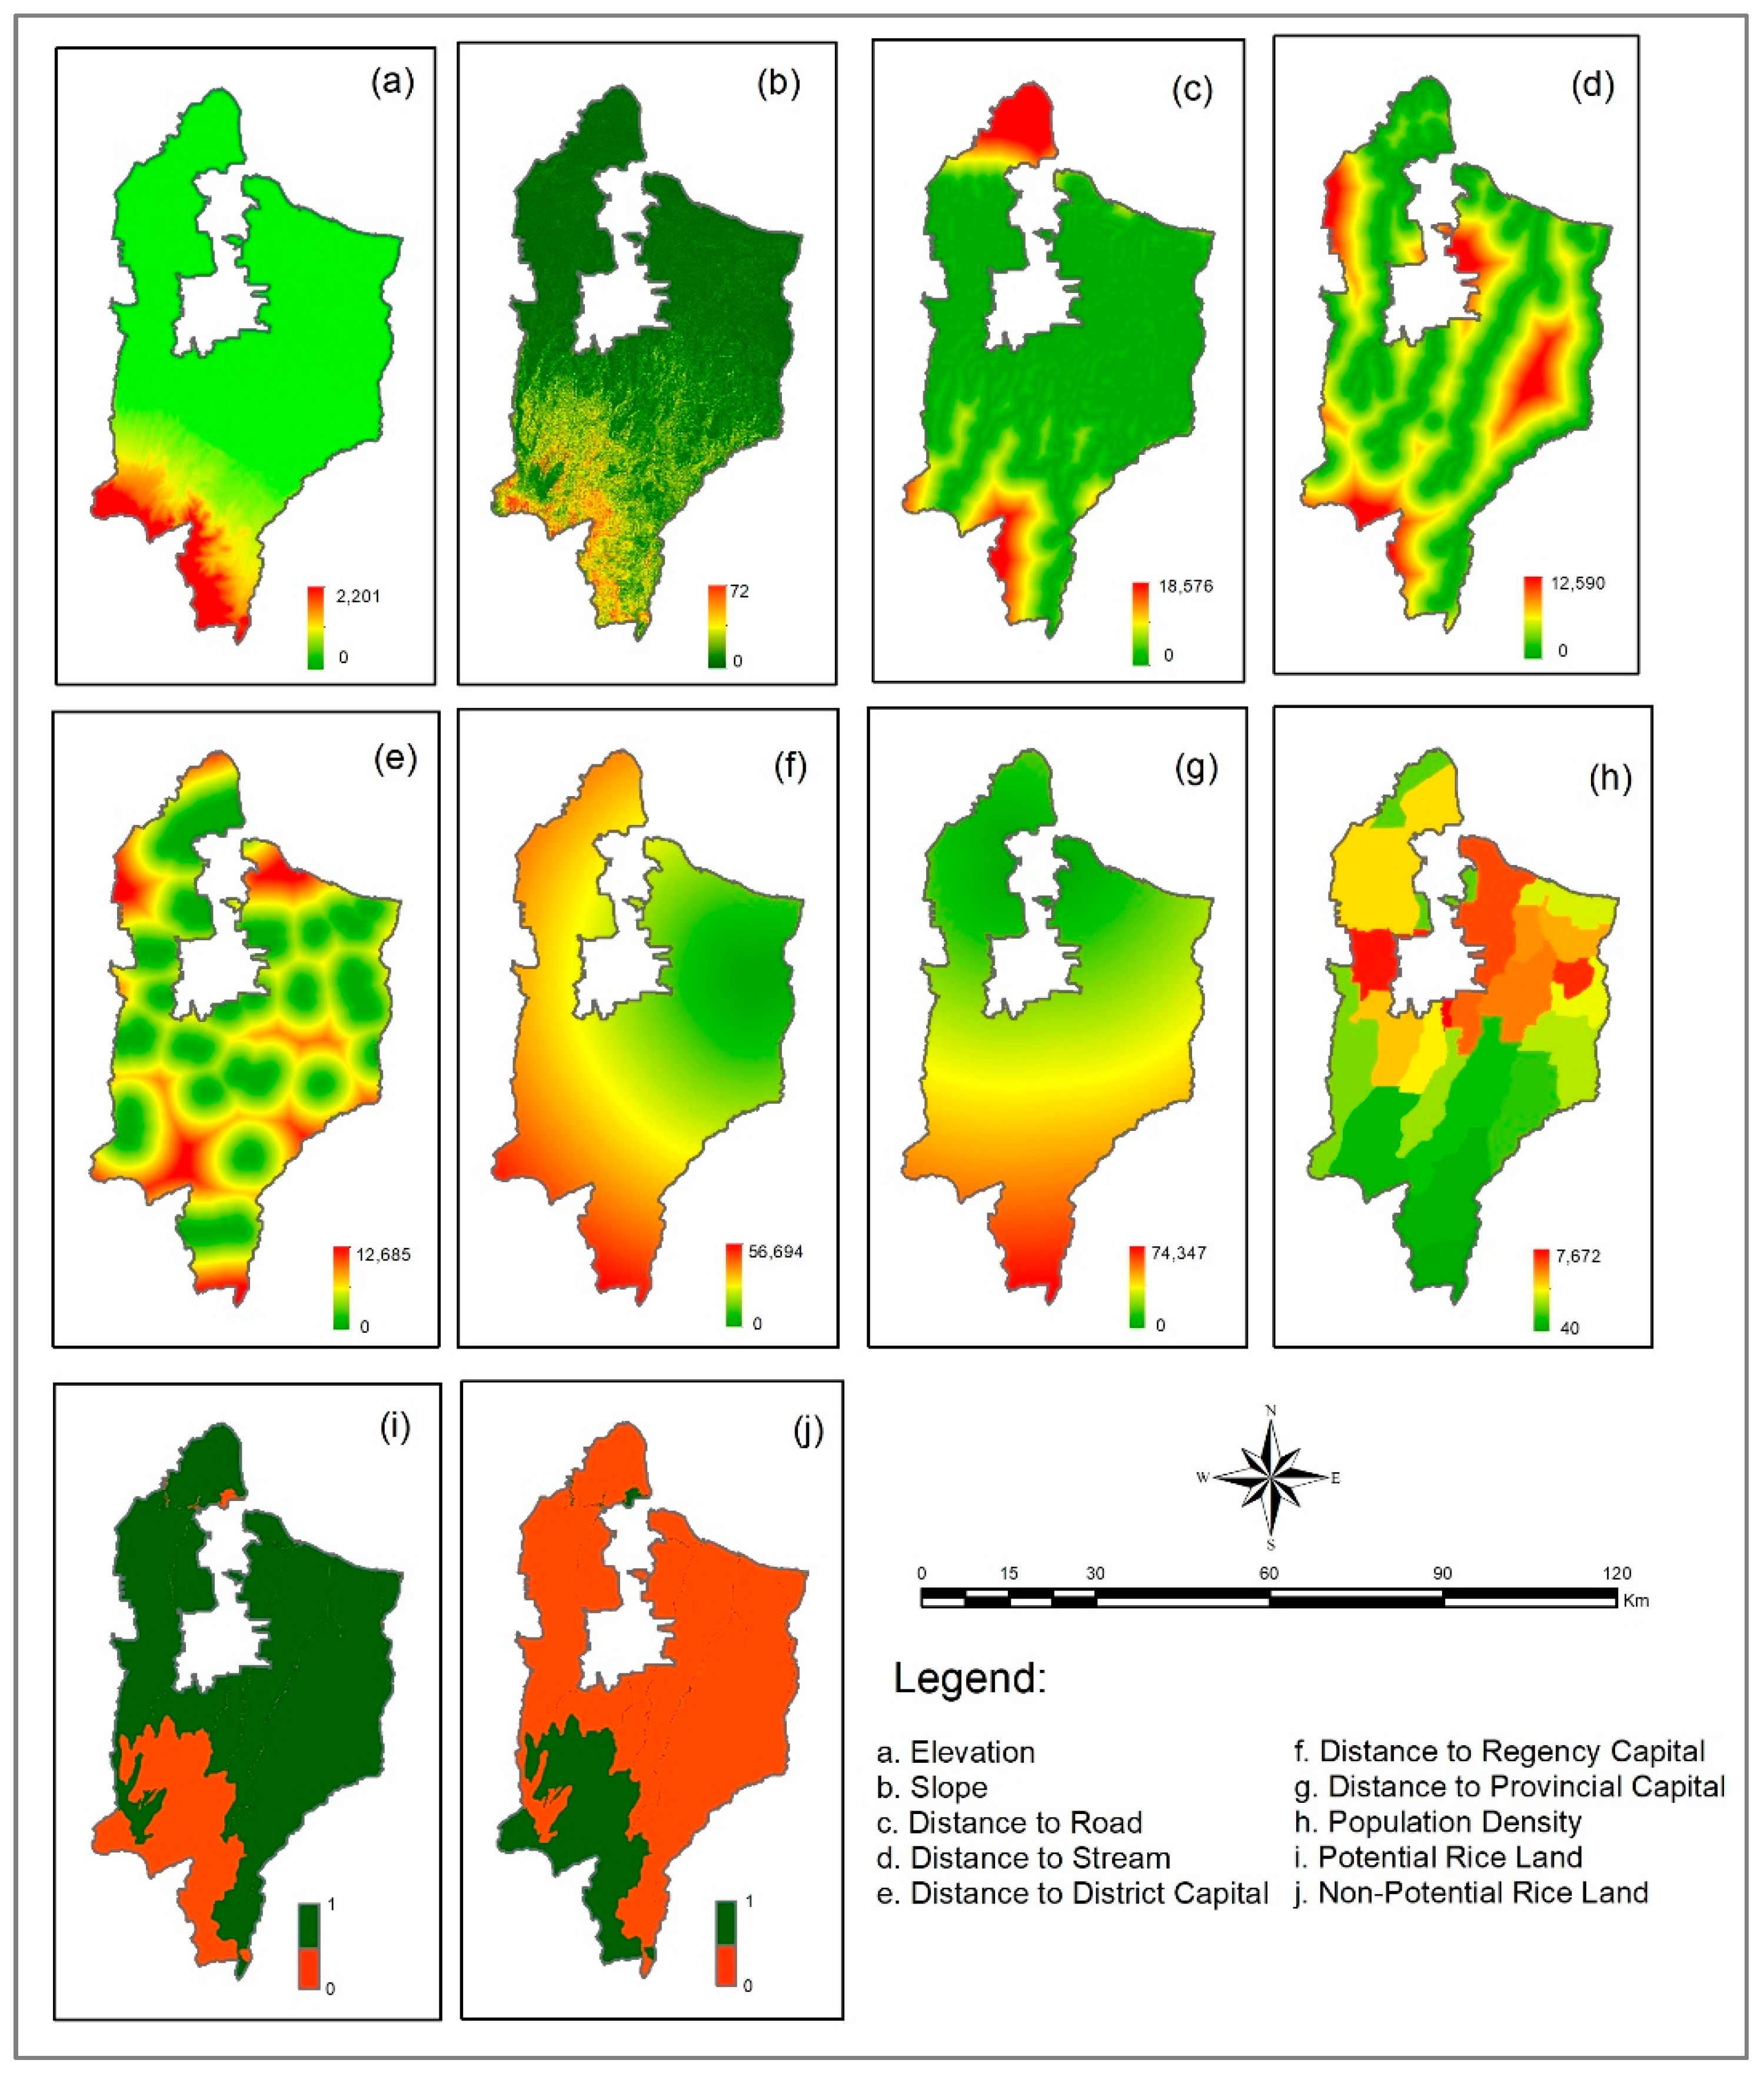
| Variable | Min | Max | Mean | SD |
| Elevation (m) Slope (degree) Distance to road (m) Distance to stream (m) Distance to district capital (m) Distance to regency capital (m) Distance to provincial capital (m) Population density (people/km2) | 0 0 0 0 0 0 0 0 | 2201 72 18,576 12,590 12,685 56,694 74,347 7672 | 155 5 1403 2740 3309 24,489 26,702 925 | 287 5 2696 2201 2321 13,609 16,461 957 |
| Variable | Min | Max | Mode | |
| Potential for rice land Non-potential for rice land | 0 0 | 1 1 | 1 0 |
| Variable | β | SE | Sig. | Exp (β) |
|---|---|---|---|---|
| Elevation Slope Distance to road Distance to stream Distance to district capital Distance to regency capital Distance to provincial capital Population density Potential for rice land Non-potential for rice land Constant | −0.000653 −0.045154 −0.000024 0.000004 −0.000013 −0.000015 0.000014 0.438468 0.352 | 0.000019 0.000711 9.7345 × 10⁻⁷ 0.000001 0.000001 2.5389 × 10⁻⁷ 0.000003 0.009334 0.013 | 0.001 0.001 0.001 0.001 0.001 ns 0.001 0.001 0.001 ns | 0.999347 0.955850 0.999976 1.000004 0.999987 0.999985 1.000014 1.550331 1.42 |
| Overall Percentage | 63.3 | |||
| ROC | 0.66 |
| Reasons to Convert | % |
| Sell rice land to support family needs Change to another commodity due to weather conditions Change to another commodity to increase income Change to another commodity due to costly rice land inputs Change to another commodity due to the difficulty accessing agricultural inputs Change to another commodity due to the availability/cost of labor Change to another commodity due to technical cultivation Change to another commodity due to pest and disease Change to another commodity due to following other farmers’ lead | 2 13 23 5 2 11 12 3 29 |
| Total | 100 |
| Reasons to Maintain | % |
| Cannot be sold due to the inheritance land status High productivity Children will inherit Food provision Located in a strategic area | 15 21 18 30 16 |
| Total | 100 |
| No. | Variable | Label | Min | Max | Mean |
|---|---|---|---|---|---|
| 1 | The changing of planting pattern | Patern_Change | 0 | 1 | −8.14 |
| 2 | Number of planting season | Indx_Plant | 0 | 3 | 1.67 |
| 3 | The availability of agricultural organization benefit | Org_Ben | 0 | 1 | 0.92 |
| 4 | Kind of land tenure | Land_Tenur | 1 | 3 | 2.04 |
| 5 | Distance of irrigation network to the rice land | Dis_Irrig | 10 | 8000 | 625.57 |
| 6 | Existence of inadequate water occurrence | Inad_Water Occur | 0 | 1 | 0.5 |
| 7 | Frequency of inadequate water | Inad_Water Freq | 0 | 3 | 0.57 |
| 8 | Frequency of drought | Drought_Freq | 0 | 3 | 1.01 |
| 9 | Existence of drought occurrence | Drought_Occur | 0 | 1 | 0.84 |
| 10 | Frequency of flood | Flood_Freq | 0 | 3 | 0.62 |
| 11 | Existence of flood occurrence | Flood_Occur | 0 | 1 | 0.48 |
| 12 | Number of environmental problems | No_Env Prob | 0 | 5 | 2.29 |
| 13 | Level of farmer’s understanding on the sustainable agriculture policy | Underst_Policy | 1 | 2 | 1.86 |
| 14 | Total household member | HH_Member | 0 | 7 | 3.36 |
| 15 | Total household member stay-in the same district | HH_Memb Stayin | 0 | 7 | 3.04 |
| 16 | Age | Age | 25 | 71 | 45.66 |
| 17 | Distance of road network to the rice land | Dis_Road | 30 | 2500 | 883 |
| 18 | Distance of housing to the rice land | Dis_Housing | 15 | 2000 | 668.25 |
| 19 | Strategic action to anticipate land degradation through the usage of high-quality seed | Strat_Seed | 1 | 5 | 3.96 |
| 20 | Number of strategic activities applied to anticipate land degradation | No_Strat | 2 | 7 | 4.3 |
| 21 | Level of agricultural organization involvement | Org_Involv | 2 | 5 | 4.36 |
| 22 | Total income from non-agriculture sector | Incom_Non-Agri | 0 | 8571.43 | 815.01 |
| 23 | Strategic action to anticipate land degradation through water efficiency | Strat_Water Eff | 1 | 5 | 1.84 |
| 24 | Frequency of delayed planting season | Delay Plant_Freq | 0 | 2 | 0.48 |
| 25 | Strategic action to anticipate land degradation through using water-pump | Strat_Wat Pump | 1 | 5 | 2.19 |
| 26 | Distance of plantation to the rice land | Dis_Plantation | 50 | 7500 | 2552.78 |
| Variable | Component | |||||||
|---|---|---|---|---|---|---|---|---|
| 1 | 2 | 3 | 4 | 5 | 6 | 7 | 8 | |
| Patern_Chang | −0.838 | |||||||
| Indx_Plant | −0.818 | |||||||
| Org_Ben | −0.655 | |||||||
| Land_Tenur | −0.599 | |||||||
| Inad_Water Occur | 0.937 | |||||||
| Inad_Water Freq | 0.916 | |||||||
| Drought_Freq | 0.507 | |||||||
| Flood_Freq | 0.908 | |||||||
| Flood_Occur | 0.884 | |||||||
| No_Env Prob | 0.534 | 0.587 | ||||||
| HH_Member | 0.959 | |||||||
| HH_Memb Stayin | 0.911 | |||||||
| Age | 0.539 | |||||||
| Dis_Road | 0.832 | |||||||
| Dis_Housing | 0.806 | |||||||
| Strat_Seed | 0.840 | |||||||
| No_Strat | 0.748 | |||||||
| Org_Involv | 0.640 | |||||||
| Incom_Non-Agri | 0.747 | |||||||
| Strat_Water Eff | 0.505 | |||||||
| Strat_Wat Pump | 0.731 | |||||||
| Dis_Plantation | 0.651 | |||||||
| Initial Eigenvalues % of Variance Cumulative % | 20.874 20.874 | 14.406 35.280 | 9.948 45.229 | 7.612 52.840 | 5.989 58.829 | 5.131 63.960 | 4.862 68.822 | 4.395 73.218 |
| Component | Name and Information |
|---|---|
| 1 | Cultivation Management: The changing planting patterns, number of planting seasons, the benefit to the agricultural organization, and kind of land tenure. |
| 2 | Drought Issue: The existence of inadequate water occurrence and its frequency per year together with drought frequency. |
| 3 | Flood Issue: The frequency and occurrence of flood and number of environmental problems |
| 4 | Socio-economic: The number of household members and their ages. |
| 5 | Distance: The distance of rice land to the road network and housing. |
| 6 | Strategic Farming: The strategy to address land degradation using high-quality seeds, number of strategic farming methods applied, and the level of agricultural organization involvement. |
| 7 | Income Non-Agriculture: The total income from the non-agriculture sector and the strategic action of water efficiency. |
| 8 | Water Efficiency Strategy: The strategic action used to anticipate land degradation using water pumps and distance to the plantations. |
| Variable | β | SE | Sig. | Exp (β) |
|---|---|---|---|---|
| Total number of household members | 0.912 | 0.209 | 0.001 | 2.489 |
| Inadequate water occurrences | 1.551 | 0.477 | 0.001 | 4.716 |
| Distance of road network to rice land | −0.002 | 0 | 0.001 | 0.998 |
| The changing planting patterns | 1.902 | 0.586 | 0.001 | 6.697 |
| Frequency of floods | 1.708 | 0.425 | 0.001 | 5.518 |
| The strategic action to anticipate land degradation using a water pump | −0.851 | 0.218 | 0.001 | 0.427 |
| Total income from the non-agriculture sector | −0.001 | 0 | 0.004 | 0.999 |
| Constant | −1.615 | 0.92 | 0.79 | 0.199 |
| District | Mean Values | ||||||||||||||
| Biophysical Factor | Socio-Economic Factor | ||||||||||||||
| Elevation | Slope | Distance Road | Distance District | Distance Province | Distance Stream | Pop Density | Potent Land | Dis_ Road | Strat_Wat Pump | Incom_ Non-Agri | HH_ Member | Inad_ Water Occur | Pattern_ Chang | Flood_Freq | |
| STM Hilir | 144.5 | 6.12 | 934.67 | 3252.49 | 36,642.84 | 1902.32 | 191 | 0.8578 | 1219.64 | 1.14 | 684.84 | 2.96 | 0.43 | 0.15 | 0.71 |
| T. Morawa | 26.01 | 2.75 | 185.7 | 2800.13 | 23,089.64 | 2000.02 | 1723 | 0.9855 | 707.14 | 3.14 | 1201.12 | 2.93 | 0.71 | 0.07 | 0.14 |
| Sunggal | 32.74 | 1.66 | 198.02 | 1782.75 | 15,844.05 | 3008.91 | 3109 | 0.9909 | 822 | 1.63 | 615 | 3.93 | 0.85 | 0 | 0.15 |
| H. Perak | 7.59 | 1.44 | 2565.69 | 3172.2 | 7581.25 | 2644.27 | 770 | 0.9907 | 979.41 | 2.53 | 1101.63 | 2.88 | 0.35 | 0.18 | 1.12 |
| P.S. Tuan | 8.30 | 1.73 | 483.48 | 4687.54 | 9461.9 | 3974.72 | 2381 | 0.9926 | 1214.06 | 1.34 | 777.5 | 3.28 | 0.25 | 0.03 | 1.09 |
| Beringin | 9.46 | 2.02 | 166.13 | 2307.13 | 20,932.09 | 1830.26 | 1179 | 0.9784 | 308.13 | 3.91 | 742.94 | 3.78 | 0.44 | 0.25 | 0.31 |
| District | Normalized Values | ||||||||||||||
| Biophysical Factor | Socio-Economic Factor | ||||||||||||||
| Elevation | Slope | Distance Road | Distance District | Distance Province | Distance Stream | Pop Density | Potent Land | Dis_ Road | Strat_Wat Pump | Incom_ Non-Agri | HH_ Member | Inad_ Water Occur | Pattern_ Chang | Flood_Freq | |
| STM Hilir | 0 | 0 | 0.68 | 0.494 | 0 | 0.034 | 0 | 0 | 0 | 1 | 0.881 | 0.076 | 0.3 | 0.6 | 0.582 |
| T. Morawa | 0.865 | 0.72 | 0.992 | 0.65 | 0.466 | 0.079 | 0.525 | 0.947 | 0.562 | 0.278 | 0 | 0.048 | 0.767 | 0.28 | 0 |
| Sunggal | 0.816 | 0.953 | 0.987 | 1 | 0.716 | 0.55 | 1 | 0.987 | 0.436 | 0.823 | 1 | 1 | 1 | 0 | 0.01 |
| H. Perak | 1 | 1 | 0 | 0.522 | 1 | 0.38 | 0.198 | 0.986 | 0.264 | 0.498 | 0.17 | 0 | 0.167 | 0.72 | 1 |
| P.S. Tuan | 0.995 | 0.938 | 0.868 | 0 | 0.935 | 1 | 0.751 | 1 | 0.006 | 0.928 | 0.723 | 0.381 | 0 | 0.12 | 0.969 |
| Beringin | 0.986 | 0.876 | 1 | 0.819 | 0.541 | 0 | 0.339 | 0.895 | 1 | 0 | 0.782 | 0.857 | 0.317 | 1 | 0.173 |
| Elevation | Slope | Distance Road | Distance District | Distance Province | Distance Stream | Pop Density | Potent Land | Dis_ Road | Strat_Water Pump | Incom_ Non-Agri | HH_ Member | Inad_ Water Occur | Pattern_ Chang | Flood_Freq | |
| SD | 0.388 | 0.379 | 0.389 | 0.342 | 0.365 | 0.39 | 0.367 | 0.395 | 0.379 | 0.398 | 0.408 | 0.438 | 0.38 | 0.384 | 0.461 |
| 1/SD | 2.575 | 2.638 | 2.568 | 2.922 | 2.739 | 2.567 | 2.723 | 2.531 | 2.638 | 2.515 | 2.452 | 2.284 | 2.631 | 2.603 | 2.17 |
| Weight | 0.0668 | 0.0684 | 0.0666 | 0.0758 | 0.071 | 0.0666 | 0.0706 | 0.0657 | 0.0684 | 0.0652 | 0.0636 | 0.0592 | 0.0682 | 0.068 | 0.056 |
| Rank | 8 | 4 | 9 | 1 | 2 | 10 | 3 | 11 | 5 | 12 | 13 | 14 | 6 | 7 | 15 |
© 2019 by the authors. Licensee MDPI, Basel, Switzerland. This article is an open access article distributed under the terms and conditions of the Creative Commons Attribution (CC BY) license (http://creativecommons.org/licenses/by/4.0/).
Share and Cite
Siagian, D.R.; Shrestha, R.P.; Shrestha, S.; Kuwornu, J.K.M. Factors Driving Rice Land Change 1989–2018 in the Deli Serdang Regency, Indonesia. Agriculture 2019, 9, 186. https://doi.org/10.3390/agriculture9090186
Siagian DR, Shrestha RP, Shrestha S, Kuwornu JKM. Factors Driving Rice Land Change 1989–2018 in the Deli Serdang Regency, Indonesia. Agriculture. 2019; 9(9):186. https://doi.org/10.3390/agriculture9090186
Chicago/Turabian StyleSiagian, Deddy Romulo, Rajendra P. Shrestha, Sangam Shrestha, and John K. M. Kuwornu. 2019. "Factors Driving Rice Land Change 1989–2018 in the Deli Serdang Regency, Indonesia" Agriculture 9, no. 9: 186. https://doi.org/10.3390/agriculture9090186