Article

The Use of the Combination of Texture, Color and Intensity Transformation Features for Segmentation in the Outdoors with Emphasis on Video Processing

by
Sajad Sabzi
1,
Yousef Abbaspour-Gilandeh
1,*,
Jose Luis Hernandez-Hernandez
2,
Farzad Azadshahraki
3 and
Rouhollah Karimzadeh
4
1
Department of Biosystems Engineering, College of Agriculture and Natural Resources, University of Mohaghegh Ardabili, Ardabil 56199-11367, Iran
2
Division of Research and Graduate Studies, Technological Institute of Chilpancingo, TecNM, Chilpancingo Guerrero 39070, Mexico
3
Agricultural Engineering Research Institute, Agricultural Research, Education and Extension Organization (AREEO), Karaj 31585-845, Iran
4
Department of physics, Shahid Beheshti University, G.C., Tehran 19839, Iran
*
Author to whom correspondence should be addressed.
Agriculture 2019, 9(5), 104; https://doi.org/10.3390/agriculture9050104
Submission received: 3 April 2019 / Revised: 2 May 2019 / Accepted: 6 May 2019 / Published: 9 May 2019

Abstract

:
Segmentation is the first and most important part in the development of any machine vision system with specific goals. Segmentation is especially important when the machine vision system works under environmental conditions, which means under natural light with natural backgrounds. In this case, segmentation will face many challenges, including the presence of various natural and artificial objects in the background and the lack of uniformity of light intensity in different parts of the camera's field of view. However, today, we must use different machine vision systems for outdoor use. For this reason, in this study, a segmentation algorithm was proposed for use in environmental conditions without the need for light control and the creation of artificial background using video processing with emphasizing the recognition of apple fruits on trees. Therefore, a video with more than 12 minutes duration containing more than 22,000 frames was studied under natural light and background conditions. Generally, in the proposed segmentation algorithm, five segmentation steps were used. These steps include: 1. Using a suitable color model; 2. Using the appropriate texture feature; 3. Using the intensity transformation method; 4. Using morphological operators; and 5. Using different color thresholds. The results showed that the segmentation algorithm had the total correct detection percentage of 99.013%. The highest sensitivity and specificity of segmentation algorithm were 99.224 and 99.458%, respectively. Finally, the results showed that the processor speed was about 0.825 seconds for segmentation of a frame.

1. Introduction

Performing segmentation operations in accordance with the desired purpose has different complexities. In principle, segmentation operations in agriculture and horticulture are more complex than other sectors. This complexity is because of crowded backgrounds with various objects. In applications such as site-specific spraying and combat weeds, segmentation is the first step in the design of machine vision systems [1,2,3,4]. The segmentation involves various steps depending on the complexity of the background of the image and may include a combination of several methods. Therefore, the programmer skill is very important in this field. Generally, the conventional methods of segmentation are color index-based segmentation, threshold-based segmentation and learning-based segmentation [5] that in this research we used threshold-based segmentation method as one method that combine with other method. Bai et al. [6] believed that segmentation of vegetation cover from field images is a necessary issue. For this reason, they proposed a new segmentation method based on particle swarm optimization clustering and morphological modeling in a color space of L*a*b*. In this regard, they captured images at 10, 12 and 14 o’clock.
The proposed method has two stages of offline learning and online segmentation. In the offline learning process, the number of optimized clusters was determined based on the training sample set. In the second step, each pixel was classified as vegetation class or non-vegetation class. In the last step, 200 images were used to test the proposed system. The results showed that the average segmentation quality of the images was 88.1% to 91.7%. Because of the successive droughts in the world and the consequent reduction in groundwater levels, as well as due to increased population, the need for agricultural water management is quite felt. One way to deal with water shortage is to use water only in areas where the crop has been cultivated, because it will only be consumed by the product and thus the amount of waste of water will be minimized. In large-scale lands, the possibility to achieve this without the use of new technologies is almost zero. For this reason, it is possible to detect places with crops using machine vision systems. In this regard Hernandez et al. [7] believed that in order to achieve precision agriculture goals, not only new technologies but also software development were necessary. Therefore, they provided a new application of the machine vision system in the form of an automated segmentation system of plants from background to monitor the cabbage during growth, to provide product information that is needed to estimate the amount of water required for the crop. Their proposed system consisted of three main steps: 1) imaging and cutting, 2) analyzing the image, and 3) recording information. In order to imaging, wooden frames were installed inside the farm, and then the images were taken. In order to train the proposed system, 1106 cabbage samples were used. The results showed that the proposed system had a 20% error in counting the cabbage.
In another study Tang et al. [8] provided a multi-inference trees segmentation method to better manage farms. The algorithm worked out based on image features and user requirements. In fact, the algorithm learns the related rules according to these two, and then applies the color space, the transformation to the gray image method, the de-noising method, the local segmentation method, and the morphology processing method after applying each rule. To train the proposed algorithm, 2082 images with a resolution of 1932 × 2576 were captured. A manual method was also used to evaluate intelligent results. The results showed that the intelligent processing assessment rate for more than 80 points was above 83% with an average of 75%. The processing time of each image needs about 23 seconds.
Liu et al. [9] developed a machine vision system for segmentation of apple fruit based on color and position information. This system performs segmentation based on artificial light with low brightness. The proposed method had two main steps: the first step included the training of artificial neural network using RGB and HIS color space components and finally, it included the providing a model for apple fruit segmentation. Due to the presence of shadows in some parts of the apple (due to the no uniformity of light), the segment is not performed properly in this step, therefore, in order to complete the segmentation, a second stage, which also considers the color and position of the pixels surrounding the segmented area, is added. In their study, 20 apple fruits were used. The results showed that the proposed system has acceptable results in the segmentation of these apples.
As it was observed, the research focused on segmentation in two simple background states, such as separating the plant from the soil or having a segment on the artificial background. On the other hand, all research focused on analyzing the images taken. To formulate an appropriate segmentation algorithm for apple fruits under natural light conditions and a completely natural background in the presence of various objects such as leaves of tree, thin branches, thick branches, tree trunk, blue sky, cloudy sky, green plants, yellow plants, harvested fruits, and baskets, there is no possibility to use the results of researches done because of two reasons: 1. backgrounds are very complex and have different objects with different colors. 2. Camera movement in gardens needs for different operations, such as site-specific spraying, for this reason, the frames have no good quality. Therefore, the purpose of this study is to develop a segmentation algorithm for working in a completely natural environment both in terms of light and in terms of backgrounds using video processing, with emphasis on the segmentation of apples on trees.
In the last years horticulture has been one of the most important research objects in many universities in the world. We have found that the main works are directed to the recognition of fruits, counting, detection of plants, monitoring of irrigation, etc.

2. Materials and Methods

Each machine or computer vision system for development needs to have different stages, such as the filming stage, the stage of analysis, and so on. In this study, as same as other machine vision system, the steps have been designed to train the system. Some of these steps can be filming, examining different color models, extracting various texture features, employing different morphological operators and using the intensity transformation method.

2.1. Data Collection

In this study, a digital camera (DFK 23GM021 specification, CMOS, 120 f/s, Imaging Source GmbH, Bremen, Germany) was used to filming from apple gardens in Kermanshah province-Iran. In Table 1, shows the related details of one of the videos from these gardens. As observed, there is a video more than 12 minutes that contains more than 22,000 frames that has been recorded in different days, times of the day, and weather conditions. Since the capability of performing of the segmentation system in different light intensities is an essential principle, the video was provided in full natural light conditions throughout the day with a completely natural background. Some light intensities were 398 lux, 1096 lux, 692 lux, 1591 lux, 1923 lux, 894 lux, 2010 lux, 918 lux, 798 lux, 493 lux and 579 lux.
We collected several films of orchards, but we used only 12 min (22,001 frames) of them for the training of the algorithm. We had filming in four stages of ripening, including Unripe (20 days before maturity), Half-ripe (10 days before maturity), Ripe and Overripe (10 days after maturity), that combined them for the training of algorithm.
The distance from the trees was between 0.5 and 2 m, the speed was around 1 m/s, and the viewing angle was nearly parallel to the ground. The camera was manually held, simulating a low-medium height flight of a drone. With the system described, which has a horizontal viewing angle around 80o an apple about 7 cm would be observed with a size of 20 pixels at a distance about 3 m over the trees.
Apple variety was Malus Domestica L., var. Red Delicious. We had filming in 4 stages of ripening include Unripe, Half-ripe, Ripe and Overripe.

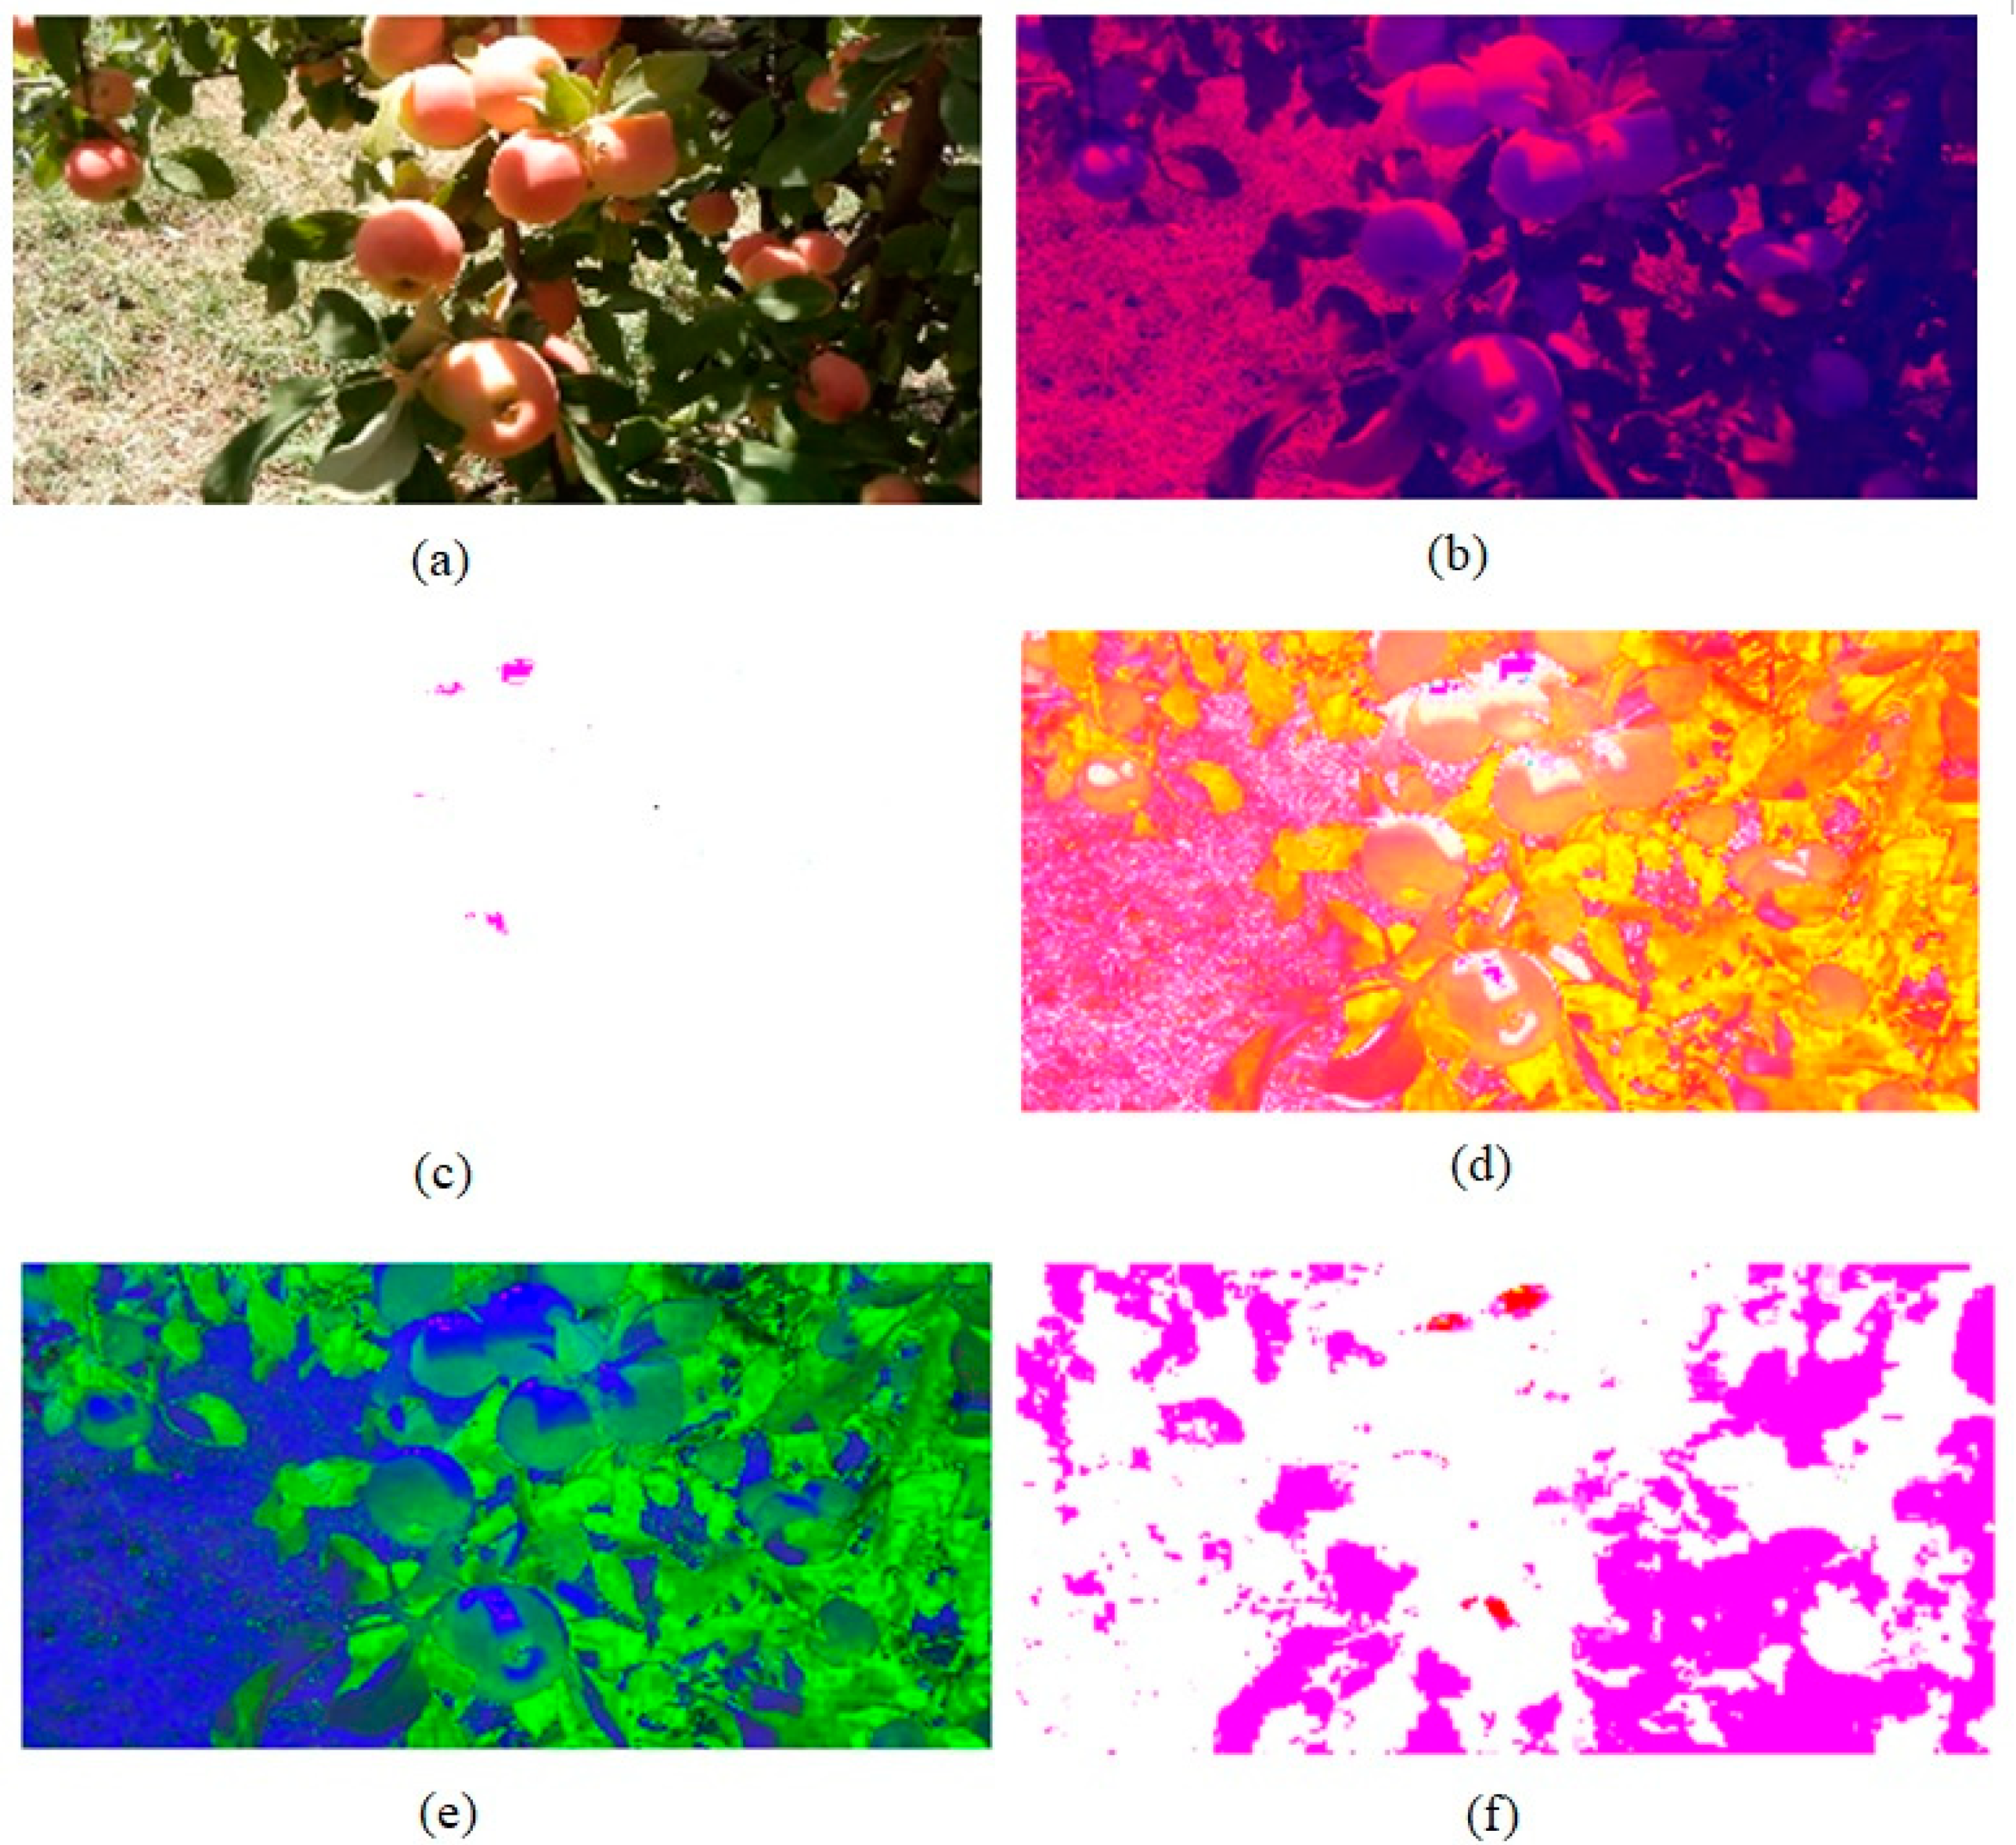
2.2. Various Color Models

An image in different color models has different colors. In fact, different objects in one image, in each color model, will have different colors. This feature can be used to distinguish between different background objects and apples. For this investigation, 17 color spaces were investigated [10,11], which are shown in Table 2.

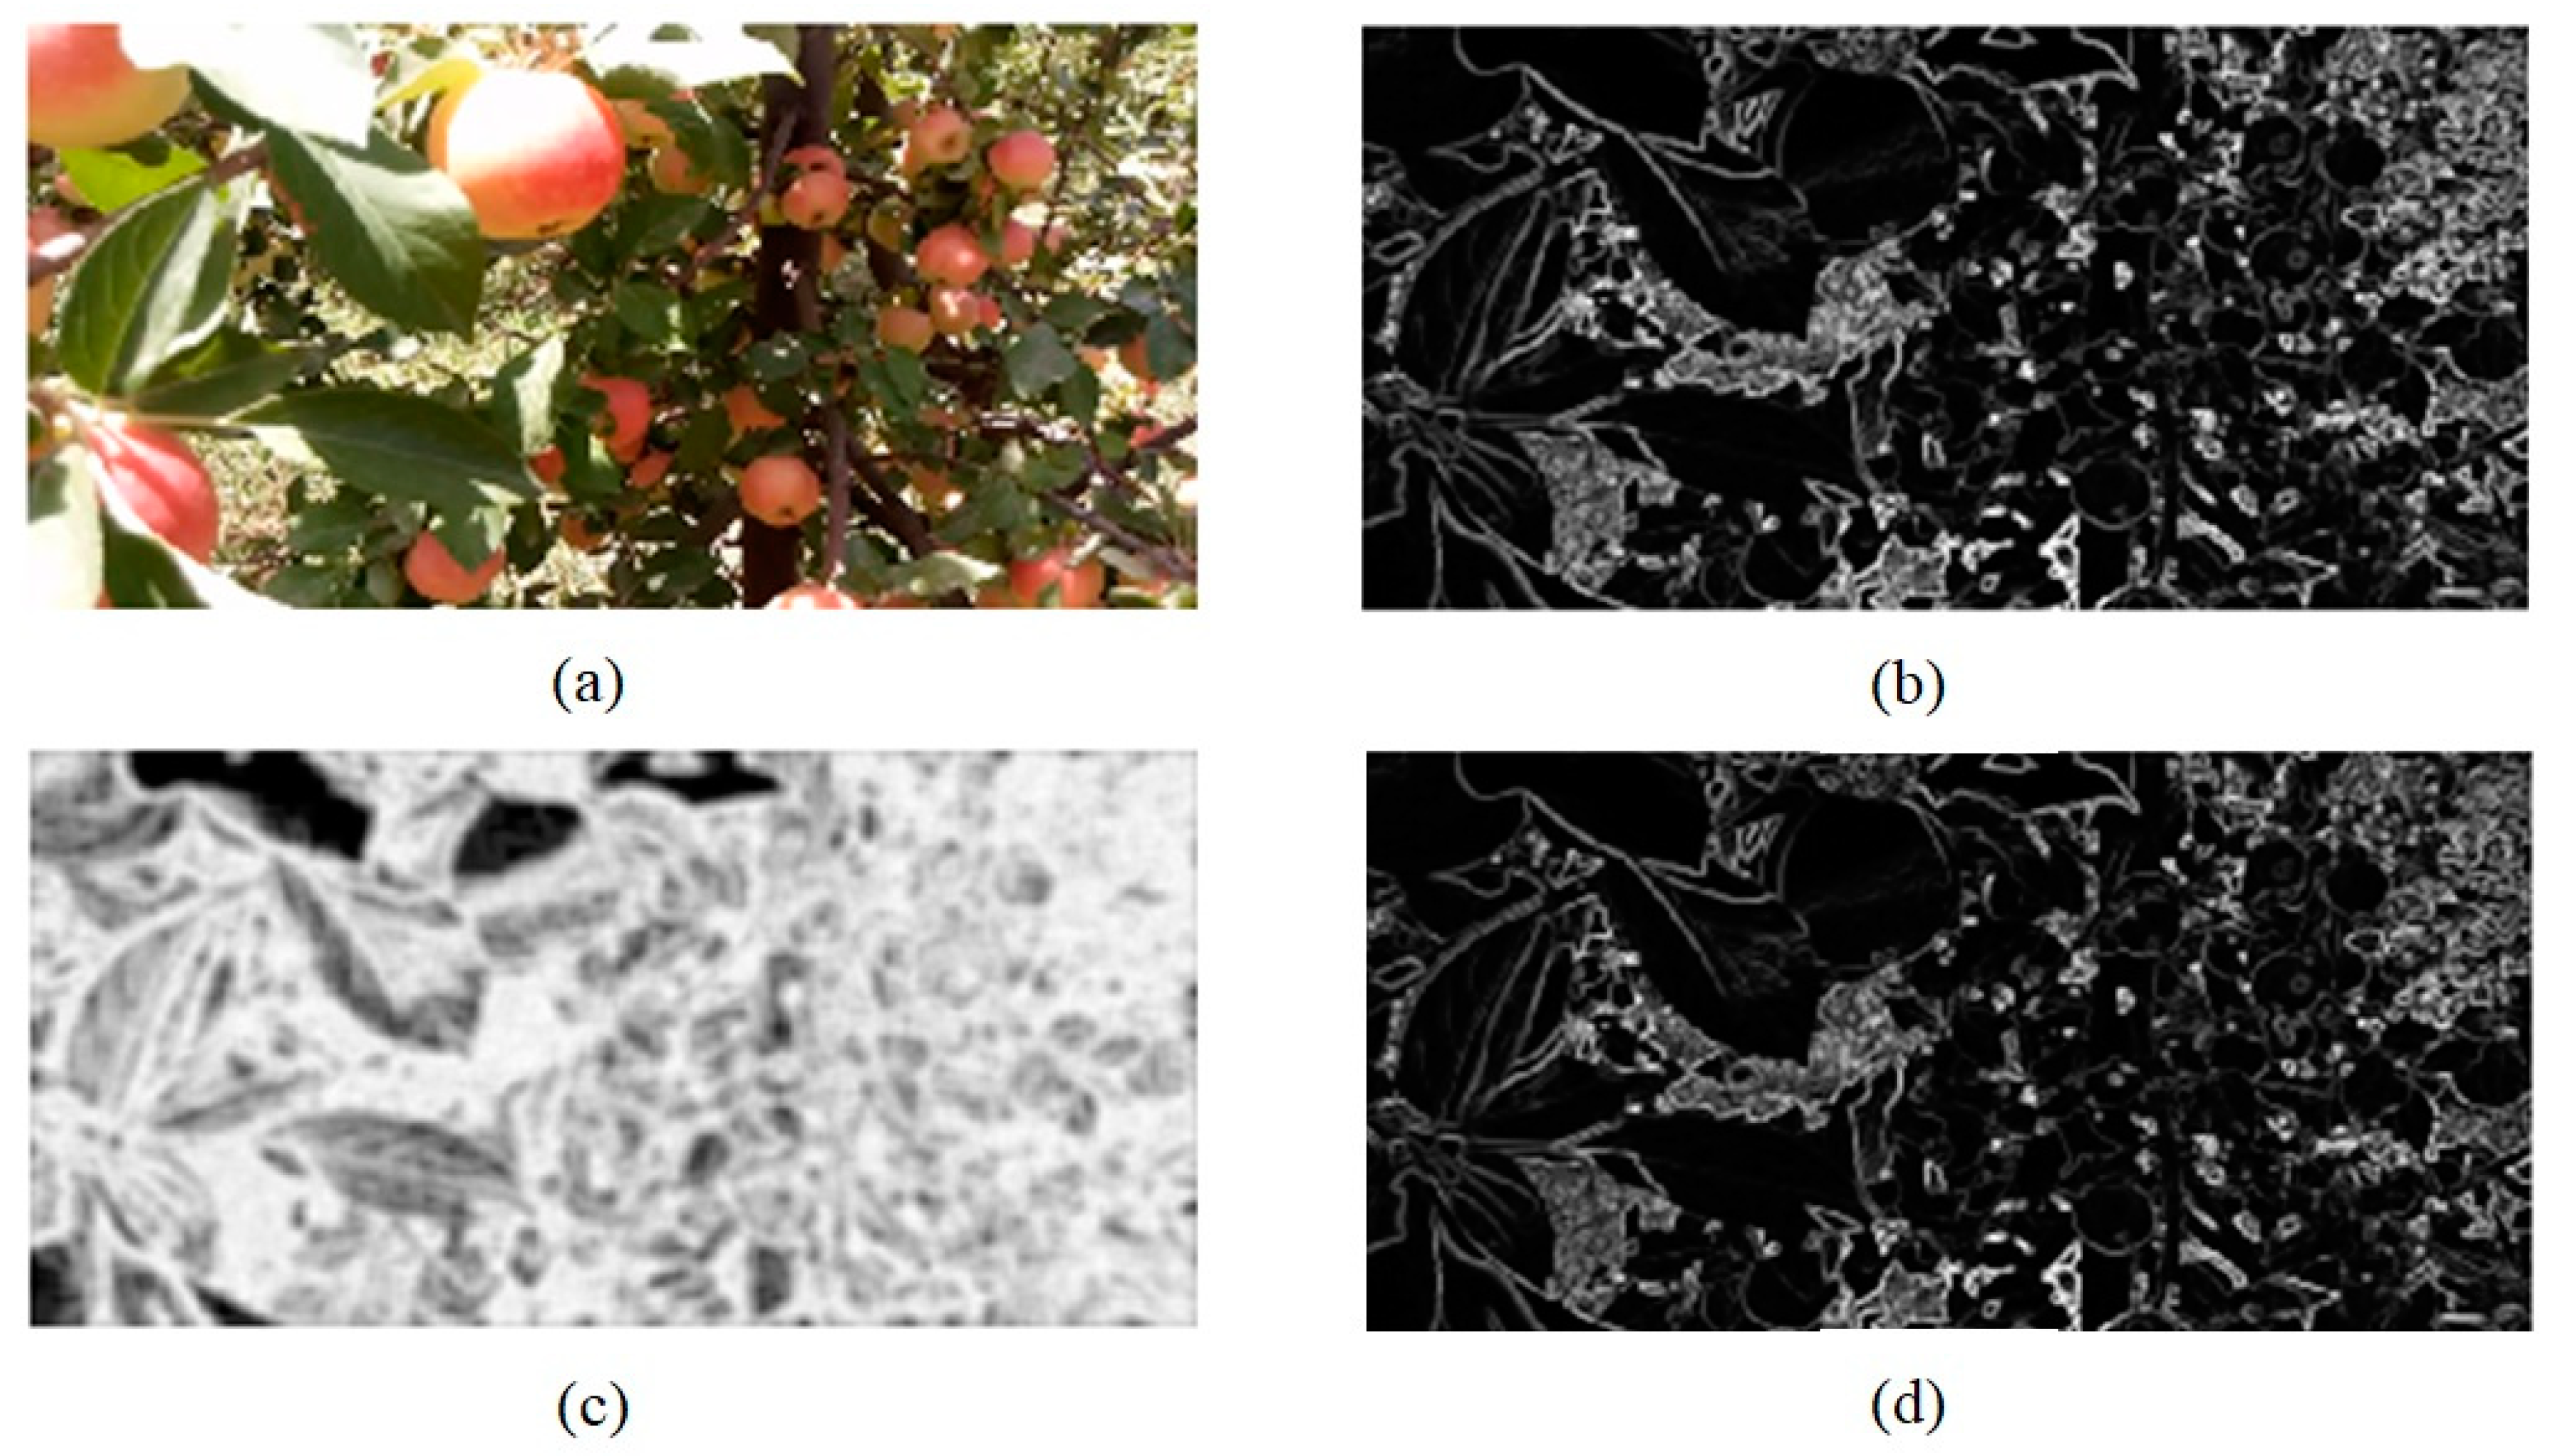
2.3. Extraction of Texture Features

Intuitively, the texture of a region can be described by roughness and softness. In fact, different regions in one image can be formed from a very rough to very soft modes. Mathematically, there are several methods for describing the texture. One of these methods is the texture features based on the gray level co-occurrence matrix (GLCM) extracted from the position of the pixels with same values. In fact, this method presents an average of the entire area in which the texture is examined. Therefore, this study is not applicable because here it is necessary to examine the texture of all pixels. Another method is to measure the spectral range of the texture based on the Furrier spectrum. This spectrum describes periodic or nearly periodic two-dimensional patterns in an image. The Furrier spectrum performs spectral measurement in a polar coordinate system (i.e., based on radius and angle), since spectral properties are interpreted by describing the spectrum in polar coordinates as a simple function of S (r, θ). In this function S is the spectral function and r and θ are variables of the polar system. Therefore, the function of S (r, θ) can be considered as two one-dimensional functions of Sθ(r) and Sr(θ) for each direction θ and each frequency r. Sθ(r) for the constant values of θ shows the behavior of the spectrum along the radius, while Sr(θ) for the constant values of r shows the behavior of the spectrum along a circle with the center of origin [10]. This method, like the previous method, provides the mean value for the entire area. In the third method, textural descriptors are applied to the entire image pixels, and finally, the results are also observed intuitively. Therefore, in this study, the texture features of local entropy, local standard deviation and local range were investigated.

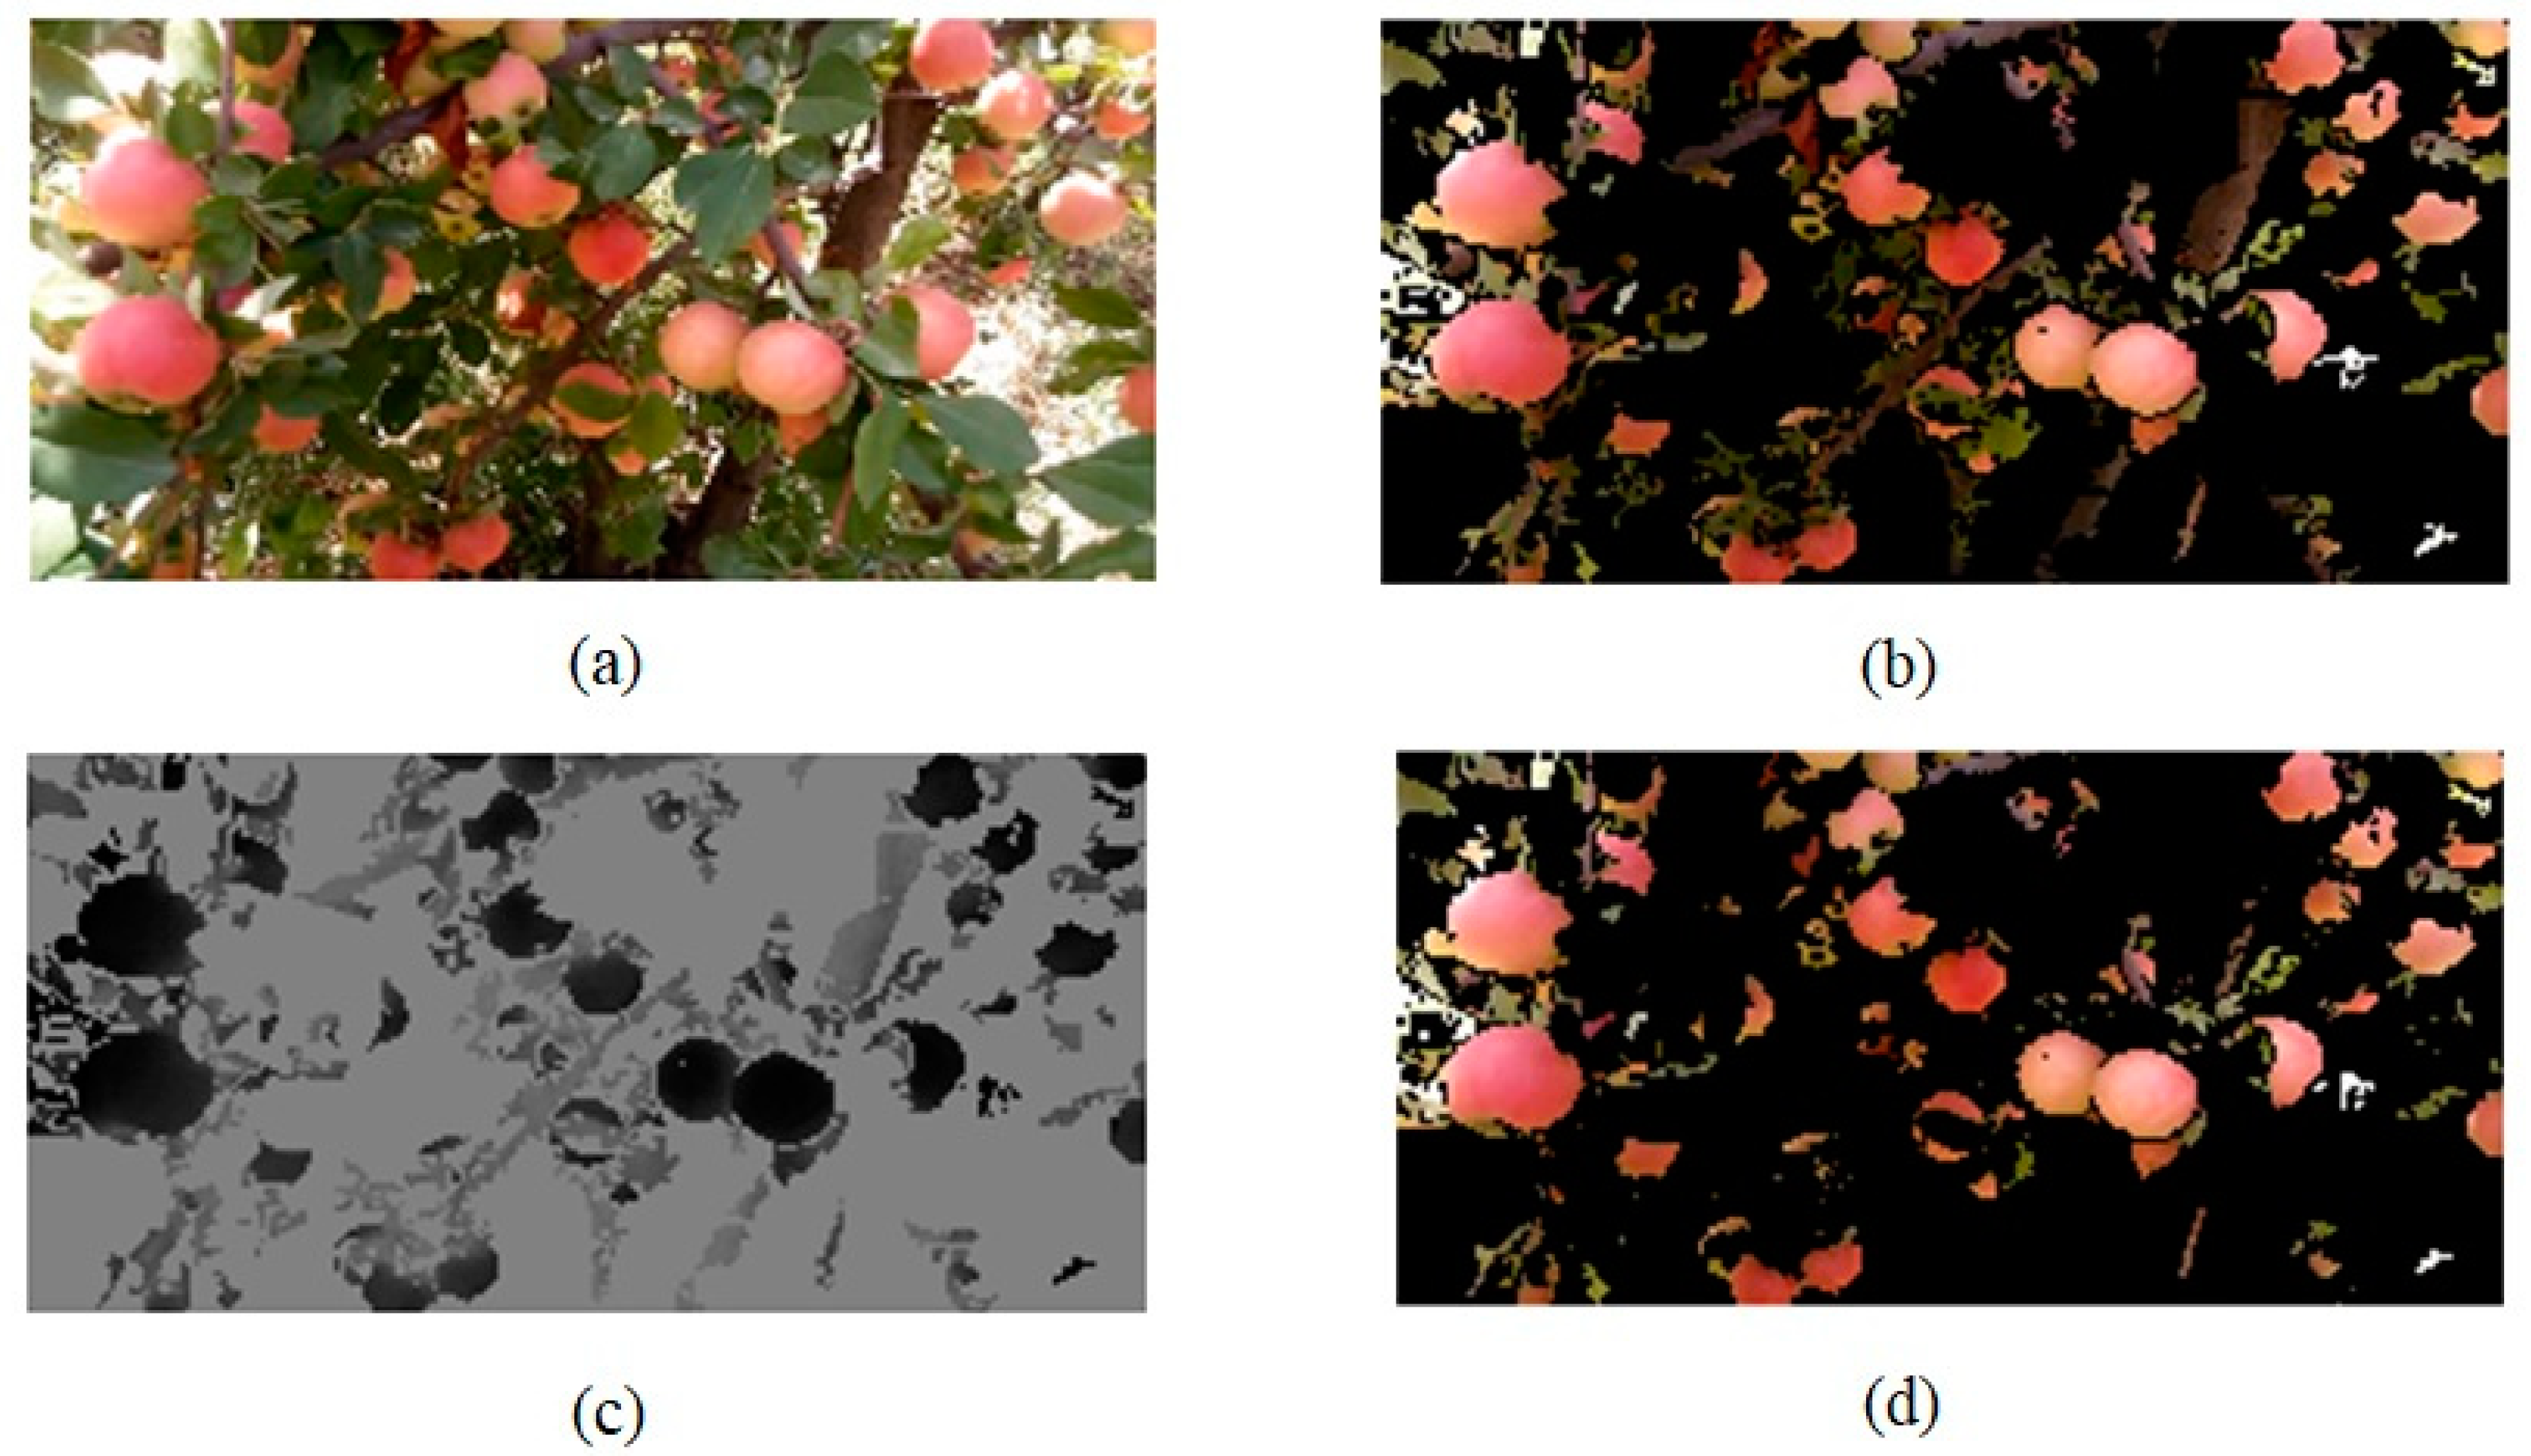
2.4. Application of Morphological Operators

Outdoor operations under natural light with complex backgrounds are particularly sensitive, as unpredictable noise and effects can make it difficult to achieve the desired goal. One of the most important methods for removing these noise and unpredicted factors is the use of morphological operators. These operators include a wide range of operators, such as opening, closing, filling holes, deleting border pixels, removing objects with pixels less than threshold values, thinning, thickening, and others. In the proposed segmentation algorithm, opening, closing, filling holes and deleting objects with a number of pixels less than 100 were used at different stages. This threshold value was selected with trial and error and with the consideration of not removing the apple pixels.
The process of mathematical morphology in computational terms, consists of moving all the pixels of the image from left to right and from top to bottom in order to find isolated pixels, which are considered noise [12]. This noise is eliminated by applying erosion and dilation with the following equations:
O p e n =   ( B   E )   E
C l o s e =   ( B   E )   E
The operation open, disappears the fine points or fine structures and the operation close, fill the black holes of a certain size.

2.5. The Importance of Using Intensity Transformation

In segmentation, we are looking for methods that eliminate background objects and prevent the removal of target object pixels. The use of the intensity transformation method by limiting the pixel intensity variation in the desired range provides more differences between different objects. Therefore, in this study, a part of the segmentation operation was performed by changing the intensity from 0 and 1 to 0 and 0.6 with applying the threshold of 95. Since image were in uint8 data class pixels were multiplied in 225.

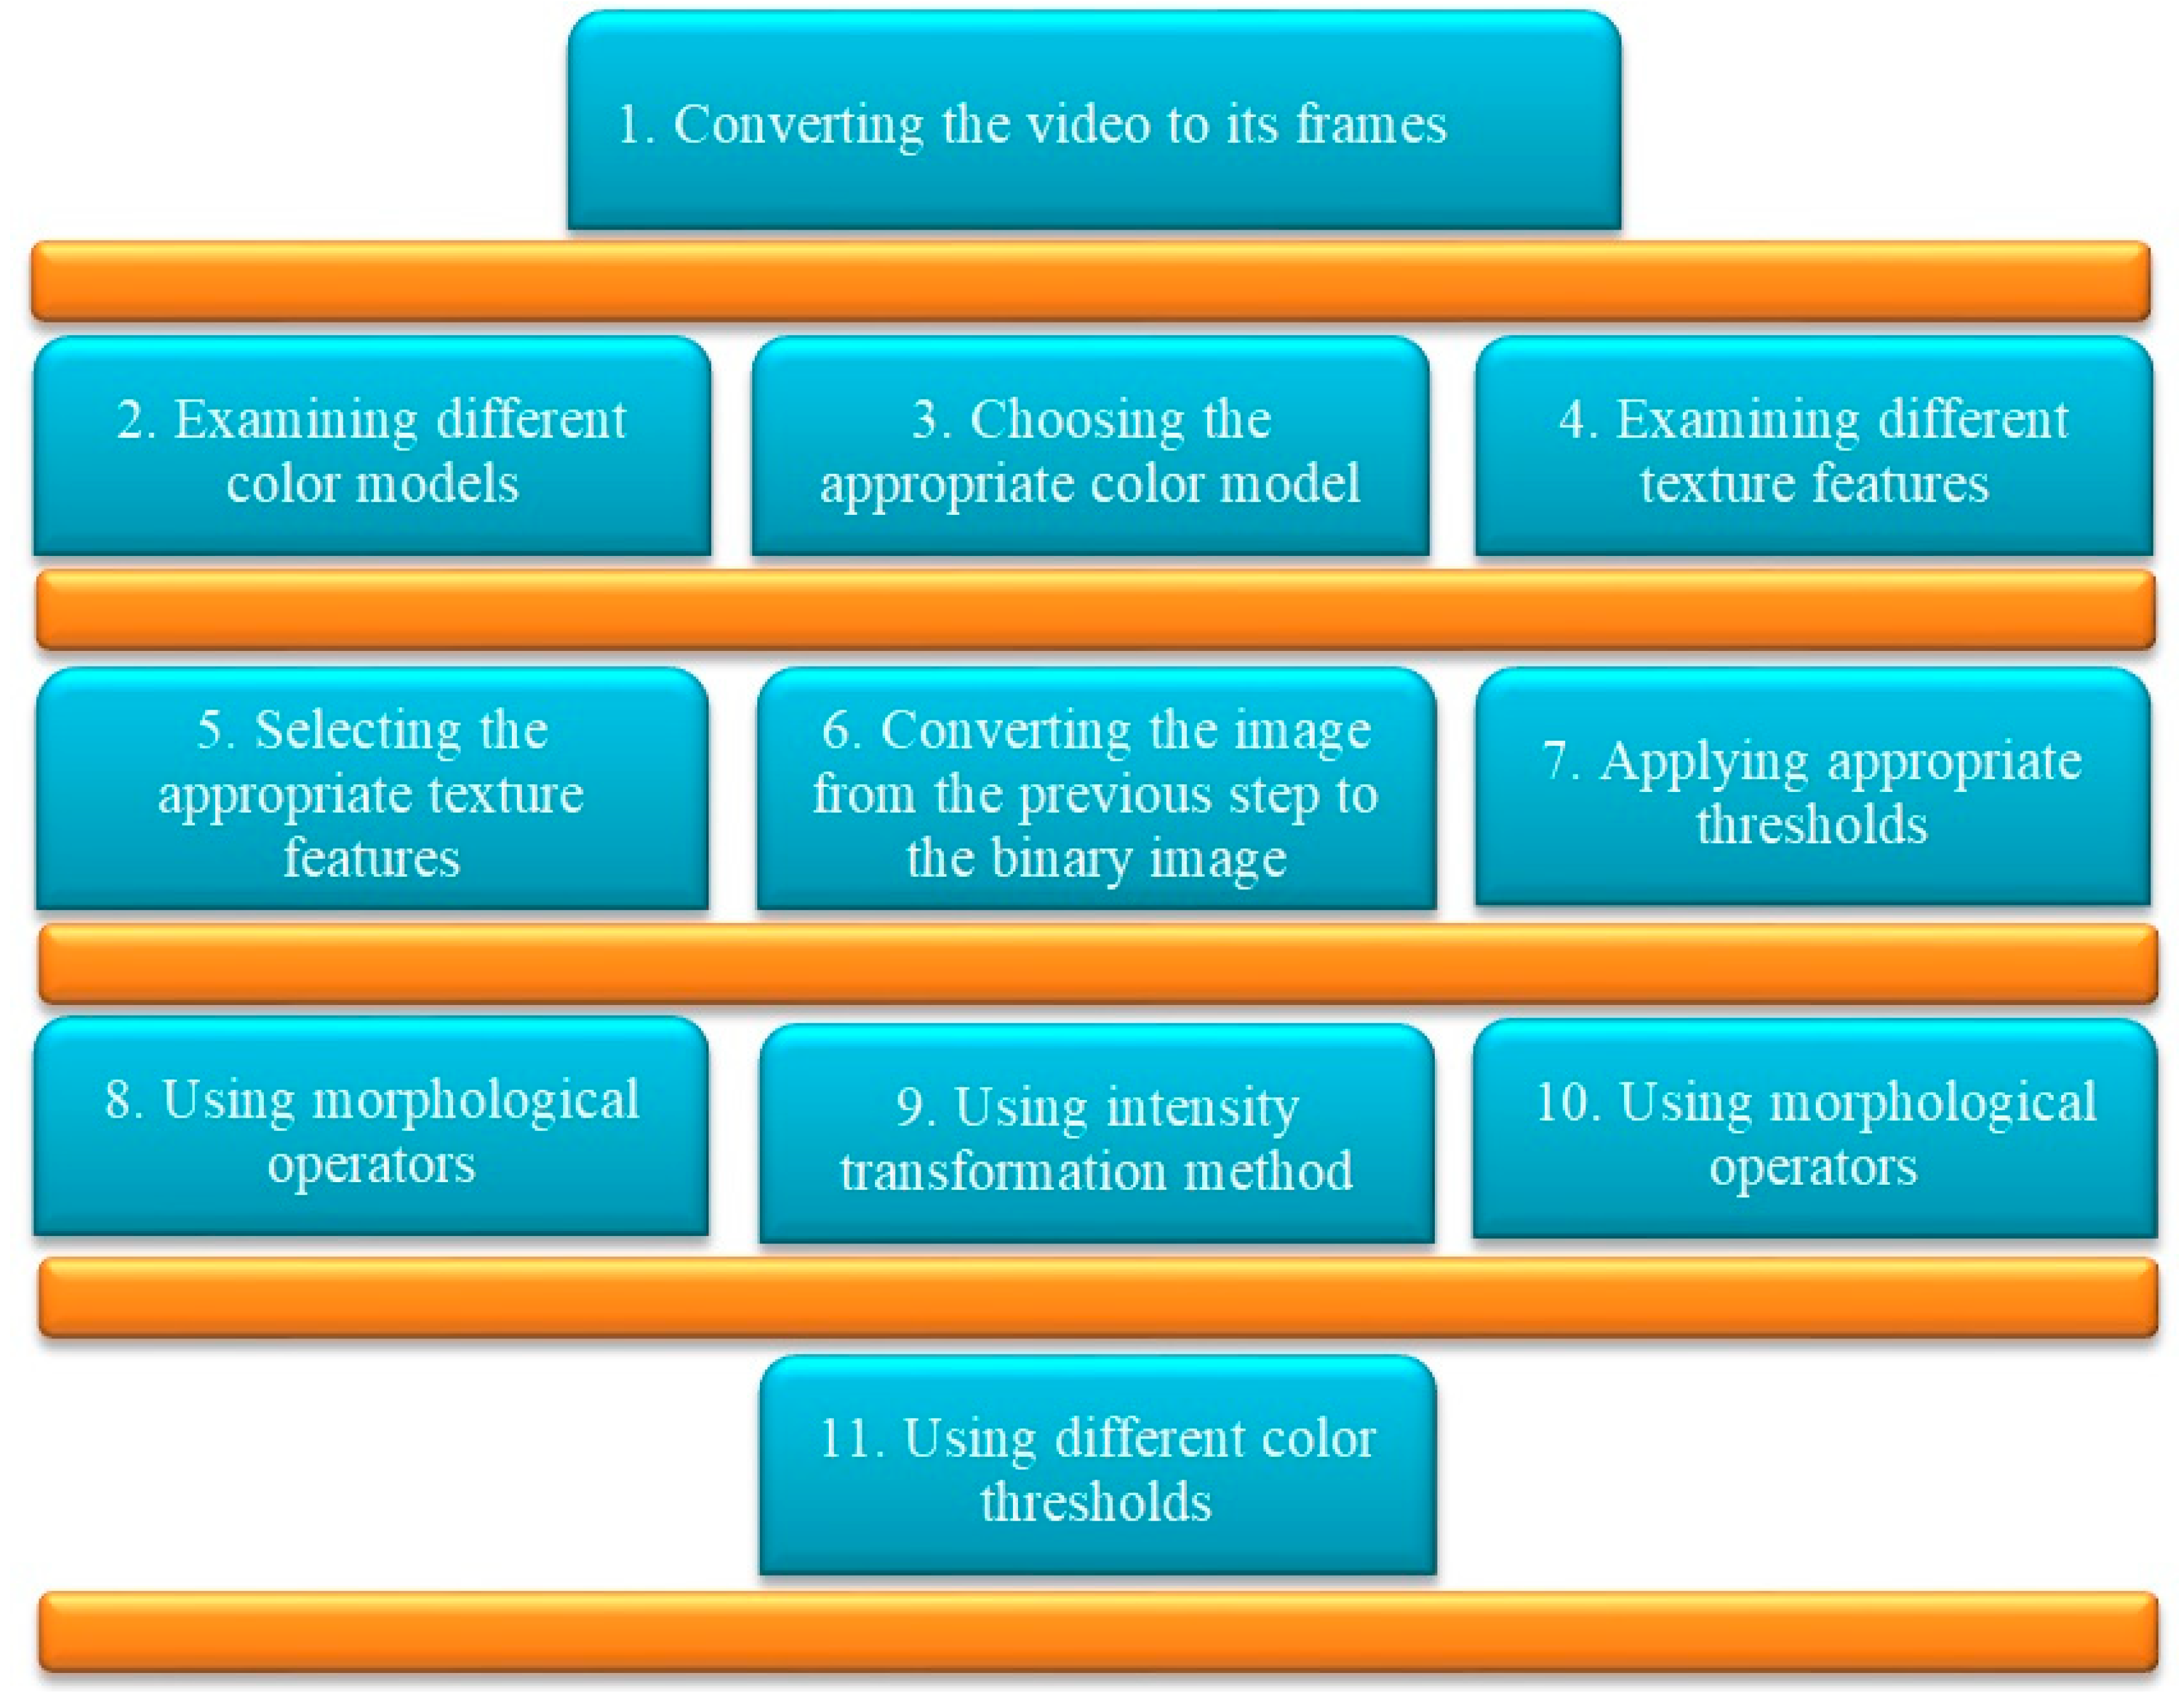
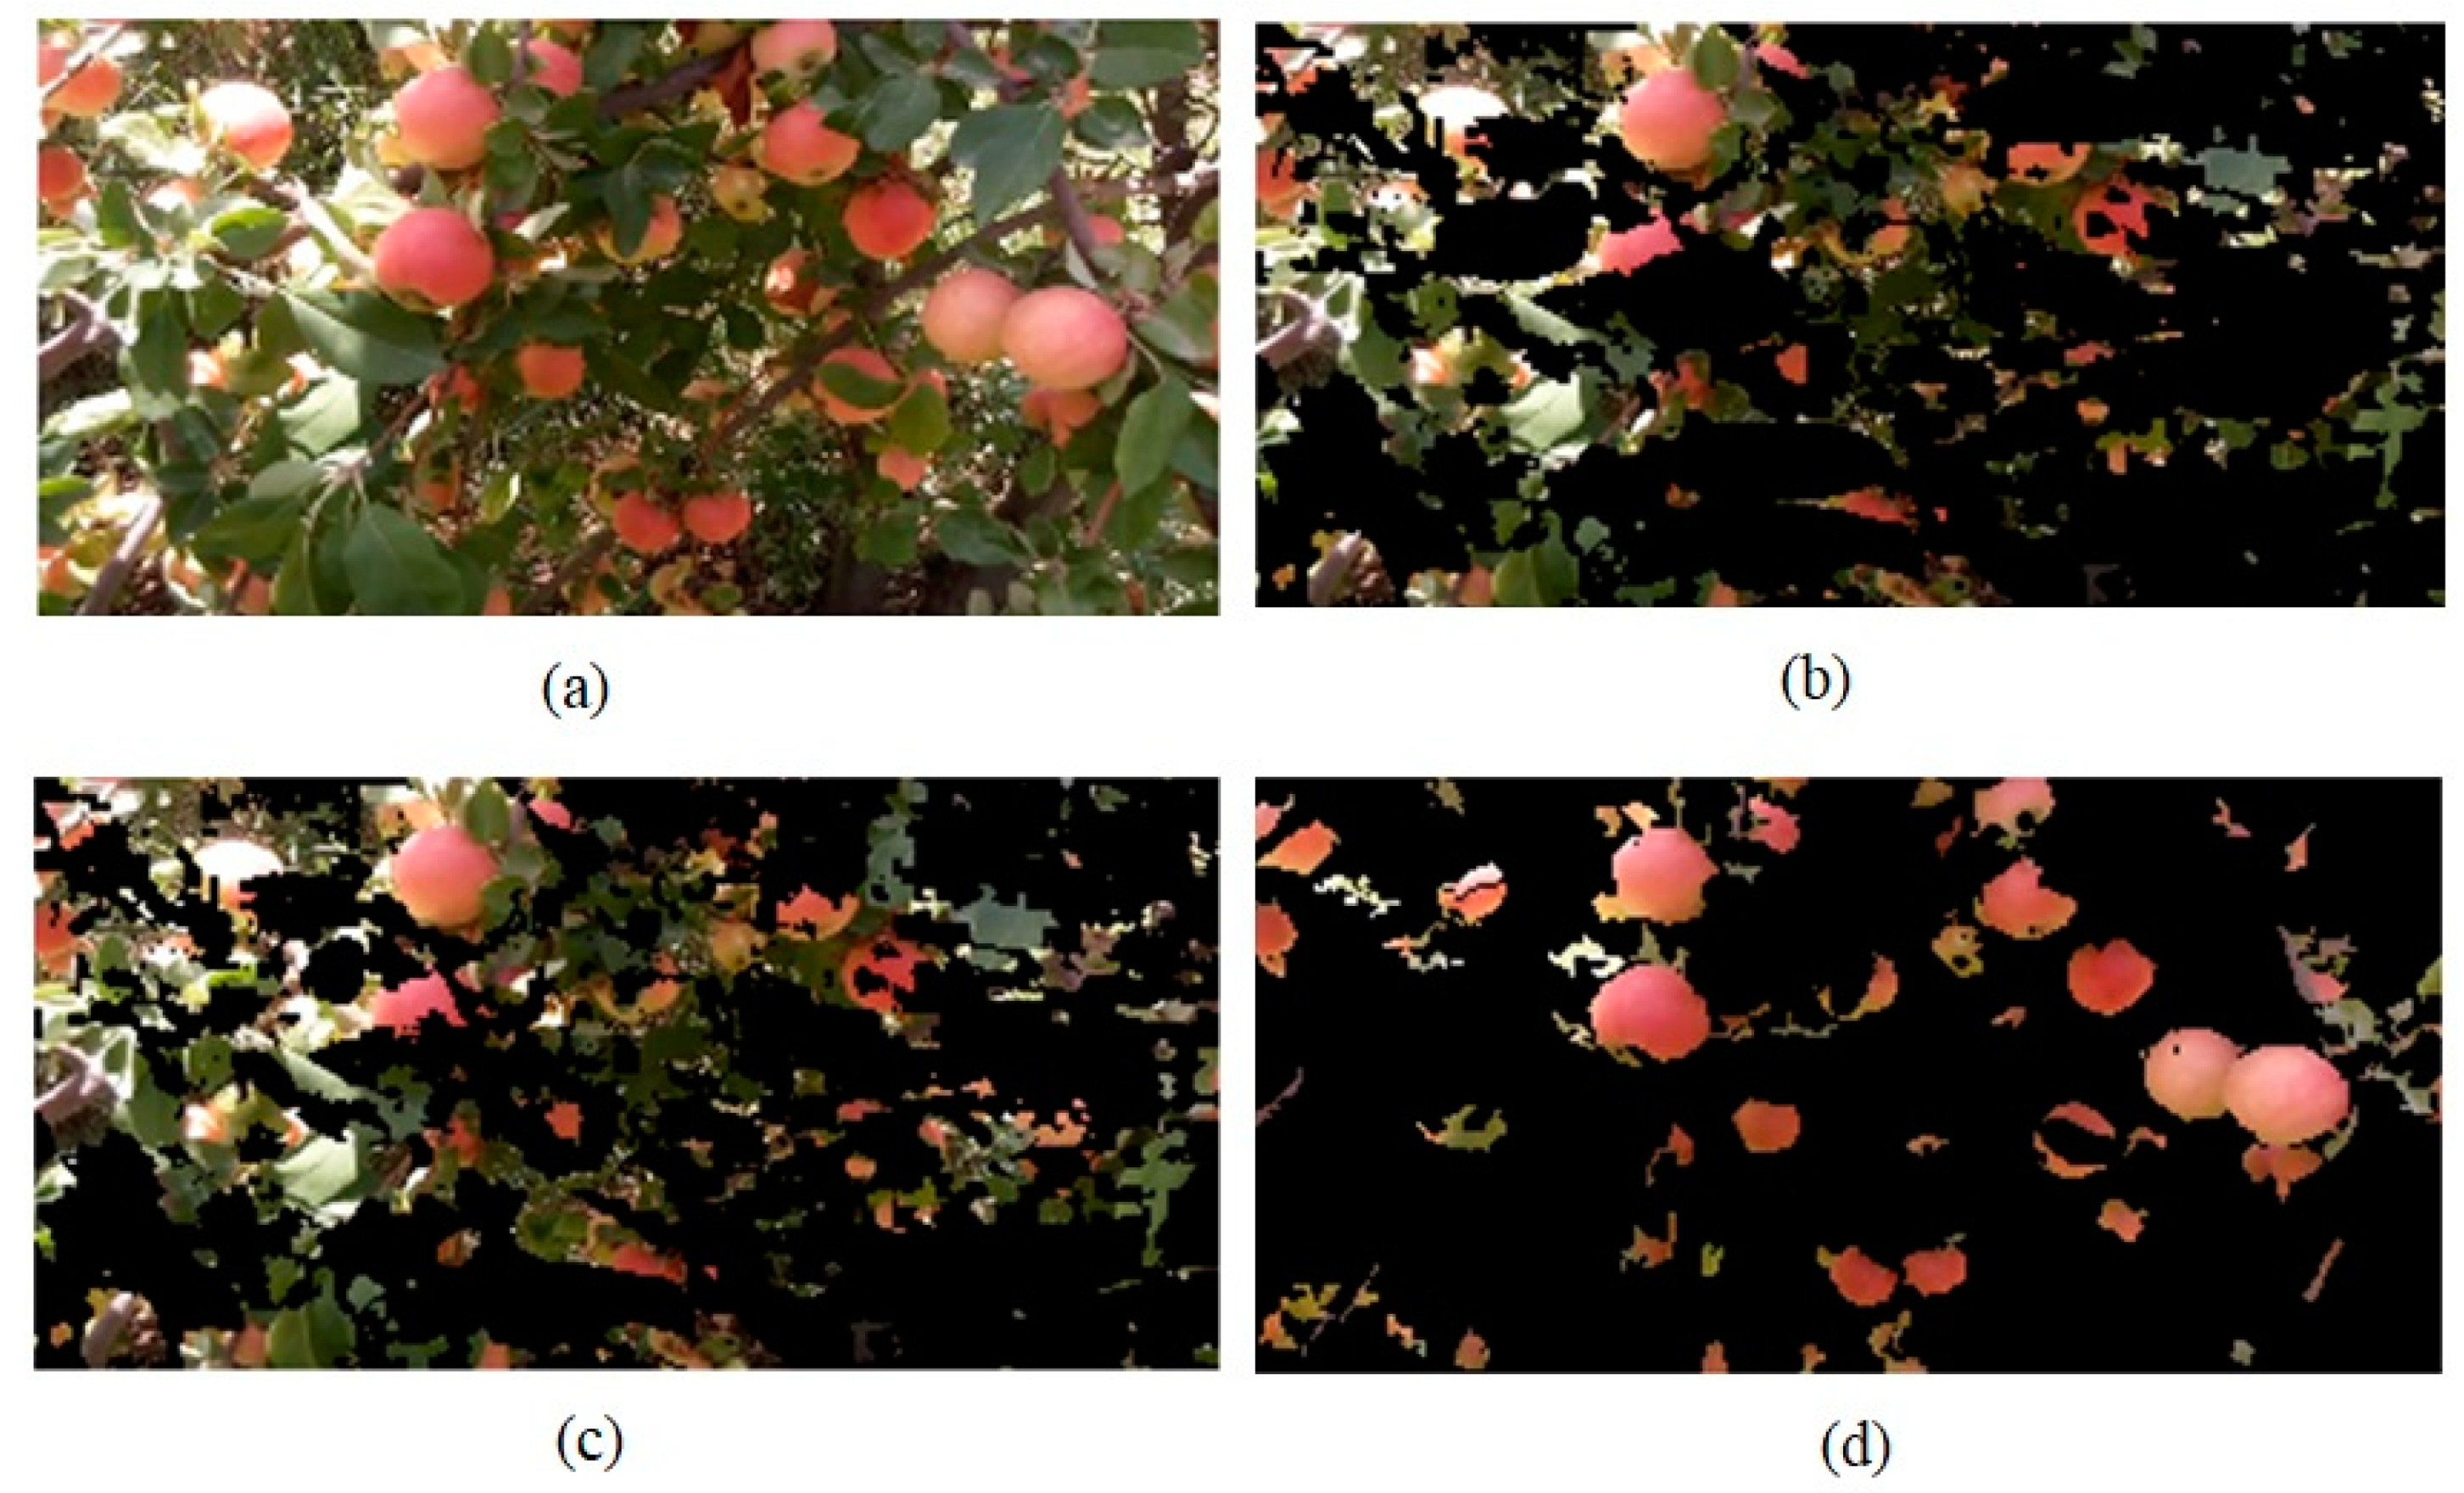
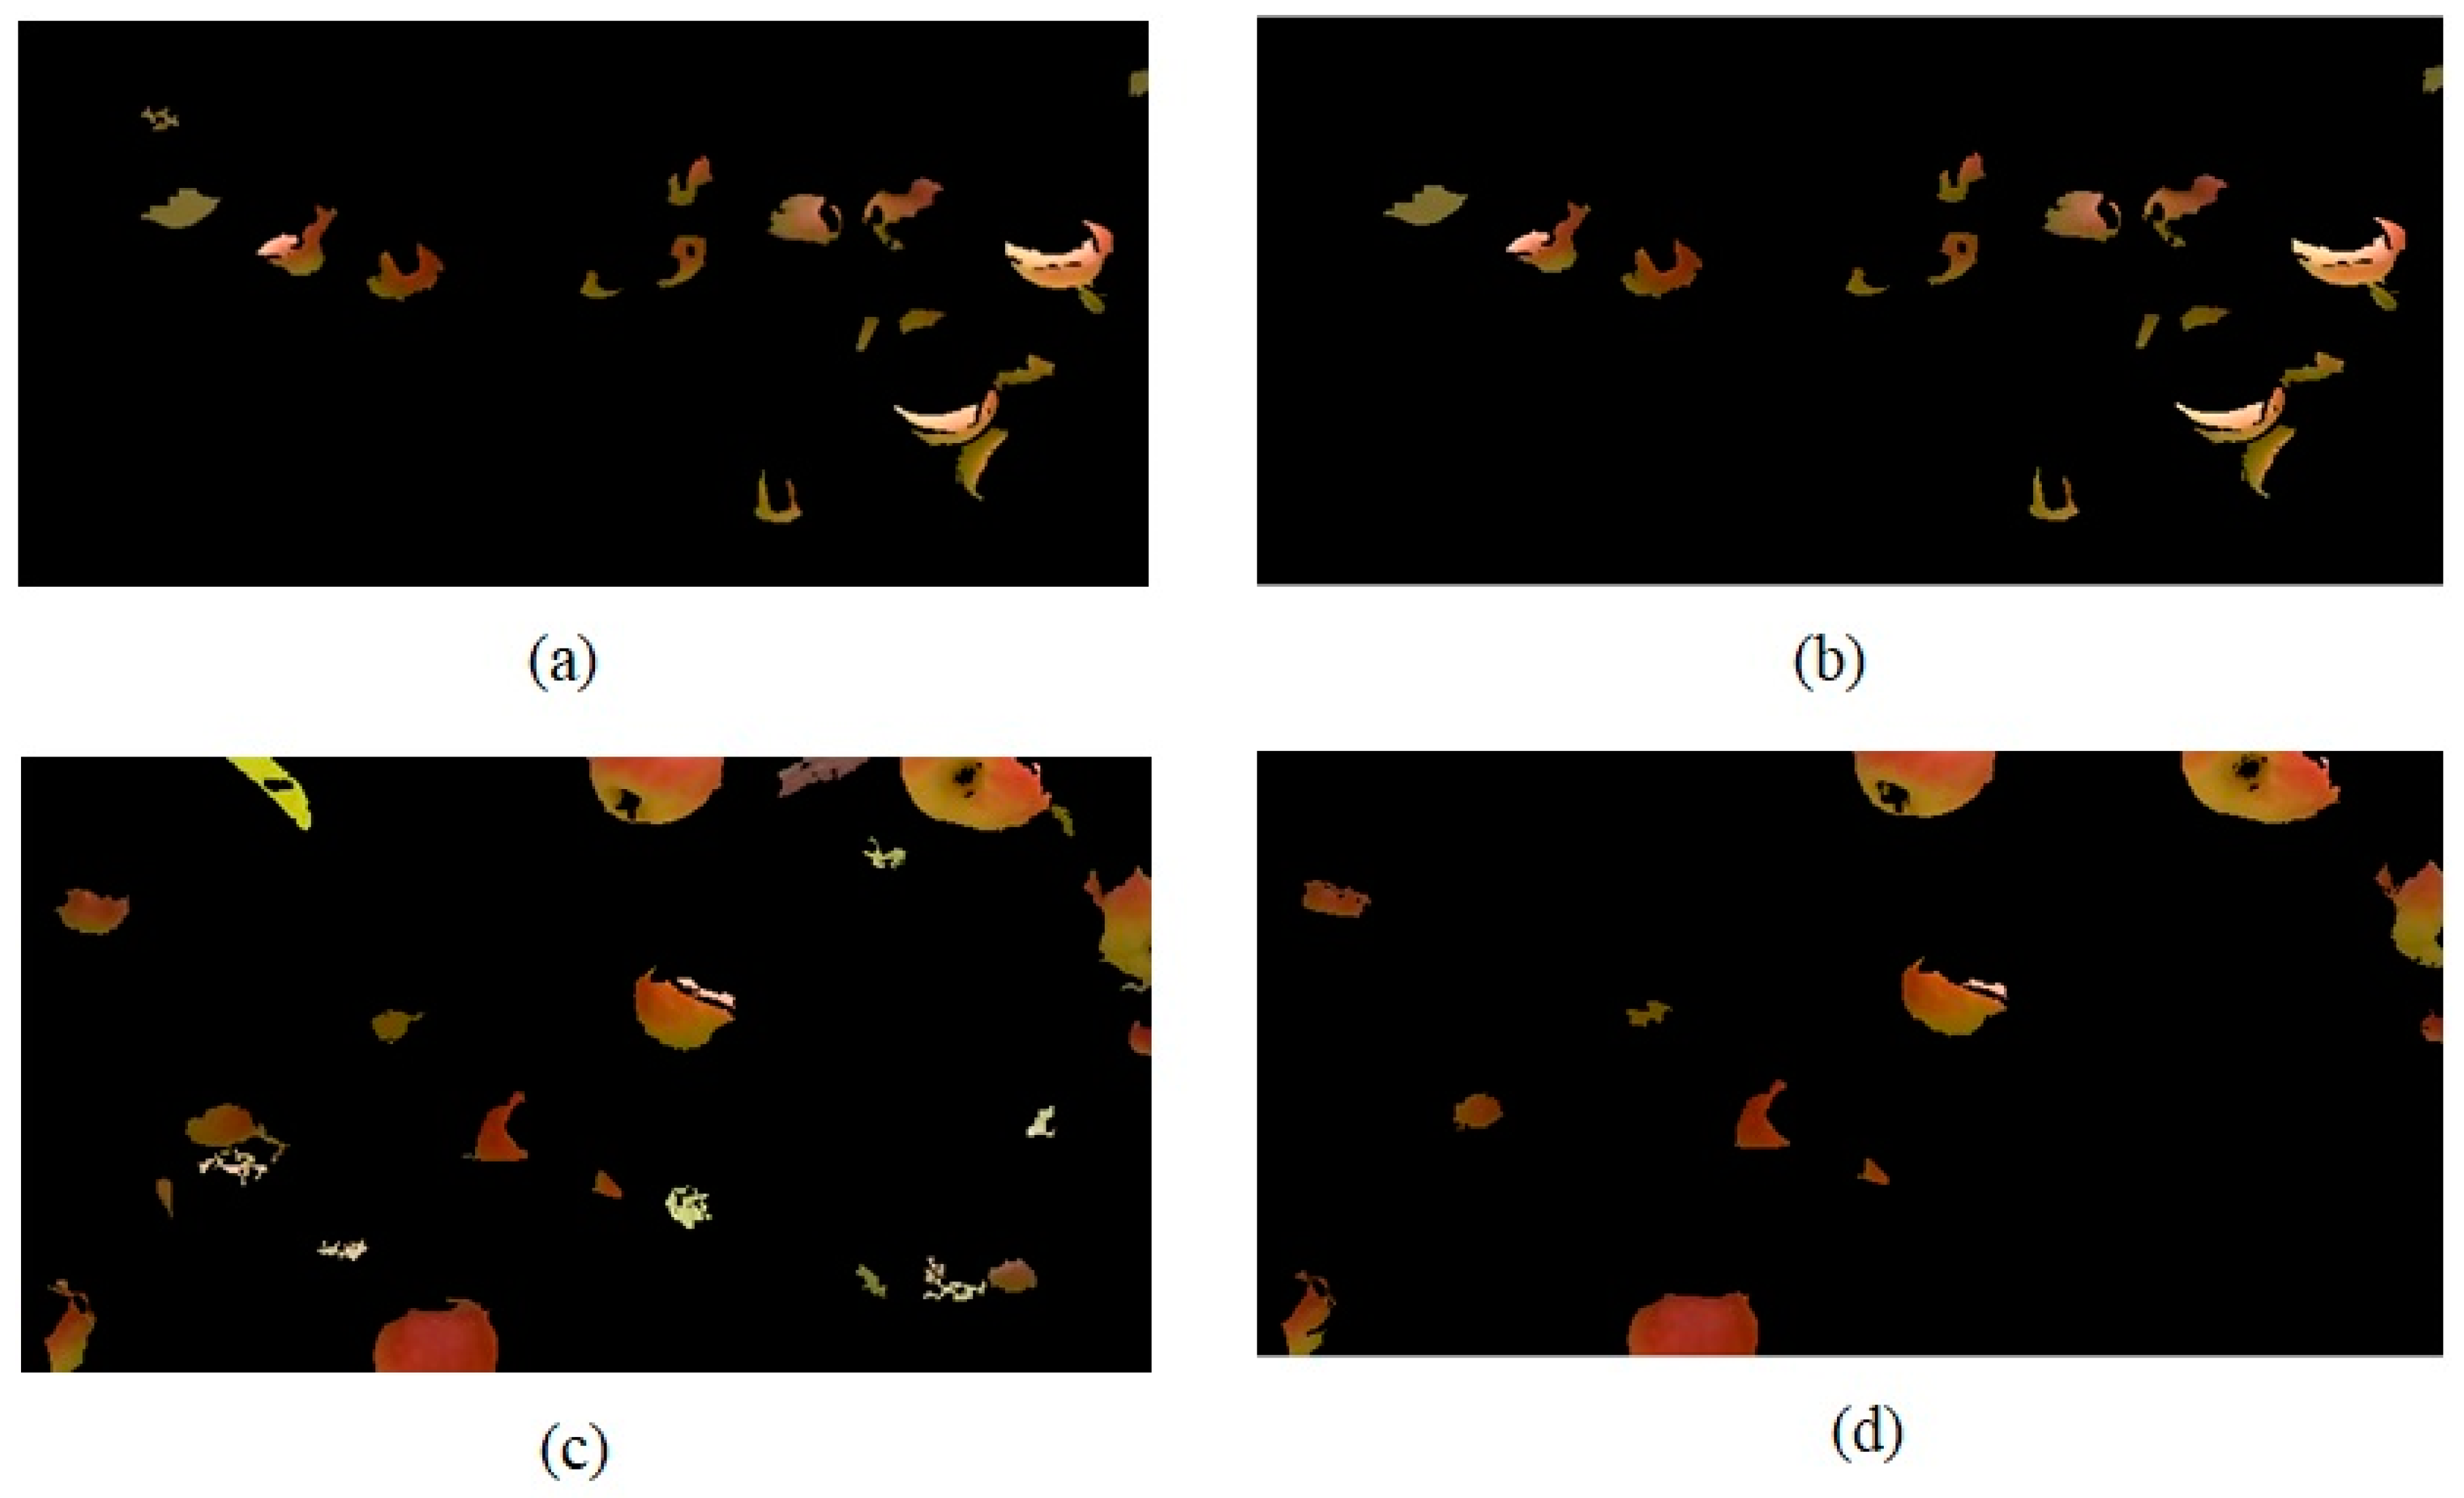
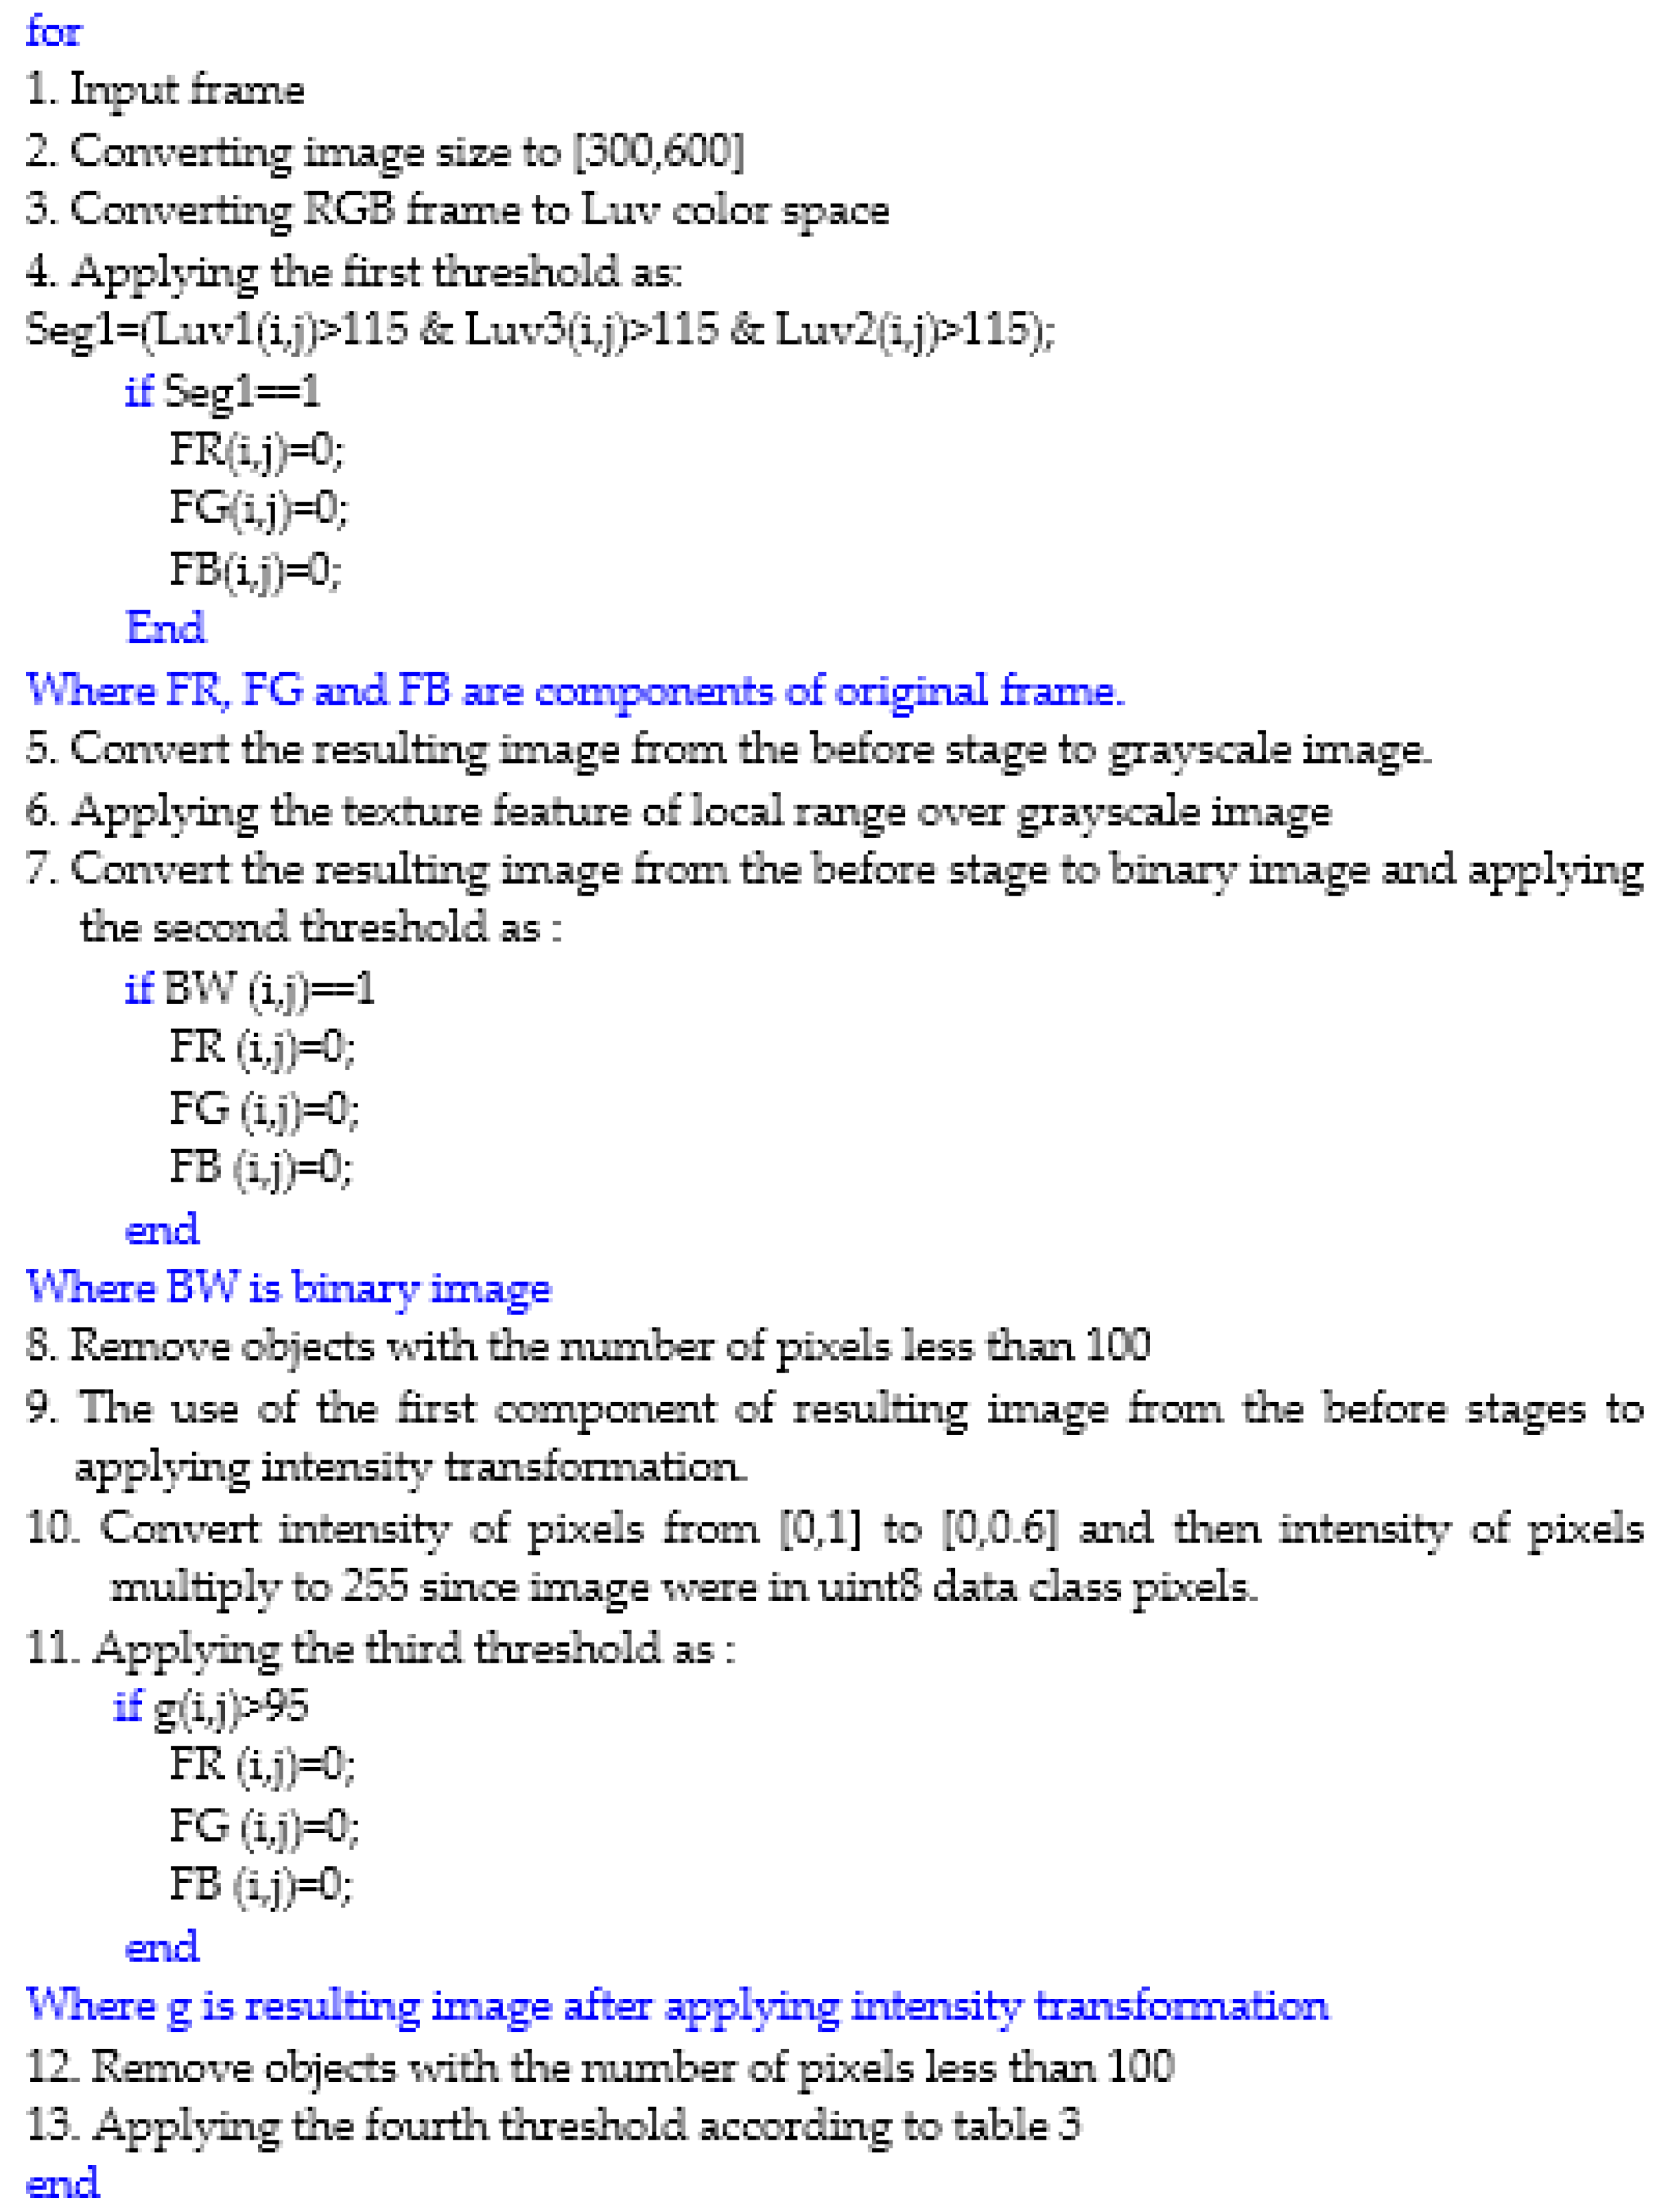
2.6. Different Stages in the Elaboration of Segmentation Algorithm

In Figure 1 shows the main steps in creating a segmentation algorithm. As observed, there are 11 main stages in this algorithm.

3. Results and Discussion

3.1. The Most Suitable Color Model for the First Stage of Segmentation

In Figure 2 shows a sample image in six different color models. As observed, objects in different color models have different colors. The most suitable color space for segmentation is the color space with a minimum number of colors and the display of all the objects in the image, because there is the possibility of using threshold or thresholds with a very high accuracy. These images show that the worst color model is the LCH because it shows almost all the objects of the image in white. Other color models expect Luv have shown different objects with a large number of colors, which causes applying the threshold be difficult. The Luv color model has been able to represent various objects in the image with almost three colors. In fact, in this image, the leaves are shown in purple color, which led to performing a part of the segmentation based on this feature. Finally, using trial and error, it was determined that if all the pixel components in the image of the Luv color model are more than 115, then those pixels are related to the background and should be deleted.

3.2. Texture Feature with High Performance in the Second Segmentation Process

Figure 3 illustrates the results of applying the three features of texture of local range, local entropy and local standard deviations. As observed, the images extracted from the local range and local standard deviation methods are very similar expect that the edges of the objects in the image resulted from the local area is darker. The images from these two methods represent more objects compared with the local entropy method. Therefore, finally, the image resulted from applying the texture feature of local range was studied as the target image to apply another step of the segmentation. In fact, this image converted into a binary image, and then segmentation was performed by applying the threshold 1. This threshold means that if the image pixels have a value equal to 1, those pixels belong to the background and should be deleted.

3.3. Intensity Transformation Performance in the Third Step of Segmentation

Figure 4 shows an image of the intensity transformation performance. Figure 4a shows the main studied image. As observed, this image has various objects such as green leaves in the shade, green leaves in the sun, soil, green plants in the shade, green plants in the sun, tiny branches, thick branches, tree trunks, and others. Figure 4b shows the image segmented in the two previous steps by color and texture methods. As observed, most of the relevant branches and trunks of trees remained without any change. Figure 4c shows the image of the intensity transformation. Eventually, by applying thresholds 95 on image Figure 4c, the image shown in Figure 4d was obtained. By comparing this image and the image of Figure 4b, it is clear that many parts of the trunk and branches have been deleted.

3.4. The Performance of Segmentation Algorithm in Different Modes of Ordering Color, Texture, Intensity Transformation Methods

One of the innovations of this research is to arrange the sequence of different segmentation methods. Figure 5 shows three different sequences of texture, color, and intensity transformation methods. Figure 5a shows the original image. Figure 5b shows the image segmented before applying the color thresholds with the sequence of the texture method, the color method and the intensity transformation method. As observed, the segmentation accuracy is very low, and many of the relevant apple segments have been deleted, while many background pixels are remained. Figure 5c shows the segmented image of Figure 5a with the sequence of the intensity transformation method, the texture method and the color method. This sequence of methods has better performance than the previous one, but in general, it has a low accuracy. Figure 5d shows the segmented image of the segmentation algorithm with the sequence of the color method, the texture method and the intensity transformation method. As observed, the algorithm has a very good performance. In fact, by using this sequence, a large part of the background was removed and the pixels of the apple were not deleted.

3.5. Applying Thresholding Function to Complete the Segmentation Process

After completing the first part of the segmentation, which involves applying thresholds using different methods and the sequence of the methods in the segmentation algorithm, it is necessary to implement the second part of the segmentation to complete the segmentation process due to the presence of small objects in the background. Due to the sensitivity of the work, in this study, a thresholding function related to RGB color space channels were used for final segmentation in a comprehensive segmentation algorithm by exact study of frames and considerations so as to not remove apple pixels. After survey different images in light different conditions such as shadow and sunny modes as well as various objects on the trees, 10-color threshold for function training were select. In fact, this function is based on pixel. Each pixel survey individually and the values of RGB color space components compare with 10-color threshold. This function has two outputs: 0 and 1. When the output is 0, it means that pixel is related to background and when the output is 1 it means that pixel is related to apples. These thresholds have been shown in Table 3. Figure 6 shows two sample images for displaying the performance of a number of thresholds. The target objects have been shown with bold blue lines. Other objects that are left in the images and not in the right image were removed by other thresholds.

3.6. Accuracy of Comprehensive Segmentation Algorithm

Table 4 shows the average percentage of background pixels removed by each segmentation method in comprehensive segmentation algorithm. This table shows that the highest percentage of background pixels removed is related to the method of threshold in Luv color space with value 36%. As this table shows, no single method can do segmentation operations alone. Therefor a combination of different method is need for segmentation with high accuracy. The combination of different segmentation techniques and their arrangement can be considered as an innovation. Table 5 shows the confusion matrix of thresholding function. As this table shows the error of this segmentation method is less than 0.8.
Table 6 shows the confusion matrix and the percentage of the total detection of the proposed segmentation algorithm. As observed, objects in the images are divided into two classes of apple and background objects. This table shows that 324 samples out of 42,750 apple samples are mistakenly located in the background objects class by the segmentation algorithm, so the segmentation algorithm has 0.758% error in this class. This algorithm also mistakenly classified 691 samples of the objects in the background with the total members of 60125 in the apple class. This leads to a 1.15% error in segmentation algorithm for this class. Finally, the percentage of total detection of the segmentation algorithm is 99.013%. This accuracy is very good for this sample number, which proves the algorithm was configured properly.

3.7. Performance of Segmentation Algorithm

To evaluate the performance of segmentation algorithm, three criteria of sensitivity, specificity and accuracy were used. Based on definition, sensitivity expresses the wrong placement of the samples of the studied class and the specificity expresses the wrong placement of the other class samples in the studied class. Finally, the accuracy is the percentage of total placement of the correct samples in their classes. These three criteria are expressed using Equations 1 to 3.
Sensitivity   =   TP TP + FN
Specificity   =   TN FP + TN
Accuracy = TP + TN TP + TN + FP + FN
TP is the number of samples of each class that are correctly classified; TN is the number of samples on the main diameter of the confusion matrix minus the number of samples of the studied classes. FN is the sum of the horizontal samples of the class examined minus the number of samples of the studied class. Finally, FP is the sum of the vertical samples of the studied class minus the number of samples of the same class [13]. In Table 7 shows the results of the performance criteria of segmentation algorithm. Based on this table, it is shown that the highest sensitivity is related to the apple class with the value of 99.242 percent and the highest specificity is related to the class of background objects with a value of 99.458 percent. In Figure 7 shows a pseudo code of segmentation algorithm. In pseudo code explain final segmentation algorithm in 13 stages.

3.8. The Speed of the Segmentation Algorithm

The system used to analyze, run the segmentation algorithm and detect background objects and apples was a laptop with Intel Core i3 CFI processor, 330M at 2.13 GHz, 4 GB of RAM-4GB and Windows 10. The results showed the processor speed was about 0.825 seconds for the segmentation of a frame. This speed is very good for this research because the background of the frames was very complex and full of different objects. After presenting the segmentation algorithm and reviewing the performance of the algorithm, it is necessary to compare the results with the results of other researchers. Due to the novelty of the proposed method as well as the different filming conditions, there is no possibility for direct comparison of the results. However, two studies, conducted by Zhao et al. [14] and Aquino et al. [15] were used to compare the proposed method. Zhao et al. [14] provided a method for detecting immature green citrus in citrus gardens. Aquino et al. [15] proposed a segmentation-based method for counting the number of grape cubes associated with a cluster in color images and in controlled light conditions. The results of this study are shown in Table 8. As Table 8 shows, the proposed method in this study with a higher number of samples than the other two studies has a higher detection rate.
After comparing with other research, we mention advantages of the proposed method. The advantages are: 1. High process speed; 2. High accuracy; 3. Usability in natural conditions of the orchard; 4. Usability in different orchards; 5. Usability in segmentation of different fruit within trees in orchard. This algorithm can be used for different purposes such as: 1. The use in fruit picking robots with emphasis on apple fruit; 2. The use in automatic systems to estimation of fruit yields with emphasis on apple fruit; 3. The use in automatic systems to survey fruits in grow stags with emphasis on apple fruit.

4. Conclusions

In this study, a new method was developed for segmentation of apple fruits on trees under natural light conditions without using any artificial background with emphasis on video processing. The most important results are:
  • The most important challenges for the development of segmentation algorithm were the presence of different objects with different colors in a background. For example, a number of these objects include trees trunk in the shade, trunks of trees in the sun, tiny brunches in the shade, tiny brunches in the sun, tiny branches connected to trunks, green leaves in the sun, green leaves in the shade, pestle leaves, green plants, yellow plants, cloudy sky, sunny sky, artificial objects such as nylon, baskets, harvested apples, flakes and so on.
  • Appropriate color model among 17 color models examined was Luv. In fact, this model eliminates many leaves in the first stage.
  • The proper feature for performing the second stage of segmentation among the three texture features of local range, local entropy and local standard deviation was the local range.
  • The use of the intensity transformation method eliminated a large part of the pixels related to the trunk and tree branches.
  • The use of morphological operators in different stages of segmentation is necessary.
  • The use of color thresholds in the final stage of segmentation eliminates objects that have remained in the previous stages.
  • Results showed that the percentage of total detection of segmentation algorithm was 99.013%.
  • The highest sensitivity was related to apple class with the value of 99.242% and the highest specificity was related to the class of background objects with a value of 99.458%.
  • The results showed that the processor speed was about 0.825 seconds for the segmentation of a frame.
For future work, a fruit recognition system should be implemented and vegetables to improve recognition functionality and flexibility for wider use.
The process should be improved by extending its functions to process and recognize more variety of different fruit images. Besides that, a texture-based analysis technique could be combined with the existing three features analysis technique on the system in order to gain better discerning of different fruit images.

Author Contributions

Conceptualization, S.S. and Y.A.-G.; methodology, S.S., Y.A.-G., F.A., R.K.; and J.L.H.-H.; software, S.S.; validation, S.S., Y.A.-G., F.A., R.K.; and J.L.H.-H.; formal analysis, S.S., and J.L.H.-H.; investigation, S.S., Y.A.-G., F.A., R.K.; and J.L.H.-H.; resources, S.S.; data curation, S.S.; writing—original draft preparation, S.S.; writing—review and editing, J.L.H.-H.; visualization, S.S.; supervision, Y.A.-G.; project administration, Y.A.-G.; funding acquisition, Y.A.-G.

Funding

This study was financially supported by Iran National Science Foundation (INSF) through the research project 96007466.

Conflicts of Interest

The authors declare no conflicts of interest. The funders had no role in the design of the study; in the collection, analyses, or interpretation of data; in the writing of the manuscript, or in the decision to publish the results.

References

  1. Guerrero, J.M.; Pajares, G.; Montalvo, M.; Romeo, J.; Guijarro, M. Support Vector Machines for crop/weeds identification in maize fields. Expert Syst. Appl. 2012, 39, 11149–11155. [Google Scholar] [CrossRef]
  2. Montalvo, M.; Guerrero, J.M.; Romeo, J.; Emmi, L.; Guijarro, M.; Pajares, G. Automatic expert system for weeds/crops identification in images from maize fields. Expert Syst. Appl. 2013, 40, 75–82. [Google Scholar] [CrossRef]
  3. Romeo, J.; Guerrero, J.M.; Montalvo, M.; Emmi, L.; Guijarro, M.; Gonzalez-De-Santos, P.; Pajares, G. Camera Sensor Arrangement for Crop/Weed Detection Accuracy in Agronomic Images. Sensors 2013, 13, 4348–4366. [Google Scholar] [CrossRef] [PubMed] [Green Version]
  4. Arroyo, J.; Guijarro, M.; Pajares, G. An instance-based learning approach for thresholding in crop images under different outdoor conditions. Comput. Electron. Agric. 2016, 127, 669–679. [Google Scholar] [CrossRef]
  5. Hamuda, E.; Glavin, M.; Jones, E. A survey of image processing techniques for plant extraction and segmentation in the field. Comput. Electron. Agric. 2016, 125, 184–199. [Google Scholar] [CrossRef]
  6. Bai, X.; Cao, Z.; Wang, Y.; Yu, Z.; Hu, Z.; Zhang, X.; Li, C. Vegetation segmentation robust to illumination variations based on clustering and morphology modelling. Biosyst. Eng. 2014, 125, 80–97. [Google Scholar] [CrossRef]
  7. Hernández-Hernández, J.; Ruiz-Hernández, J.; García-Mateos, G.; González-Esquiva, J.; Ruiz-Canales, A.; Molina-Martínez, J. A new portable application for automatic segmentation of plants in agriculture. Agric. Water Manag. 2017, 183, 146–157. [Google Scholar] [CrossRef]
  8. Tang, J.; Miao, R.; Zhang, Z.; He, D.; Liu, L. Decision support of farmland intelligent image processing based on multi-inference trees. Comput. Electron. Agric. 2015, 117, 49–56. [Google Scholar] [CrossRef]
  9. Liu, X.; Zhao, D.; Jia, W.; Ruan, C.; Tang, S.; Shen, T. A method of segmenting apples at night based on color and position information. Comput. Electron. Agric. 2016, 122, 118–123. [Google Scholar] [CrossRef]
  10. Gonzalez, R.C.; Woods, R.E.; Eddins, S.L. Digital Image Processing Using MATLAB; Prentice Hall: Upper Saddle River, NJ, USA, 2004. [Google Scholar]
  11. Hernández-Hernández, J.; García-Mateos, G.; González-Esquiva, J.; Escarabajal-Henarejos, D.; Ruiz-Canales, A.; Molina-Martínez, J. Optimal color space selection method for plant/soil segmentation in agriculture. Comput. Electron. Agric. 2016, 122, 124–132. [Google Scholar] [CrossRef]
  12. Li, Y.; Zuo, M.J.; Lin, J.; Liu, J. Fault detection method for railway wheel flat using an adaptive multiscale morphological filter. Mech. Syst. Signal Process. 2017, 84, 642–658. [Google Scholar] [CrossRef]
  13. Wisaeng, K. A comparison of decision tree algorithms for UCI repository classification. Int. J. Eng. Trends Technol. 2013, 4, 3397–3401. [Google Scholar]
  14. Zhao, C.; Lee, W.S.; He, D. Immature green citrus detection based on colour feature and sum of absolute transformed difference (SATD) using colour images in the citrus grove. Comput. Electron. Agric. 2016, 124, 243–253. [Google Scholar] [CrossRef]
  15. Aquino, A.; Diago, M.P.; Millán, B.; Tardáguila, J. A new methodology for estimating the grapevine-berry number per cluster using image analysis. Biosyst. Eng. 2017, 156, 80–95. [Google Scholar] [CrossRef]
Figure 1. Different stages in the development of segmentation algorithm.
Agriculture 09 00104 g001
Figure 2. Sample image in six different color models. (a): RGB color model, (b): Improvement YCbCr color model, (c): LCH color model, (d): HSL color model, (e): HSI color model, (f): Luv color model.
Agriculture 09 00104 g002
Figure 3. Texture feature with high performance in the second segmentation process. (a): The original image, (b): The image obtained by applying the local range feature, (c): The image obtained by applying the local entropy feature, (d): The image obtained by applying the local standard deviation feature.
Agriculture 09 00104 g003
Figure 4. Intensity transformation performance in the third step of segmentation. (a): Original image, (b): Image segmented before this step, (c): Image corresponding to intensity transformation, (d): Image segmented after applying the threshold on the image of the intensity transformation.
Agriculture 09 00104 g004
Figure 5. The performance of segmentation algorithm in different modes of ordering color, texture, intensity transformation methods. (a) Original image. (b) The resulting image after applying the sequence of the texture method, the color method and the intensity transformation method. (c) The resulting image after applying the sequence of the intensity transformation method, the texture method, the color method. (d) The image obtained after applying the sequence of the color method, the texture method, the intensity transformation method.
Agriculture 09 00104 g005
Figure 6. Applying different color thresholds to complete the segmentation process, (a): The image before applying threshold, (b): The image after applying threshold 6 in Table 3, (c): The image before applying threshold, (d): The image after applying threshold 5 in Table 3.
Agriculture 09 00104 g006
Figure 7. A pseudo code of final segmentation algorithm.
Agriculture 09 00104 g007
Table 1. Characteristics of video studied.
NumberParameterTime/Number
1Filming timeMore than 12 minutes
2Extracted frames22,001
3Training frames15,401 (70% of all frames)
4Testing frames6,600 (30% all frames)
5Background objects in test mode60,125
6Number of apples in test mode42,750
Table 2. Various color models examined.
NumberColor ModelNumberColor ModelNumberColor Model
1RGB7HSI13YPbPr
2HSV8Improved YCbCr14YUV
3YIQ9L*a*b*15HSL
4YCbCr10JPEG-YCbCr16XYZ
5CMY11YDbDr17Luv
6LCH12CAT02 LMS
Table 3. Different thresholds to remove background pixels remaining from previous steps.
NumberThresholds
1FR(i,j)>90 & FR(i,j)<=110 & FG(i,j)>55 & FG(i,j)<80 & FB(i,j)>40 & FB(i,j)<62 & abs(FG(i,j) − FB(i,j))<20;
2FR(i,j)>92 & FR(i,j)<=102 & FG(i,j)>82 & FG(i,j)<94 & FB(i,j)>20 & FB(i,j)<35 & abs(FR(i,j) − FG(i,j))<15;
3FR(i,j)>115 & FR(i,j)<=130 & FG(i,j)>100 & FG(i,j)<115 & FB(i,j)>49 & FB(i,j)<55 & abs(FR(i,j) − FG(i,j))<20;
4FR(i,j)>102 & FR(i,j)<=125 & FG(i,j)>85 & FG(i,j)<105 & FB(i,j)>35 & FB(i,j)<60 & abs(FR(i,j) − FG(i,j))<25;
5FR(i,j)>98 & FR(i,j)<=108 & FG(i,j)>82 & FG(i,j)<90 & FB(i,j)>22 & FB(i,j)<38 & abs(FR(i,j) − FG(i,j))<25;
6FR(i,j)>120 & FR(i,j)<=128 & FG(i,j)>110 & FG(i,j)<118 & FB(i,j)>40 & FB(i,j)<55 & abs(FR(i,j) − FG(i,j))<15;
7FR(i,j)>190 & FR(i,j)<=202 & FG(i,j)>179 & FG(i,j)<190 & FB(i,j)>48 & FB(i,j)<53 & abs(FR(i,j) − FG(i,j))<20;
8FR(i,j)>100 & FR(i,j)<=110 & FG(i,j)>75 & FG(i,j)<90 & FB(i,j)>68 & FB(i,j)<82 & abs(FG(i,j) − FB(i,j))<15;
9FR(i,j)>=142 & FR(i,j)<=167 & FG(i,j)>=120 & FG(i,j)<139 & FB(i,j)>=67 & FB(i,j)<97 & abs(FR(i,j) − FG(i,j))<30;
10FR(i,j)>=95 & FR(i,j)<=115 & FG(i,j)>=49 & FG(i,j)<70 & FB(i,j)>=25 & FB(i,j)<50 & abs(FG(i,j) − FB(i,j))<25;
Table 4. The average percentage of background pixels removed by each segmentation method.
Main Segmentation MethodsThe Average Percentage of Background Pixels Removed by Each Method
The use of threshold in Luv color space36
The use of texture feature26
The use of morphological operators23
The use of thresholding function15
Table 5. Confusion matrix of thresholding function. Classes correspond to: 1: Apple object pixels, 2: Background object pixels.
Predicted/Real Class12All DataClassification Error by Class (%)Classification Accuracy (%)
152,13942952,5680.81699.20%
238949,12349,5120.785
Table 6. Confusion matrix and total percentage of proposed segmentation algorithm.
ClassApplesBackground ObjectsAll DataTotal Percentage of Wrong DiagnosisTotal Percentage of Correct Diagnosis
Apples42,42632442,7500.75899.013%
Background objects69159,43460,1251.15
Table 7. Results of performance criteria of segmentation algorithm.
ClassSensitivityAccuracySpecificity
Apples99.24299.01398.397
Background objects98.85199.01399.458
Table 8. Comparison of the results obtained in this study with two other studies.
MethodNumber of SamplesCorrect Detection Rate (Percent)
Proposed method102,875 (test data)99.013
[14]6883
[15]15295.72

