Article

Effect of Heavy Rainfall Events on the Dry Matter Yield Trend of Whole Crop Maize (Zea mays L.)

1
Institute of Animal Resources, Kangwon National University, Chuncheon 24341, Korea
2
College of Animal Life Sciences, Kangwon National University, Chuncheon 24341, Korea
3
Department of Animal Industry Convergence, College of Animal Life Sciences, Kangwon National University, Chuncheon 24341, Korea
*
Author to whom correspondence should be addressed.
Agriculture 2019, 9(4), 75; https://doi.org/10.3390/agriculture9040075
Submission received: 18 March 2019 / Revised: 8 April 2019 / Accepted: 9 April 2019 / Published: 11 April 2019

Abstract

:
The objective of this study was to detect the historical dry matter yield (DMY) trend and to evaluate the effects of heavy rainfall events on the observed DMY trend of whole crop maize (WCM, Zea mays L.) using time-series analysis in Suwon, Republic of Korea. The climatic variables corresponding to the seeding to harvesting period, including the growing degree days, mean temperature, etc., of WCM along with the DMY data (n = 543) during 1982–2011, were used in the analysis. The DMY trend was detected using Autoregressive Integrated Moving Average with the explanatory variables (ARIMAX) form of time-series trend analysis. The optimal DMY model was found to be ARIMAX (1, 1, 1), indicating that the DMY trend follows the mean DMY of the preceding one year and the residual of the preceding one year with an integration level of 1. Furthermore, the SHGDD and SHHR were determined to be the main variables responsible for the observed trend in the DMY of WCM. During heavy rainfall events, the DMY was found to be decreasing by 4745.27 kg/ha (p < 0.01). Our analysis also revealed that both the intensity and frequency of heavy rainfall events have been increasing since 2005. The forecasted DMY indicates the potential decrease, which is expected to be 11,607 kg/ha by 2045. This study provided us evidence for the correlation between the DMY and heavy rainfall events that opens the way to provide solutions for challenges that summer forage crops face in the Republic of Korea.

1. Introduction

According to the fifth Assessment Report of the Intergovernmental Panel on Climate Change [1], the frequency of heavy precipitation events has been increasing in several regions across the world since about 1950. Furthermore, IPCC [2] reported that damages to the agricultural sector caused by heavy rainfall were more serious than damages due to a change in temperature. Agricultural productivity in the Korean Peninsula is reported to have been suffering from climate-related factors, such as heavy rainfall, flooding, and heat waves [3]. Various studies have been carried out to establish the relationship between crop yield and climatic trends. Dixon et al. [4] used a time-series approach to explain how each growth stage of maize (Zea mays L.) was impacted by climate change.
The availability of extensive climate data from the portal of the Korean weather information system led several researchers to predict the yield of forage crops in the country. Peng [5] developed a dry matter yield (DMY) prediction model of whole crop maize (WCM) using multiple regression analysis. Kim et al. [6,7] detected the casual relationship between climatic factors (growing days, temperature, and precipitation) and the yield of Italian ryegrass and whole crop barley in a natural eco-system. The predicted yield of Italian ryegrass was shown by mapping the grid layers of climatic variables on the main cultivated locations by using a geographic information system [8]. The effect of summer depression on the yield of a pasture-based forage production system has also been the area of focus in relation to trends [9]. Chemere et al. [10,11] detected the effect of climatic factors on the DMY trend of WCM and a sorghum-sudangrass hybrid using time-series analysis. Despite several climate-based models having been generated to estimate the yield of forage crops, the effect of weather events on yield trend and the extent of fluctuation in the yield of forage crops have often been overlooked.
Most time-series analyses of yield patterns are described in terms of two basic classes of components: trend and seasonality. The trend represents a general systematic linear or nonlinear component that changes over time and does not repeat or at least does not repeat within a given time range. Whilst seasonality may have a similar nature, it repeats itself in systematic intervals over time. These two classes of time-series components may coexist in any yield data, especially those produced in regions where there is high climatic variability [12]. In agricultural science, the production of maize and cultivated areas were forecasted for the year 2020 by using a time-series model [13]. The monthly trend of the price of maize was also studied in a pure first-differences fashion, and behavior of the price was identified with the various factors in future markets and/or speculation [14]. The ARIMA with explanatory variables (ARIMAX) form of time-series analysis, which is capable of estimating the effect of independent variables, has been used to detect the DMY trend of WCM with climatic variables [10]. This means that through ARIMAX, the effect of climatic variables on the trend of DMY can be estimated through fitting a regression equation to the trend. The ARIMA model can only rely on the data of the past observation to forecast the future possible scenario. Summer season climatic patterns, especially extreme drought events and precipitation patterns, have become a concern for agricultural production [15,16]. Even though the amount of rainfall is important to the growth and development of crops, excess rainfall along with the timing poses a problem for the desired yield of forage crops. From the beginning of July to the end of September, the Korean peninsula experiences a monsoon season, bringing heavy rainfall to many parts of the country [17]. This event is accompanied by floods, which are the most destructive natural hazards.
For these reasons, projections of potential future yields need to consider the weather events during the summer monsoon season like heavy rainfall. Therefore, the present study was initiated to detect the DMY trend of WCM with the effect of heavy rainfall events and forecast the DMY using time-series analysis in the Republic of Korea.

2. Materials and Methods

2.1. Data and Variables

The climate data was collected from the weather information system of the Korean Meteorological Administration via open-API (application programming interface), which contains daily temperature, rainfall amount, and sunshine duration. The WCM raw data (n = 543) was collected from research reports of new varieties of forage crops produced by Rural Development Administration during 1982–2011 in Suwon (latitude: 37° 15’ N, longitude: 127° 04’ E), with the middle region of the Republic of Korea as meta-data. The data consisted of cultivar, DMY, plant height, cultivated location, and seeding-harvesting dates. The cultivars included were DK501, Garst8285, and Kwanganok. The soil in Suwon has a loam texture which is good enough for growing WCM and also has an effective depth of 50–100 cm and gravel content of less than 0.01%.
The climate data and the WCM data in Suwon were merged to generate the dataset by referring to the seeding-harvesting dates. The climatic variables generated related to the growth and development of WCM were: growing days (GD, day), seeding-harvesting accumulated growing degree days (SHGDD), seeding-harvesting mean of temperature (SHMT, °C), seeding-harvesting rainfall amount (SHRA, mm), seeding-harvesting rainfall days (SHRD, day), and seeding-harvesting sunshine duration (SHSD, hr). The rainfall amount over 7.6 mm per hour was regarded as heavy rainfall [18]. The frequency and intensity of the rainfall were determined in accordance with the definition of rainfall described by Lee et al. [19]. Therefore, two types of rainfall characteristics were considered: the heavy rainfall events during the growing period from seeding to harvesting on a daily basis. The seeding-harvesting period heavy rainfall (SHHR) was set as a dummy variable (1: heavy rainfall, 0: normal rainfall) based on SHRA, in which case over 1000 mm of rainfall was considered to be heavy. According to Lee et al. [19], heavy rainfall with ten-day intervals in July was recorded over 1000 mm during 1980–1990. Based on the daily rainfall amount, daily heavy rainfall was also calculated to check the frequency and intensity (1: heavy rainfall over 7.6 mm per hour, 0: normal rainfall). This was used to detect the yearly change in the rainfall pattern. Furthermore, heavy rainfall on an hourly basis was categorized into four categories (7.6–10.0 mm/hr, 10.0–15.0 mm/hr, 15.0–20.0 mm/hr, and over 20.0 mm/hr).

2.2. Data Processing and Analysis Method

In the initial step, a correlation analysis was carried out to identify the effective climatic variables, along with a multicollinearity analysis of climatic variables using a variance inflation factor (VIF). Then, comparisons of DMY with rainfall events were performed via a t-test and a significance level of under 5 % was considered. Finally, the ARIMA model with an independent variable (ARIMAX) was performed to detect the DMY trend along with climatic variables that consisted of quantitative and dummy variables. The ARIMAX was used according to the following equation:
Y t = ϕ 1 Y t 1 + + ϕ p Y t p + ε t + θ 1 ε t 1 + + θ q ε t q + β 1 X t + + β r X t + γ 1 Z t + + γ s Z t + ν
where, Y t is DMY at year t; Y t p is DMY at year lag p ; ϕ is the coefficient of time lags; ε q is the white noise; q is the residual lag in moving average part; X (GD, SHGDD, SHMT, SHRA, SHRD, SHSD) and Z (SHHR) are quantitative and dummy (1: heavy rainfall, 0: normal) explanatory variables, respectively; r is the number of selected variables ( 6 ); s is the number of dummy variables ( = 1 ); and ν is constant. For the last two terms ( γ s Z t + ν ), heavy rainfall ( Z 1 = 1 ) and normal ( Z 1 = 0 ) events, estimated to be γ + ν and ν , respectively, indicate the difference in the DMY between heavy and normal rainfall events in the model. Autocorrelation and partial autocorrelation functions were used to estimate the parameters of ARIMA. To select the optimal model, the coefficient of determination (R2), root mean square error (RMSE), and mean absolute error (MAE) were calculated. Furthermore, the hypotheses for independence and stationarity were tested using the Ljung-Box Qtest, autocorrelation function (ACF), partial autocorrelation function (PACF) and residual normality diagnosis.
The correlation and regression analyses were performed using SPSS 24.0 (IBM Corp. New York, NY, USA), and time-series modeling and forecasting were performed using PROC ARIMA, SAS 9.4.

3. Results

3.1. Effective Climatic Variable Selection Influencing the Dry Matter Yield of Whole Crop Maize

For detecting the DMY trend, the mean and standard error were calculated as indicated in Table A1. The mean minimum and maximum DMY (kg/ha) were 12,340.15 and 19,460.27, respectively. As indicated in Table 1, GD has a significant correlation with all climatic variables except for SHRA. This indicates the presence of some sort of dependency between the climatic variables and GD. Furthermore, the SHGDD and SHMT (r = 0.39**), SHGDD and SHSD (r = 0.38**), and SHRA and SHRD (r = 0.37**) were shown to be correlated, which led us to suspect the problem of multicollinearity. The maximum and minimum rainfall amount (mm) was 1344.40 and 380.30, respectively. The median was 663.00 mm, which was close to the mean (695.91 mm).
Based on an analysis of regression, SHGDD, SHRA, and SHRD were selected as potential climatic variables responsible for the DMY of WCM. These climatic variables were selected based on the principle of multicollinearity diagnosis, as well as considering the significance level of under 5% (Table 2). Due to the difference in magnitude and strong correlation between SHRF (−3.48) and SHRD (68.33) (p < 0.01), we decided to consider the effect of SHRA on the DMY.
Therefore, the climatic variables SHGDD and SHRA were used in time-series modeling of the DMY trend. The trends between the DMY, SHGDD, and SHRA are shown in Figure 1. Due to the difference in values among the variables, the values were subjected to standardization with a mean value of zero. Before 2000, no similarity was observed between the DMY and climatic variables. Meanwhile, a relatively similar trend was observed from 2000. For example, lower DMY was observed in 2003, 2006, and 2011 due to low SHGDD and high SHRA, whereas in 2008, there was a case of low SHRA.
In this study, the SHHR was considered as a more important weather event than SHRA. The DMY comparison of heavy rainfall and normal rainfall events indicated a significant difference, with a decrease in the DMY of 4745.27 kg/ha (Table 3), which means the rainfall events that deviate from the optimal required amount for growth and development could diminish the benefit of water requirement for the yield of forage crops.

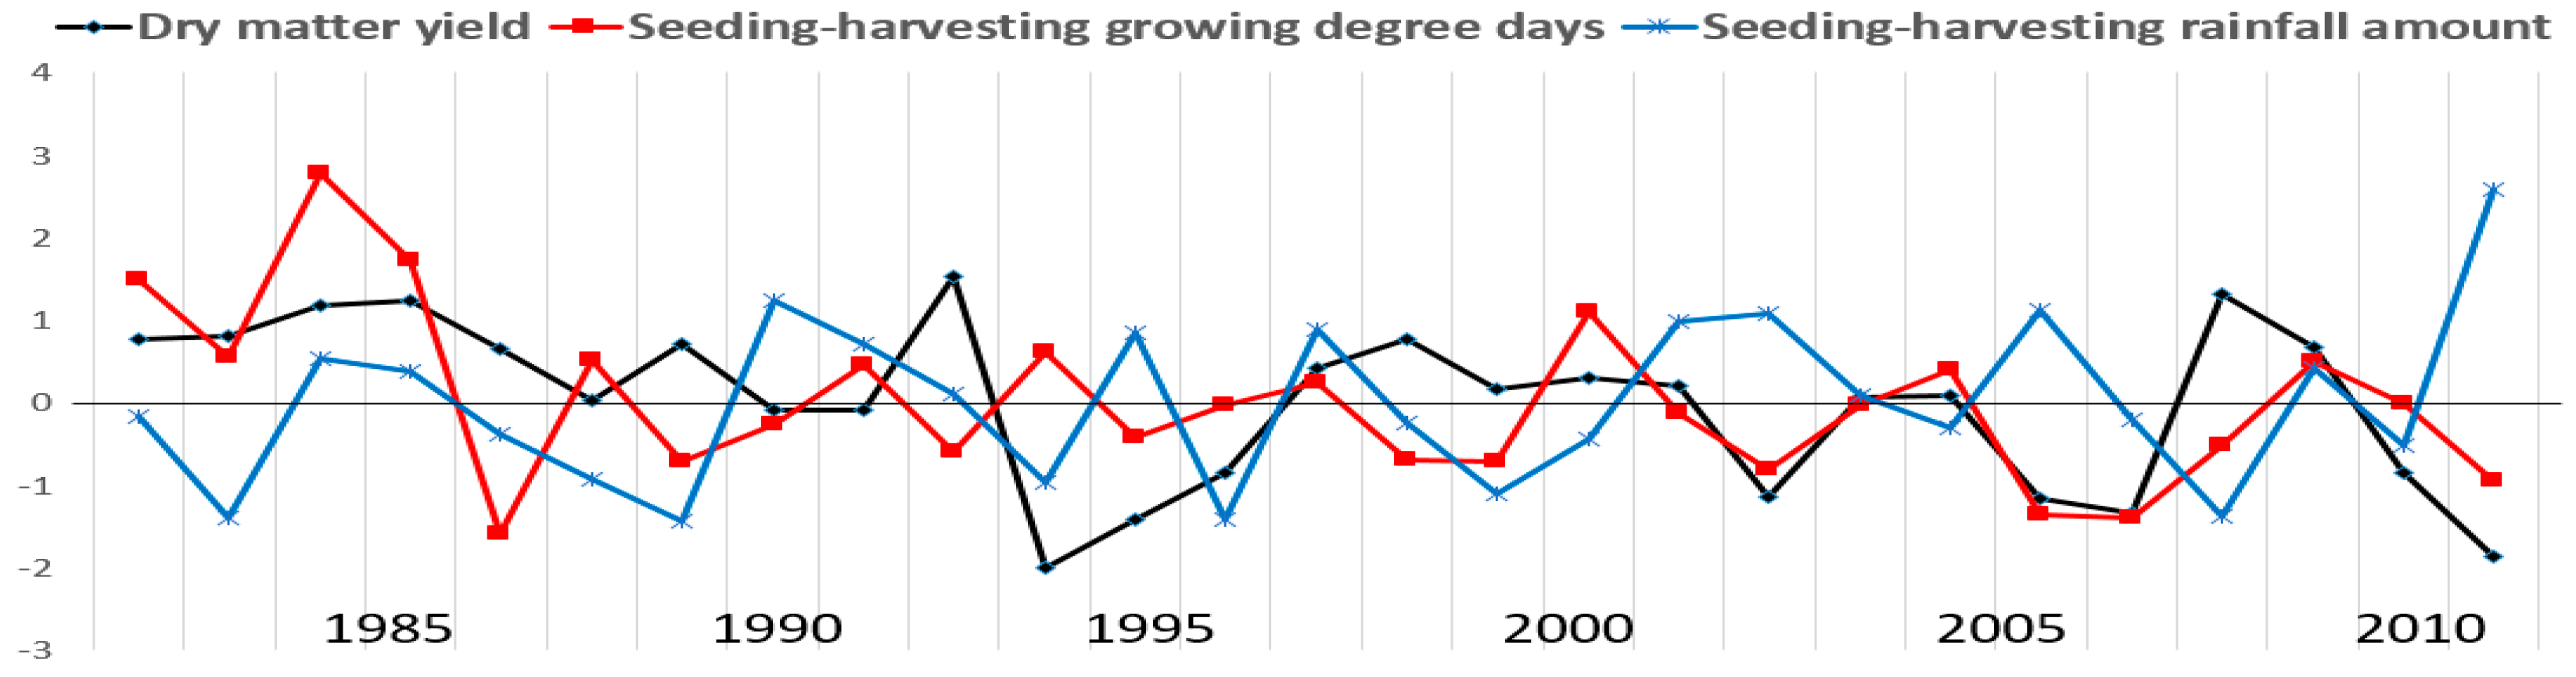
3.2. The Trend of Dry Matter Yield of Whole Crop Maize Considering the Climatic Variable

As preceded in Table 4, potential candidate ARIMA models such as ARIMA (0, 0, 1), ARIMA (1, 1, 1), and ARIMA (2, 2, 1), were compared. Accordingly, ARIMA (1, 1, 1) was selected based on model selection criterions and the chi-square probability test.
ARIMA (1, 1, 1) was found to be the optimal model that describes the actual DMY trend. The effects of climatic variables on the DMY trend of ARIMA (1, 1, 1) are displayed in Table 5. In Model 1, the DMY trend was considered without climatic variables. In model 2, SHGDD and SHRA were shown to have no significant effect (p > 0.05), whereas in model 3, SHGDD was found to have a significant effect (p < 0.05) on the DMY trend. This is due to the fact that the SHHR was used instead of SHRA, which was changed from a quantitative to dummy scale. The SHHR tended to be significant (p = 0.08), which indicates the influence of heavy rainfall events on the DMY trend of WCM compared with SHRA. In addition to the climatic variables, model fitness (R2) was improved.
As indicated in model 3, the mean DMY of the preceding one year (AR1) and the residual of the preceding one year (MA1) had a significant effect (p < 0.05) on the model detected. Similarly, the climatic variables (SHGDD and SHHR) were shown to have a significant effect (p < 0.05) on the observed DMY trend of whole crop maize. Thus, the ARIMAX model indicated in model 3 can be described as
D M Y t ( d = 1 )   ( k g / h a ) = 510.46 + 1.01 D M Y t 1 + 0.76 ε t 1 0.38 S H G D D t 385.68 S H H R t
The model satisfied the assumption of independence and non-stationarity, as indicated by the Ljung-Box Q test (p > 0.05). Furthermore, the fitness of the model for independency and normality is shown in Figure 2 using residual diagnosis of the correlogram of ACF (a) and PACF (b). The normality diagnosis also indicated that the model detected had a normal distribution (Figure 2c). The normal probability plot indicated in Figure 2d also shows that the residuals are distributed along the linear line.
The relationship between observed vs. predicted DMY considering the event is shown in Figure 3. Regardless of the event, leverage points were located on the bottom-right side, which indicates that the observed DMY was higher than the predicted DMY. Both observed and predicted observations of heavy rainfall events indicated lower DMY. The fitness of the heavy rainfall event (R2 = 0.79) was greater than that of the normal rainfall event (R2 = 0.54).

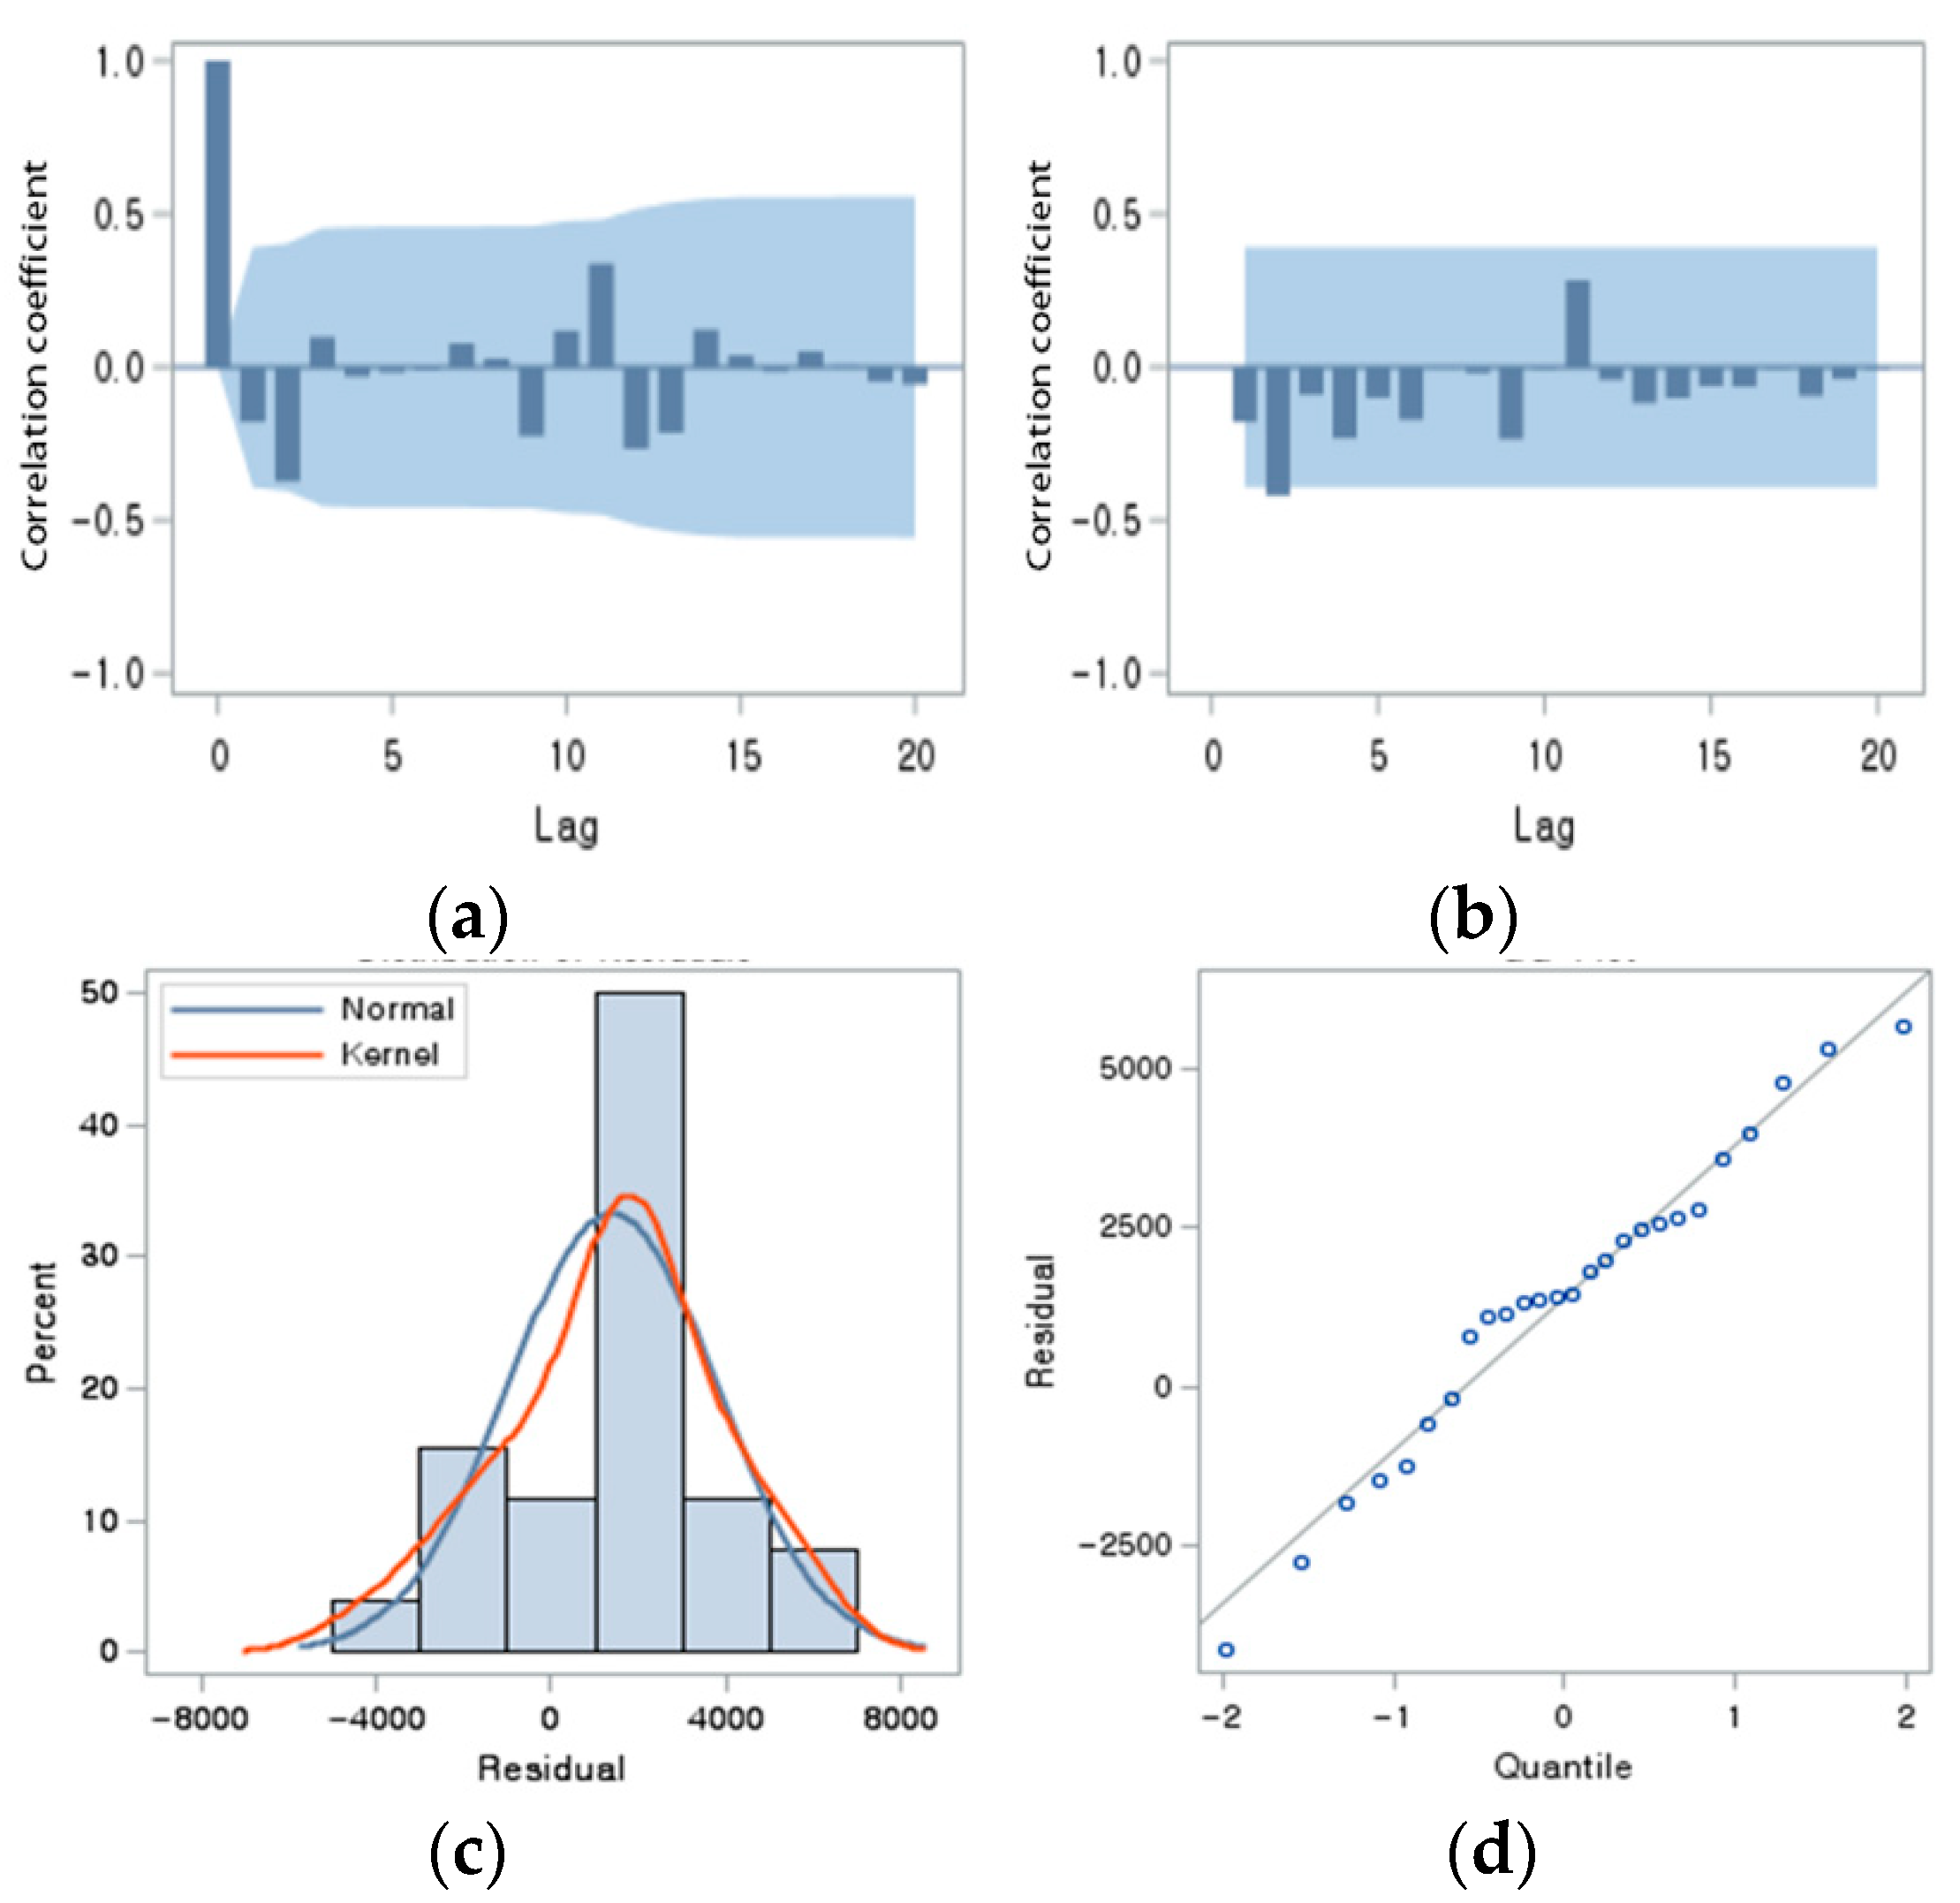
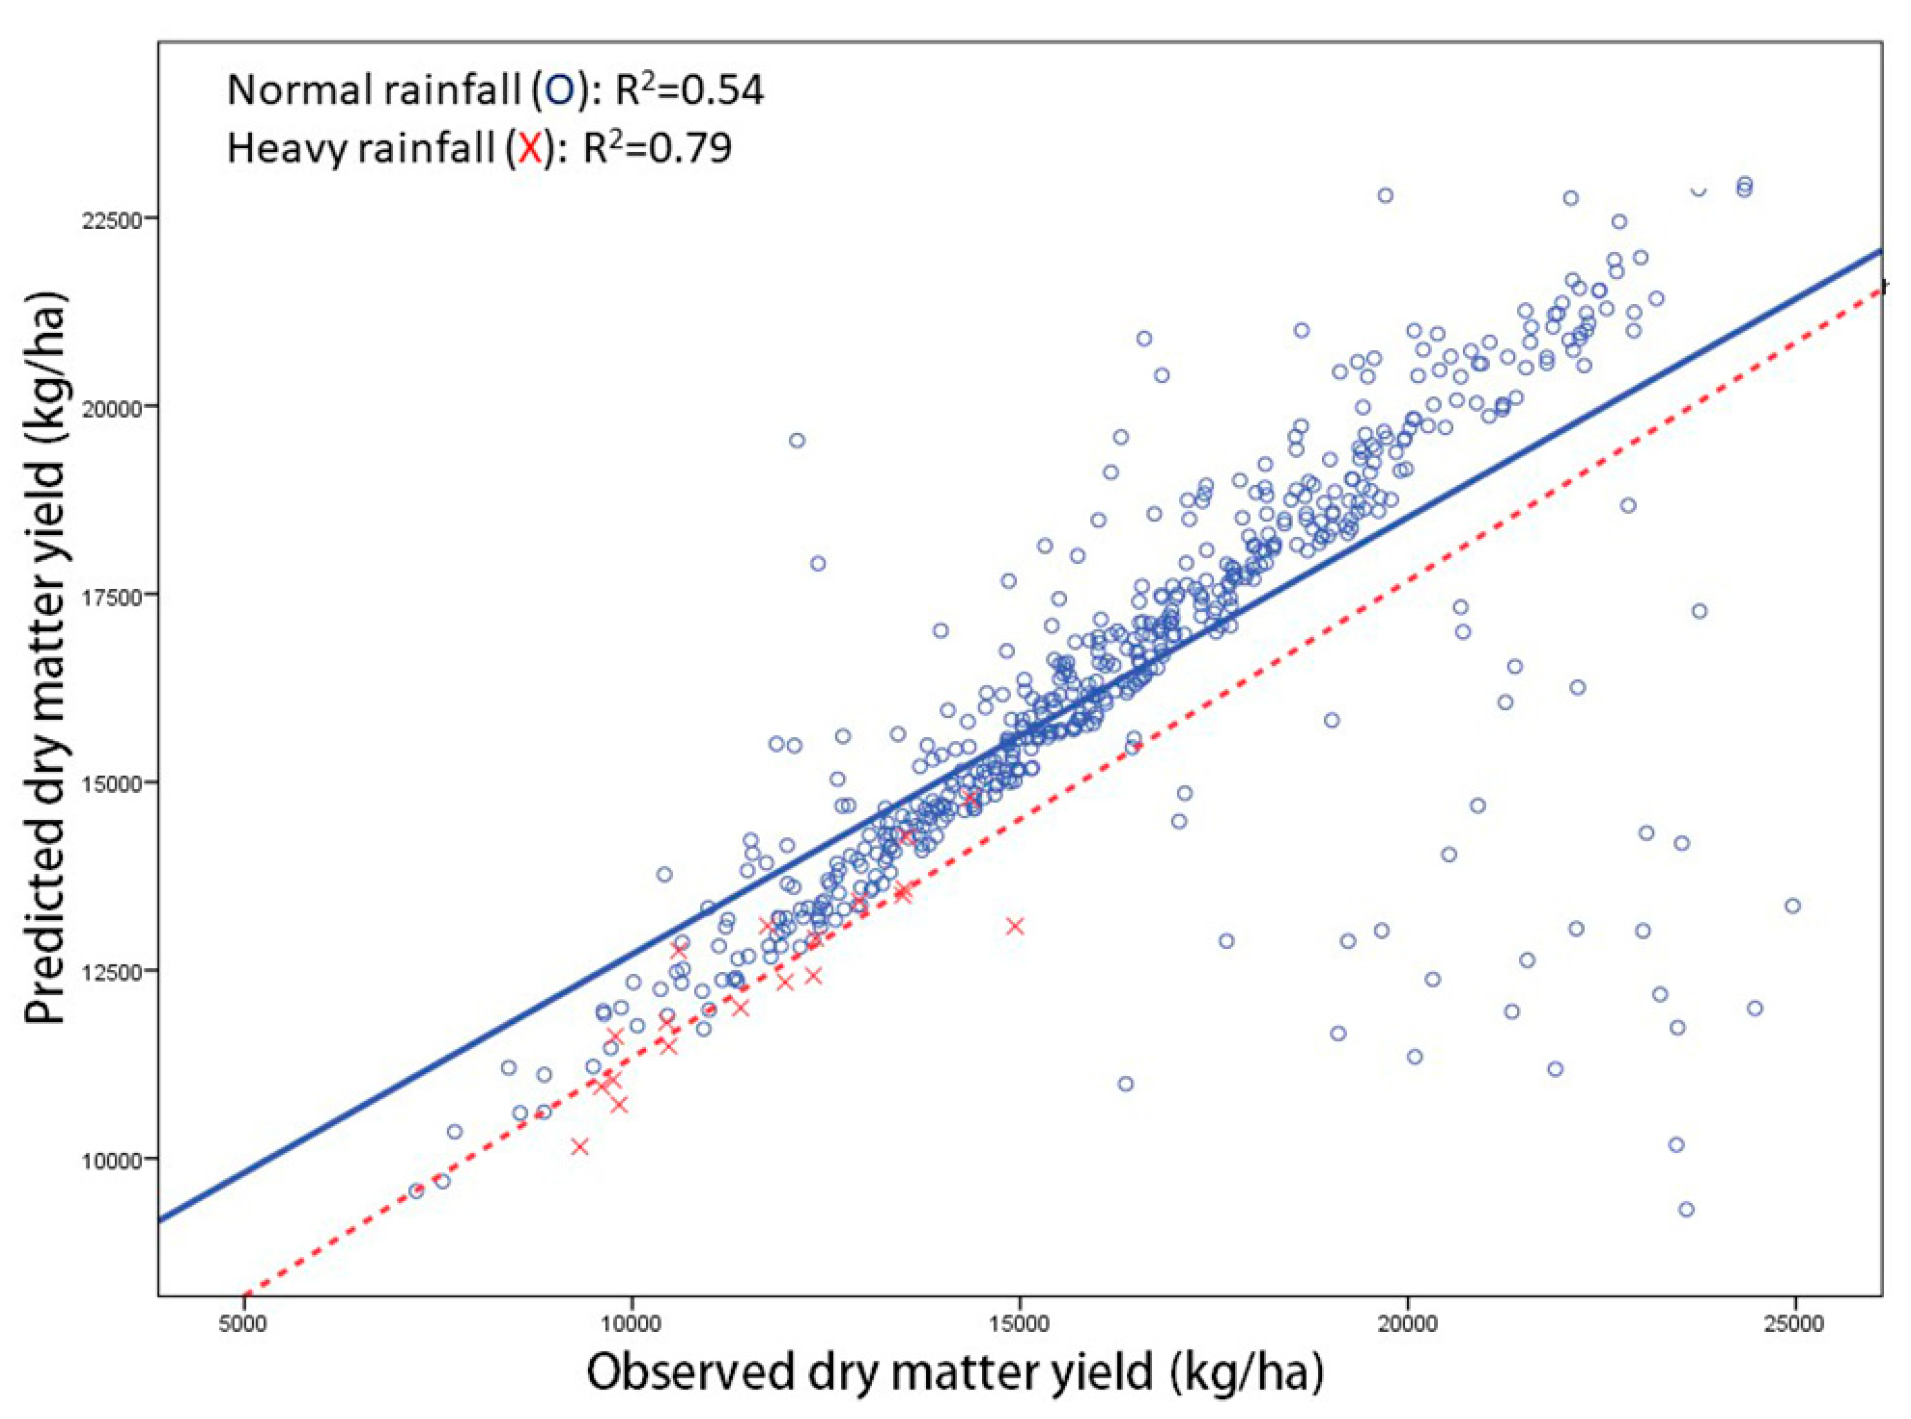
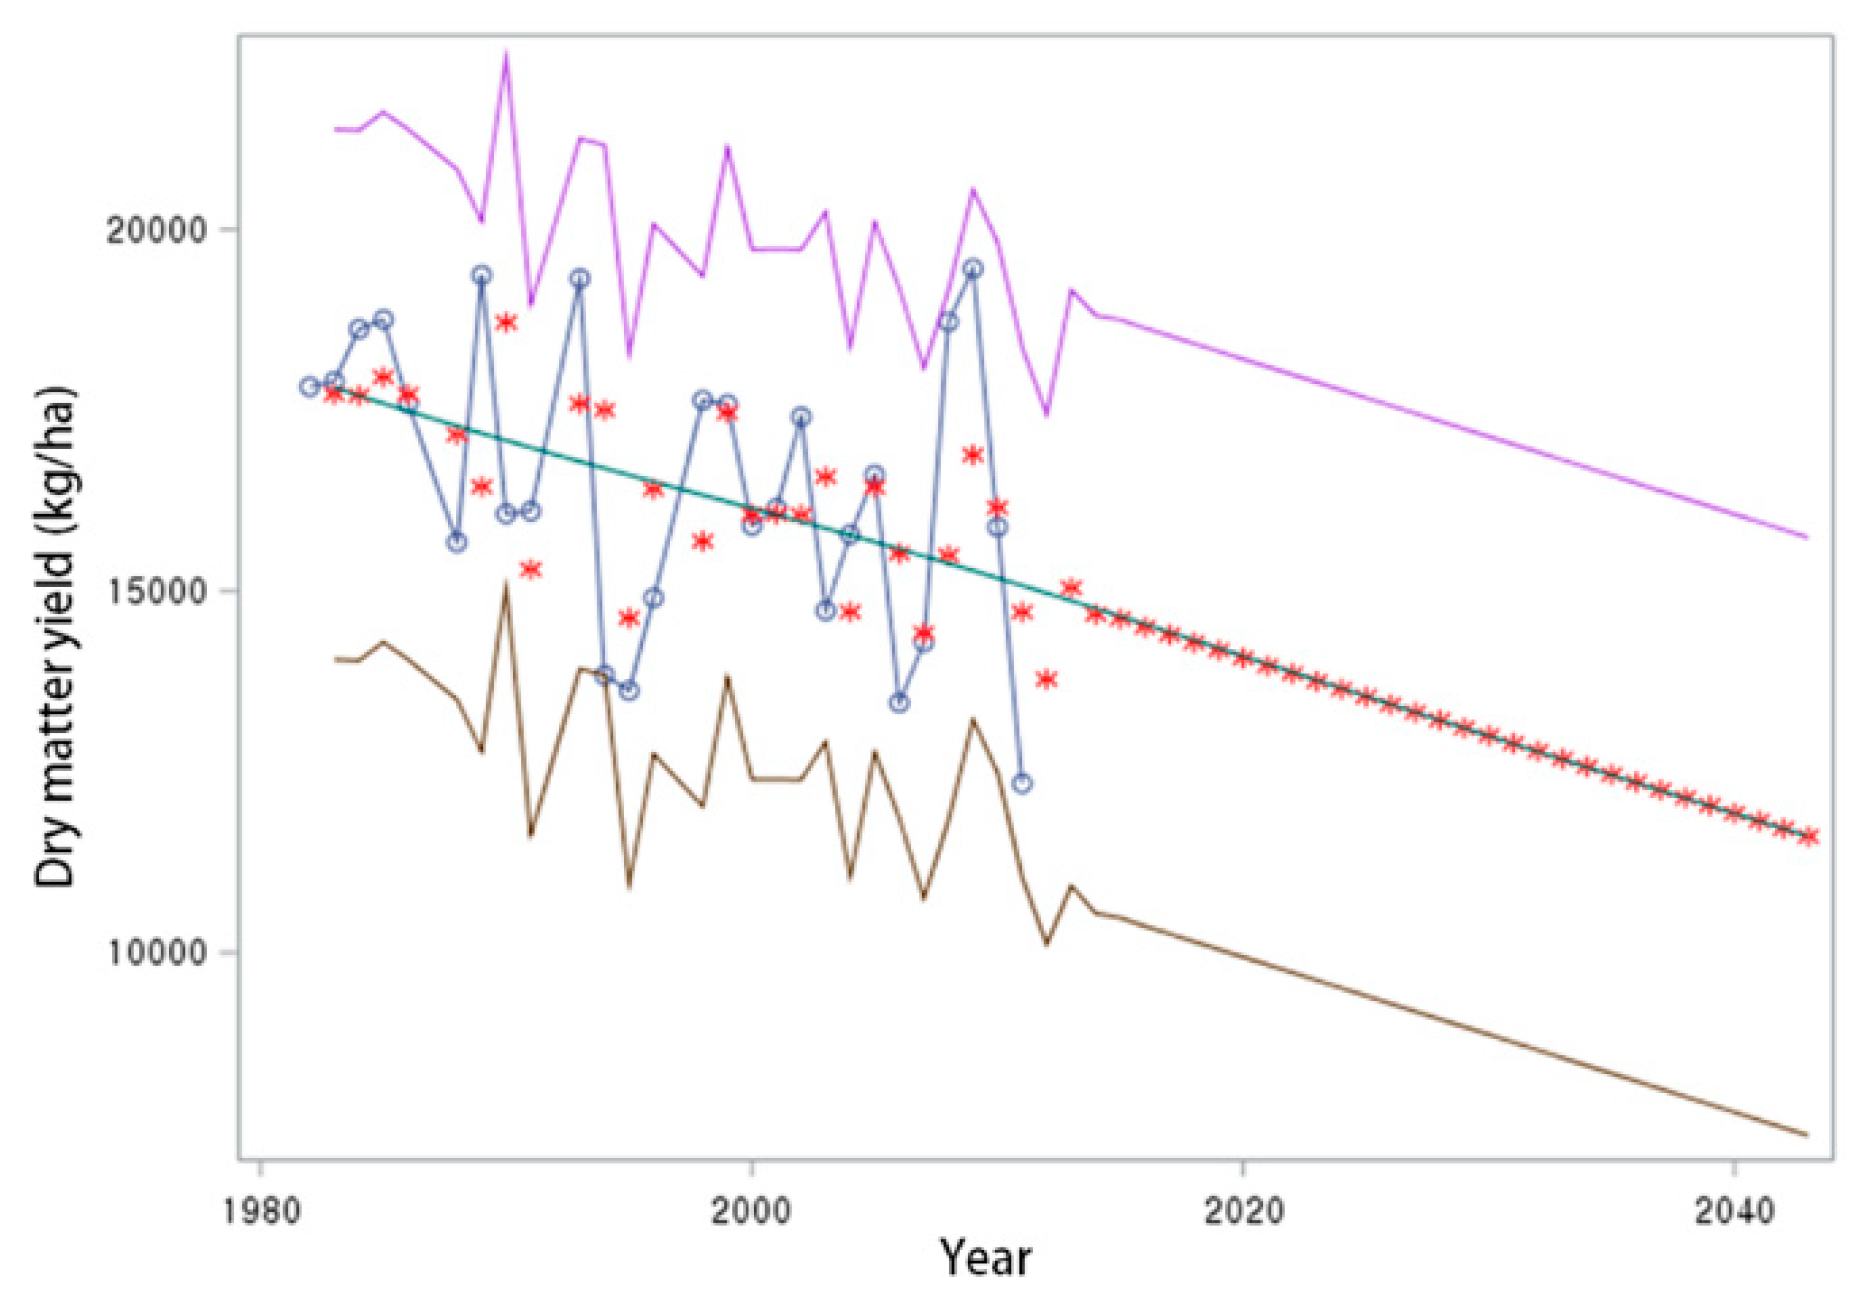
3.3. Forecasting the Dry Matter Yield of Whole Crop Maize

Based on the DMY trend detected along with the heavy rainfall events of ARIMAX (1, 1, 1), we estimated the forecasted DMY of WCM with asterisks marked in red until the year 2045. As indicated in Figure 4, the actual DMY was expected to show a decreasing trend, presented by circles marked in blue (1982–2011). The DMY (kg/ha) in 2015, 2025, 2035, and 2045 was forecasted to be 14,618.29 ± 2109.37, 13,537.97 ± 2109.38, 12,465.59 ± 2109.38, and 11,607.68 ± 2109.38 with a 95 % confidence interval, respectively.
In addition to detecting the DMY trend and effect of climatic variables, the frequency and intensity of heavy rainfall events were also calculated based on the daily rainfall amount in July (Figure 5). The frequency of heavy rainfall events has been increasing since 2005. In particular, the frequency of extreme heavy rainfall events (over 20.0 mm/hr) was remarkably increased and the rainy period became short.

4. Discussion

The climatic variables SHGDD and SHRA were selected on the basis of their impact on the growth and development of the DMY of WCM using correlation and regression analyses in Suwon, the middle region of the Republic of Korea. The GDD has been known to influence the yield of summer crops [20]. In the Republic of Korea, Peng et al. [21] and Chemere et al. [10] reported the effect of GDD, rainfall amount, and sunshine duration on the DMY of WCM. In Figure 1, the impact of climate on yield was ambiguous before 2005, while the relationship between yield and climates was somewhat noticeable after 2005. Climate has been reported to be important for the yield of grain in maize production [22]. Among the candidate models, the optimal DMY trend detected by ARIMAX (1, 1, 1) indicated that the present DMY follows the DMY of the previous one year, with one difference, and the residuals of the previous one year for the non-stationary data in Suwon. The model fitted the data well for the independency and normality (Figure 2). For the negative effect of SHRA in model 2, the mean SHRA (mm) ranged from 419.06 to 1325.18 (Table A1 in Appendix A), which contains heavy rainfall events of the summer monsoon season. The cultivation of maize usually takes place during summer, when the monsoon season prevails that brings damage to crop production. According to Verheye [23], 80–100% of the expected yield was due to the rainfall amount ranging from 650 to 900 mm. Thus, the heavy rainfall event during the Korean monsoon season leads to a decrease of DMY. The DMY decreased by 4745.27 kg/ha for heavy rainfall events compared to normal rainfall events. The model fitness based on heavy rainfall events was greater than that of normal rainfall events, indicating that prediction by heavy rainfall events was more accurate (Figure 3). We thought that the effect of heavy rainfall events led to crucial damage to the DMY aspects of not only growth and development, but also survival. This is because if there was no heavy rainfall event, the effects of other factors were mixed, whereas if the event occurred, the proportion of the effect of heavy rainfall event would become high on DMY, relatively. The occurrence of heavy rainfall would result in rainwater being lost through runoff [24] and result in soil erosion [2] that would cause the subsequent year’s yield to be affected. As most of the rainfall events happen in the monsoon season, the event is also accompanied by strong winds [25]. The strong association between heavy rainfall and wind speed has been reported [26]. The daily maximum rainfall amount and maximum wind speed during 2006, 2008, 2009, and 2011 were 0.16 (p > 0.05), 0.49 (p < 0.05), 0.51 (p < 0.05), and 0.74 (p < 0.01), indicating a correlation between the two factors that may affect the yield forage crops due to lodging.
The DMY in Suwon was forecasted for the period 2012–2045 (Figure 3). According to the report of the Ministry of Agriculture, Food and Rural Affairs of the Republic of Korea [27], the DMY of WCM in 2015 in Suwon was reported to be 19,531.04 kg/ha, which was relatively similar to the upper confidence limit of the forecasted DMY in the current study. In July of 2015, the heavy rainfall event recorded was four times higher and the total rainfall amount was 465.7 mm. Therefore, the main reason for the slightly higher actual DMY was due to less damage by heavy rainfall. The frequency was remarkably increasing after 2005, which made the impact of rainfall strong and led to the decreasing DMY trend. According to IPCC [1], extreme precipitation events over most of the mid-latitude land masses will very likely become more intense and more frequent. Increasing intra-seasonal precipitation variability affects the crop yield and the excessive precipitation amount could also negatively influence the yield of summer crops [3,28]. This scenario is also widely observed in Korea as 81.7 % of annual rainfall in the summer monsoon occurs in July [29]. The current study also reflects the impact of monsoon season heavy rainfall events that show a decreasing trend in the forecasted DMY of WCM.

5. Conclusions

This study detected the DMY trend, as well as the effect of climatic variables, especially the effect of heavy rainfall events associated with the DMY trend of WCM in Suwon, South Korea. The DMY was found to be determined by heavy rainfall events during the growing season. As a result, a potential decrease in the DMY due to a negative impact of heavy rainfall events is expected. The timing and duration of heavy rainfall events warrant further investigation for better characterization of the DMY of WCM and its association with the rainfall events in the Republic of Korea.

Author Contributions

Conceptualization, M.K. and B.C.; Data curation, M.K.; Formal analysis, M.K.; Investigation, M.K.; Methodology, M.K.; Resources, M.K.; Software, M.K.; Supervision, K.S.; Validation, B.C. and K.S.; Visualization, M.K.; Writing—original draft, M.K.; Writing—review & editing, B.C. and K.S.

Funding

This research received no external funding.

Acknowledgments

This study was supported by the Basic Science Research Program through the National Research Foundation of Korea funded by the Ministry of Education (NRF-2018R1D1A1B07048766).

Conflicts of Interest

The authors declare no conflict of interest.

Appendix A

Table A1. Descriptive Statistic of Variables of the Mean and Standard Error as a Year in Suwon for Whole Crop Maize.
YearDMY (kg/ha)GD (day)SHGDDSHMT (°C)SHRA (mm)SHRD (days)SHSD (hr)
198217,827.50 ± 713.29125.00 ± 0.001481.20 ± 0.00 21.62 ± 0.00696.00 ± 0.0051.00 ± 0.00812.50 ± 0.00
198317,900.00 ± 524.09120.00 ± 0.001410.85 ± 0.0021.50 ± 0.00481.70 ± 0.0049.00 ± 0.00790.50 ± 0.00
198418,622.44 ± 550.02123.78 ± 0.701578.71 ± 5.1722.57 ± 0.13819.11 ± 49.3758.00 ± 0.00792.80 ± 11.07
198518,754.00 ± 1926.00123.00 ± 0.001499.15 ± 0.0022.06 ± 0.00789.30 ± 0.0055.00 ± 0.00754.70 ± 0.00
198617,593.33 ± 1428.39119.00 ± 0.001249.90 ± 0.0019.97 ± 0.00657.70 ± 0.0063.00 ± 0.00725.50 ± 0.00
198816,338.68 ± 326.23121.80 ± 0.241408.27 ± 2.5721.07 ± 0.04563.06 ± 14.2746.25 ± 1.15932.31 ± 23.85
198917,718.04 ± 512.87119.39 ± 0.661316.37 ± 7.8620.67 ± 0.02474.13 ± 1.5945.90 ± 0.35931.49 ± 9.35
199016,294.27 ± 252.55122.67 ± 0.831350.57 ± 3.9020.60 ± 0.12947.20 ± 22.6066.33 ± 2.17725.73 ± 27.90
199116260.26 ± 0.00111.21 ± 0.001379.03 ± 0.0022.51 ± 0.00446.15 ± 0.0045.63 ± 0.00762.54 ± 0.00
199319,323.00 ± 637.74124.50 ± 08.31324.53 ± 5.4220.05 ± 0.04744.20 ± 34.5760.50 ± 0.83690.55 ± 2.58
199412,324.91 ± 748.09100.43 ± 2.451415.49 ± 26.9324.92 ± 0.21554.06 ± 23.5534.91 ± 1.32705.21 ± 21.55
199513,474.95 ± 526.53109.73 ± 2.701338.56 ± 17.7822.22 ± 0.31872.43 ± 77.3645.05 ± 0.75706.39 ± 34.93
199614,599.96 ± 541.06107.25 ± 2.461366.79 ± 17.8822.70 ± 0.18477.15 ± 12.4141.57 ± 1.40667.26 ±2 3.84
199817,107.50 ± 964.48116.75 ± 2.741387.65 ± 22.4321.42 ± 0.10880.28 ± 19.8461.00 ± 1.05589.60 ± 2.68
199917,832.75 ± 416.91111.27 ± 1.091318.39 ± 12.2021.64 ± 0.08681.70 ± 15.3940.44 ± 0.44742.14 ± 12.94
200016,630.57 ± 396.85113.10 ± 0.931315.52 ± 12.4521.37 ± 0.18530.94 ± 12.7247.61 ± 0.53682.82 ± 8.61
200116,870.22 ± 426.36120.39 ± 0.601451.77 ± 3.6021.73 ± 0.06649.14 ± 14.5751.03 ± 0.431065.38 ± 55.50
200216,800.49 ± 275.72123.38 ± 0.501360.22 ± 7.1620.64 ± 0.07896.13 ± 3.0046.68 ± 0.87899.92 ± 33.90
200314,034.75 ± 864.08120.50 ± 0.231309.52 ± 6.2020.41 ± 0.07911.89 ± 11.8257.08 ± 0.48603.06 ± 2.88
200416,436.64 ± 488.97120.51 ± 0.361368.06 ± 9.4821.19 ± 0.10740.48 ± 15.3652.28 ± 0.65709.07 ± 6.75
200516,477.38 ± 437.37116.25 ± 0.271399.43 ± 6.5521.73 ± 0.07672.42 ± 6.4848.49 ± 0.38727.06 ± 1.53
200613,902.40 ± 260.68113.84 ± 0.531268.41 ± 8.2820.78 ± 0.12923.30 ± 0.0451.82 ± 0.16647.09 ± 3.32
200714,004.88 ± 410.07114.23 ± 0.641276.63 ± 8.9520.81 ± 0.03691.68 ± 8.3352.05 ± 0.55612.36 ± 5.49
200818,909.55 ± 456.20114.95 ± 0.541330.74 ± 7.3521.39 ± 0.04484.57 ± 4.8545.86 ± 0.65661.10 ± 6.45
200917,609.38 ± 427.41124.04 ± 0.411406.91 ± 6.8220.96 ± 0.07798.69 ± 11.4655.84 ± 0.24724.46 ± 5.20
201014,624.59 ± 418.84104.09 ± 0.371368.70± 4.6323.11 ± 0.05633.75 ± 4.7347.16 ± 0.23576.58 ± 2.97
201112,596.15 ± 307.86108.92 ± 0.571298.02 ± 11.7521.57 ± 0.061175.99 ± 0.0654.92 ± 0.12530.35 ± 0.71
DMY: dry matter yield, GD: growing days, SHGDD: seeding-harvesting growing degree days, SHMT: seeding-harvesting mean temperature, SHRA: seeding-harvesting rainfall amount, SHRD: seeding-harvesting rainfall days, SHSD: seeding-harvesting sunshine duration.

References

  1. Intergovernmental Panel on Climate Change. Available online: https://archive.ipcc.ch/report/ar5/syr/ (accessed on 18 February 2019).
  2. Intergovernmental Panel on Climate Change. Climate Change 2007: Synthesis Report. Contribution of Working Groups I, II and III to the Fourth Assessment Report of Intergovernmental Panel on Climate Change; Pachauri, R.K., Reisinger, A., Eds.; IPCC: Geneva, Switzerland, 2008; p. 104. [Google Scholar]
  3. Kang, K.; Lee, D.; Na, Y.; Sim, K.; Choi, I.; Lee, C.; Park, K.; Kim, J. Climate change and Agriculture in Korea, 33rd ed.; Rural Development Administration: Seoul, Korea, 2011; pp. 1–25.
  4. Dixon, B.L.; Hollinger, S.E.; Garcia, P.; Tirupattur, V. Estimating corn yield response models to predict impacts of climate change. J. Agric. Res. Econ. 1994, 19, 58–68. [Google Scholar]
  5. Peng, J.L. Suitability Mapping and Yield Prediction Modeling Using Climatic and Geographic Information for Improving Forage Crops Production in South Korea. Doctoral Thesis, College of Animal Life Sciences, Kangwon National University, Chuncheon, Korea, 2017. [Google Scholar]
  6. Kim, M.; Jeon, M.; Sung, K.; Kim, Y.J. Bayesian structural equation modeling for analysis of climate effect on whole crop barley yield. Korean J. Appl. Stat. 2016, 29, 331–344. [Google Scholar] [CrossRef]
  7. Kim, M.; Sung, K.; Kim, Y.J. Analysis of climate effects on Italian ryegrass yield via structural equation model. Korean J. Appl. Stat. 2014, 27, 111–120. [Google Scholar] [CrossRef]
  8. Kim, M.; Oh, S.; Kim, J.; Lee, B.; Peng, J.; Kim, S.; Chemere, B.; Jalil, G.; Kim, K.; Jo, M.; et al. Prediction of the Italian ryegrass (Lolium multiflorum Lam.) yield via climate big data and geographic information system in Republic of Korea. J. Korean Soc. Grassl. Forage Sci. 2017, 37, 145–153. [Google Scholar] [CrossRef]
  9. Oh, S.; Kim, M.; Peng, J.; Lee, B.; Kim, J.; Kim, B.; Sung, K. A research on yield prediction of mixed pastures in Korea via model construction in stage. J. Korean Soc. Grassl. Forage Sci. 2017, 37, 80–91. [Google Scholar] [CrossRef]
  10. Chemere, B.; Kim, M.; Peng, J.; Kim, B.; Sung, K. Detecting dry matter yield trend of whole crop maize considering the climatic factors in the Republic of Korea. Grassl. Sci. 2019, 65, 116–124. [Google Scholar] [CrossRef]
  11. Chemere, B.; Kim, J.; Lee, B.; Kim, M.; Kim, B.; Sung, K. Detecting long-term dry matter yield trend of sorghum-sudangrass hybrid and climatic factors using time series analysis in the Republic of Korea. Agriculture 2018, 8, 197. [Google Scholar] [CrossRef]
  12. Box, G.E.; Jenkins, G.M. Time Series Analysis, Control and Forecasting; Holden-Day: San Francisco, CA, USA, 1976; pp. 1–18. [Google Scholar]
  13. Badmus, M.A.; Ariyo, O.S. Forecasting cultivated areas and production of maize in Nigerian using ARIMA model. Asian J. Agric. Sci. 2011, 3, 171–176. [Google Scholar]
  14. Cooke, B. Recent Food Prices Movements: A Time Series Analysis; International Food Policy Research Institute: Washington, DC, USA, 2009; pp. 1–35. [Google Scholar]
  15. Bae, D.H.; Jung, L.W.; Chang, H.J. Long-term trend of precipitation and runoff in Korean river basins. Hydrol. Processes 2008, 22, 2644–2656. [Google Scholar] [CrossRef]
  16. Nam, W.H.; Hayes, M.J.; Svoboda, M.D.; Tadesse, T.; Wilhite, D.A. Drought hazard assessment in the context of climate change for South Korea. Agric. Water Manag. 2015, 160, 106–117. [Google Scholar] [CrossRef]
  17. Chen, T.C.; Wang, S.Y.; Huang, W.R.; Yen, M.C. Variation of the East Asian summer monsoon rainfall. J. Clim. 2004, 17, 744–762. [Google Scholar] [CrossRef]
  18. Britannica. Britannica Visual Dictionary. 2012. Available online: http://www.ikonet.com/en/visualdictionary/earth/meteorology/precipitations/rain-forms.php (accessed on 26 August 2018).
  19. Lee, D.K.; Kim, H.R.; Hong, S.Y. Heavy rainfall over Korea during 1980~1990. Korean J. Atmos. Sci. 1998, 3, 32–50. [Google Scholar]
  20. McMaster, G.S.; Wilhelm, W.W. Growing degree-days: One equation, two interpretations. Agric. For. Meteorol. 1997, 87, 291–300. [Google Scholar] [CrossRef]
  21. Peng, J.L.; Kim, M.; Kim, Y.J.; Jo, M.H.; Nejad, J.G.; Lee, B.H.; Ji, D.H.; Kim, J.Y.; Oh, S.M.; Kim, B.W.; et al. Detecting the climate factors related to dry matter yield of whole crop maize. Korean J. Agric. Forest Meteorol. 2015, 17, 261–269. [Google Scholar] [CrossRef]
  22. Hu, Q.; Buyanovsky, G. Climate effects on corn yield in Missouri. J. Appl. Meteorol. 2003, 42, 1626–1635. [Google Scholar] [CrossRef]
  23. Verheye, W.H. Soils, Plant Growth and Crop Production-Volumn II; EOLSS Publication: Oxford, UK, 2010; pp. 69–75. [Google Scholar]
  24. Brouwer, C.; Heibloem, M. Irrigation Water Management: Irrigation Water Needs; Food and Agriculture Organization of the United Nation: Rome, Italy, 1986; pp. 19–21. [Google Scholar]
  25. Lee, H.J.; Chae, J.C.; Lee, S.S.; Koo, J.O.; Choi, J.Y. Sinje Forage Crops, 3rd ed.; Hyangmunsa: Seoul, Korea, 2014; pp. 162–173. [Google Scholar]
  26. Carter, P.R.; Hudelson, K.D. Influence of simulated wind lodging on corn growth and grain yield. J. Prod. Agric. 1988, 1, 295–299. [Google Scholar] [CrossRef]
  27. Ministry of Agriculture, Food and Rural Affairs. Food Self-Sufficiency Rate Was 50.2% in 2015 Year, 0.5% Increase from the Previous Year; MAFRA: Sejong-si, Korea, 2015; pp. 1–7.
  28. Fishman, R. More uneven distributions overturn benefits of higher precipitation for crop yields. Environ. Res. Lett. 2016, 11, 024004. [Google Scholar] [CrossRef]
  29. Lee, M.K.; Baek, H.J.; Cho, C.H.; Kwon, W.T. The recent (2001–2010) changes on temperature and precipitation related to normals (1971–2000) in Korea. Geogr. J. Korea 2011, 45, 237–248. [Google Scholar]
Figure 1. Line plot of a trend for standardized variables from 1982 to the 2011 year in Suwon.
Agriculture 09 00075 g001
Figure 2. Residual plots to check the independency and normality in ARIMAX (1, 1, 1) contain growing degree days and heavy rainfall: (a) Autocorrelation function; (b) partial autocorrelation function; (c) normality diagnosis; (d) normal Q-Q plot.
Agriculture 09 00075 g002
Figure 3. Scatter plot of dry matter yield between observed and predicted in ARIMAX (1, 1, 1) model focusing on heavy rainfall events: normal (blue colored ○, solid line), heavy rainfall (red colored ×, dashed line).
Agriculture 09 00075 g003
Figure 4. The forecasting of dry matter yield for whole crop maize via ARIAMX (1, 1, 1) considering the heavy rainfall events with a 95% confidence interval in Suwon (2012–2045).
Agriculture 09 00075 g004
Figure 5. Frequency and intensity of the heavy rainfall events with dry matter yield trend of whole crop maize in Suwon (1982–2011).
Agriculture 09 00075 g005
Table 1. Correlation coefficients between climatic variables under the 5% significance level.
VariablesGDSHGDDSHMTSHRASHRDSHSD
GD10.38 *−0.67 *0.11 *0.48 *0.42 *
SHGDD 10.39 *0.12 *0.23 *0.38 *
SHMT 1−0.04−0.34 *−0.11 *
SHRA 10.37 *−0.19 *
SHRD 1−0.14 *
SHSD 1
GD: growing days, SHGDD: seeding-harvesting growing degree days, SHMT: seeding-harvesting mean temperature, SHRA: seeding-harvesting rainfall amount, SHRD: seeding-harvesting rainfall days, SHSD: seeding-harvesting sunshine duration, * p < 0.05.
Table 2. The result of regression analysis to identify the effects of climatic variables on the dry matter yield of whole crop maize.
ParametersCoefficientSEp-ValueVIF
Intercept149.842104.820.94
SHGDD11.281.56<0.011.06
SHRA−3.480.75<0.011.16
SHRD68.3321.50<0.011.20
SHGDD: seeding-harvesting growing degree days, SHPA: seeding-harvesting rainfall amount, SHRD: seeding-harvesting rainfall days, SE: standard error, VIF: variance inflation factor.
Table 3. Comparison of dry matter yield between heavy (based on over 1000 mm rainfall amount) and normal (else) rainfall.
VariableGroupst-Statistic
Heavy Rainfall (n = 19)Normal Rainfall (n = 524)
Dry matter yield (kg/ha)11,702.21 ± 242.8816,447.48 ± 121.30−11.07 (p < 0.01)
Table 4. Correlation of model between AR (0 to 3) and MA (0 to 2) as a difference (0 to 2) under the 5% significance level.
LagsDifference = 0Difference = 1Difference = 2
MA 0MA 1MA 2MA 0MA 1MA 2MA 0MA 1MA 2
AR 00.04 10.09 1 0.01 10.03 10.19 *0.02 10.01 10.44 *0.01 1
AR 10.14 *0.02 10.01 10.26 *0.13 10.01 10.50 *0.35 *0.02 1
AR 20.03 10.01 1<0.01 10.05 10.06 1<0.01 10.01 *0.11 10.01 1
AR 30.01 1<0.01 1<0.01 10.11 10.03 1<0.01 1013 *0.09 1<0.01 1
1p > 0.05, * p < 0.05.
Table 5. The result of ARIMA (1, 1, 1) (model 1), ARIMAX (1, 1, 1) with climatic variables (model 2), and focusing on heavy rainfall (model 3) for dry matter yield trend.
ModelParametersEstimateR2RMSEMAELjung-Box Q
1Intercept−7.89 (p = 0.12)0.312021.941551.0820.79
(p = 0.19)
ARLag 10.99 (p < 0.01)
MALag 10.77 (p < 0.01)
2Intercept241.66 (p = 0.37)0.422194.721605.7515.99
(p = 0.45)
ARLag 11.00 (p < 0.01)
MALag 10.77 (p < 0.01)
SHGDD−0.23 (p = 0.21)
SHRA0.08 (p = 0.47)
3Intercept510.46 (p < 0.05)0.582063.861417.4712.63
(p = 0.70)
ARLag 11.01 (p < 0.01)
MALag 10.76 (p < 0.01)
SHGDD−0.38 (p < 0.05)
SHHR (=1)−385.68 (p = 0.08)
SHGDD: seeding-harvesting growing degree days, SHRA: seeding-harvesting rainfall amount, SHHR: seeding-harvesting heavy rainfall, RMSE: root mean square error, MAE: mean absolute error.

