Article

The Effect of N and P Fertilizers on Yield and Yield Components of Sesame (Sesamum indicum L.) in Low-Fertile Soil of North-Western Ethiopia

1
Ethiopian Institute of Agricultural Research, Tigray Agricultural Research Institute, Humera Agricultural Research Center, Crop Department, Humera P.O. BOX 62, Ethiopia
2
Department of Plant and Environmental Sciences, University of Copenhagen, Højbakkegaard Allé 13, DK-2630 Taastrup, Denmark
*
Author to whom correspondence should be addressed.
Agriculture 2019, 9(10), 227; https://doi.org/10.3390/agriculture9100227
Submission received: 16 August 2019 / Revised: 2 October 2019 / Accepted: 15 October 2019 / Published: 19 October 2019

Abstract

:
The impact of fertilizer of N and P on the yield of sesame in north-western Ethiopia was investigated. Field experiments were conducted in 2010 and 2011. Six levels of urea and six levels of di-ammonium phosphate were applied using a factorial completely randomized block design. Application of N and P increased the plant height, the number of capsules plant−1, and the yield ha−1. The number of days to flower decreased with increasing rates of nitrogen. The number of days to maturity was largest (91 days) at a rate of 23 kg N ha−1. Applying 92 kg N ha−1 resulted in a yield of 917.8 kg ha−1 and a plant height of 104 cm. An application of 92 kg P ha−1 with 36 Kg N ha−1 gave a yield of 908 kg ha−1 and a plant height of 103.4 cm. The interaction between N and P significantly affected the number of days to flower, plant height, the number of capsules plant−1, and yield ha−1. Applying 128 kg N ha−1 and 92 kg P ha−1 gave the biggest yield (1043 kg ha−1). However, application of 41 kg N ha−1 and 46 kg P ha−1 gave the largest marginal rate of return.

1. Introduction

Sesame (Sesamum indicum L.) is one of the oldest oil-seed crops cultivated in almost all tropical and subtropical Asian and African countries [1]. Sesame seed is an important source of edible oil, and sesame is widely used as a spice. The seeds contain 50−60% oil, which has an excellent stability due to the presence of natural antioxidants such as sesamolin, sesamin and sesamol [2]. This warm-season annual crop is primarily adapted to areas with long growing seasons and well-drained soils [3].
The world market of sesame seeds is a billion-dollar industry that supports the livelihood of millions of farmers throughout the world. In Ethiopia, more than 600,000 small-scale farmers [4] and investors together own more than 300,000 hectares of land involved in sesame production every year and more than 90% of the production is exported. Next to coffee, sesame seeds are the second largest source of foreign exchange in Ethiopia [5]. Ethiopia is the second largest exporter of sesame seeds in the world next to India and fourth in production.
For many years, sesame productivity in Ethiopia remained very low due to different production constraints. Poor soil fertility is one of the most important factors limiting the productivity aggravated with poor cultural practices such as mono cropping. The soils of the Humera plains have sustained crop production for long periods without use of external inputs. The repeated sesame production (mono cropping) has resulted in depletion of nutrients from the topsoil with a subsequent reduction in yield. Hailemariam [6] reported that the north-west of Ethiopia, Humera plains, had very low NP content compared to moderately fertile soils [7,8]. Many researchers have shown that sesame is very responsive to nitrogen and phosphorus fertilizers [9,10,11,12,13,14]. However, there are no published fertilizer recommendations for the local sesame variety grown in Northern Ethiopia, Humera. The yield of sesame in Northern Ethiopia is low (525 kg ha−1) compared with the national average yield (787 kg ha−1 in 2017) [15]. In comparison, the average yield of sesame in India was estimated to be about 417 kg ha−1, in Cameroon about 1300 kg ha−1, in Central African Republic about 1150 kg ha−1, and in China about 1400 kg ha−1 in 2017 [15].
The objective of this study was to investigate the impact of different rates of N and P nutrients on the yield of a local common grown variety of sesame (Hirhir) in a low-fertile soil of north-western Ethiopia. The aim was to help farmers to increase the yield and estimate how much fertilizer the farmers should apply from an economy point of view. Our hypothesis is that just applying a small amount of N and P, which could be economically feasible for farmers, could increase the yield significantly.

2. Materials and Methods

2.1. Field Experiments

In 2010 and 2011, field experiments were conducted in the Kafta Humera district in north-western Ethiopia at Humera Agricultural Research Center (14°27′ N latitudes, and 36°27′ E longitudes) at an altitude of 604 m above sea level. The dominant soil reference group of the area is vertisol [16]. Composite top soil samples (0−30 cm) were collected in the 2 cropping seasons to determine physicochemical properties of the experimental site (Table 1). Rainfall and temperature data were recorded during the growing seasons (Figure 1).
The site of the experiments was cultivated with sesame for four consecutive years. The land was plowed with a tractor mounted moldboard and harrowed before seeding. The total experimental area was 2444.4 m2 (135.8 m × 18 m), with a gross plot size of 2.8 m × 5 m, and net plot size of 2 m × 4 m.
Border rows and 0.5 m from both sides of each row were used as buffer zones to minimize the effects of external factors. Alleyways were created between plots with a width of 1.5 m and 1 m, respectively.
The treatments consisted of six rates of urea and six rates of di-ammonium phosphate (DAP). One hundred kg of urea contained 46 kg N, and 100 kg of DAP contained 46 kg P and 18 kg N. We used the following dosages of urea: 0, 25, 50, 100, 150, and 200 kg ha−1 corresponding to 0, 16, 32, 64, 96, and 128 kg N ha−1, respectively. We applied the following dosages of DAP: 0, 25, 100, 150, and 200 kg DAP ha−1 corresponding to 0; 11. 5 kg P ha−1 and 4.5 kg N ha−1; 23 kg P ha−1 and 9 kg N ha−1; 46 kg P ha−1 and 18 kg N ha−1; 69 kg P ha−1 and 27 kg N ha−1; and, 92 Kg P ha−1 and 36 Kg N ha−1, respectively. No other fertilizers were applied.
The experiment was a randomized complete block design (RCBD) with three replications. A locally commonly grown sesame cultivar called ‘Hirhir’ was used. Seeding was done in rows with row spacing of 40 cm on 15 July 2010 and the 17 July 2011. The seedlings were thinned to achieve 10 cm space between plants when the plants attained a height of 5 cm. The total amount of DAP and half of the total amount of N were added to the soil during sowing. The rest of the N was applied as side dressing during flower initiation (28 days after emergence). Weeds were controlled manually using hoes 7, 28 and 56 days after emergence as recommended by Mahgoub et al. [26]. There were no pest problems during the first year, but webworms appeared in the second year and were controlled with Ethiothion (Malathion 50% EC, Adami Tulu Pesticide Processing S.C., Addis Ababa, Ethiopia) with a dose of 1.5 L ha−1 in 200 L of water when flowering began. Dates were recorded when 50% of the plants in a plot reached the flowering stage; when 90% of the population got yellow leaves; and when the lower outermost capsules started opening. Each phenological stage was determined visually. From the five middle rows, five plants were chosen randomly, and the final height of the main stem was measured from the ground to the apex of the main stem tip. Seed yield of each net plot was weighed and converted to yield ha−1 after adjusting the water content to 7.5% [27].

2.2. Economic Analysis

Economic analysis was conducted using partial budget analysis as described by CIMMYT [28]. The grain yield was analyzed to assess the costs and benefits associated with the different treatments. For the economic analysis, the market prices of fertilizer, harvest, threshing, and grain yield were used. All costs and benefits were calculated on a hectare basis in the Ethiopian currency, Birr. Farmer’s grain yields are often 10% lower than the grain yields in research-managed small plots with the same input, management practice, agroecology, etc. For this reason, grain yield was reduced by 10% in the analyses to minimize the effect of the small plots managed by researchers compared to the farmer’s management as guided by CIMMYT [28]. The following equations were used:
Gross benefit = economical yield return × price (birr kg−1)
Net profit = gross benefit − total cost that varies
The dominance analysis procedure [28] was used to select profitable treatments from the range tested. The marginal rate of return (MRR) was calculated (Equation (3)) by considering a pair of non-dominated treatments listed. Non-dominated treatments are treatments resulting in lower net revenue compared to the treatment giving maximum net revenue, but their cost is lower than the treatment giving maximum net revenue. They are included in the calculation of MRR to compare cost effectiveness. MRR denotes the return per unit of investment for the different managements tested in the field [28]. Following the analysis, treatments with the highest MRR were recommended to farmers.
M R R = c h a n g e   i n   N B c h a n g e   i n   T C V
where MRR is the marginal rate of return, NB is net benefit ha−1 for each treatment, and TCV is the total variable costs ha−1 for each treatment.

2.3. Data Processing and Statistical Analysis

The effect on yield and yield components of the three factors N, P, and year, and their interactions were analyzed with three-way analysis of variance using the SAS software version 9.1 (SAS Institute Inc., SAS Campus Drive, Cary, North Carolina 27513, USA). Whenever the effect of the treatments was significant, mean separations were tested using Duncan’s multiple range test (DMRT) at 5% level of probability.

3. Results

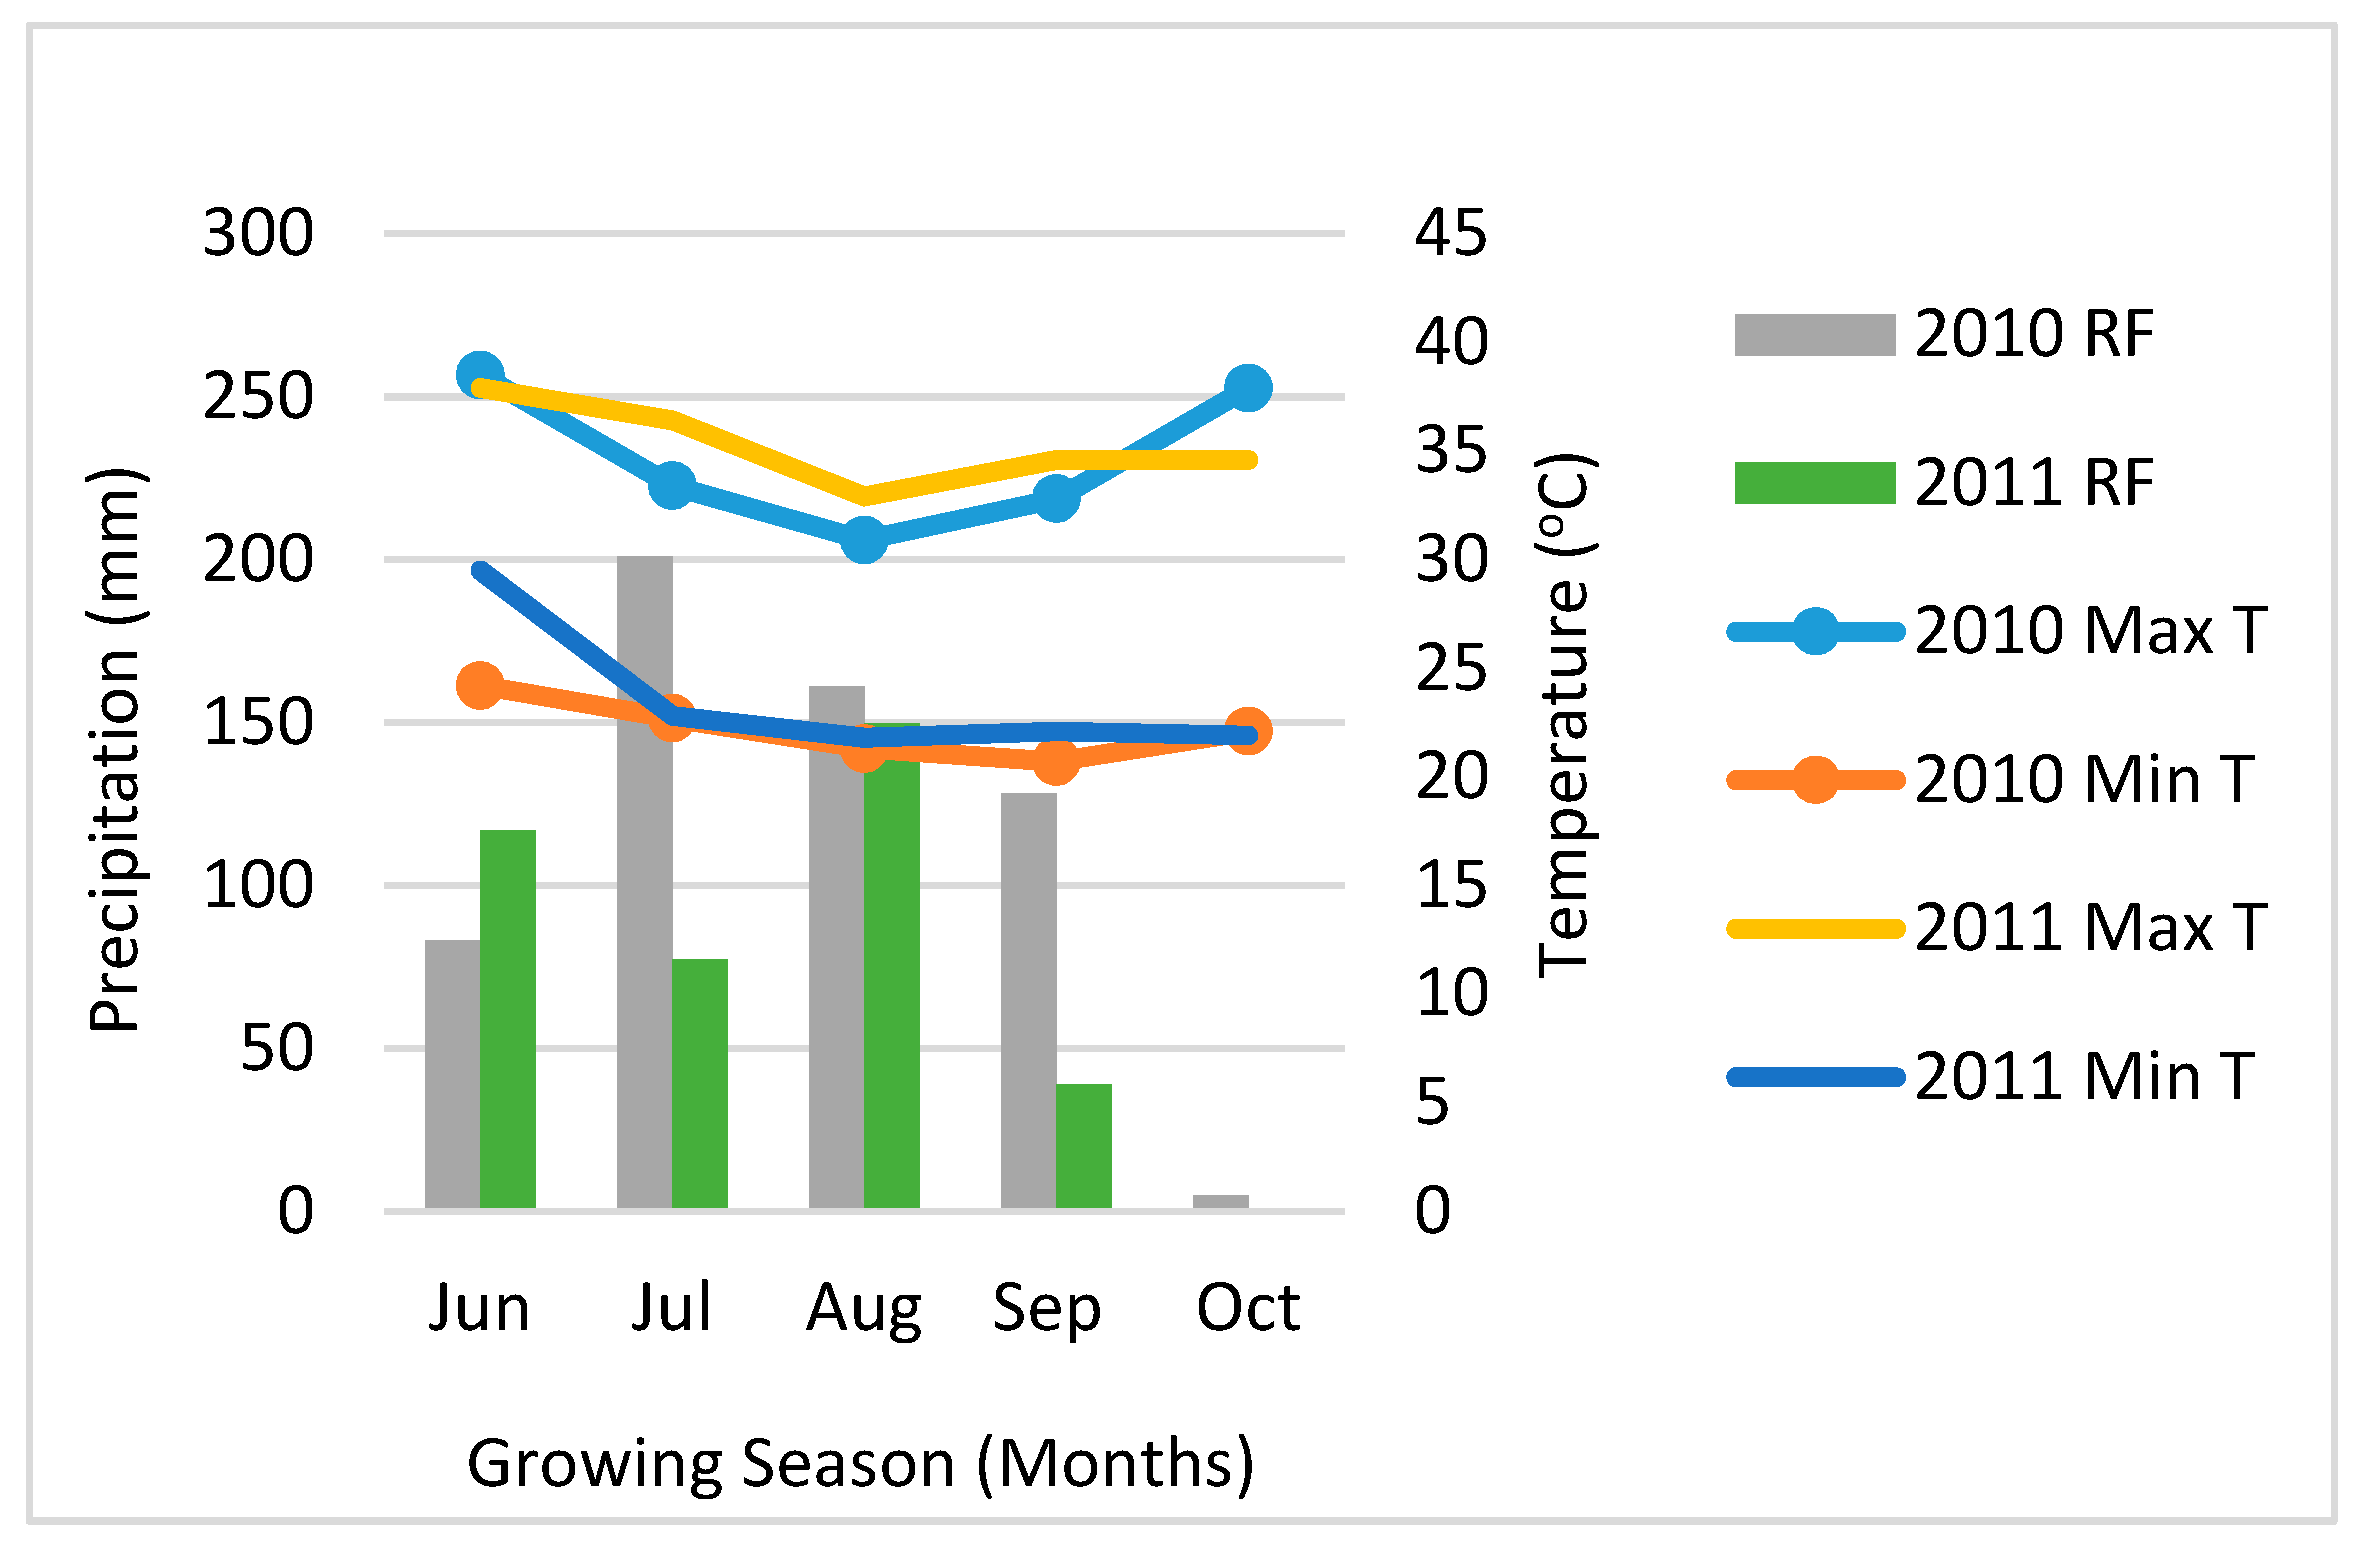
3.1. Weather Conditions

During the growing seasons, the experimental site received 503 and 411.5 mm rainfall in 2010 and 2011, respectively.

3.2. Physical and Chemical Properties of the Soil

The total content of N and P was very low in the soil (0.046 kg−1 and 0.00076 kg−1, respectively) while the potassium (K) content was at an acceptable level (0.029 g kg−1 soil). The soil organic matter was low (0.79%) while pH was high (8.35) (Table 1).

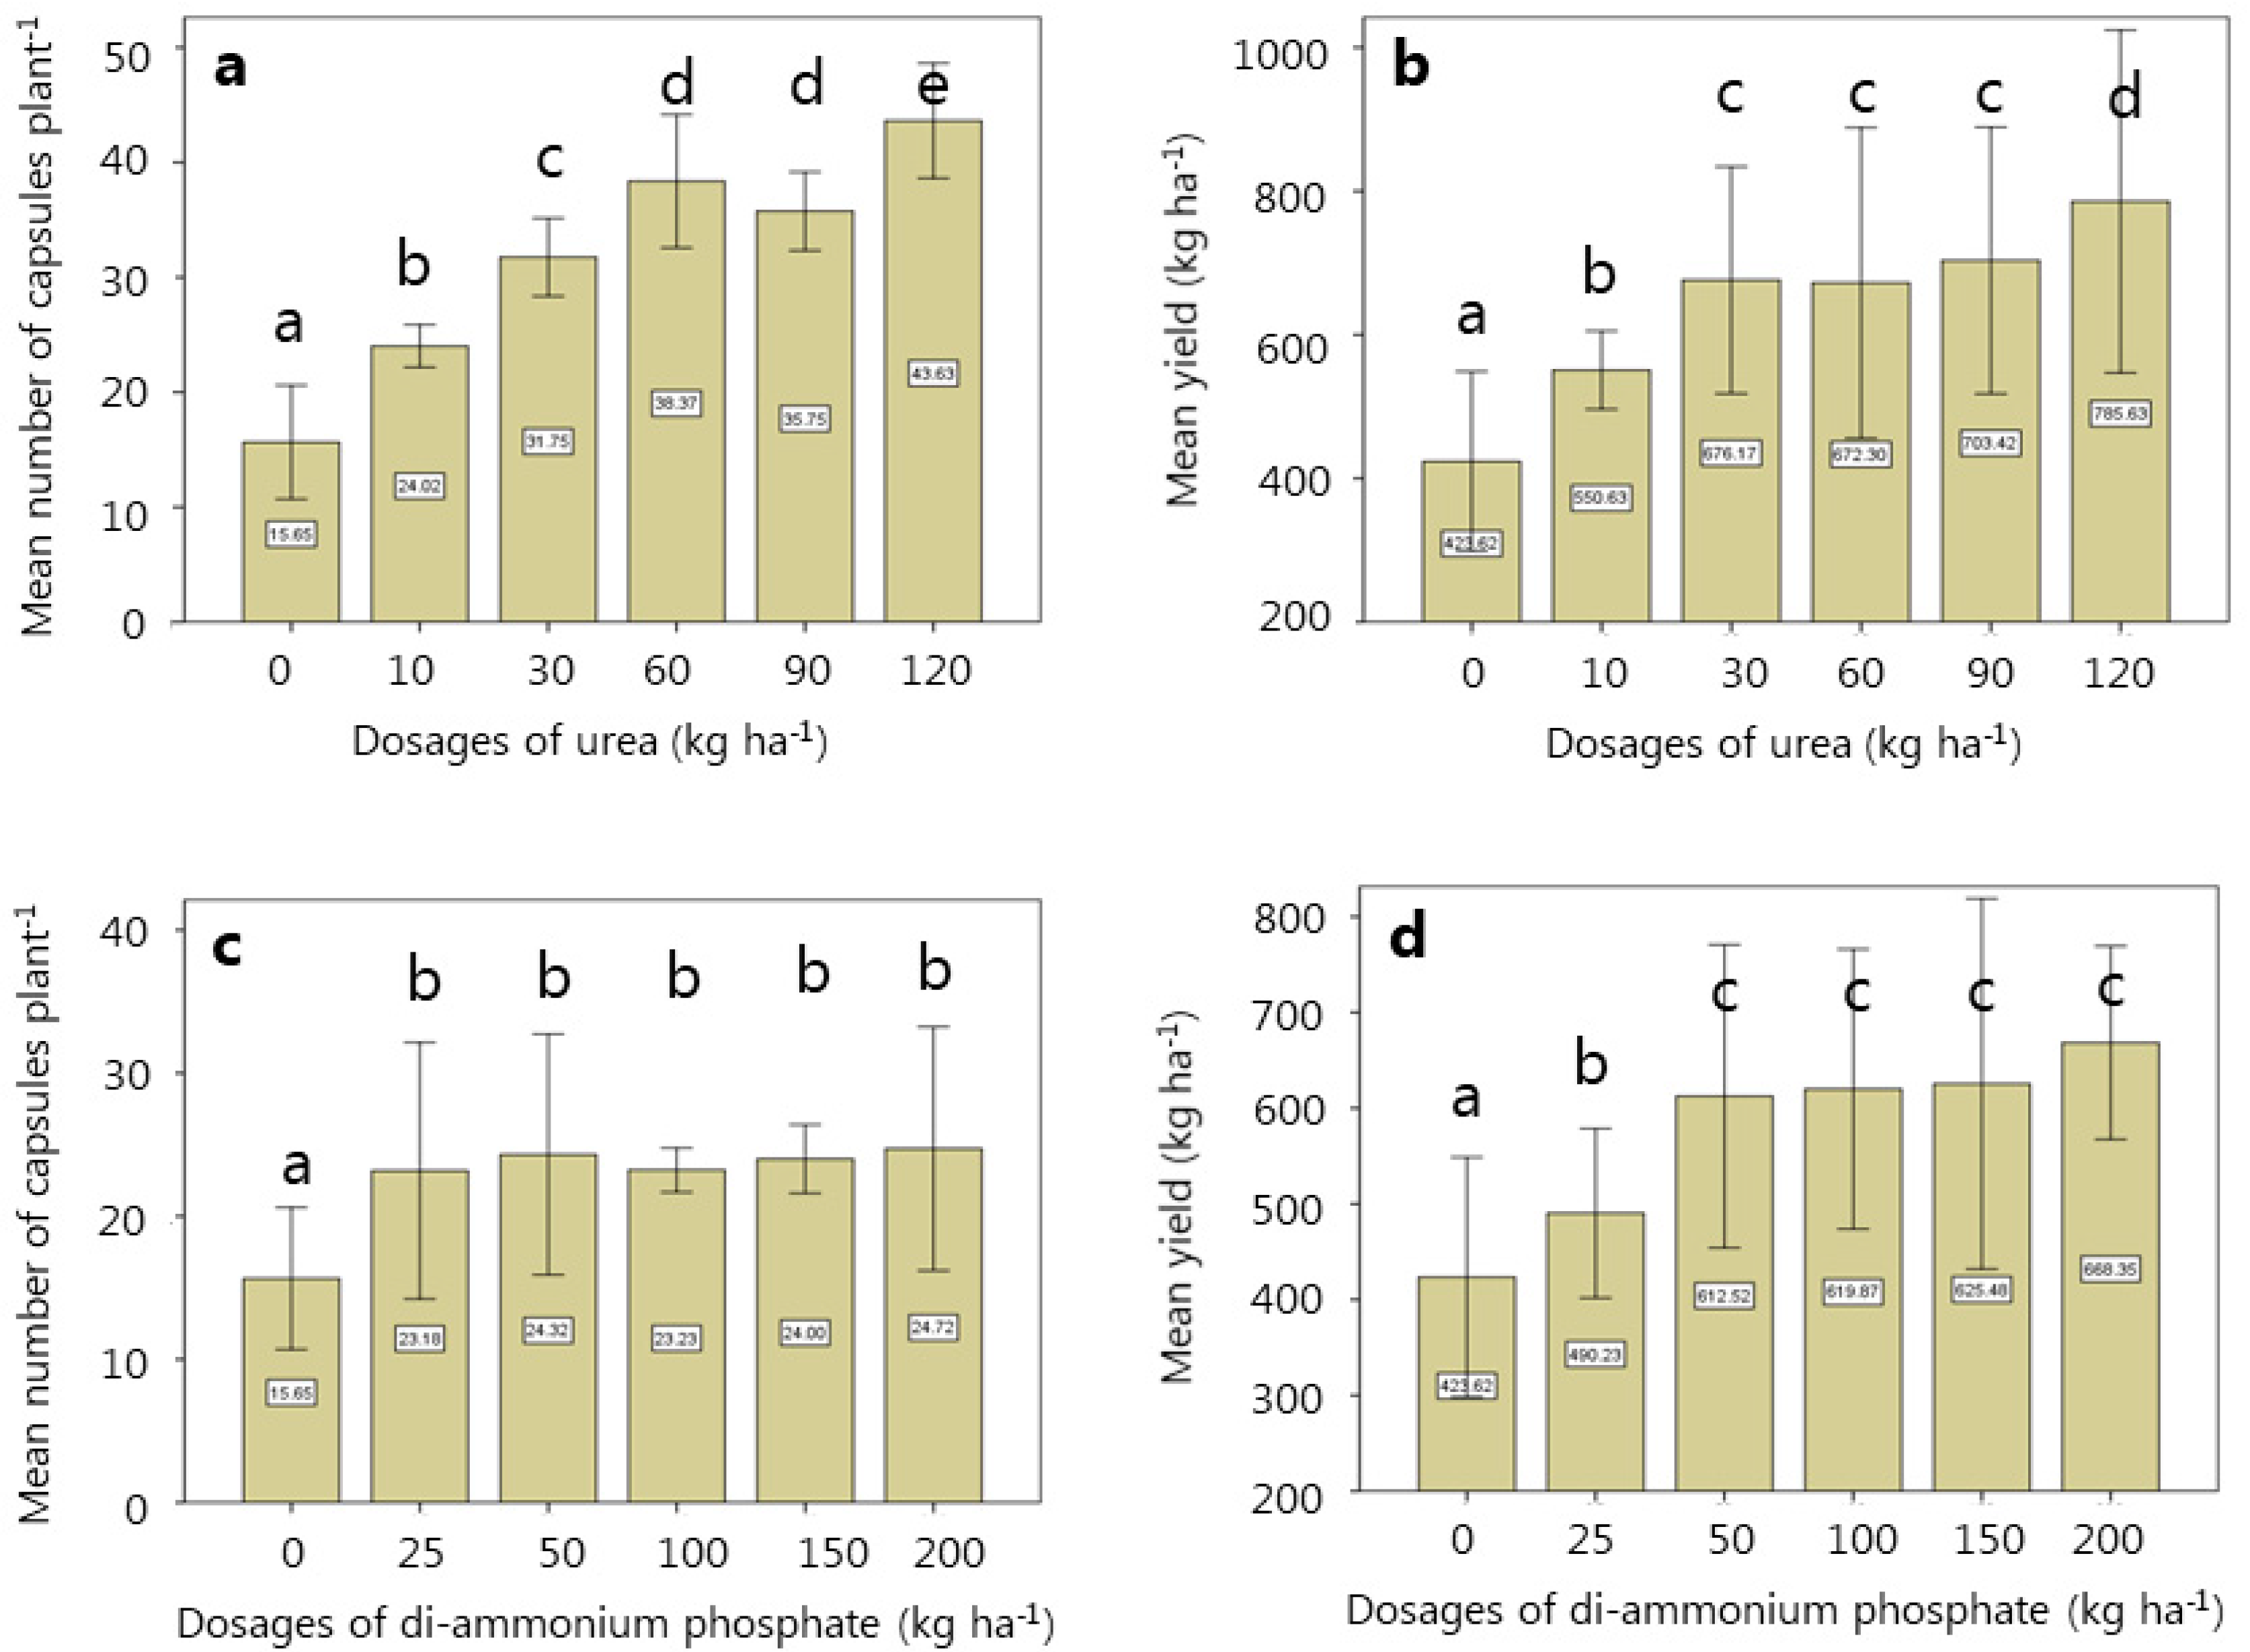
3.3. Effect of Urea and DAP on Growth Parameters and Yield

N application significantly influenced the growth parameters and yield traits of sesame. Days to 50% flowering was reduced by nitrogen fertilization. Plots receiving 69 kg N ha−1 flowered one day earlier than the control plots. Application of 23 kg N ha−1 resulted in significantly slower maturation than any other N-treatments. Plots receiving 92 kg N ha−1 matured three days earlier than plots receiving 23 kg N ha−1. Plant height increased by the increasing rate of N nutrient. The tallest plants (104.1 cm) were in plots fertilized with 92 kg N ha−1, whereas the smallest plants (90.2 cm) were in unfertilized plots (Table 2). Increasing N application resulted in an increasing number of capsules plant−1 except for 69 kg N ha−1 (Figure 2a). The largest number of capsules plant−1 was in plots receiving 92 kg N ha−1, having 20 capsules more than the unfertilized plot (Table 2). Increasing application of N increased the yield (Figure 2b). The highest yield (917.8 kg ha−1) was obtained at the highest rate of N (92 kg N ha−1) while unfertilized plots had the lowest yield (572.8 kg ha−1) (Table 2).
Application of DAP (P and N) affected all phenological parameters except days to maturity (Table 2). On average, the control plants flourished one day later than plants receiving 200 kg DAP ha−1 (92 kg P ha−1 and 36 kg N ha−1). Plant height increased with increasing rates of DAP. However, adding 200 kg DAP ha−1 did not increase the plant height further. Plants receiving 150 kg DAP ha−1 (69 Kg P ha−1 and 27 kg N ha−1) and 200 kg DAP ha−1 (92 kg P ha−1 and 36 kg N ha−1) were 4.7 cm taller than the control plants (95.6 cm). Increasing DAP application also resulted in an increasing number of capsules plant−1 (Figure 2c). The highest number of capsules plant−1 (43.4) was obtained in the plots fertilized with 200 kg DAP ha−1 (92 kg P ha−1 and 36 kg N ha−1) whereas the lowest number of capsules plant−1 (31.5) were recorded in the control plots (without DAP). DAP application also significantly influenced the seed yield (Figure 2d). The largest yield (917.8 kg ha−1) was obtained at the largest rate 200 kg DAP ha−1 (92 kg P ha−1 and 36 kg N ha−1) while the lowest yields were recorded in unfertilized plots (640.9 kg ha−1).

3.4. Interaction between Year, N (Urea) and DAP Applications

Year interacted significantly with the N applications considering all phenological parameters and yield (Table 2). There was a significant interaction between year and DAP applications influencing all phenological parameters and yield except days to flowering and days to maturity. Interaction effects of N and DAP significantly impacted all the parameters except days to maturity (Table 2). Three-factor interaction (N, DAP and year) significantly affected the yield ha−1 (Table 2).
The highest number of days to flowering was recorded in unfertilized plots and 46 kg N ha−1 with 0 kg P ha−1 followed by 55 kg N ha−1 with 23 k P ha−1. The lowest number of days to flower (44.2) was obtained in plots receiving 34.5 kg N ha−1 combined with 69 kg P ha−1 and 59 kg N ha−1 combined with 92 kg P ha−1 (Table 3).
The interaction between N and DAP significantly influenced plant height. The tallest plants (114.7 cm) were recorded at 119 kg N ha−1 with 69 kg P ha−1 whereas non-fertilized plants were the smallest (Table 4).
The interaction between N and DAP had a significant effect on the number of capsules plant−1 (p < 0.05). The number of capsules plant−1 increased with the increasing rate of N and DAP. The highest number of capsules plant−1 (48.6) was recorded at 105 kg N ha−1 and 92 kg P ha−1 while the lowest number of capsules plant−1 was recorded on non-fertilized plants (Table 5).
Interaction effects of N and DAP significantly influenced yield ha−1. The highest yield (1042.6 kg ha−1) was produced in plots receiving 128 kg N ha−1 combined with 92 kg P ha−1 but at par with the combinations of 46 × 50, 69 × 50, 92 × 50, 23 × 100, 23 × 150, 69 × 150, 92 × 150, 23 × 200, 46 × 200, 69 × 200 kg N ha−1 and DAP ha−1 (Table 6).

3.5. Partial Budget Analysis

Among 36 treatments of urea and DAP, 13 treatments were classified as dominant (excluded from the marginal analysis calculation) (Table 7). Dominant treatments are treatments resulting in lower net revenue compared to treatments resulting in maximum net revenue because the cost increased. Therefore, MRR was not calculated for these treatments as they were not cost effective. The costs were increasing and the net revenue was decreasing from the highest net revenue, and consequently, they were not profitable for the farmers (Table 8). Of all combined treatments of N and DAP, the highest MRR was 28,403 birr (284%) obtained with an application of 46 kg P ha−1 and 41 kg N ha−1 from 100 kg DAP ha−1 and 50 kg urea ha−1, resulting in a yield of 984.6 kg ha−1 (Table 8, no 16). This indicates that a farmer can obtain 284.03 birr extra by investing one birr on buying fertilizer for application of 46 kg P ha−1 and 41 kg N ha−1 from 100 kg DAP ha−1 and 50 kg urea ha−1.

4. Discussion

The application of N and DAP significantly influenced both growth and yield parameters. The alkaline soil (pH: 8.35) and the high temperatures may cause a high rate of volatilization of ammonium because 1) they increase soil concentrations of ammonia dissolved in soil water and 2) warm soil water cannot hold as much ammonia gas. Urea fertilizers can furthermore temporarily increase soil pH within an inch of the granule, sufficiently to increase volatilization loss [29]. Therefore, the N use efficiency would be lower than in soils with lower pH.
Plants receiving both fertilizers flourished earlier than unfertilized plants. Fertilized plants reached the eight-leaf stage earlier than unfertilized plants. This finding contradicts the results of Fathy and Mohamed [30], who found that the number of days to flowering increased as the rate of fertilizer increased. Days to maturity was significantly influenced by different rates of both nitrogen and phosphorus fertilizer. Days to maturity increased as the rate of nitrogen increased up to 23 kg N ha−1, but days to maturity was not influenced by DAP application. This might be due to the low impact of phosphorus on the vegetative growth of sesame.
Plant height was significantly affected by the application of nitrogen and phosphorus. Generally, plant height increased as the rate of both fertilizers increased. The tallest plants were recorded from the plots receiving 119 kg N ha−1 with 69 kg P ha−1 and 128 kg N ha−1 with 92 kg P ha−1, whereas the smallest plants were found in the control plots. The largest numbers of capsules plant−1 were obtained from the plots receiving the highest rate of both nitrogen and phosphorus. Abdel Rahman and El Mahdi [31] also found that increasing level of N and P resulted in increasing plant height and number of capsule plant−1 for the ‘Shuak’ variety grown under almost the same condition in Northern Sudan. Our results are also in line with studies of Kashani et al. [32] in Pakistan who used two different varieties (S-17 and Pr-125). They also recorded the tallest plants and largest number of capsules plant−1 at the highest rates of N (70 kg ha−1) and P (70 kg ha−1).
The interaction between nitrogen and phosphorus significantly affected the productivity of sesame. Seed yield ha−1 increased when both nutrients increased. The largest seed yield ha−1 was recorded when both nitrogen and phosphorus were applied at the highest rate of the treatment (128 kg N ha−1 and 92 P kg N ha−1) whereas the smallest seed yield was obtained from unfertilized plots. Akhtar et al. [11] used a different variety (Black) in Pakistan but observed the same. They found that the interaction between N and P resulted in the largest yield at the highest rate of treatments (60.4 kg N ha−1 and 36.8 kg P ha−1). Muhammad et al. [33] also reported from an experiment in the Peshawar valley, Pakistan, that increasing combination of N and P fertilizer (90 N kg ha−1 and 90 kg P ha−1) increased the yield.
The significant difference between the yields in 2010 and 2011 was probably due to differences in rainfall. Rainfall in 2010 was 503 mm, which is close to the optimum moisture requirement (600 mm) [3] while it was only 411.5 mm in 2011.
The highest MRR (28,403 birr) was obtained from 46 kg P ha−1 with 41 kg N ha−1 resulting in a yield of 984.6 kg seeds ha−1 (Table 8). This indicates that farmers can obtain 284 birr extra by investing one birr buying fertilizer to apply 46 kg P ha−1 with 41 kg N ha−1. In order to obtain 46 kg P ha−1 with 41 kg N ha−1, farmers should buy 100 kg DAP ha−1 and 50 kg urea ha−1.

5. Conclusions

Our experiments showed that adding N and P fertilizer could increase the yield considerably in the Humera area of north-west Ethiopia. The largest seed yield (1042.6 ha−1) was recorded when both nitrogen and phosphorus were applied at the highest rates (128 kg N ha−1 and 92 P kg N ha−1), whereas the smallest seed yield (423.6 ha−1) was obtained from unfertilized plots. However, as the farmers in this area have limited resources, we would only recommend adding 46 kg P ha−1 and 41 kg N ha−1 nutrients from 100 kg DAP ha−1 and 50 kg urea ha−1 resulting in a yield of 984.6 kg seeds ha−1. Adding more nutrients did not improve the yield in such a way that it would justify an investment in more fertilizer.

Author Contributions

M.A. and D.F. did the experimental work, processed the data and wrote the first draft of the manuscript. C.A. supervised and revised the manuscript. All authors edited and accepted the manuscript.

Funding

This study was supported financially by Ethiopian Institute of Agricultural Research, Tigray Agricultural Research Institute, Humera Agricultural Research Center.

Acknowledgments

We thank Department of Plant and Environment Sciences, University of Copenhagen, Denmark for paying the cost of the publication.

Conflicts of Interest

The authors declare no conflict of interest. The funders had no role in the design of the study; in the collection, analyses, or interpretation of data; in the writing of the manuscript, or in the decision to publish the results.

References

  1. Langham, D.R.; Smith, G.; Wiemers, T.; Riney, J. Sesame Production Information; Sesame Coordinators, Southwest Sesame Grower’s Pamphlet; SESACO: Austin, TX, USA, 2006. [Google Scholar]
  2. Anilakumar, K.R.; Pal, A.; Khanum, F.; Bawa, A.S. Nutritional, medicinal and industrial uses of sesame (Sesamum indicum L.) Seeds—An Overview. Agric. Conspec. Sci. 2010, 75, 159–168. [Google Scholar]
  3. Anonymous. Sesame profile. Agricultural Marketing Resource Center. 2019. Available online: https://www.agmrc.org/commodities-products/grains-oilseeds/sesame-profile (accessed on 18 October 2019).
  4. CSA (Central Statistical Agency). Review to Improve Estimation of Livestock Contribution to the National GDP; Central Statistical Agency: Addis Ababa, Ethiopia, 2009; Volume 16.
  5. Girmay, A.B. Sesame production, challenges and opportunities in Ethiopia. Vegetos An. Int. J. Plant Res. Biotech. 2018, 31, 51–56. [Google Scholar] [CrossRef]
  6. Hailemariam, A. Grain yield and economic returns of Sesame (Sesamum indicum L.) induced by in-situ moisture conservation and sulfur fertilization on vertisol of Western Tigray, Ethiopia. Asian Soil. Res. J. 2018, 1, 1–15. [Google Scholar]
  7. Cook, G.W. The control of soil fertility. Nature 1967, 213, 868–869. [Google Scholar] [CrossRef]
  8. Tekalign, T. Soil, Plant, Water, Fertilizer, Animal Manure and Compost Analysis; Working Document No. 13; International Livestock Research Center for Africa: Addis Ababa, Ethiopia, 1991. [Google Scholar]
  9. Adam, N.M. Agronomy of Sesame, Sunflower and Soybean; Annual Report; Kenana Research Station: Kanana, Sudan, 1986. [Google Scholar]
  10. Ahrnad, A.; Akhtar, M.; Hussain, A.; Ehsanullah; Musaddique, M. Genotypic response of sesame to nitrogen and phosphorus application. Pak. J. Agric. Sci. 2001, 38, 12–15. Available online: https://www.pakjas.com.pk/papers/627.pdf (accessed on 18 October 2019).
  11. Akhtar, J.; Baqa, S.; Khan, S.; Kakar, A.K.; Abro, B.A.; Baloch, P.A. Effect of different levels of nitrogen and phosphorus on growth and yield of sesame. Int. J. Biol. Biotech. 2015, 12, 493–498. Available online: https://www.academia.edu/15358797/EFFECT_OF_DIFFERENT_LEVELS_OF_NITROGEN_AND_PHOSPHORUS_ON_GROWTH_AND_YIELD_OF_SESAME (accessed on 18 October 2019).
  12. Malik, M.A.; Saleem, M.F.; Cheema, M.A.; Ahmed, S. Influence of different nitrogen levels on productivity of sesame (Sesamum indicum L.) under varying planting patterns. Int. J. Agric. Biol. 2003, 5, 490–492. [Google Scholar]
  13. Rao, V.P.; Raikhelkar, S.V.; Sondge, V.D. Effect of irrigation and fertilization on yield and its components in sesame (Sesamum indicum L.). Indian J. Agric. Sci. 1994, 64, 93–100. [Google Scholar]
  14. Schilling, R.; Cattan, P. Sesame cultivation in tropical Africa. Oleagineux 1991, 46, 125–133. [Google Scholar]
  15. FAO (Food and Agricultural Organization). FAOSTAT. 2019. Available online: https://www.pakjas.com.pk/papers/627.pdf (accessed on 18 October 2019).
  16. EARO (Ethiopian Agricultural Research Organization). An Assessment of Agricultural Production Base, Technological Packages and Innovation Strategies for Commercial Farmers in Kafta Humera District Tigray Regional State, Ethiopia; EARO (Ethiopian Agricultural Research Organization): Addis Ababa, Ethiopia, 2002; p. 21. [Google Scholar]
  17. McLean, E.O. Soil pH and Lime Requirement. In Methods of Soil Analysis, 2nd ed.; Page, A.L., Miller, R.H., Eds.; Part 2; American Society of Agronomy, Inc.: Madison, WI, USA; Soil Science Society of America, Inc.: Madison, WI, USA, 1982; p. 200. [Google Scholar]
  18. Jackson, M.L. Soil Chemical Analysis; Practice Hall of India: New Delhi, India, 1967. [Google Scholar]
  19. Walkley, A.; Black, I.A. An examination of the Degtjareff method for determining soil organic matter and proposed chromic acid titration method. Soil Sci. 1934, 37, 29–38. [Google Scholar] [CrossRef]
  20. Bremner, J.M. Nitrogen-Urea. In Methods of Soil Analysis; Page, A.L., Miller, R.H., Keeney, D.R., Eds.; Part 2. Chemical and Microbiological Properties; Soil Science Society of America, American Society of Agronomy: Madison, WI, USA, 1982; pp. 699–708. [Google Scholar]
  21. Bray, R.H.M.; Kurtz, L.T. Determination of total, organic, and available forms of P in soils. Soil. Sci. 1945, 59, 39–45. [Google Scholar] [CrossRef]
  22. Knudsen, D.; Peterson, G.A.; Pratt, P.F. Exchangeable and soluble potassium. In Methods of Soil Analysis, 2nd ed.; Page, A.L., Miller, R.H., Eds.; Part 2; American Society of Agronomy, Inc., Soil Science Society of America, Inc.: Madison, WI, USA, 1982; pp. 228–238. [Google Scholar]
  23. FAO (Food and Agricultural Organization). Guide to Laboratory Establishment for Plant Nutrient Analysis; Fertilizer and plant nutrition bulletin, 19; FAO (Food and Agricultural Organization): Rome, Italy, 2008. [Google Scholar]
  24. Ball, F. Loss-on-ignition as an estimate of organic soils matter and organic carbon in non-calcareous soils. The Nature Conservancy, Bangor, Wales. J. Soil Sci. 1964, 15, 84–92. [Google Scholar] [CrossRef]
  25. Bouyoucos, J. Hydrometer method improved for making particle size analysis of soil. Agron. J. 1962, 54, 464–465. [Google Scholar] [CrossRef]
  26. Mahgoub, B.M.; Omer, S.O.; Elami, E.A. The Critical Period of Weed Control in Sesame (Sesamum orientale L.). J. For. Prod. Ind. 2014, 3, 6–70. [Google Scholar]
  27. Biru, A. Agronomic Research Manual: Formulae and Tables; Ethiopian Institute of Agricultural Research: Addis Ababa, Ethiopia, 1978; p. 52. [Google Scholar]
  28. CIMMYT. From Agronomic Data to Farmer Recommendations: An Economics Training Manual; CIMMYT: El Batán, Mexico, 1988; Volume 27. [Google Scholar]
  29. Rochette, P.; MacDonald, J.D.; Angers, D.A.; Chantigny, M.H.; Gasser, M.; Bertrand, N. Banding of urea increased ammonia volatilization in a dry acidic soil. J. Environ. Quality. 2009, 38, 1383–1390. [Google Scholar] [CrossRef] [PubMed]
  30. Fathy, S.E.; Mohamed, S.A. Response of seed yield, yield components and oil contents to the sesame cultivars and nitrogen fertilizer rate diversity. Electron. J. Environ. Agric. Food Chem. 2009, 8, 287–293. [Google Scholar]
  31. El Mahdi, A.R.A. Response of sesame to nitrogen and phosphorus fertilization in Northern Sudan. J. Appl. Biosci. 2008, 2, 304–308. [Google Scholar]
  32. Kashani, S.; Buriro, M.; Nadeem, A.; Ahmed, N.; Saeed, Z.; Mohammad, F.; Ahmed, S. Response of various sesame varieties under the influence of nitrogen and phosphorus doses. Amer. J. Plant. Sci. 2015, 6, 405–412. [Google Scholar] [CrossRef]
  33. Ibrahim, M.; Jamal, Y.; Basir, A.; Adnan, M.; Khan, I.A. Response of Sesame (Sesamum indicum L.) to various levels of nitrogen and phosphorus in agro-climatic condition of Peshawar. Pure Appl. Biol. 2016, 5, 121–126. [Google Scholar] [CrossRef]
Figure 1. Precipitation, minimum, and maximum temperatures of the experimental site during the growing seasons of 2010 and 2011. RF = rainfall (mm), Max T = maximum temperature, Min T = minimum temperature.
Agriculture 09 00227 g001
Figure 2. (a) The relationship between the rate of urea and the number of capsules plant−1 without application of di-ammonium phosphate. (b) The relationship between the rate of urea and the yield without application of di-ammonium phosphate. (c) The relationship between the rate of di-ammonium phosphate and the number of capsules plant−1 without application of urea. (d) The relationship between the rate of di-ammonium phosphate and yield without application of urea. Lines show 95% confidence intervals. Bars with different letters are statistically significantly different from each other.
Agriculture 09 00227 g002
Table 1. Physical and chemical properties of the soil (average of sample from 2010 and 2011).
Soil ParametersMeasurementsMethod of AnalysisReferences
pH8.38pH meter (1:2.5)[17]
Electrical conductivity0.36 (dS m−1)EC meter[18]
Organic carbon0.46%Walkley and Black[19]
Total nitrogen0.046%Kjeldahl[20]
Available phosphorous0.76 (g kg−1)Bray P1[21]
Available potassium290 (g kg−1)Flame photometer[22]
Cation exchanges capacity56 meq. (100 g−1)Ammonium acetate[23]
Organic matter0.79%Loss on ignition[24]
Clay content31.9%Hydrometer method[25]
Silt content29.0%Hydrometer method[25]
Table 2. The effects of nitrogen (N) from urea and di-ammonium phosphate (DAP) fertilizers on growth parameters, number of capsules, and yield of sesame in 2010 and 2011.
N (kg ha−1)DFDMPHTNCYield
046.0 a89.6 b90.2 d22.5 d572.8 e
11.545.4 ab89.0 b99.8 b32.3 c710.8 d
2345.0 ab91.3 a103.4 a43.4 c918.5 a
4645.1 b88.8 b96.5 c38.8 b806.7 c
6944.9 b89.8 b99.6 b40.1 b884.6 b
9245.4 ab88.4 b104.1 a42.8 a917.8 a
DAP (kg ha−1) (1)
045.7 a89.9 a95.6 c31.5 e640.9 e
2545.5 ab89.2 a95.7 c34.3 d741.8 cd
5045.9 a89.8 a96.8 c34.5 d780.5 c
10045.3 ab89.4 a98.7 b37.3 c845.9 b
15044.9 bc88.9 a103.4 a38.8 c894.4 a
20044.7 c89.8 a103.4 a43.4 a907.7 a
Interactions
Year*N**********
Year*DAPnsns****
N*DAP**ns******
Year*N*DAPnsnsnsns**
DF = days to 50% flowering, DM = days to maturity, PHT = plant height in cm, NC = number of capsules plant−1. *: p < 0.05, **: p < 0.01, ns = p > 0.05. Numbers with different letters in a column are statistically significantly different. (1) 25 kg DAP ha−1 = 11. 5 kg P ha−1 and 4.5 kg N ha−1; 50 kg DAP ha−1 = (23 kg P ha−1 and 9 kg ha−1; 100 kg DAP ha−1 = 46 kg P ha−1 and 18 kg N ha−1; 150 Kg DAP ha−1 = 69 kg P ha−1 and 27 kg N ha−1; 200 kg DAP ha−1 = 92 kg P ha−1 and 36 kg N ha−1.
Table 3. Number of days to flowering at different combination of DAP and N applications.
N (kg ha−1) DAP (kg ha−1) (1)
02550100150200
046.8 a44.2 cd45.7 b–d46.0 b–d45.3 b–d45.0 cd
11.545.5 b–d45.8 b–d47.0 b45.3 b–d44.2 d44.7 cd
2344.8 cd44.7 b–d45.7 b–d45.3 b–d45.5 b–d44.2 d
4646.8 cd44.7 b–d46.5 bc44.8 cd44.5 d44.5 d
6944.8 cd45.5 b–d45.0 cd45.2 cd44.8 cd44.3 d
9245.5 b–d46.0 b–d45.5 b–d45.2 cd44.8 cd45.3 b–d
Numbers with different letters are statistically significantly different. (1) 25 kg DAP ha−1 = 11. 5 kg P ha−1 and 4.5 kg N ha−1; 50 kg DAP ha−1 = (23 kg P ha−1 and 9 kg ha−1; 100 kg DAP ha−1 = 46 kg P ha−1 and 18 kg N ha−1; 150 kg DAP ha−1 = 69 kg P ha−1 and 27 kg N ha−1; 200 kg DAP ha−1 = 92 kg P ha−1 and 36 kg N ha−1.
Table 4. Plant height (cm) at different combinations of DAP and urea applications.
N (kg ha−1) DAP (kg ha−1) (1)
02550100150200
074.8 j83.6 i88.2 i94.3 f–h98.9 d–h101.4 b–d
11.5103.6 b–d98.8 d–h93.7 h99.5 c–g100.0 c–e103.1 b–d
2398.8 d–h105.0 bc102.9 b–d103.2 b–d105.8 b104.8 bc
4695.9 e–h93.8 h94.1 gh94.2 f–h98.6 d–h102.2 b–d
6998.3 d–h93.7 h102.0 b–d99.5 c–g102.2 b–d101.9 b–d
92102.0 b–d99.6 c–f100.1 c–e101.7 b–d114.7 a106.8 b
Numbers with different letters are statistically significantly different. (1) 25 kg DAP ha−1 = 11. 5 kg P ha−1 and 4.5 kg N ha−1; 50 kg DAP ha−1 = (23 kg P ha−1 and 9 kg ha−1; 100 kg DAP ha−1 = 46 kg P ha−1 and 18 kg N ha−1; 150 kg DAP ha−1 = 69 kg P ha−1 and 27 kg N ha−1; 200 kg DAP ha−1 = 92 kg P ha−1 and 36 kg N ha−1.
Table 5. Number of capsules plant−1 at different combinations of DAP and urea applications.
N (kg/ha−1) DAP (kg ha−1) (1)
02550100150200
015.7 n23.2 m24.3 m23.2 m24.0 m24.7 m
11.524.0 m25.0 m26.7 m31.7 l39.8 gi46.4 ae
2331.8 l47.0 ad42.8 eg47.7 ac42.8 eg48.4 ab
4638.4 hj33.8 kl38.2 hi37.9 ij40.1 gi44.5 bf
6935.8 jk35.4 jl35.3 jl41.6 fi43.8 cg48.6 a
9243.6 dg41.6 fi40.0 gi41.6 fh42.1 fh47.8 ab
Numbers with different letters are statistically significantly different. (1) 25 kg DAP ha−1 = 11. 5 kg P ha−1 and 4.5 kg N ha−1; 50 kg DAP ha−1 = (23 kg P ha−1 and 9 kg ha−1; 100 kg DAP ha−1 = 46 kg P ha−1 and 18 kg N ha−1; 150 kg DAP ha−1 = 69 kg P ha−1 and 27 kg N ha−1; 200 kg DAP ha−1 = 92 kg P ha−1 and 36 kg N ha−1.
Table 6. Yields of sesame (kg ha−1) at different combinations of N and DAP applications.
N (kg ha−1)DAP (kg ha−1) (1)
02550100150200
0423.6 n490.2 m612.5 jk619.9 jk625.5 jk665.0 ijk
11.5550.6 l650.3 ijk672.0 h–k730.5 fgh844.8 cd816.6 de
23676.2 g–j863.0 cd902.1 e997.4 ab1030.4 ab1041.9 a
46689.0 ghi765.4 ef734.6 fg852.9 cd890.9 c907.3 c
69703.4 ghi821.4 de896.8 c905.2 c987.7 ab993.0 ab
92802.3 de860.8 cd864.8 cd969.4 b987.1 ab1022.6 ab
Numbers with different letters are statistically significantly different. (1) 25 kg DAP ha−1 = 11. 5 kg P ha−1 and 4.5 kg N ha−1; 50 kg DAP ha−1 = (23 kg P ha−1 and 9 kg ha−1; 100 kg DAP ha−1 = 46 kg P ha−1 and 18 kg N ha−1; 150 kg DAP ha−1 = 69 kg P ha−1 and 27 kg N ha−1; 200 kg DAP ha−1 = 92 kg P ha−1 and 36 kg N ha−1.
Table 7. Dominance analysis for interaction between di-ammonium phosphate (DAP) and N rates. TCV is the total variable cost ha−1.
No.Treatment (DAP and N Interaction)Total RevenueTVCNet Revenue
DAP (kg ha−1) (1)N (kg ha−1)(birr)(birr)(birr)
10019,062019,062
2011.525,00240024,602
325022,05942521,634
402328,92680028,126
52511.529,25082528,425
650026,17285025,322
7252337,566122536,341
85011.530,240125028,990
904631,001160029,401
10502337,589165035,939
11100026,757170025,057
12254633,710202531,685
1310011.531,788210029,688
1406926,226240023,826
15504630,056245027,606
161002344,307250041,807
17150028,125255025,575
18256931,460282528,635
1915011.538,016295035,066
2009235,100320031,900
21506939,650325036,400
221004636,882330033,582
231502346,368335043,018
24200029,9253400D 26,525
25259238,7363625D 35,111
2620011.536,7473800D 32,947
27509237,4184050D 33,368
281006937,1484100D 33,048
291504640,3924150D 36,242
302002342,5524200D 38,352
311009242,1254900D 37,225
321506944,4474950D 39,497
332004640,8295000D 35,829
341509239,4835750D 33,733
342006944,6815800D 38,881
362009246,9176600D 40,317
No. = serial number. TVC = total variable costs (DAP and N). Below S.N 23 the treatments are dominated and denoted by “D” since the profit is decreasing while the costs are increasing, and therefore, these are excluded from calculating MRR in Table 8. (1) 25 kg DAP ha−1 = 11. 5 kg P ha−1 and 4.5 kg N ha−1; 50 kg DAP ha−1 = (23 kg P ha−1 and 9 kg ha−1; 100 kg DAP ha−1 = 46 kg P ha−1 and 18 kg N ha−1; 150 kg DAP ha−1 = 69 kg P ha−1 and 27 kg N ha−1; 200 kg DAP ha−1 = 92 kg P ha−1 and 36 kg N ha−1.
Table 8. Partial budget analysis of DAP and Urea combinations.
No.TreatmentsTCVNet RevenueMRR %
DAP (kg ha−1) (1)N (kg ha−1)(birr)(birr)(birr)
100019,062---
2011.540024,6021385
3252342521,634−11,872
404680028,1261731
5256982528,4251196
650085025,322−12,412
72523122536,3412938
85011.5125028,990−29,404
9046160029,401117
105023165035,93913,076
111000170025,057−21,763
122546202531,6852.039
1310011.5210029,688−2663
14069240023,826−1954
155046245027,6067560
1610023250041,80728,403
171500255025,575−32,464
182569282528,6351.113
1915011.5295035,0665145
20092320031,900−1266
215069325036,4009000
2210046330033,582−5635
2315023335043,01818,872
No. = serial number. TCV: total variable costs (DAP and N application). MRR: marginal rate of return. (1) 25 kg DAP ha−1 = 11. 5 kg P ha−1 and 4.5 kg N ha−1; 50 kg DAP ha−1 = (23 kg P ha−1 and 9 kg ha−1; 100 kg DAP ha−1 = 46 kg P ha−1 and 18 kg N ha−1; 150 kg DAP ha−1 = 69 kg P ha−1 and 27 kg N ha−1; 200 kg DAP ha−1 = 92 kg P ha−1 and 36 kg N ha−1.

