Article

Abiotic and Biotic Limitations to Nodulation by Leguminous Cover Crops in South Texas

1
School of Earth, Environmental and Marine Sciences, University of Texas Rio Grande Valley, Edinburg, TX 78539, USA
2
Department of Biology, University of Texas Rio Grande Valley, Edinburg, TX 78539, USA
*
Authors to whom correspondence should be addressed.
Agriculture 2019, 9(10), 209; https://doi.org/10.3390/agriculture9100209
Submission received: 27 August 2019 / Revised: 18 September 2019 / Accepted: 20 September 2019 / Published: 23 September 2019

Abstract

:
Many farms use leguminous cover crops as a nutrient management strategy to reduce their need for nitrogen fertilizer. When they are effective, leguminous cover crops are a valuable tool for sustainable nutrient management. However, the symbiotic partnership between legumes and nitrogen fixing rhizobia is vulnerable to several abiotic and biotic stressors that reduce nitrogen fixation efficiency in real world contexts. Sometimes, despite inoculation with rhizobial strains, this symbiosis fails to form. Such failure was observed in a 14-acre winter cover crop trial in the Rio Grande Valley (RGV) of Texas when three legume species produced no signs of nodulation or nitrogen fixation. This study examined the role of nitrogen, phosphorus, moisture, micronutrients, and native microbial communities in the nodulation of cowpea (Vigna unguiculata L. Walp) and assessed arbuscular mycorrhizal fungi as an intervention to improve nodulation. Results from two controlled studies confirm moisture and native microbial communities as major factors in nodulation success. Micronutrients showed mixed impacts on nodulation depending on plant stress conditions. Nitrogen and phosphorus deficiencies, however, were not likely causes, nor was mycorrhizal inoculation an effective intervention to improve nodulation. Inoculation method also had a major impact on nodulation rates. Continued research on improved inoculation practices and other ways to maximize nitrogen fixation efficiency will be required to increase successful on-farm implementation.

1. Introduction

Cover cropping is a conservation agriculture practice in which plants are grown for soil health benefits rather than for a harvestable yield [1]. Interest in cover cropping has burgeoned in recent years and survey data suggest that the number of U.S. farmers incorporating the practice and the number of acres covered are both on the rise [2]. Cover cropping can help increase soil organic matter, improve water infiltration, and enrich soil ecosystems among other contributions to soil health [3]. Leguminous cover crops as a biological source of nitrogen (N) are appealing to organic growers who often rely on more expensive N sources [4,5]. Legumes have potential as a low-cost component of soil fertility management with reduced N runoff compared to conventional systems [6].
Although much research effort has already been directed towards maximizing efficiency and yield for major leguminous commodities like soy [7], less attention has been given to efficient N fixation by leguminous cover crops. Few cover crop proponents discuss the possibility that leguminous cover crops might fail to form nodules and provide expected nutrient benefits. However, examples of nodulation failure are widespread and have been noted by farmers and researchers [8,9,10]. This problem emerged in our research when, despite rhizobial inoculation, 14 acres of leguminous cover crops—crimson clover (Trifolium incarnatum L.) (inoculated with Ensifer meliloti Dangeard), hairy vetch (Vicia villosa Roth L.), and field peas (Pisum sativum var. arvense L. Poir) (both inoculated with Rhizobium leguminosarum Frank)—failed to form nodules during a winter field trial in subtropical south Texas. Aboveground, the plants appeared healthy, but root checks showed no signs of nodulation.
Widespread adoption of leguminous cover crops requires higher rates of nodulation success and more efficient implementation to realize benefits to soil health and fertility. When N fertilizer replacement value is considered alone (excluding long-term soil health benefits), the high cost of legume seeds can outweigh the low cost of synthetic N fertilizer [11]. Replacing synthetic N inputs with biological N from legumes has ecological benefits, such as reduced nitrous oxide emissions and lower nutrient runoff [12,13] but on-farm implementation depends on the cost-effectiveness of this strategy. If efficient N fixation cannot be assured, farmers may opt for non-legume cover cropping options with lower seed costs. Research on factors optimizing nodulation and N fixation in leguminous cover crops is therefore needed to address these impediments to increased adoption.
Biological N fixation relies on a delicate partnership between plant and bacterial species and is maximized when niche requirements are met for both species [14,15]. The legume is the dominant partner in this mutualism and factors that limit plant health and photosynthetic capacity will likewise limit N fixation potential [10,14]. However, even when optimal conditions are met for legume growth and development, rhizobial establishment can be independently inhibited by factors (Table 1) including nutrient excess or deficiency, moisture, acidity, element toxicity, native microbial competitors and problems with inoculation.

1.1. Moisture

Legumes require more moisture for N fixation than for plant growth [34,35]. Since nodule water availability depends on a balance between xylem export and supply via the phloem, even small changes in leaf water potential can lead to major reductions in nodule water supply [49]. Water is required to export N products from the nodules to the rest of the plant, so when nodule water supply is diminished, N products build up in the nodule and inhibit further fixation [18]. Extreme moisture stress can inhibit nodule initiation or cause nodule shedding in some legume species [35,37]. Excess moisture can also reduce N fixation potential if insufficient oxygen for rhizobial respiration is available [10].

1.2. Micronutrients

Legume–rhizobia symbiosis requires micronutrients including boron, cobalt, copper, iron, manganese, molybdenum, nickel, selenium, and zinc, sometimes at higher rates than the plant or free-living bacteria require alone [21]. Molybdenum, a key component of nitrogenase is often included on pre-season soil tests for legumes [21,50]. Molybdenum and other micronutrient deficiencies can be serious impediments to effective nodulation and N fixation [20,51].
In addition to the direct metabolic impacts of micronutrient deficiency on rhizobia, micronutrients can also indirectly impact nodule formation and activity [52]. Micronutrient nutrition can increase plant resistance to biotic and abiotic stressors, like pathogens, drought and high temperatures [53]. These stressors increase reactive oxygen species (ROS) levels in plants. ROS are signaling pathways in plant responses to pathogens and stressors but also cause oxidative damage if they are not detoxified [54]. One proposed explanation for the connection between micronutrient nutrition and stress resistance is that micronutrients are common components of the enzymes responsible for scavenging and detoxifying ROS [55].

1.3. Phosphorus

N fixation requires higher phosphorus (P) levels than plant growth for nodule initiation, growth and activity [26], and P deficiencies are commonly implicated in legume productivity issues [9,21]. Nodules typically have P contents between 0.72 and 1.2 percent and are a strong P sink within the plant, especially under stressful environmental conditions [19]. P deprivation is associated with decreased nodule tissue formation and low rates of N fixation [25,27].

1.4. Nitrogen

Nodulation and N fixation can be inhibited by high field N levels [9]. High levels of nitrate in or near the nodules inhibits nitrogenase activity through a feedback mechanism, thereby reducing N fixation [18]. Above a certain concentration, excess N can inhibit nodule initiation entirely [17]. Estimates for N levels that will eliminate nodulation vary widely. Some authors suggest a lower value of 50 kg/ha while others report nodulation for certain varieties at N levels as high as 120 kg/ha [17]. Tolerance of N fixation to high soil nitrate levels varies across legume species and even among genotypes of the same species [16].

1.5. Biotic Factors

Rhizobia are widespread in the Rio Grande Valley in association with native or naturalized legumes like burr medic, and introduced legumes like common bean, cowpea, and sunn hemp [56]. Better adapted native or naturalized rhizobia have been observed to outcompete introduced strains when competing for root infection sites [9]. Unfortunately, superior infectivity (ability to colonize roots) is not always accompanied by increased effectivity (ability to fix N) in rhizobia [22].

1.6. Mycorrhizae

Arbuscular mycorrhizal fungi (AMF) can help improve plant health under environmental stress [57,58]. Co-inoculation with AMF may improve N fixation, due to AMF’s contributions to plant nutrition as a P scavenger [59]. AMF inoculation may also help alleviate drought-induced oxidative damage and preserve nodule function under moisture stress conditions [60]. In field tests of mycorrhizae, however, results of inoculation often depend on the status of the native AMF population with a greater response to inoculation in soils where few native AMF are present [61].

1.7. Nodulation and Plant Vigor

Growth and development of plants, including legumes, is often limited by available N because of the large requirement (25%) of total plant N required for photosynthetic enzymes such as Rubisco [19,62]. Therefore, in N-limited systems, legumes which fix more N should have greater leaf biomass which in turn should promote enhanced growth.

1.8. Purpose of Experiments and Expected Outcomes

Clearly, multiple and potentially interacting abiotic and biotic factors influence nodule formation and subsequent N2 fixation. The purpose of this work is to explore the causes of nodulation problems in order to improve the efficacy of leguminous cover crops as a tool for the maintenance of N in subtropical soils. This investigation was conducted in two sequential parts, the first informing the design of the second.
The first was a coarse resolution assay to determine the dominant factors. In this assay, we expected that legumes supplemented with moisture and multiple micronutrients above field conditions would show higher levels of nodule formation, given the dry subtropical climate and potential for at least one micronutrient to be limiting among several candidate micronutrients. We also expected P addition to promote nodulation given the high P requirements for nodulation beyond that required for plant growth. We did not expect that high levels of N were impeding nodulation because native N soil concentrations are not high at our site, but we did expect that N addition would inhibit nodulation. We also expected that both sterilization and inoculation with AMF would promote nodulation, since such treatments would eliminate competition from native rhizobia and promote P scavenging, respectively. Finally, we expected that increased nodulation, arising from to natural variability or our imposed treatments, would result in plants with greater leaf biomass at a given plant size because of the large N requirement of leaf tissue.
Because the results of the coarse resolution experiment implicated micronutrients as one of the factors impeding nodulation, we followed up with a micronutrient experiment designed to explore whether a single micronutrient, independent of other micronutrients, was responsible. We expected that if a single micronutrient was inhibiting nodulation, rather than a more complex interaction of micronutrients, then legumes supplemented with a limiting micronutrient would show higher levels of nodule formation than those grown in native soil. In addition to the single micronutrient additions, we repeated the combined micronutrient addition from the coarse assay and expected the addition to similarly increase nodule formation.

2. Materials and Methods

2.1. Assay of Dominant Factors

Five separate experiments were conducted concurrently in controlled greenhouse conditions (Edinburg, TX) to examine the association of abiotic (moisture, micronutrients, phosphorus, nitrogen) and biotic (native microbial communities) conditions with nodulation in a common cover crop legume, cowpea (Vigna unguiculata). Each of these conditions can interact with any of the other factors, but exploring these interactions was beyond the scope of this study. In each experiment, the potential interaction of AMF as a participant in successful nodulation of cowpea was also examined. Although cowpea was not one of the three legume species that experienced nodulation failure in the original field trials, it is a commonly used warm season cover crop in this region and was planned for future plantings in this field.
For all experiments, Iron and Clay cowpea seeds (Vigna unguiculata; Johnny’s Seeds, Winslow, ME) were soaked for 10 min in 55 °C water, then pregerminated for 3 days in petri dishes in the greenhouse at 30 °C. Pregerminated seeds were then transplanted into 15 cm diameter plastic pots with 1500 g of a 1:1 mixture of perlite and soil obtained from the field where nodulation failure occurred (Hilltop Gardens, Lyford, TX). The only thorough survey of native rhizobia in this region was conducted with Phaseolus vulgaris and found diverse populations of Rhizobium phaseoli Dangeard [56]. Little is known about the native populations of Bradyrhizobium spp. which nodulate cowpea, but uninoculated cowpea in native soil were included as a control in this study and did form nodules, suggesting the presence of a native rhizobial partner.
Native soil was a Willacy fine sandy loam with a pH of 8.1. Nutrient extractions were conducted by Texas Plant and Soil Lab (Edinburg, TX). Nitrogen and phosphorus values are the average of 25 samples analyzed by Mehlich III extraction. Micronutrient values are from a single soil sample using the hot water method for boron extraction and DTPA for cobalt, copper, manganese, molybdenum, and zinc. Soil pH was measured using a multimedia pH meter (Bluelab, Tauranga, New Zealand) and soil texture was determined using the USDA NRCS Web Soil Survey and confirmed by hydrometer [63].
At transplant, 1 mL of Bradyrhizobium sp. (Vigna) inoculant solution (2 g inoculant/500 mL water; Verdesian N-Dure ®, Cary, NC) was applied to the seed radicle. This inoculant is sold for use with peanut, cowpea, lespedeza, and mung bean. On milliliter of mycorrhizal inoculant solution (1 g inoculant/500 mL water; Wildroot Organic, Austin, TX) was also applied at transplant to the cowpeas assigned to mycorrhizae (Myc+) treatments. In all experiments, cowpeas were grown for 75 days in greenhouse conditions. Daily temperature ranged between 28 °C and 6 °C on average, and relative humidity between 52% and 86%. Soil pH measurements were taken initially upon planting (mean −8.0 ± 0.1) and monthly during the experiment to check for pH changes from nutrient solutions, but none were detected. For all 30 treatments, eight replicate cowpeas were grown for each treatment and a subsample of five were randomly chosen for data collection.
Pots were watered based on daily moisture measurements using a moisture meter (ProCheck 5TE, Pullman WA). Except where otherwise indicated below, the pots were watered with 150 mL of tap water (or the designated nutrient solution, Table 2 and Table A1) whenever their soil moisture fell below a lower threshold of 5%. This amount of water raised the soil moisture to an upper target of 15%. Tap water was used instead of deionized water in order to better simulate field conditions since both rainwater and local irrigation water sources carry trace minerals [64,65]. However, in the absence of specific soil tests for nutrients of interest, exact treatment impacts cannot be determined. Levels listed in Table 3 should be considered lower thresholds. These lower thresholds (µg element/g dry soil) were calculated using the concentration for each nutrient solution, the total volume of solution applied over the course of each experiment, and the dry mass of the soil.

2.1.1. Moisture

Using a 3 × 2 factorial design, this experiment compared all combinations of three levels of moisture—high, mid, and cycle—and two levels of mycorrhizal inoculation—with (Myc+) or without (M–). Moisture levels were designated as high (soil moisture between 15%–25%), mid-range (soil moisture between 5%–15%) or saturation/drought cycle (between wilting point and field capacity). In the high moisture treatment, pots received 200 mL of tap water when they reached a lower threshold of 15% soil moisture which raised them to field saturation (around 25%). For the saturation/drought cycle, plants received 500 mL of tap water after 3 days below a threshold of 2.5% soil moisture. They were watered in two 250 mL increments to minimize leaching and runoff. The three-day wait was set based on the average time cowpeas took to wilt after reaching 2.5% soil moisture in a pre-trial assessment.

2.1.2. Micronutrients

Using a 2 × 2 factorial design, this experiment compared two levels of micronutrients—micronutrients added (Mi+) and field level (Control)—and two levels of mycorrhizal inoculation—Myc+ or Myc-. We compared impact of addition of copper (0.5 µM CuSO4), cobalt (1.7 µM CoCl2) boron (25 µM H3BO3), molybdenum (0.5 µM Na2MoO4), manganese (2 µM MnCl2), and zinc (2 µM ZnSO4) on root nodulation to a control with field level micronutrients (Table 2). Micronutrient concentrations were based on a modified Hoagland’s solution [62].

2.1.3. Phosphorus

Using a 3 × 2 factorial design, this experiment compared three levels of P—control, low, and high—and two levels of mycorrhizal inoculation (Myc+ or Myc-). The levels of P tested included field level P as a control, low P (0.1 mM KH2PO4, 1.9 mM KCl), and high P (2 mM KH2PO4). Since P (target nutrient) was supplied as KH2PO4, potassium levels (non-target) were also raised. To avoid confounding the impacts of P and K, low and field level treatments were supplemented with potassium chloride (KCl) to match the K levels applied to the high P treatment (Table 2).

2.1.4. Nitrogen

Using a 3 × 2 factorial design, this experiment compared three levels of N—low, control, and high—and two levels of mycorrhizal inoculation (Myc+ or Myc-). We compared the impact on nodulation of field level N as a control (Table 2) to N levels both higher (5 mM CaN2O6) and lower (1/2 field level). Higher N treatments had calcium nitrate added in solution while lower N was achieved through a 50/50 mix of field soil and sand. Since the high N treatment also received 5 mM Ca (non-target) in addition to 10 mM N (target), low and field level N treatments were supplemented with calcium chloride (5 mM CaCl2) to match the calcium levels applied to the high N treatment (Table 2). These adjustments were made to avoid confounding the impacts of Ca and N on nodulation.

2.1.5. Soil Sterilization

A sterilization experiment was included to isolate the effects of soil microbes impacting nodulation. For these treatments, soil media was steam sterilized in an autoclave at 121 °C for 30 min before planting. Using a 2 × 2 × 2 factorial design, this experiment compared all combinations of following three factors—sterilized (S+) or unsterilized (S-) soil, with (Myc+) or without (Myc-) mycorrhizal inoculation, with (R+) or without (R) rhizobial inoculation. sterilization can affect soil pH as well as nutrient content and availability. Therefore, separate tests were conducted to determine the baseline pH and nutrient levels for the sterilized soil.

2.1.6. Data Collection

During the final week before termination (days 68–74), light-saturated photosynthesis measurements (Asat) were taken for three replicates from each treatment using a Portable Photosynthesis System (model LI-6400XT, LiCOR, Lincoln, NE, USA). Asat was recorded at 2000 umol m-2 s-1 PAR after the assimilation value had stabilized and the stomatal conductance value exceeded a threshold of 0.05 mol m-2 s-1. After 75 days, five replicates from each treatment were randomly chosen. Roots were cleaned and examined for nodules which were counted, weighed, and checked for internal color as an indicator of N fixation activity. Pink, red or brown nodules were counted as active while green, grey, tan, and any other color were considered inactive [22]. Plants were then dried for at least 72 h at 70 °C and the dry biomass of root, stem, and leaf tissue for each plant were recorded.

2.1.7. Data Analysis

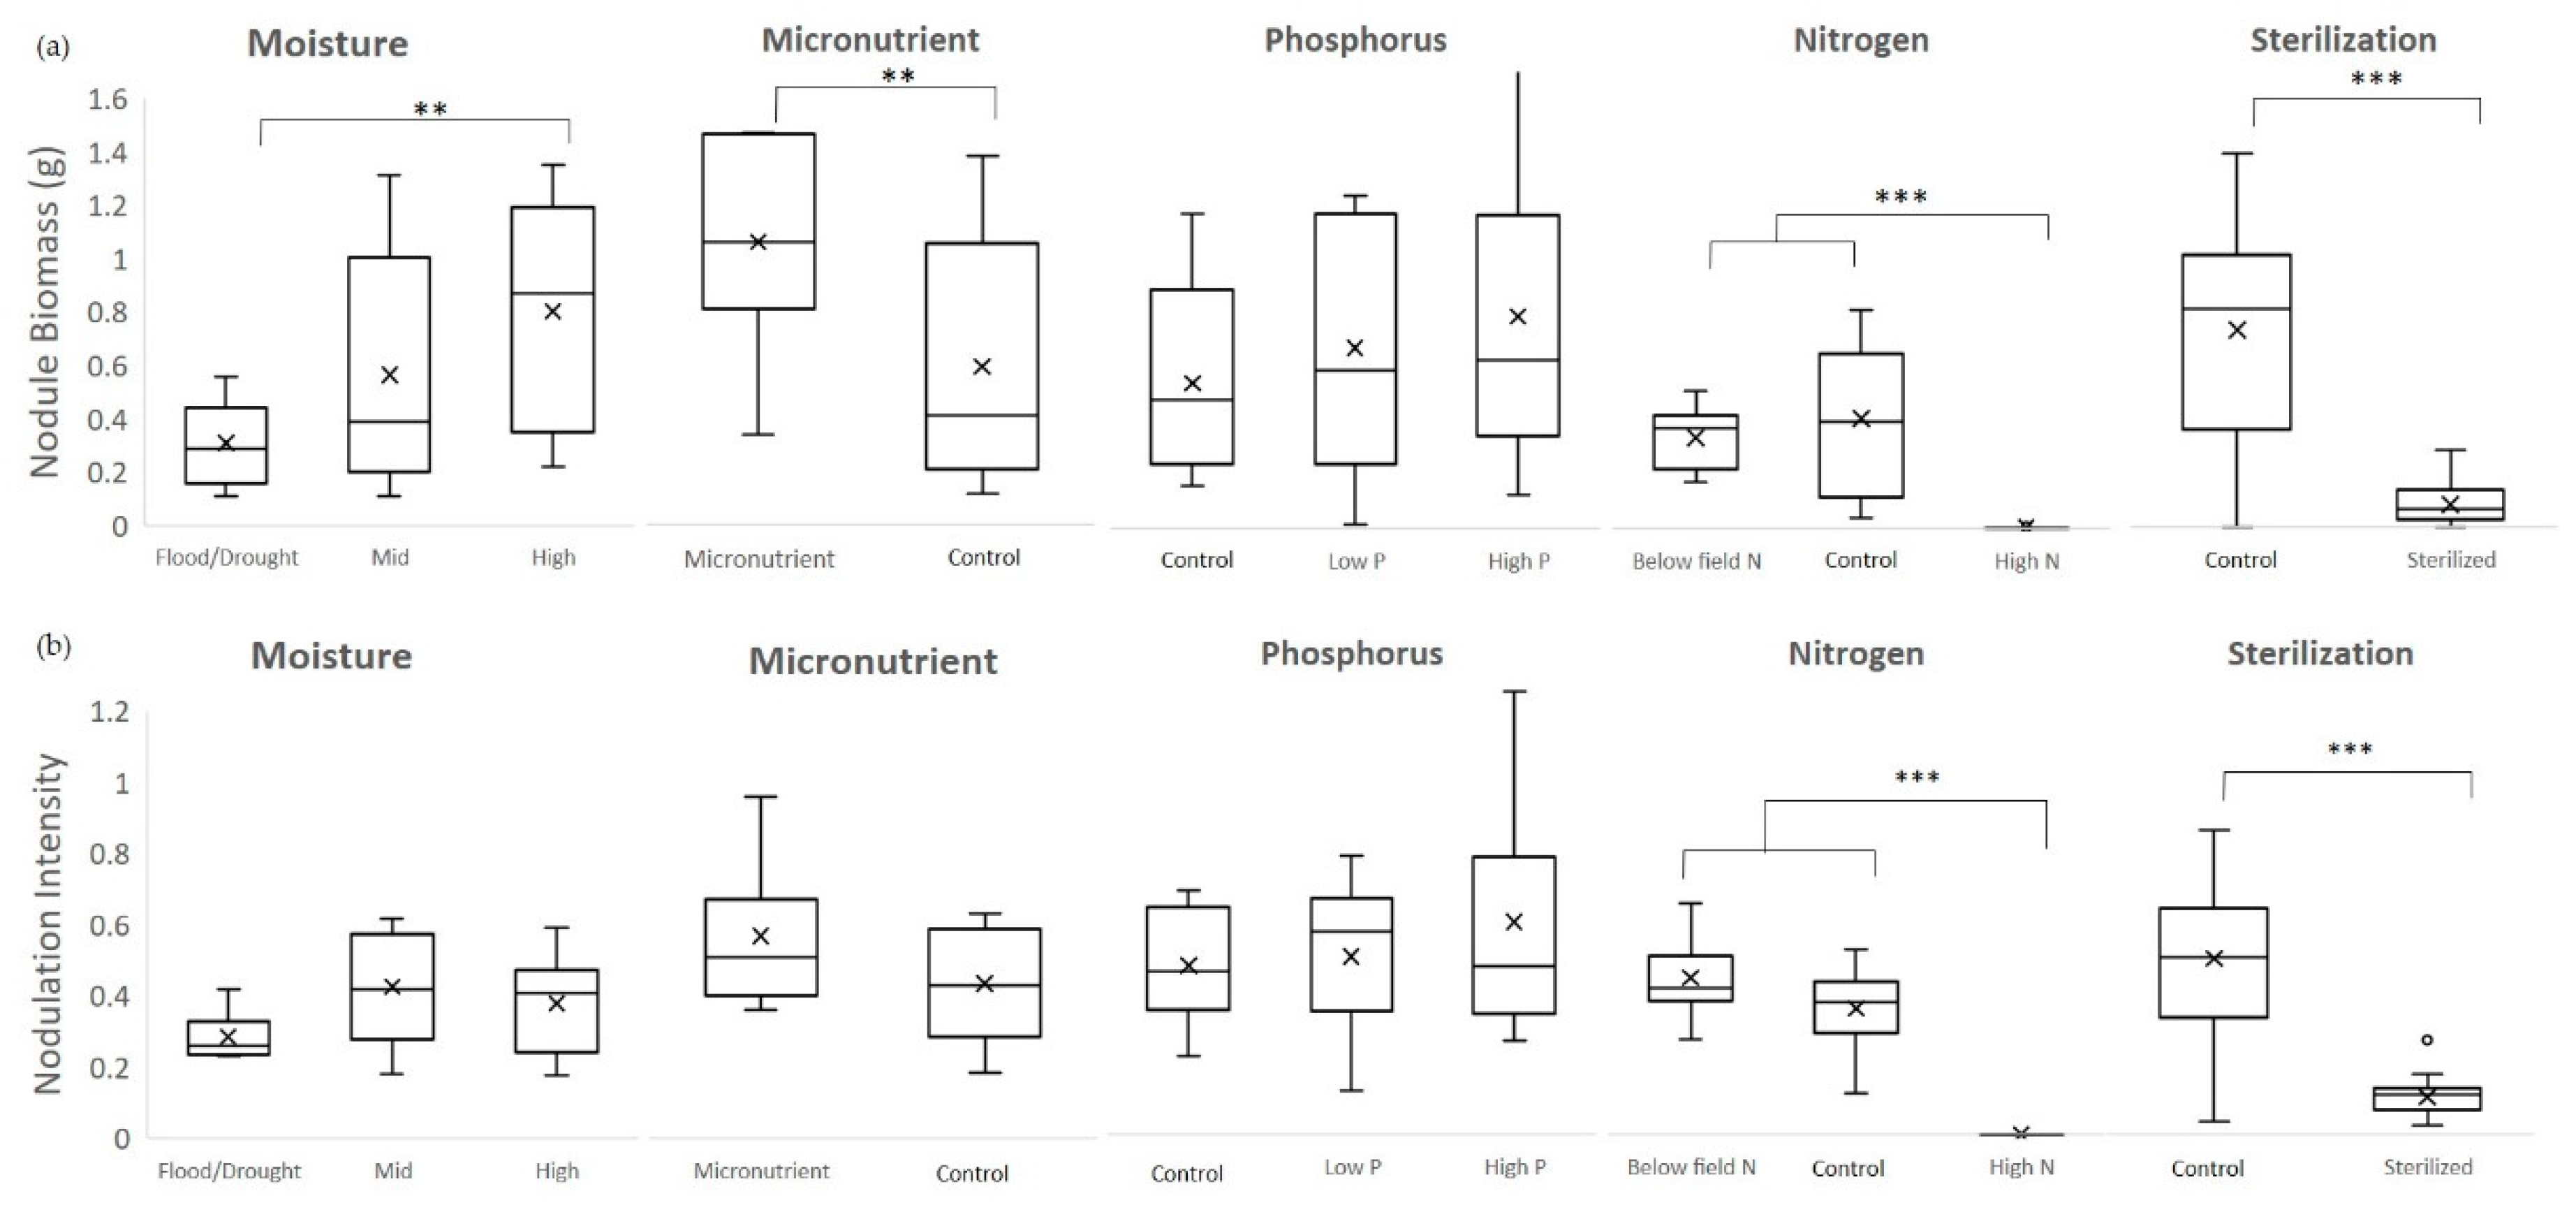
For the moisture, micronutrient, phosphorus, and nitrogen experiments, 2-way analyses of variance were conducted to compare the main effects of each factor and mycorrhizal inoculation and the interaction effect between that factor and mycorrhizae on nodule number, biomass, and activity and plant indicators including Asat, root, stem, leaf and total biomass, root to shoot ratio and nodule to plant biomass ratio. Multiple comparisons were performed using the Holm-Sidak method. When assumptions of normality and equal variance were violated, a Kruskal–Wallis 1-way ANOVA on ranks was employed, followed by Dunn’s method for multiple comparisons. For the sterilization experiment, three-way ANOVAs were conducted to compare the main effects of sterilization, mycorrhizal inoculation, and rhizobial inoculation and the interaction effects among the three (SYSTAT™, San Jose, CA).
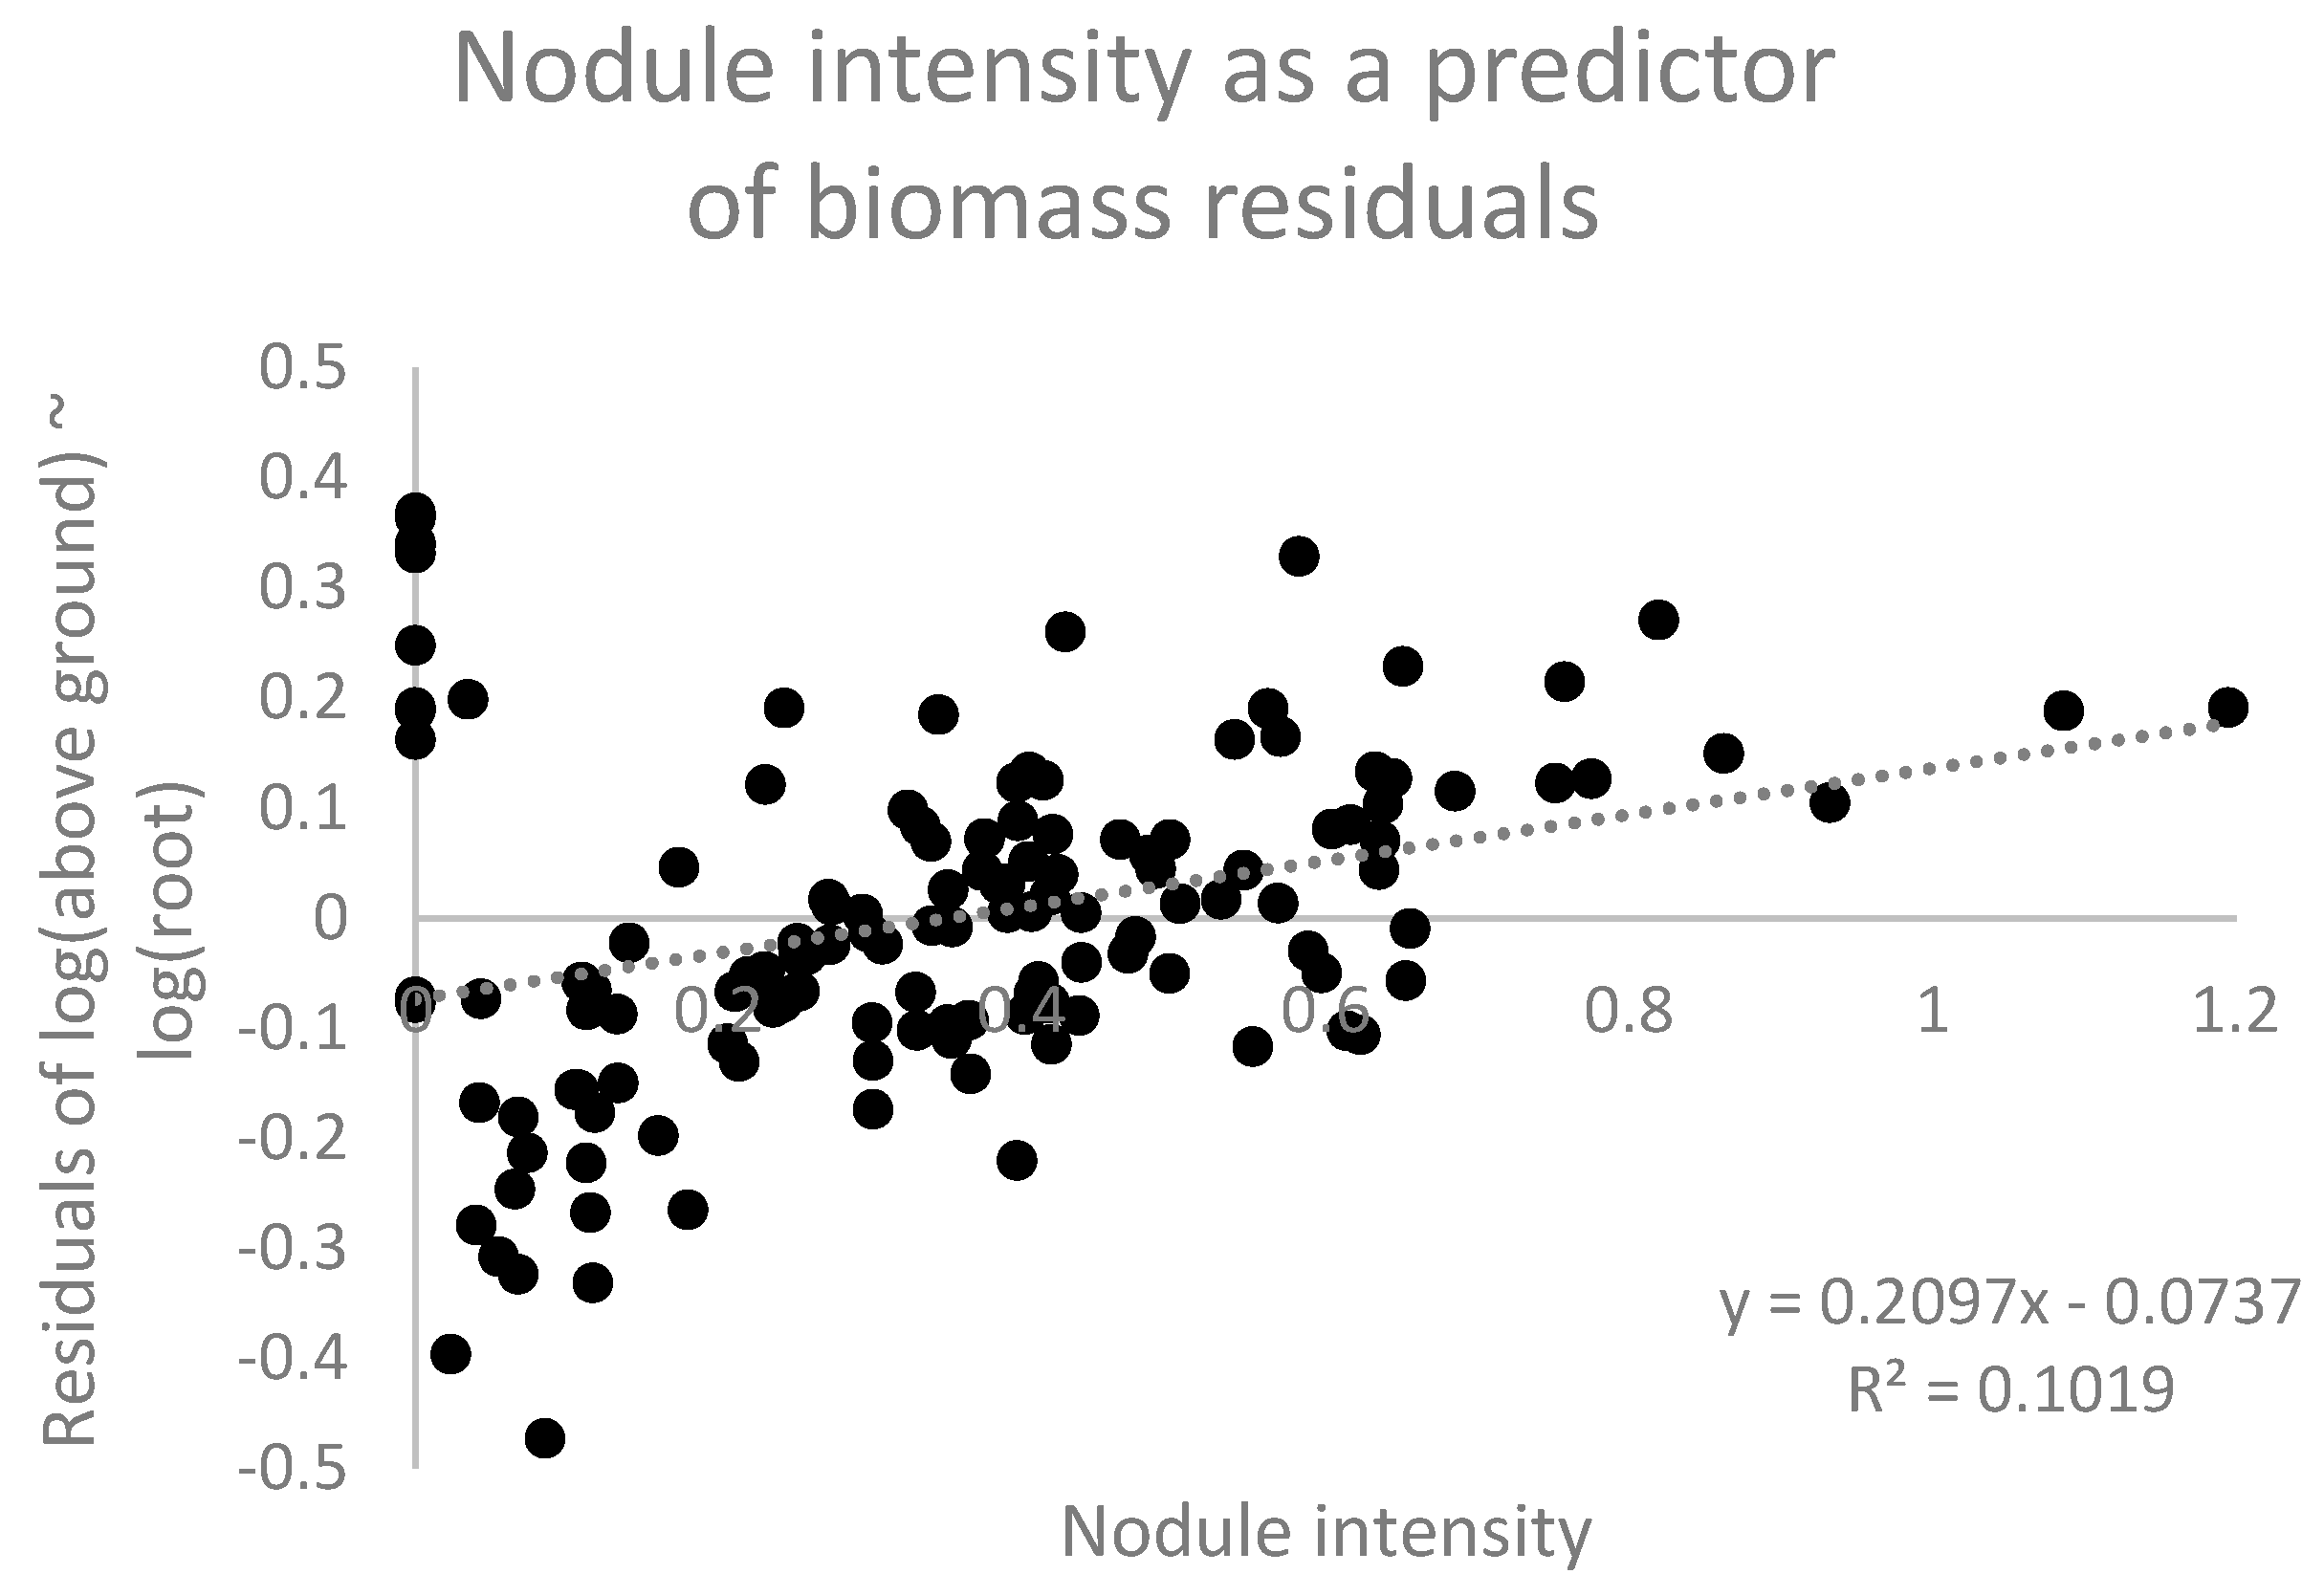
Nodulation intensity was calculated as the ratio of dry nodule biomass to dry root biomass, which is affected by both nodule number and mean nodule size. We tested whether nodulation intensity promotes enhanced leaf + stem development at a given plant size. To scale for the effects of plant size, we first regressed the aboveground biomass (stem and leaf) against root biomass and then investigated whether the residuals about this allometric relationship exhibited a positive relationship with nodulation intensity. Such a relationship would suggest that for plants of a given size, increased nodulation intensity promotes greater leaf development.

2.2. Micronutrient Experiment

In the second experiment of the series, developed based on the results of the first but following a modified protocol, Iron and Clay cowpea seeds (Vigna unguiculata; Johnny’s Seeds, Winslow, ME) were surface sterilized through immersion in 2% hypochlorite solution for five minutes, followed by five rinses with sterile water. Two seeds were then planted into each 15 cm plastic pots with 1500 g of a 1:1 mixture of perlite and soil obtained from the field where nodulation failure occurred. Nutrient solutions and estimated treatment impact compared to field soil levels are in Table 4.
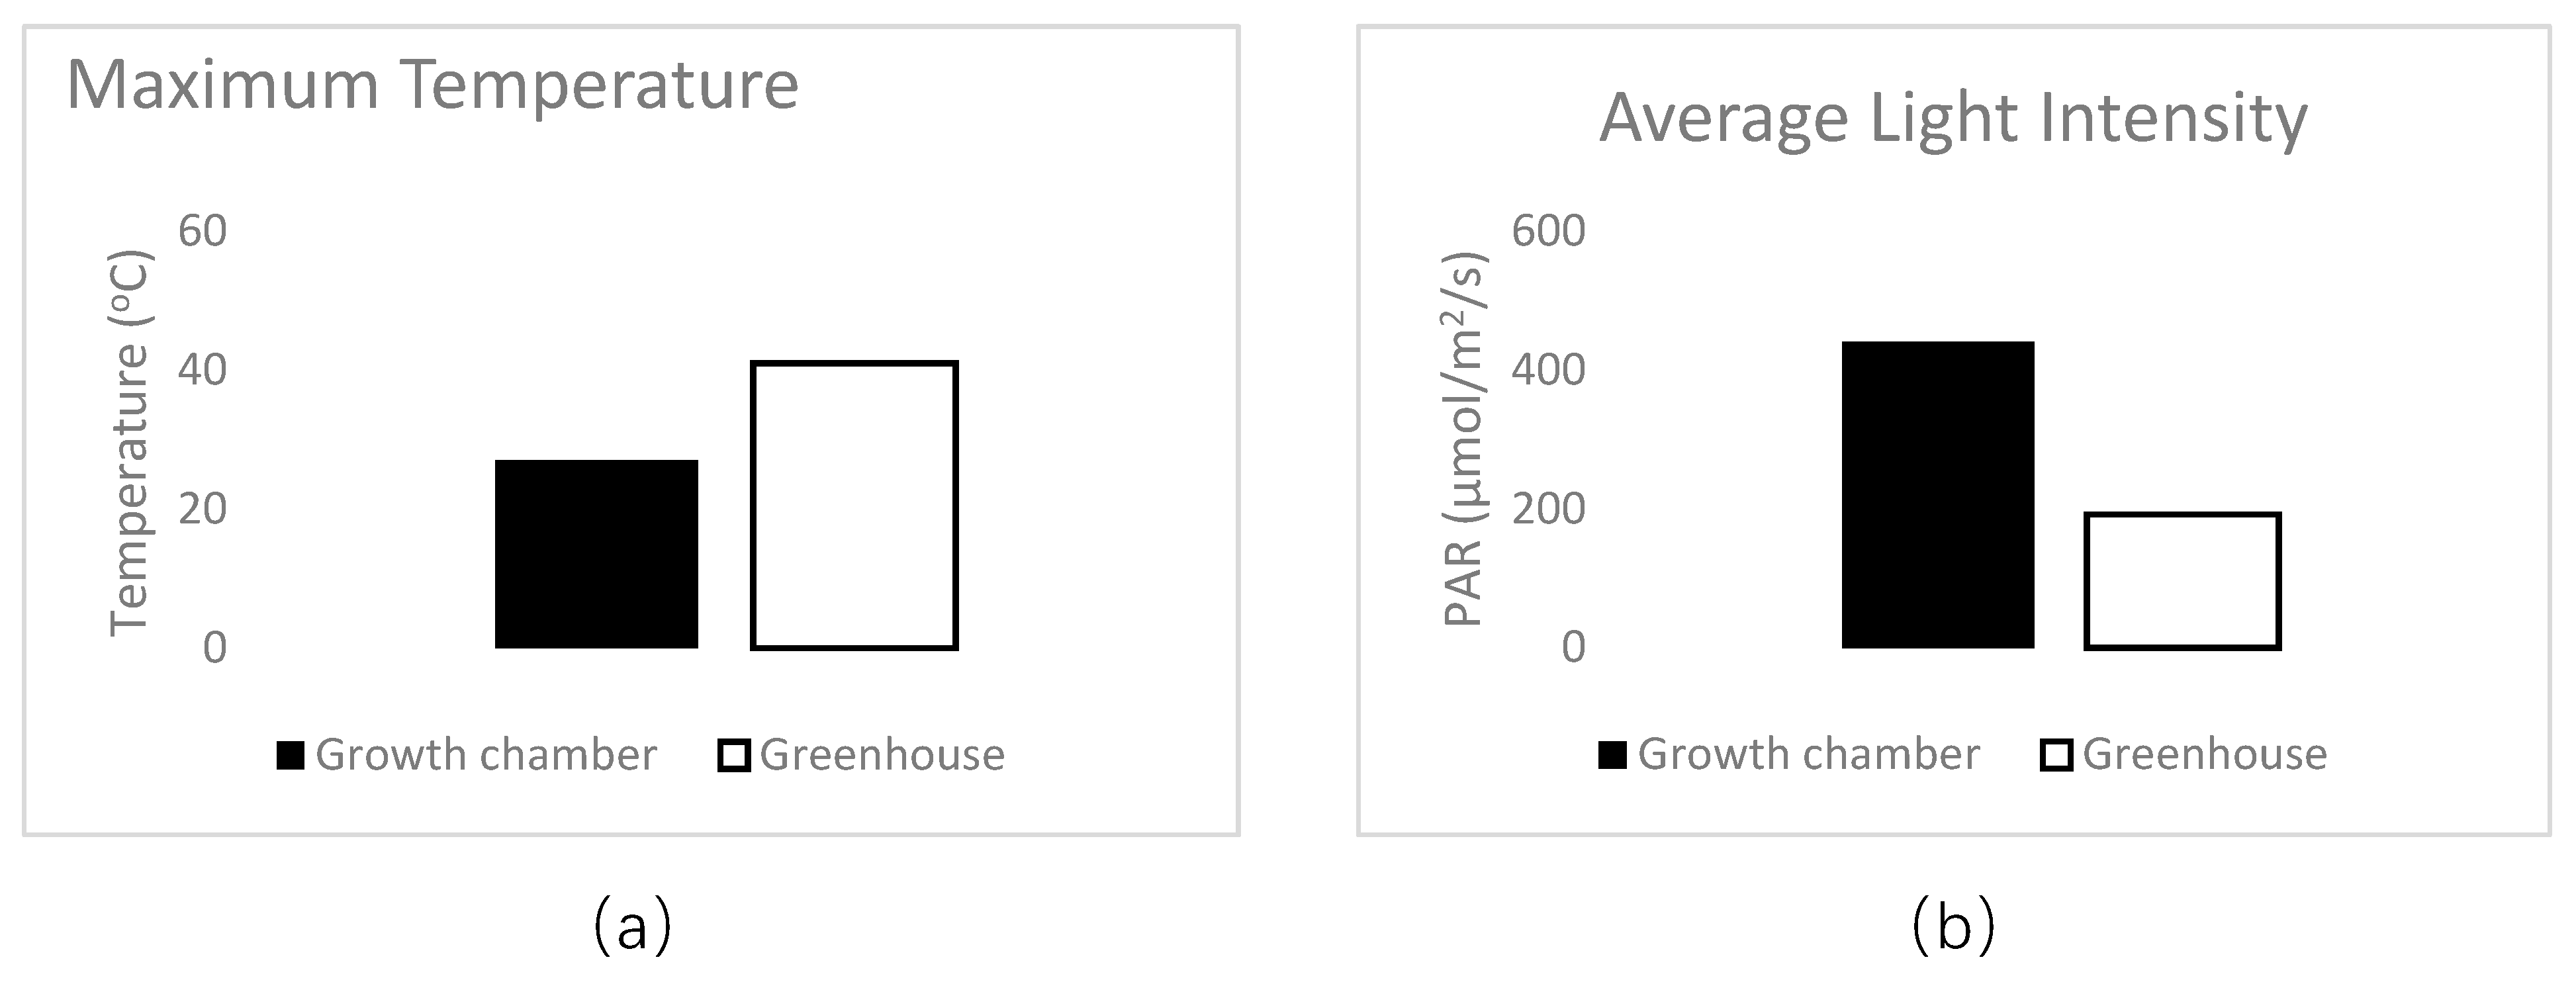
At planting, a 1 mL solution of rhizobium inoculant solution (2 g inoculant/500 mL water; Verdesian Guard-N®, Cary, NC) was applied to the seed. Pots were thinned to one plant each after 7 days. Cowpeas were randomly assigned to one of 8 treatments that were watered with a nutrient solution of B, Co, Cu, Mn, Mo, or Zn individually, all 6 micronutrients together, or tap water (control). The plants were grown for 45 days in Percival Environmental Growth Chambers (Perry, Iowa) with 15 hours of light (PAR—440 µmol/m2/s) every 24 h. Light period temperatures were 27 °C, dark period temperatures were 24 °C, and relative humidity ranged between 45% and 70%. Pots were watered with 150 mL of the designated nutrient solution every three days for a total of 16 waterings (2.4 L solution/plant). Each treatment had 9 replicates for a total of 72 individuals.
Data were collected 45 days after seeding from 9 replicates for each treatment. Pre-termination measurements included spectral signatures (ASD Handheld 2, Malvern Panalytical, Longmont, CO) and chlorophyll content (SPAD 502 Chlorophyll Meter, Spectrum, Aurora, IL). After termination, roots were cleaned and examined for nodules which were counted, weighed, and checked for internal color as an indicator of N fixation activity. Plants were then dried for at least 72 h at 70 °C and the dry biomass of roots, stems, and leaves for each plant were recorded. One-way analyses of variance were used to examine differences among treatments (SYSTAT™, San Jose, CA).

3. Results

3.1. Assay of Dominant Factors

Data for all measured variables for each of the five experiments are included in Table A2. Since this investigation is concerned most directly with nodulation, the results for nodule biomass and nodulation intensity (Figure 1a,b) will be emphasized here. No significant interactions or effects of mycorrhizae on nodule biomass or nodulation intensity were detected at the 0.05 level of significance for any of the plant or nodule indicators in any of the experiments. Therefore, all results presented henceforth group together the Myc+ and Myc- results for each treatment.

3.1.1. Moisture

Significant effects of moisture level were found for nodule biomass (f (2,24) = 4.941, p = 0.016). Mean nodule biomass was 0.80 g ± 0.42 for high moisture, 0.56 g ± 0.43 for mid, and 0.31 g ± 0.16 for cycle. Multiple comparisons showed a significant difference between high and cycle (p = 0.013), but not between mid and either high or cycle treatments. Nodulation intensities for the three moisture levels were 0.38 ± 0.13 for high moisture, 0.42 ± 0.15 for mid moisture, and 0.28 ± 0.06 for cycle with no significant differences among them (f (2,24) = 3.354, p = 0.052).

3.1.2. Micronutrient

The addition of micronutrients significantly increased nodule biomass from 0.56 ± 0.43 to 1.02 g ±0.35 (f (1,16) = 7.671, p = 0.013). Nodulation intensity was 0.55 ± 0.20 for Mi+ and 0.42 ± 0.15 for the control (f (1,16) = 4.408, p = 0.051).

3.1.3. Phosphorus

The effects of P level on nodule biomass (f (2,24) = 0.719, p = 0.497) and nodulation intensity (f (2,24) = 0.765, p = 0.476) were not statistically significant. Nodule biomass was 0.51 g ± 0.33 for control P, 0.63 g ± 0.44 for low P, and 0.75 g ± 0.56 for high P. Nodulation intensity was 0.45 ± 0.16 for control P, 0.48 ± 0.20 for low P, and 0.57 ± 0.32 for high P.

3.1.4. Nitrogen

Nodule biomass was 0.31 g ± 0.11 for below control N, 0.39 g ± 0.26 for control N, and 0.0009 g ± 0.003 for high N. High N additions inhibited nodulation in all but one replicate. Due to the large number of zeros, nodule biomass data failed normality and equal variance. A Kruskal–Wallis one-way ANOVA on ranks was used instead and found significant differences in nodule biomass among the three N levels (h (2) = 21.425, p < 0.001). Nodule biomass for the high N treatments was significantly less than control N (q = 4.053, p < 0.05), and low N (q = 3.751, p < 0.05), but that control N and low N did not vary significantly from each other (q = 0.295, p > 0.05).
The same pattern was true for nodulation intensity (h (2) = 22.314, p < 0.001) with a significantly lower nodulation intensity for high N compared to control N (q = 3.474, p < 0.05) and below field N (q = 4.330, p < 0.05), but no difference between control and below field (q = 0.836, p > 0.05. Nodulation intensity was 0.42 ± 0.11 for below field N, 0.34 ± 0.11 for control N, and 0 ± 0 for high N.

3.1.5. Sterilization

Soil sterilization had a significant impact on both nodule biomass (f (7,32) = 48.146, p <0.001) and nodulation intensity (f (7,32) = 65.493, p < 0.001). Nodule biomass was 0.70 g ± 0.42 for unsterilized soil and 0.08 g ± 0.07 for sterilized. Similarly, plants in sterilized soil showed much lower nodulation intensities (0.10 ± 0.05) compared to plants in unsterilized soil (0.47 g ± 0.21). This pattern was confirmed by the other measured variables as well (Table A2), with sterilized plants performing poorly in every measured category.

3.1.6. Nodulation and Plant Vigor

Across all plants in all treatments, plants with greater nodulation intensity were able to grow more aboveground tissue than expected given their size (Figure 2; f = 15.094, p < 0.001). Cowpea is potentially limited by N, as plants which were fertilized by N had significantly greater leaf biomass than the N1/2 treatment (Table A2; f = 5.522, p = 0.008). Corellation coefficients for other nodule and plant trait pairs are included in Table A3.

3.2. Micronutrient Experiment

There were no significant differences among the micronutrient treatments for any of the measured variables, including nodule biomass (f (7,64) = 1.686, p = 0.128) and nodulation intensity (h (7) = 4.988, p = 0.661). We also found no significant differences in foliar N concentration among the treatments (h (7,63) = 1.223, p = 0.303). Results for additional measurements from the micronutrient experiment are included in Table A4.

4. Discussion

Effective use of leguminous cover crops for biological N fixation depends on the success of the legume–rhizobia symbiosis. The mutualism between these two species is ecologically complex, and effective management of this relationship requires a better understanding of the predictive factors for the purpose of soil improvement. This investigation was focused on the predictive factors and potential interventions for one farm in south Texas where nodulation failure occurred, but these findings can also inform more efficient efforts at N fixation broadly.
Although this study does not lend itself one easy solution for improving legume performance in south Texas, it does clearly eliminate some of the factors from consideration in this context and provides a more focused foundation for future work in the efforts to develop efficient cover cropping systems in the Rio Grande Valley. With this practical objective in mind, the studied factors will be discussed in four groups: eliminated, confirmed, confused, and ignored. Eliminated factors were not relevant in this nodulation failure while confirmed factors are strongly suspected. Confused factors require further investigation and ignored factors seem relevant in hindsight but were not included in this initial study.

4.1. Eliminated Factors—Nitrogen, Phosphorus, Mycorrhizae

Based on the results of these experiments, two possible explanations for the nodulation failure and one proposed intervention can be eliminated from consideration in this context—phosphorus, nitrogen, and mycorrhizae.
P levels of 59.2 ppm like those present in this field are usually adequate for N fixation [21]. P was included as a potential determinant in the coarse assay experiment due to concerns about P accessibility in alkaline soils with high levels of calcium [66]. However, P additions did not improve nodulation, thereby discounting phosphorous deficiency as an explanation.
High N levels can inhibit nodule formation and nitrogenase activity [17,18]. Our results are congruent with these findings, but they do not support that N was a primary driver of the observed nodulation failure. We found little or no nodulation in plants where excessive rates of N were added, reinforcing the recommendation that leguminous cover crops are best employed where N may be deficient. In this agroecosystem, nodules did form at field level N (18.8 ppm, 42 kg/ha) and there was no significant difference between nodulation at control N and below field level N. Reducing the N content by half did not increase the number or weight of nodules over the field level soil. Nonetheless, we did find that enhanced nodulation promotes greater leaf biomass which may in turn promote greater cover crop development and subsequent N fixation in a positive feedback. In farms where synthetic N inputs are unlikely to reach excessively high N levels, leguminous cover crops may assist in maximizing plant-available N while providing other benefits to soil health, such as weed control [67], and soil microbial biodiversity [68,69].
Other studies have suggested mycorrhizal inoculation as an intervention to improve nodulation [59,61], but the results of this experiment did not confirm the utility of this practice as we predicted. Mycorrhizal inoculation was not observed to significantly impact nodule biomass in any component of this trial. This may be related to the inoculant, which could have lacked viable infective propagules or been poorly suited for soil and climate conditions. Based on these results, locally adapted mycorrhizal inoculants are highly recommended for farmers and farm managers looking to employ this strategy on-farm. It can also be difficult to observe the impact of mycorrhizae in relatively small greenhouse pots. The benefits of mycorrhizae come from the hyphal network that expands nutrient mining beyond the range accessible to the plant’s root system on its own. In a small pot setting where the root system can mine the available soil volume effectively, the potential benefit of mycorrhizae is lessened [70].

4.2. Confirmed Factors—Moisture

The experimental results suggest that increased moisture and increased frequency of watering improve nodulation outcomes. Unfortunately for dryland farmers, moisture limitation is particularly difficult to mitigate in the field. In a semi-arid region like the Rio Grande Valley, dry soils may consistently reduce the N fixation potential of leguminous cover crops, even when those soils remain moist enough for plants to survive. For farmers with irrigation access, it may not be cost-effective to water a crop that they do not intend to harvest. Cost–benefit calculations must be carefully considered, but legumes may provide a more consistent return on investment in regions that receive more regular rainfall.
When a legume enters a period of water stress, nodules are the first to lose their water supply since the process of N fixation is more sensitive to drought than plant growth [18]. In this experiment, the minimum moisture attained is more influential on nodulation than the total amount of moisture received during the season. For example, plants under the saturation/drought cycle regime received approximately the same amount of total water over the course of the experiment as mid-range moisture plants (3515 mL and 3445 mL respectively), but we found that acute drought stress, similar to conditions in a dry-land agriculture, put the plants at a serious disadvantage compared to plants with metered moisture.
One proposed solution for dryland farmers is to choose legumes based on drought tolerance. However, these results suggest that even cowpea, one of the most heat and drought tolerant legume options, is vulnerable to the impact of moisture stress on nodulation and N fixation. Other studies on cowpea have shown that nodule water potential and nitrogenase activity show major declines after periods of drought, even before leaf water potential shows any changes [71]. Even minor 15% declines in photosynthesis in a moisture stress situation can be accompanied by 90% drops in nitrogenase activity [36]. More research on alternative solutions could help improve nodulation outcomes in semi-arid regions like the Rio Grande Valley. In addition to testing other drought tolerant legume species, further research could help determine the nitrogen tradeoffs between longer growing periods during drier seasons and shorter growing periods if planting is delayed until historically wetter times of year.

4.3. Confused Factors—Micronutrients, Native Soil Communities

Micronutrient addition increased nodulation by 79% over the control in the initial coarse assay, but the same was not observed in the follow-up micronutrient experiment. This discrepancy could have been caused by differences in stress (Figure A1) faced by the two sets of cowpeas due to the role of micronutrients in plant stress mediation [53,55]. It was also difficult to determine micronutrient levels that were biologically significant without risking toxicity. This experiment could be repeated with higher micronutrient concentrations. Further research is required to pinpoint specific micronutrients that can facilitate improved nodulation under field conditions in alkaline subtropical soils. However, in both experiments, cowpeas consistently formed nodules even with no added micronutrients. Micronutrients, therefore, cannot be the sole explanation for the failure of nodules to form in the field, but instead may interact with additional factors.
The role of native soil communities also remains unclear. Microbial diversity, particularly of plant growth-promoting rhizobacteria, plays a key function in healthy soils [72]. We found that plants in sterilized soil (with no major changes in soil nutrient levels) had significantly reduced nodule biomass and were less healthy by every measure than plants in unsterilized native soil. This was true both for cowpeas that received rhizobial and mycorrhizal inoculation after sterilization and those that were uninoculated. Far from causing the nodulation failure, the complex microbial communities of native soils seem to have facilitated effective nodulation and other metrics of plant growth and vigor. A better understanding of the ecology of microbial communities and the impact of introductions such as rhizobial and mycorrhizal inoculants into agroecosystems is required to maximize the functionality of cover crops and overall soil health.

4.4. Ignored Factors—Rhizobial Inoculation

The factors investigated in our experiments, while supported by the scientific literature, may have overlooked a more fundamental problem—effective rhizobial inoculation. Nitrogen, phosphorus, moisture, micronutrients, and competitive soil microorganisms can all impact nodulation. However, the first requirement for nodule formation is that live rhizobia and viable legume seeds are present in the soil together. If rhizobia capable of infecting the legume species are neither present in the native soil nor introduced through an inoculant, the legume–rhizobia symbiosis cannot form and even the best habitat and climatic conditions cannot mitigate this fundamental problem. Although we can neither test the original rhizobial inoculant for viability [73] nor measure the number of rhizobia that survived on each seed [74] post-facto, we suggest that inoculation problems may have been a major cause of the initial nodulation failure.
While we expected that nodule initiation would fail for many of our treatments, given the nodulation failure in the field, the only treatment in which nodulation was completely inhibited was the highest N treatment, for reasons discussed above. In a subsequent field trial at site of the original nodulation failure, 24% of cowpea plants formed at least one nodule. In the coarse assay and micronutrient experiments, 95% of plants formed at least one nodule (Figure 3). The scale of this improvement was unmatched by any of the other nodulation drivers under consideration.
In field scale inoculations, a peat-based inoculant is commonly applied to lightly wetted seeds, then planted via a seed spreader or drill. In our controlled study, a rhizobial inoculant slurry was pipetted directly onto pregerminated seed root radicles. Obviously, an inoculation method this precise would not be feasible in the field. That said, any alternative method for farm-scale inoculation that increases rhizobial adherence to seeds such as adhesive additives (gum arabic, methyl cellulose, or vegetable oil) would improve the possibility of successful infection and nodulation and thus nutrient management [47,48]. Although outside the scope of this investigation, agronomic practices are as critical as biological and ecological factors in the task of maximizing N fixation efficiency by cover crops on South Texas farms.

4.5. Conclusions

Leguminous cover crops have great potential to contribute to sustainable nutrient management on farms. However, their cost-effectiveness depends on efficient N fixation. Outreach to interested farmers with information on the promise and limitations of leguminous cover crops could encourage their ability to detect and troubleshoot nodulation issues. Additionally, further research on successful inoculation methods, appropriate legume species selection, and effective timing of planting and termination, particularly in semi-arid climates, could all help maximize the return on investment for legume farmers. Based on the results of this study, particular attention should be paid to the complex interactions among soil moisture, micronutrient levels, inoculation techniques, and other agronomic practices.

Author Contributions

Conceptualization, B.C., P.S., A.R. and S.K.; writing—original draft preparation, S.K.; writing—review and editing, B.C., A.R., P.S., and S.K.; funding acquisition, A.R. and S.K.

Funding

This research was funded by a Conservation Innovation Grant from the U.S. Department of Agriculture, Natural Resources Conversation Service, grant number 69-3A75-17-281 and by Graduate Student Grant from Southern Sustainable Agriculture Research and Education, grant number GS18-193.

Acknowledgments

Thanks to our farm collaborators at Hilltop Gardens, Andy Cruz and Joseph Kim, and to Mylen Arias, Alyssa Cano, Diana Cantu, Suzanne El-Haj, Allison Kaika, Matthew Kutugata, Katie Lavallee, Habraham Lopez, Lindsey Richards, Thalia Torres and Joy Youwakim for all their help with data collection. Thanks also to the UTRGV Biology department for their in-kind donation of reagents.

Conflicts of Interest

The funders had no role in the design of the study; in the collection, analyses, or interpretation of data; in the writing of the manuscript, or in the decision to publish the results.

Appendix A

Table A1. Macro- and micro-nutrients and their concentrations (µM) in each 150 mL watering solution.
NutrientN0N1/2N1P0P1P2Mi0Mi+Hoaglands *
N0010,0000000016,000
Ca500050005000000004000
P00001002000002000
K000200020002000006000
B00000002525
Cu0.00.00.00.00.00.00.00.50.5
Mo0.00.00.00.00.00.00.00.50.5
Mn0.00.00.00.00.00.00.02.02.0
Zn0.00.00.00.00.00.00.02.02.0
Co0.00.00.00.00.00.00.01.70.0
* as given in [62].
Table A2. Complete Results from Dominant Factor Assay. Values shown are means of 5 samples (3 in the case of Asat) +/– 1 SE.
MoistureMicronutrientSterilization
HighMidCycleMi+ControlS+S–
Nodule data
Number23 ± 2 a17 ± 3 a28 ± 6a22 ± 3a17 ± 2.6 a18 ± 3 a18 ± 3 a
Biomass (g)0.80 ± 0.13 a0.56 ± 0.14 ab0.31 ± 0.05 b1.02 ± 0.11 a0.56 ± 0.14 b0.08 ± 0.01 a0.70 ± 0.09 b
Activity (%)64 ± 4 a55 ± 6 a63 ± 8 a56 ± 6 a55 ± 6 a18 ± 3 a60 ± 5 b
g nodule/g plant biomass5.35 ± 0.03 a4.71 ± 0.02 ab3.65 ± 0.02 b6.49 ± 0.03 a4.71 ± 0.02 b1.83 ± 0.01 a5.09 ± 0.02 b
Plant data
Asat (umol m–2 s–1)9.91 ± 0.35 a9.71 ± 0.77 a7.24 ± 0.78 a7.99 ± 0.61 a9.71 ± 0.77 a3.05 ± 0.34 a8.61 ± 0.49 b
Leaf area (cm2)399.3 ± 38.6 a321.0 ± 47.2 a260.7 ± 26.7 a426.6 ± 34.2 a321.0 ± 47.2 a79.6 ± 11.9 a368.9 ± 31.9 b
Root (g)0.43 ± 0.04 a0.26 ± 0. 05 b0.23 ± 0.03 b0.39 ± 0.03 a0.26 ± 0.05 b0.20 ± 0.04 a0.31 ± 0.04 b
Stem (g)1.37 ± 0.15 a1.14 ± 0.20 a0.88 ± 0.11 a1.57 ± 0.13 a1.14 ± 0.20 a0.63 ± 0.07 a1.32 ± 0.13 b
Leaf (g)1.08 ± 0.11 a0.78 ± 0.13 ab0.64 ± 0.08 b1.06 ± 0.08 a0.78 ± 0.13 a0.23 ± 0.03 a0.93 ± 0.09 b
Total (g)2.88 ± 0.29 a2.19 ± 0.36 ab1.75 ± 0.21 b3.01 ± 0.23 a2.19 ± 0.36 a1.07 ± 0.12 a2.56 ± 0.25 b
g root/g shoot 17.95 ± 0.01 a15.02 ± 0.02 a15.65 ± 0.01 a15.02 ± 0.06 a15.02 ± 0.02 a25.71 ± 0.02 a14.26 ± 0.01 b
PhosphorusNitrogen
Control PLow PHigh PBelow field NControl NHigh N
Nodule data
Number18 ± 4 a13 ± 3 a25 ± 5 a15 ± 3 a15 ± 4 a0 ± 0.4 b
Biomass (g)0.51 ± 0.10 a0.64 ± 0.13 a0.75 ± 0.18 a0.32 ± 0.03 a0.39 ± 0.08 a0.00 ± 0 b
Activity (%)45 ± 6 ab33 ± 6 a60 ± 3 b31 ± 7 a44 ± 8 a0 ± 0 b
g nodule/g plant biomass5.48 ± 0.03 a5.72 ± 0.03 a6.25 ± 0.05 a5.68 ± 0.03 a4.32 ± 0.03 b± 0 c
Plant data
Asat (umol m–2 s–1)7.98 ± 0.56 a7.27 ± 0.44 a7.01 ± 1.13 a4.59 ± 0.50 a7.02 ± 0.55 a6.76 ± 1.05 a
Leaf area (cm2)252.3 ± 17.9 a287.5 ± 53.5 a330.2 ± 59.1 a137.9 ± 18.4 a230.6 ± 36.9 ab309.0 ± 50 b
Root (g)0.24 ± 0.03 a0.25 ± 0.03 a0.26 ± 0.03 a0.17 ± 0.02 a0.23 ± 0.04 a0.17 ± 0.02 a
Stem (g)0.87 ± 0.10 a1.02 ± 0.15 a1.16 ± 0.18 a0.66 ± 0.09 a0.88 ± 0.15 a1.04 ± 0.13 a
Leaf (g)0.64 ± 0.07 a0.71 ± 0.12 a0.82 ± 0.15 a0.39 ± 0.05 a0.63 ± 0.09 ab0.87 ± 0.14 b
Total (g)1.75 ± 0.19 a1.98 ± 0.29 a2.24 ± 0.34 a1.21 ± 0.13 a1.74 ± 0.28 ab2.09 ± 0.26 b
g root/g shoot15.36 ± 0.01 a16.29 ± 0.02 a14.49 ± 0.01 a16.80 ± 0.01 a15.79 ± 0.01 a9.97 ± 0.01 b
For each of the 5 experiments, treatments which share a letter do not significantly differ (α = 0.05).
Table A3. Correlation Coefficients for All Pairs of Nodule and Plant Traits.
Nodule NumberNodule Biomass (g)Activity (%)g nod./ g Plant BiomassAsatLeaf AreaRoot (g)Stem (g)Leaf (g)Total Biomass (g)g root/g Shoot
Nodule Number1.0000.4220.3790.3670.0120.3210.4510.3590.2920.3630.050
Nodule biomass (g)0.4221.0000.4630.8330.3890.7400.7450.7500.7150.7750.237
Activity (%)0.3790.4631.0000.4810.3250.3830.3800.3360.3560.3680.192
g nod./ g plant biomass0.3670.8330.4811.0000.2970.4080.4490.3740.3560.396–0.121
Asat–0.0120.3890.3250.2971.0000.4600.3730.3700.4510.424–0.371
Leaf area0.3210.7400.3830.4080.4601.0000.6720.8470.9630.918–0.555
Root (g)0.4510.7450.3800.4490.3730.6721.0000.8080.7030.8330.021
Stem (g)0.3590.7500.3360.3740.3700.8470.8081.0000.8740.9770.430
Leaf (g)0.2920.7150.3560.3560.4510.9630.7030.8741.0000.9510.547
Total biomass (g)0.3630.7750.3680.3960.4240.9180.8330.9770.9511.0000.443
g root/g shoot0.050–0.237–0.192–0.1210.3710.5550.0210.4300.547–0.4431.000
Table A4. Complete Results from Micronutrient Experiment.
Nodule DataAll MicroBCoCuMnMoZnControl
Number33 ± 1032 ± 531 ± 513 ± 524 ± 522 ± 1121 ± 236 ± 7.4
Biomass (g)0.59 ± 0.100.65 ± 0.130.45 ± 0.130.21 ± 0.070.52 ± 0.110.49 ± 0.150.33 ± 0.080.64 ± 0.15
Activity (%)83.3 ± 3.891.2 ± 2.482.5 ± 10.991.7 ± 3.181.3 ± 4.497.2 ± 10.793.8 ± 5.679.7 ± 6.4
g nodule/g plant biomass3.46 ± 0.013.55 ± 0.002.60 ± 0.011.97 ± 0.003.05 ± 0.012.83 ± 0.012.76 ± 0.013.71 ± 0.01
Plant data
Chlorophyll content39.2 ± 2.236.2 ± 2.839.3 ± 2.439.7 ± 2.339.4 ± 3.438.6 ± 3.741.4 ± 2.638.1 ± 2.8
Root (g)0.91 ± 0.131.01 ± 0.160.77 ± 0.100.54 ± 0.080.78 ± 0.090.73 ± 0.110.63 ± 0.090.75 ± 0.13
Stem (g)0.96 ± 0.110.93 ± 0.060.78 ± 0.100.72 ± 0.100.94 ± 0.080.87 ± 0.110.62 ± 0.060.76 ± 0.12
Leaf (g)1.79 ± 0.211.68 ± 0.141.68 ± 0.161.27 ± 0.161.80 ± 0.131.64 ± 0.131.28 ± 0.161.58 ± 0.17
Total (g)3.66 ± 0.443.61 ± 0.303.23 ± 0.332.53 ± 0.323.53 ± 0.253.24 ± 0.292.53 ± 0.273.09 ± 0.40
g root/g shoot33.3 ± 0.0338.9 ± 0.0531.3 ± 0.0226.8 ± 0.0228.6 ± 0.0329.4 ± 0.0433.4 ± 0.0430.5 ± 0.04
No significantly different results at the α = 0.05 level for any of measured indicators.
Figure A1. There were discrepancies in temperature and light conditions between the coarse assay and micronutrient experiments. (a). The coarse assay plants in the greenhouse experienced less light (192 µmol/m2/s) and higher temperatures (up to 41 °C) than their micronutrient counterparts in the growth chambers (440 µmol/m2/s, 27 °C). The temperature values are single point maximums and the light intensity for the growth chamber was constant based on 3 measurements during the experiment. (b). The light intensity for the greenhouse is an average of 3 measurements made between 11 a.m. and 12 p.m. Differences in stress conditions between the two experiments could help explain their inconsistent results.
Agriculture 09 00209 g0a1

References

  1. Sarrantonio, M.; Gallandt, E. The Role of Cover Crops in North American Cropping Systems. J. Crop Prod. 2003, 8, 53–74. [Google Scholar] [CrossRef]
  2. Conservation Technology Information Center. Report of the 2016-17 National Cover Crop Survey; Conservation Technology Information Center: West Lafayette, IN, USA, 2017. [Google Scholar]
  3. Snapp, S.S.; Swinton, S.M.; Labarta, R.; Mutch, D.; Black, J.R.; Leep, R.; Nyiraneza, J.; O’Neil, K. Evaluating Cover Crops for Benefits, Costs and Performance within Cropping System Niches. Agron. J. 2005, 97, 322–332. [Google Scholar] [CrossRef]
  4. Pimentel, D.; Hepperly, P.; Hanson, J.; Douds, D.; Seidel, R. Environmental, Energetic, and Economic Comparisons of Organic and Conventional Farming Systems. BioScience 2005, 55, 573–582. [Google Scholar] [CrossRef]
  5. Klonsky, K. Comparison of Production Costs and Resource Use for Organic and Conventional Production Systems. Am. J. Agric. Econ. 2011, 94, 314–321. [Google Scholar] [CrossRef] [Green Version]
  6. Drinkwater, L.E.; Wagoner, P.; Sarrantonio, M. Legume-based cropping systems have reduced carbon and nitrogen losses. Nature 1998, 396, 262–265. [Google Scholar] [CrossRef]
  7. Salvagiotti, F.; Cassman, K.G.; Specht, J.E.; Walters, D.T.; Weiss, A.; Dobermann, A. Nitrogen uptake, fixation and response to fertilizer N in soybeans: A review. Field Crops Res. 2008, 108, 1–13. [Google Scholar] [CrossRef] [Green Version]
  8. Date, R.A. Microbiological problems in the inoculation and nodulation of legumes. Plant Soil 1970, 32, 703–725. [Google Scholar] [CrossRef]
  9. Graham, P.H. Some problems of nodulation and symbiotic nitrogen fixation in Phaseolus vulgaris L.: A review. Field Crops Res. 1981, 4, 93–112. [Google Scholar] [CrossRef]
  10. Brockwell, J.; Bottomley, P.J.; Thies, J.E. Manipulation of rhizobia microflora for improving legume productivity and soil fertility: A critical assessment. Plant Soil 1995, 174, 143–180. [Google Scholar] [CrossRef]
  11. Mallory, E.B.; Posner, J.L.; Baldock, J.O. Performance, economics, and adoption of cover crops in Wisconsin cash grain rotations: On-farm trials. Am. J. Altern. Agric. 1998, 13, 2–11. [Google Scholar] [CrossRef]
  12. Vitousek, P.M.; Aber, J.D.; Howarth, R.W.; Likens, G.E.; Matson, P.A.; Schindler, D.W.; Schlesinger, W.H.; Tilman, D.G. Human alteration of the global nitrogen cycle: Sources and consequences. Ecol. Appl. 1997, 7, 737–750. [Google Scholar] [CrossRef]
  13. Crews, T.E.; Peoples, M.B. Legume versus fertilizer sources of nitrogen: Ecological tradeoffs and human needs. Agric. Ecosyst. Environ. 2004, 102, 279–297. [Google Scholar] [CrossRef]
  14. Denison, R.F.; Toby Kiers, E. Why are most rhizobia beneficial to their plant hosts, rather than parasitic? Microbes Infect. 2004, 6, 1235–1239. [Google Scholar] [CrossRef] [PubMed]
  15. Graham, P.H. Ecology of the Root-Nodule Bacteria of Legumes. In Nitrogen-Fixing Leguminous Symbioses; Dilworth, M.J., James, E.K., Sprent, J.I., Newton, W.E., Eds.; Springer: Dordrecht, The Netherlands, 2008; pp. 23–58. [Google Scholar]
  16. Singh, B.; Usha, K. Nodulation and Symbiotic Nitrogen Fixation of Cowpea Genotypes as Affected by Fertilizer Nitrogen. J. Plant Nutr. 2003, 26, 463–473. [Google Scholar] [CrossRef]
  17. Walley, F.L.; Kyei-Boahen, S.; Hnatowich, G.; Stevenson, C. Nitrogen and phosphorus fertility management for desi and kabuli chickpea. Can. J. Plant Sci. 2005, 85, 73–79. [Google Scholar] [CrossRef]
  18. Serraj, R.; Sinclair, T.R.; Purcell, L.C. Symbiotic N2 fixation response to drought. J. Exp. Bot. 1999, 50, 143–155. [Google Scholar] [CrossRef] [Green Version]
  19. Zahran, H.H. Rhizobium Legume Symbiosis and Nitrogen Fixation under Severe Conditions and in an Arid Climate. Microbiol. Mol. Biol. Rev. 1999, 63, 968–989. [Google Scholar] [PubMed]
  20. González-Guerrero, M.; Matthiadis, A.; Saez, Á.; Long, T. Fixating on metals: New insights into the role of metals in nodulation and symbiotic nitrogen fixation. Front. Plant Sci. 2014, 5, 45. [Google Scholar] [CrossRef] [PubMed]
  21. O’Hara, G.W. Nutritional constraints on root nodule bacteria affecting symbiotic nitrogen fixation: A review. Aust. J. Exp. Agric. 2001, 41, 417–433. [Google Scholar] [CrossRef]
  22. Farquharson, E.; Herridge, D.; Ballard, R.; O’Hara, G.; Deaker, R.; Denton, M.; Yates, R.J.; Gemell, G.; Hartley, E.; Phillips, L.; et al. Inoculating Legumes: A Practical Guide; Grains Research and Development Corporation: Kingston, Australia, 2012. [Google Scholar]
  23. Yanni, Y.G. Performance of chickpea, lentil and lupin nodulated with indigenous or inoculated rhizobia micropartners under nitrogen, boron, cobalt and molybdenum fertilization schedules. World J. Microbiol. Biotechnol. 1992, 8, 607–613. [Google Scholar] [CrossRef] [PubMed]
  24. Bremer, E.; Kessel, C.V.; Karamanos, R. Inoculant, phosphorus and nitrogen responses of lentil. Can. J. Plant Sci. 1989, 69, 691–701. [Google Scholar] [CrossRef]
  25. Høgh-Jensen, H.; Schjoerring, J.K.; Soussana, J.F. The Influence of Phosphorus Deficiency on Growth and Nitrogen Fixation of White Clover Plants. Ann. Bot. 2002, 90, 745–753. [Google Scholar] [CrossRef] [PubMed] [Green Version]
  26. Israel, D.W. Investigation of the Role of Phosphorus in Symbiotic Dinitrogen Fixation. Plant Physiol. 1987, 84, 835. [Google Scholar] [CrossRef] [PubMed]
  27. Jakobsen, I. The role of phosphorus in nitrogen fixation by young pea plants (Pisum sativum). Physiol. Plant. 1985, 64, 190–196. [Google Scholar] [CrossRef]
  28. Leidi, E.O.; RodrÍGuez-Navarro, D.N. Nitrogen and phosphorus availability limit N2 fixation in bean. New Phytol. 2000, 147, 337–346. [Google Scholar] [CrossRef]
  29. Weaver, R.W.; Arayangkoon, T.; Schomber, H.H. Nodulation and N2 fixation of guar at high root temperature. Plant Soil 1990, 126, 209–213. [Google Scholar] [CrossRef]
  30. Bordeleau, L.M.; Prévost, D. Nodulation and nitrogen fixation in extreme environments. Plant Soil 1994, 161, 115–125. [Google Scholar] [CrossRef]
  31. Hungria, M.; Franco, A.A. Effects of high temperature on nodulation and nitrogen fixation by Phaseolus vulgaris L. Plant Soil 1993, 149, 95–102. [Google Scholar] [CrossRef]
  32. Favre, A.K.L.; Eaglesham, A.R.J. The effects of high temperatures on soybean nodulation and growth with different strains of bradyrhizobia. Can. J. Microbiol. 1986, 32, 22–27. [Google Scholar] [CrossRef]
  33. Aranjuelo, I.; Arrese-Igor, C.; Molero, G. Nodule performance within a changing environmental context. J. Plant Physiol. 2014, 171, 1076–1090. [Google Scholar] [CrossRef] [Green Version]
  34. Hunt, P.G.; Wollum, A.G.; Matheny, T.A. Effects of Soil Water on Rhizobium japonicum Infection, Nitrogen Accumulation, and Yield in Bragg Soybeans1. Agron. J. 1981, 73, 501–505. [Google Scholar] [CrossRef]
  35. Kirda, C.; Danso, S.K.A.; Zapata, F. Temporal water stress effects on nodulation, nitrogen accumulation and growth of soybean. Plant Soil 1989, 120, 49–55. [Google Scholar] [CrossRef]
  36. Venkateswarlu, B.; Maheswari, M.; Saharan, N. Effects of water deficit on N2(C2H2) fixation in cowpea and groundnut. Plant Soil 1989, 114, 69–74. [Google Scholar] [CrossRef]
  37. Williams, P.M.; Sicardi de Mallorca, M.S. Effect of osmotically induced leaf moisture stress on nodulation and nitrogenase activity ofGlycine max. Plant Soil 1984, 80, 267–283. [Google Scholar] [CrossRef]
  38. Rice, W.A.; Clayton, G.W.; Olsen, P.E.; Lupwayi, N.Z. Rhizobial inoculant formulations and soil pH influence field pea nodulation and nitrogen fixation. Can. J. Soil Sci. 2000, 80, 395–400. [Google Scholar] [CrossRef]
  39. Schubert, E.; Mengel, K.; Schubert, S. Soil pH and Calcium Effect on Nitrogen Fixation and Growth of Board Bean. Agron. J. 1990, 82, 969–972. [Google Scholar] [CrossRef]
  40. Azcón, R.; El-Atrash, F.J. Influence of arbuscular mycorrhizae and phosphorus fertilization on growth, nodulation and N2 fixation (15N) inMedicago sativa at four salinity levels. Biol. Fertil. Soils 1997, 24, 81–86. [Google Scholar] [CrossRef]
  41. Rao, D.L.N.; Giller, K.E.; Yeo, A.R.; Flowers, T.J. The Effects of Salinity and Sodicity upon Nodulation and Nitrogen Fixation in Chickpea (Cicer arietinum). Ann. Bot. 2002, 89, 563–570. [Google Scholar] [CrossRef]
  42. Zahran, H.H. Conditions for successful Rhizobium-legume symbiosis in saline environments. Biol. Fertil. Soils 1991, 12, 73–80. [Google Scholar] [CrossRef]
  43. Wani, P.A.; Khan, M.S.; Zaidi, A. Impact of heavy metal toxicity on plant growth, symbiosis, seed yield and nitrogen and metal uptake in chickpea. Aust. J. Exp. Agric. 2007, 47, 712–720. [Google Scholar] [CrossRef]
  44. Deaker, R.; Roughley, R.J.; Kennedy, I.R. Legume seed inoculation technology—A review. Soil Biol. Biochem. 2004, 36, 1275–1288. [Google Scholar] [CrossRef]
  45. Kyei-Boahen, S.; Savala, C.E.N.; Chikoye, D.; Abaidoo, R. Growth and Yield Responses of Cowpea to Inoculation and Phosphorus Fertilization in Different Environments. Front. Plant Sci. 2017, 8, 646. [Google Scholar] [CrossRef] [PubMed]
  46. Requena, N.; Jimenez, I.; Toro, M.; Barea, J.M. Interactions between plant-growth-promoting rhizobacteria (PGPR), arbuscular mycorrhizal fungi and Rhizobium spp. in the rhizosphere of Anthyllis cytisoides, a model legume for revegetation in mediterranean semi-arid ecosystems. New Phytol. 1997, 136, 667–677. [Google Scholar] [CrossRef]
  47. Elegba, M.S. Effect of different inoculant adhesive agents on rhizobial survival, nodulation, and nitrogenase (acetylene-reducing) activity of soybeans (Glycine max (L.) Merrill). Can. J. Soil Sci. 1984, 64, 631–636. [Google Scholar] [CrossRef]
  48. Hoben, H.J.; Aung, N.N.; Somasegaran, P.; Kang, U.-G. Oils as adhesives for seed inoculation and their influence on the survival of Rhizobium spp. and Bradyrhizobium spp. on inoculated seeds. World J. Microbiol. Biotechnol. 1991, 7, 324–330. [Google Scholar] [CrossRef] [PubMed]
  49. Walsh, K.B. Physiology of the legume nodule and its response to stress. Soil Biol. Biochem. 1995, 27, 637–655. [Google Scholar] [CrossRef]
  50. Seefeldt, L.C.; Hoffman, B.M.; Dean, D.R. Mechanism of Mo-Dependent Nitrogenase. Annu. Rev. Biochem. 2009, 78, 701–722. [Google Scholar] [CrossRef] [PubMed]
  51. O’hara, G.W.; Boonkerd, N.; Dilworth, M.J. Mineral constraints to nitrogen fixation. Plant Soil 1988, 108, 93–110. [Google Scholar] [CrossRef]
  52. Smith, B.E. Nitrogenase Reveals Its Inner Secrets. Science 2002, 297, 1654. [Google Scholar] [CrossRef] [PubMed]
  53. Hajiboland, R. Effect of Micronutrient Deficiencies on Plants Stress Responses. In Abiotic Stress Responses in Plants: Metabolism, Productivity and Sustainability; Ahmad, P., Prasad, M.N.V., Eds.; Springer: New York, NY, USA, 2012; pp. 283–329. [Google Scholar]
  54. Apel, K.; Hirt, H. Reactive oxygen species: Metabolism, Oxidative Stress, and Signal Transduction. Annu. Rev. Plant Biol. 2004, 55, 373–399. [Google Scholar] [CrossRef] [PubMed]
  55. Rubio, M.C.; Becana, M.; Sato, S.; James, E.K.; Tabata, S.; Spaink, H.P. Characterization of Genomic Clones and Expression Analysis of the Three Types of Superoxide Dismutases During Nodule Development in Lotus japonicus. Int. Soc. Mol. Plant Microbe Interact. 2007, 20, 262–275. [Google Scholar] [CrossRef] [PubMed]
  56. Eubanks, T.M. Collection, Isolation and Evaluation of Nitrogen Fixing Bacteria in the Rio Grande Valley of Texas; University of Texas Pan American: Edinburg, TX, USA, 2005. [Google Scholar]
  57. George, E.; Marschner, H.; Jakobsen, I. Role of Arbuscular Mycorrhizal Fungi in Uptake of Phosphorus and Nitrogen from Soil. Crit. Rev. Biotechnol. 1995, 15, 257–270. [Google Scholar] [CrossRef]
  58. Lynch, J.P. Root phenotypes for improved nutrient capture: An underexploited opportunity for global agriculture. New Phytol. 2019, 223. [Google Scholar] [CrossRef] [PubMed]
  59. Chalk, P.M.; Souza, R.d.F.; Urquiaga, S.; Alves, B.J.R.; Boddey, R.M. The role of arbuscular mycorrhiza in legume symbiotic performance. Soil Biol. Biochem. 2006, 38, 2944–2951. [Google Scholar] [CrossRef]
  60. Ruiz-Lozano, J.M.; Collados, C.; Barea, J.M.; Azcón, R. Arbuscular mycorrhizal symbiosis can alleviate drought-induced nodule senescence in soybean plants. New Phytol. 2001, 151, 493–502. [Google Scholar] [CrossRef]
  61. Ortas, I. Effect of Selected Mycorrhizal Inoculation on Phosphorus Sustainability in Sterile and Non-sterile Soils in the Harran Plain in South Anatolia. J. Plant Nutr. 2003, 26, 1–17. [Google Scholar] [CrossRef]
  62. Taiz, L.; Zeiger, E.; Moller, I.M.; Murphy, A. Plant Physiology and Development, 6th ed.; Sinauer Associates, Inc.: Sunderland, MA, USA, 2015. [Google Scholar]
  63. Gee, G.W.; Bauder, J.W. Particle Size Analysis by Hydrometer: A Simplified Method for Routine Textural Analysis and a Sensitivity Test of Measurement Parameters1. Soil Sci. Soc. Am. J. 1979, 43, 1004–1007. [Google Scholar] [CrossRef]
  64. Lindberg, S.E. Factors influencing trace metal, sulfate and hydrogen ion concentrations in rain. Atmos. Environ. 1982, 16, 1701–1709. [Google Scholar] [CrossRef]
  65. City of Edinburg Utilities Department. Annual Drinking Water Quality Report for 2017; City of Edinburg: Edinburg, TX, USA, 2018.
  66. Von Wandruszka, R. Phosphorus retention in calcareous soils and the effect of organic matter on its mobility. Geochem. Trans. 2006, 7, 6. [Google Scholar] [CrossRef]
  67. Rugg, S.M. Multifunctionality of Cover Crops on Organic Vegetable Farms in South Texas; University of Texas Rio Grande Valley: Edinburg, TX, USA, 2017. [Google Scholar]
  68. McDaniel, M.D.; Tiemann, L.K.; Grandy, A.S. Does agricultural crop diversity enhance soil microbial biomass and organic matter dynamics? A meta-analysis. Ecol. Appl. 2014, 24, 560–570. [Google Scholar] [CrossRef] [Green Version]
  69. Soti, P.G.; Rugg, S.; Racelis, A.E. Potential of cover crops in promoting mycorrhizal diversity and soil quality in organic farms. J. Agric. Sci. 2016, 8, 42–47. [Google Scholar] [CrossRef]
  70. Poorter, H.; Fiorani, F.; Stitt, M.; Schurr, U.; Finck, A.; Gibon, Y.; Usadel, B.; Munns, R.; Atkin, I.K.; Tardieu, F.; et al. The art of growing plants for experimental purposes: A practical guide for the plant biologist. Funct. Plant Biol. 2012, 39, 821–838. [Google Scholar] [CrossRef]
  71. Pararajasingham, S.; Knievel, D.P. Nitrogenase activity of cowpea (Vigna unguiculata (L.) Walp.) during and after drought stress. Can. J. Plant Sci. 1990, 70, 163–171. [Google Scholar] [CrossRef]
  72. Lugtenberg, B.; Kamilova, F. Plant-Growth-Promoting Rhizobacteria. Plant Soil 2009, 63, 541–556. [Google Scholar] [CrossRef] [PubMed] [Green Version]
  73. Lupwayi, N.Z.; Olsen, P.E.; Sande, E.S.; Keyser, H.H.; Collins, M.M.; Singleton, P.W.; Rice, W.A. Inoculant quality and its evaluation. Field Crops Res. 2000, 65, 259–270. [Google Scholar] [CrossRef]
  74. Materon, L.A.; Weaver, R.W. Inoculant Maturity Influences Survival of Rhizobia on Seed. Appl. Environ. Microbiol. 1985, 49, 465. [Google Scholar]
Figure 1. All experiments except phosphorus showed significant differences in nodule biomass (a). High moisture significantly increased nodule biomass over saturation/drought cycle, while mid-range moisture significantly differed from neither high nor cycle. Micronutrient addition increased nodule biomass while N addition completely inhibited it. There was no significant difference between mean nodule biomass control N and low N. Soil sterilization significantly impeded nodule formation. For nodulation intensity (the ratio of nodule biomass to root biomass) only the nitrogen and sterilization experiments showed significant differences with the same trends as nodule biomass (b). ** α ≤ 0.01, *** α ≤ 0.001.
Agriculture 09 00209 g001
Figure 2. Nodulation intensity and plant vigor.
Agriculture 09 00209 g002
Figure 3. Cowpeas in the coarse assay and micronutrient experiments, inoculated with 1 mL of pipetted rhizobial slurry directly to the seed, showed a substantially higher nodulation rate than cowpeas in the field, inoculated in a more traditional way. The precise inoculation of controlled experiments cannot be replicated in the field, but other ways to bridge the gap and improve field inoculation outcomes must be considered.
Agriculture 09 00209 g003
Table 1. Barriers to rhizobial establishment.
Mineral NutritionSources
Nitrogen excess[10,16,17,18,19]
Micronutrient deficiency[9,10,20,21,22,23]
Phosphorus deficiency[9,10,19,22,24,25,26,27,28]
Abiotic factors
Temperature [9,19,22,29,30,31,32]
Water stress [9,10,18,19,22,24,33,34,35,36,37]
pH [9,10,19,22,38,39]
Salinity[19,30,40,41,42]
Toxicity
Heavy metal contamination[19,22,43]
Toxic seed pelleting[10,22,44]
Pesticide[9,10,19,22]
Biotic factors
Competitive native microorganisms[10,22,45,46]
Poor inoculant adhesion and survival[22,44,47,48]
Table 2. Solution mixtures used for each nutrient treatment level in the three nutrient experiments.
ExperimentTreatmentSolution MixtureCumulative Amount Added (L)
NitrogenControl5 mM CaCl23.070
Low5 mM CaCl23.160
High5 mM CaN2O63.343
PhosphorusControl2 mM KCl3.325
Low0.1 mM KH2PO4 + 1.9 mM KCl3.538
High2 mM KH2PO43.745
MicronutrientsControltap water3.445
High25 µM H3BO3 + 1.7 µM CoCl2 + 0.5 µM CuSO4 + 2 µM MnCl2 + 0.5 µM Na2MoO4 + 2 µM ZnSO43.763
Table 3. Cumulative amounts of nutrients added over the course of the three nutrient experiments, and corresponding native soil concentrations (far right-hand column). Cumulative amounts are expressed per kg of soil in each pot (µg nutrient/kg soil = ppm).
Cumulative Amount Added by Experiment and Treatment (ppm)Native Soil Concentration (ppm)
NitrogenPhosphorusMicronutrients
NutrientControlLowHighControlLowHighControlHigh
N003120000.000.0019 *
Ca4104224470000.000.00453 *
P000071550.000.0059 *
K0001731841950.000.002088 *
B0000000.000.680.79 **
Cu0000000.000.080.34 ***
Mo0000000.000.120.01 ***
Mn0000000.000.285.27 ***
Zn0000000.000.331.34 ***
Co0000000.000.250.04 ***
* mean of 25 samples analyzed by Mehlich III extraction. ** single soil sample using the hot water method. *** single soil sample using DTPA.
Table 4. Micronutrient experiment nutrient solutions and treatment impacts.
NutrientsNutrient ConcentrationTreatment Impact (µg/g Dry Soil)
Zinc2 µM ZnSO40.21
Copper0.5 µM CuSO40.05
Cobalt1.7 µM CoCl20.16
Molybdenum0.5 µM Na2MoO40.08
Boron25 µM H3BO30.43
Manganese2 µM MnCl20.18

