Article

Soil Water Infiltration Model for Sprinkler Irrigation Control Strategy: A Case for Tea Plantation in Yangtze River Region

1
Key Laboratory of Modern Agricultural Equipment and Technology, Ministry of Education Jiangsu Province, Jiangsu University, Zhenjiang 212013, China
2
Division of Agriculture and Natural Resources, UC Cooperative Extension, University of California, Imperial County, Holtville, CA 92250, USA
3
Department of Land, Air and Water Resources, University of California, Davis, CA 95616, USA
*
Author to whom correspondence should be addressed.
Agriculture 2019, 9(10), 206; https://doi.org/10.3390/agriculture9100206
Submission received: 23 July 2019 / Revised: 18 September 2019 / Accepted: 18 September 2019 / Published: 20 September 2019
(This article belongs to the Special Issue Agricultural Irrigation)

Abstract

:
The sprinkler irrigation method is widely applied in tea farms in the Yangtze River region, China, which is the most famous tea production area. Knowledge of the optimal irrigation time for the sprinkler irrigation system is vital for making the soil moisture range consistent with the root boundary to attain higher yield and water use efficiency. In this study, we investigated the characteristics of soil water infiltration and redistribution under the irrigation water applications rates of 4 mm/h, 6 mm/h, and 8 mm/h, and the slope gradients of 0°, 5°, and 15°. A new soil water infiltration model was established based on water application rate and slope gradient. Infiltration experimental results showed that soil water infiltration rate increased with the application rate when the slope gradient remained constant. Meanwhile, it decreased with the increase in slope gradient at a constant water application rate. In the process of water redistribution, the increment of volumetric water content (VWC) increased at a depth of 10 cm as the water application rate increased, which affected the ultimate infiltration depth. When the slope gradient was constant, a lower water application rate extended the irrigation time, but increased the ultimate infiltration depth. At a constant water application rate, the infiltration depth increased with the increase in slope gradient. As the results showed in the infiltration model validation experiments, the infiltration depths measured were 38.8 cm and 41.1 cm. The relative errors between measured infiltration depth and expected value were 3.1% and 2.7%, respectively, which met the requirement of the soil moisture range consistent with the root boundary. Therefore, this model could be used to determine the optimal irrigation time for developing a sprinkler irrigation control strategy for tea fields in the Yangtze River region.

1. Introduction

Tea (Camellia sinensis) is a subtropical plant, which grows well in a warm and wet climate under an optimal growth temperature around 20 °C with annual rainfall of 1500 mm. The Yangtze River region is the most famous tea production area. Climate abnormality in recent decades caused an uneven spatial distribution of rainfall in this area. Inadequate rainfall cannot provide enough water for tea growth, which seriously affects both the yield and quality of the tea plants [1,2]. Under water stress, the photosynthetic and respiration rates of tea leaves decrease [3], as well as their chlorophyll content, the water content of shoots, the root activity, and the root weight per unit volume [4]. Meanwhile, quality components such as amino acids, caffeine, and water extracts are also reduced, resulting in the deterioration of the tea quality [5,6,7,8].
The sprinkler irrigation method is widely applied to save water and counter drought with great improvement with regard to water use efficiency, irrigation uniformity, labor saving, and crop yields [9]. The traditional control strategy for sprinkler irrigation is usually based on the upper limit and lower limit of soil moisture required for the growth of certain plants [10,11,12]. This kind of control strategy partly provides the required water for tea plant growth and saves some applied water compared to manual irrigation. However, it leads to the ultimate infiltration depth exceeding the boundary of the tea plant root system, resulting in a waste of water resources. Thus, it is necessary to improve the water use efficiency (WUE) of sprinkler irrigation systems, especially for tea fields in the Yangtze River region.
Infiltration is the process of water entering the soil. The main goal of operating an irrigation system is to apply the required infiltration depth for specific plants with high WUE [3,7,9,13,14]. Normally, infiltration rate is determined by measuring, modeling, and predicting the surface runoff [15,16,17]. To avoid low-WUE problems, it is necessary to have a good understanding of soil infiltration characteristics. Infiltration rate variation results from many causes such as soil property, water application rate, and terrain [18,19,20]. Infiltration theories and models were developed by several researchers, including the Green–Ampt model, Kostiakov model, modified Kostiakov model, and Smith and Parlange model [21,22,23]. The suitability of an infiltration model for a particular region is subject to soil type and field conditions. Different infiltration models were applied to certain soil types and certain site conditions [24]. Over the years, several comparative analyses of various infiltration models were conducted to assess the suitability of various models for different soil types under varying field conditions to estimate the infiltration rates and infiltration potentials of soil [25]. Feng, Deng, Zhang, and Guo [26] pointed out that the cumulative infiltration depth firstly decreased then increased with the increase in slope gradient, and the turning point was the threshold of the slope gradient. Recent researches focused on the effects of slope gradient and water application rate on soil water infiltration and redistribution without any plants; however, they failed to reveal the situation with plants [27,28]. To some extent, the morphological, quantitative, depth, type, and distribution characteristics of plant roots affect soil water moisture and its redistribution [29,30,31,32]. The infiltration characteristics of soil change with the root length density and root surface area density [33,34]. With the increase in root volume and dry weight of root, the infiltration rate shows an increasing trend [35]. Soil moisture content is lower in soil layers with denser root density, while water content in soil layers without roots is significantly increased [36]. If the moisture content range is not consistent with the root range of the tea plant, it will result in inefficient irrigation or overirrigation. Therefore, an optimal irrigation time and infiltration depth are vital for tea plants in the context of a water-saving irrigation control strategy.
Tea farms in the middle and lower Yangtze River regions are located in a hilly area, with a slope gradient generally less than 15° [27]. Based on the topographic features of tea farms, the specific goals of this study were to (1) investigate the effects of slope gradient and water application rate on soil water infiltration and redistribution, and (2) provide a new infiltration model for determining the optimal stopping time for a tea plantation sprinkler irrigation control system. The model is based on tea root length, water application rate, and slope gradient, and results in the infiltration depth being consistent with tea plant’s root system, which validates the precision control for tea plant irrigation.

2. Materials and Methods

2.1. Materials

This study was conducted at a tea farm located in the middle–lower Yangtze River region, east China, which has a moderate sub-tropical climate with a mean annual precipitation of 1029.1 mm and an average annual temperature of 15.5 °C. The annual reference evapotranspiration (ET0) was 892.24 mm, which was observed over the last 55 years (1961–2015) [37]. The topography of the experimental site is a hilly ground with an average altitude of 18.5 m (latitude 32°01′35″ north (N), longitude 119°40′21″ east (E)).
As shown in Figure 1, the box frame sprinkler irrigation system was composed of a box frame, pump station, main pipe, distribution pipe, lateral pipe, standpipe, and sprinkler. The distance between two sprinklers was 9.0 m. In order to reduce the pressure difference between sprinklers and improve the uniformity of spraying water, lateral pipes with a length of 4.5 m were laid along the slope. Four sprinklers were set up around the box frame with an effective radius of 7.0 m. The box frame was 4.5 m in length, 0.8 m in width, and 0.8 m in depth, and the adjustable range of the gradient is 0–15°. To ensure the box frame was well drained, drain holes (diameter 1.0 cm) were set up at the bottom of the box. The exterior of the box was made of an acrylic plate (80.0 cm × 0.5 cm, transparency 99.0%) to facilitate the measurement of infiltration depth. The sampled tea cultivar was Anji white tea, which was five years old. Six tea plants were planted in the frame box with distances of 0.35, 1.05, 1.75, 2.75, 3.45, and 4.15 m (Figure 2). Three kinds of plastic impact-driven sprinklers were selected. Technical parameters of the sprinklers are listed in Table 1. Three kinds of water application rates were set up using the different types of sprinklers with flow rates of 0.4, 0.6, and 0.8 m3·h−1. A plastic shade was set up above the experiment area on rainy days to avoid the influence of rainfall.
The classification of soil texture was based on the World Reference Base (WRB) soil classification system [38]. The soil was collected from the experimental site at depths of 0–10.0 cm, 10.0–20.0 cm, 20.0–30.0 cm, 30.0–40.0 cm, 40.0–50.0 cm, and 50.0–80.0 cm. Bulk density and saturated VWC were measured using the oven dry method. A laser diffraction particle size analyzer (Mastersizer 3000, Malvern Panalytical, UK) was used to measure the particle composition. The soil texture at a depth of 0–40 cm was sandy loam, and that under 40 cm was loam (Table 2). A soil moisture sensor (TRIME PICO 64, IMKO, Ettlingen, Germany) was used to measure VWC, and the measuring accuracy was ± 1%.

2.2. Methods

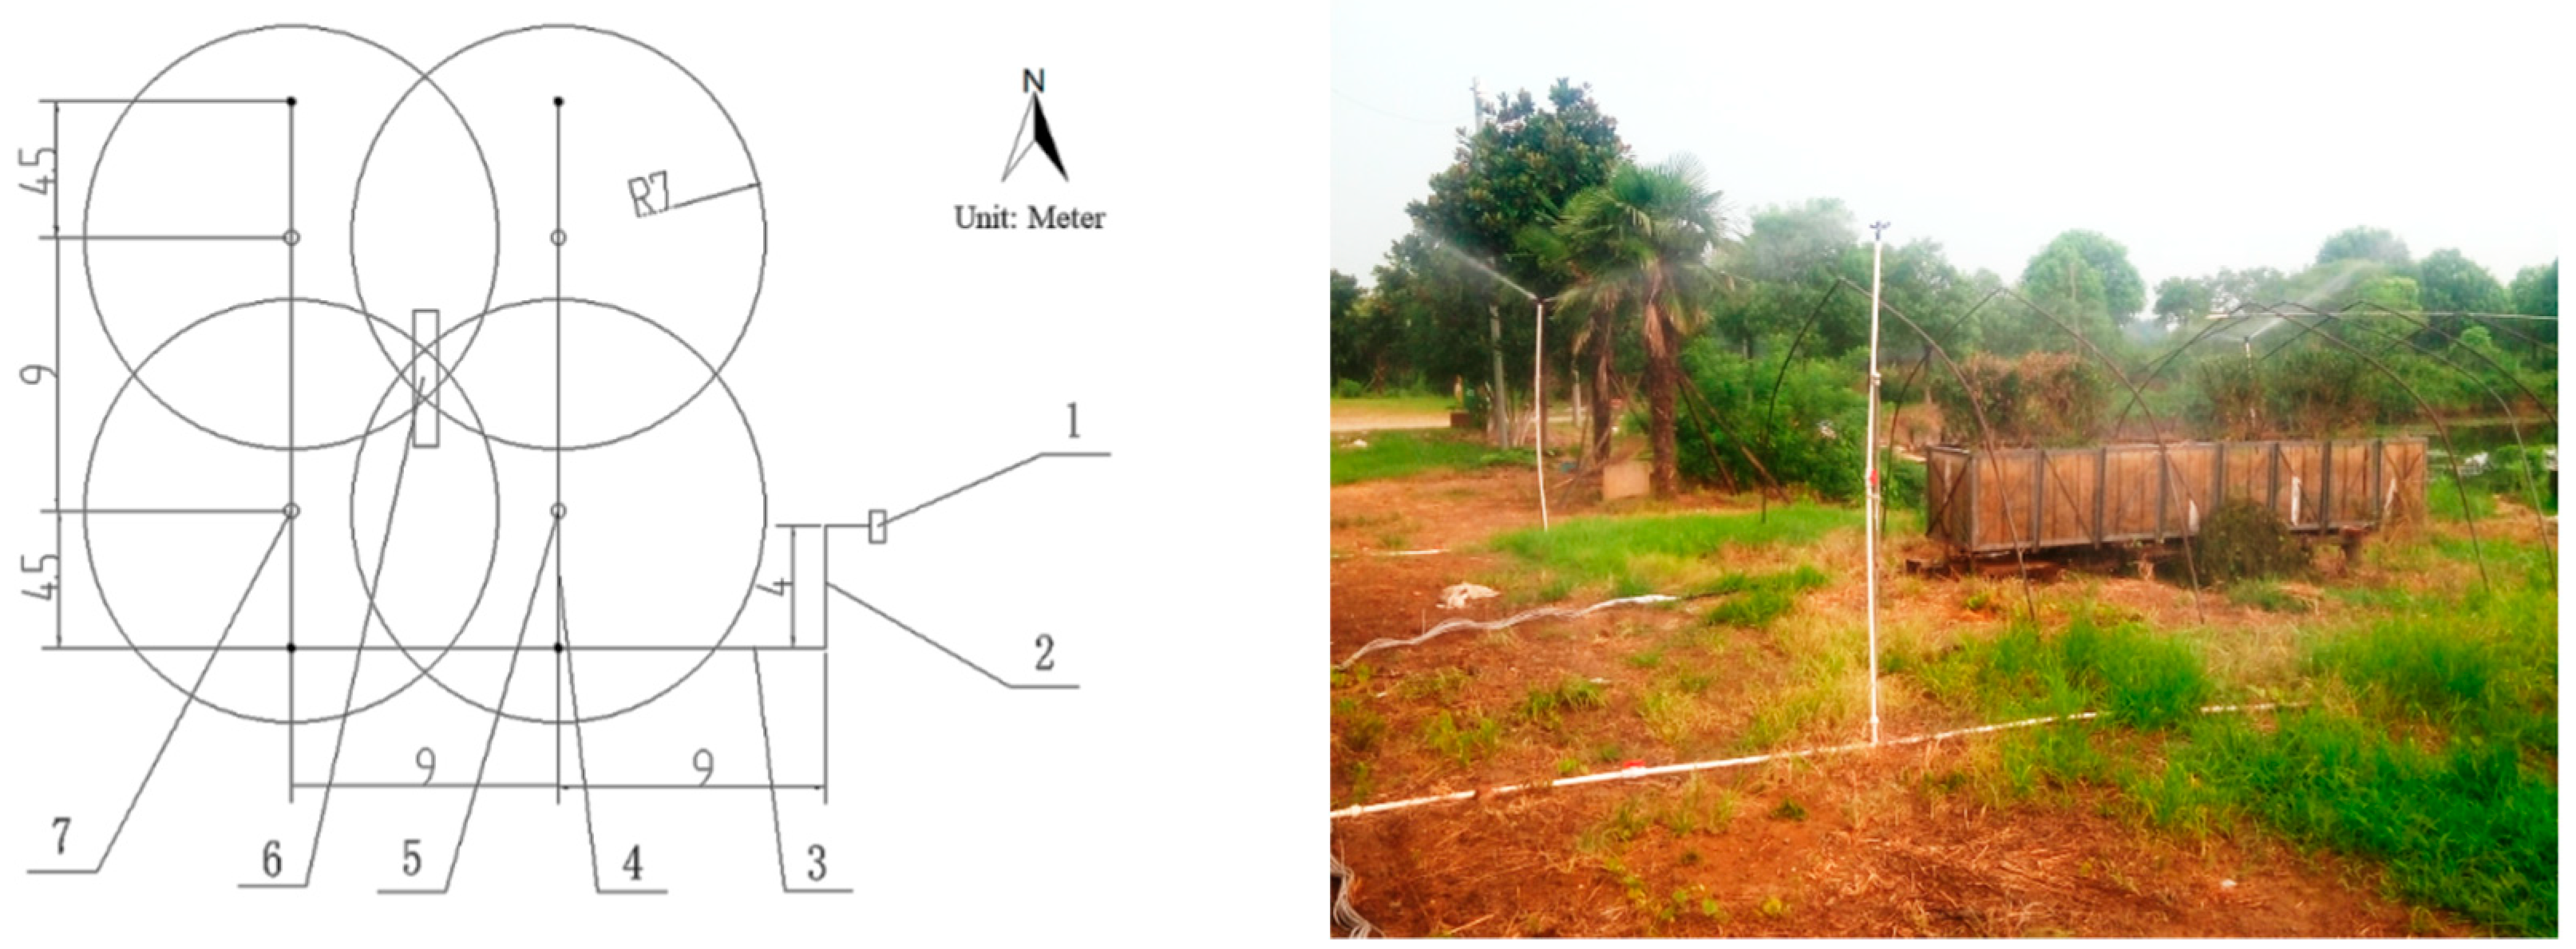
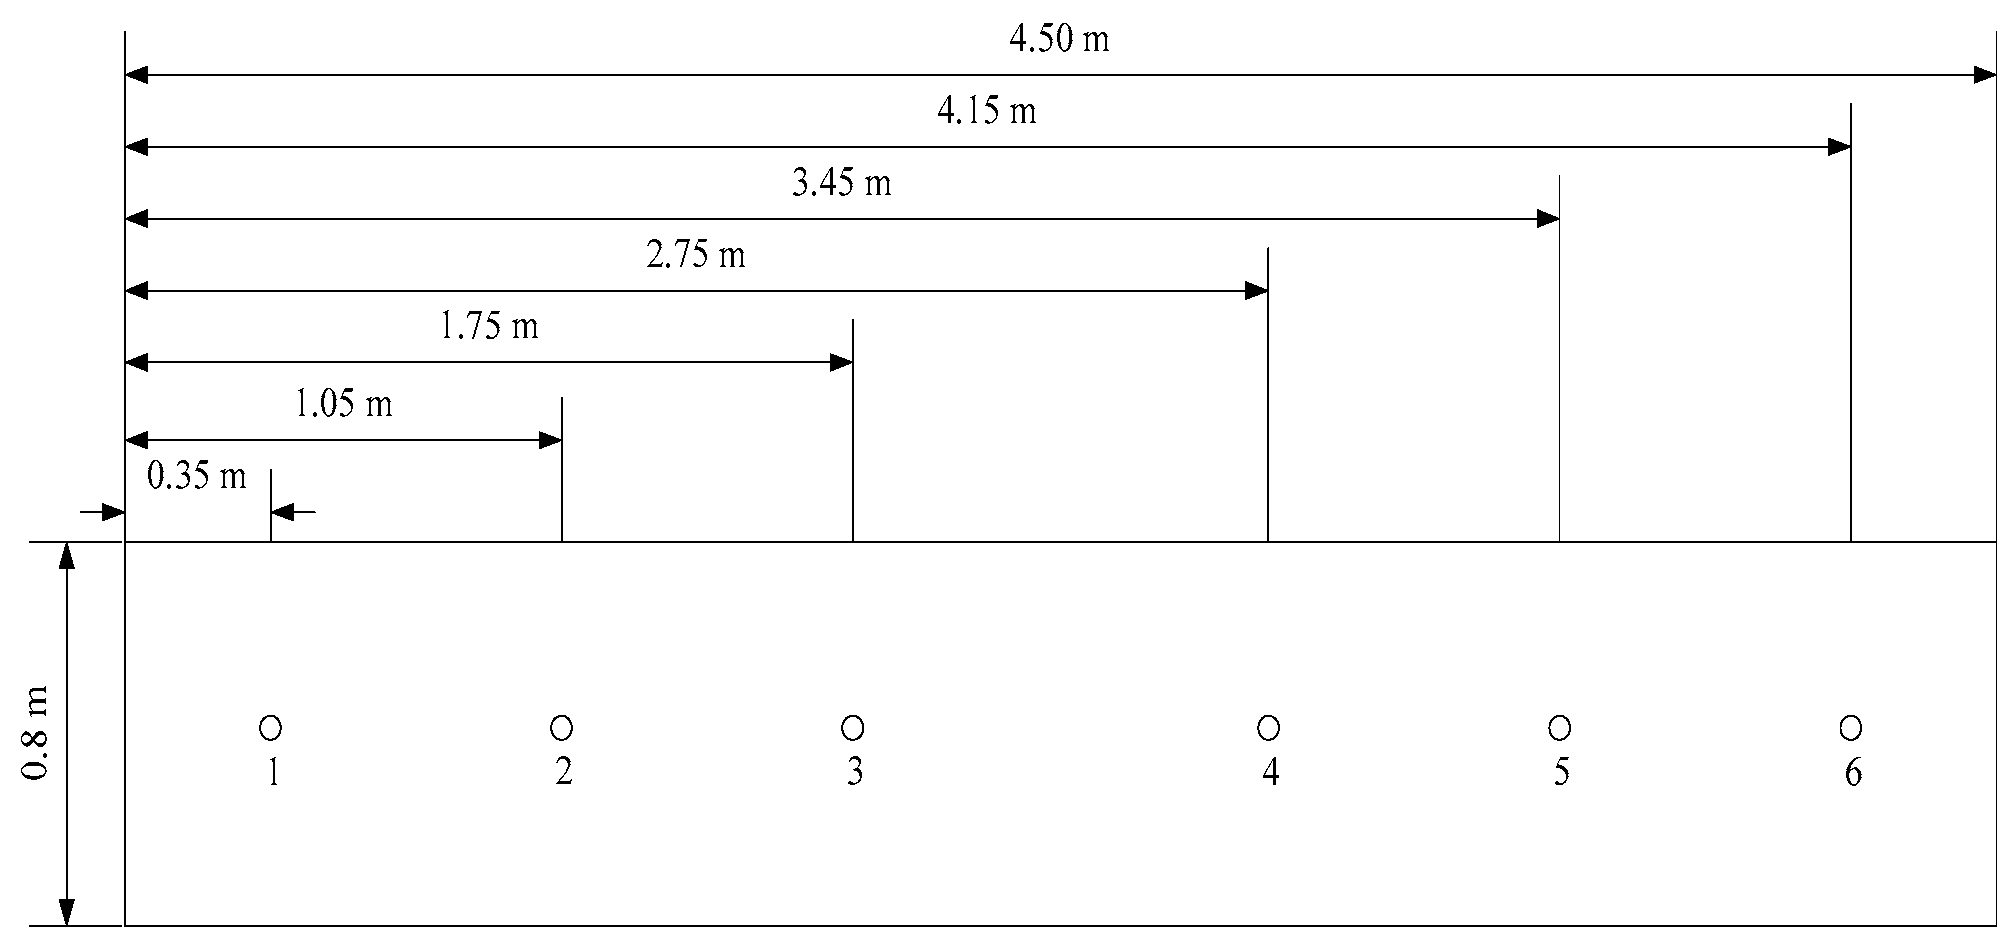
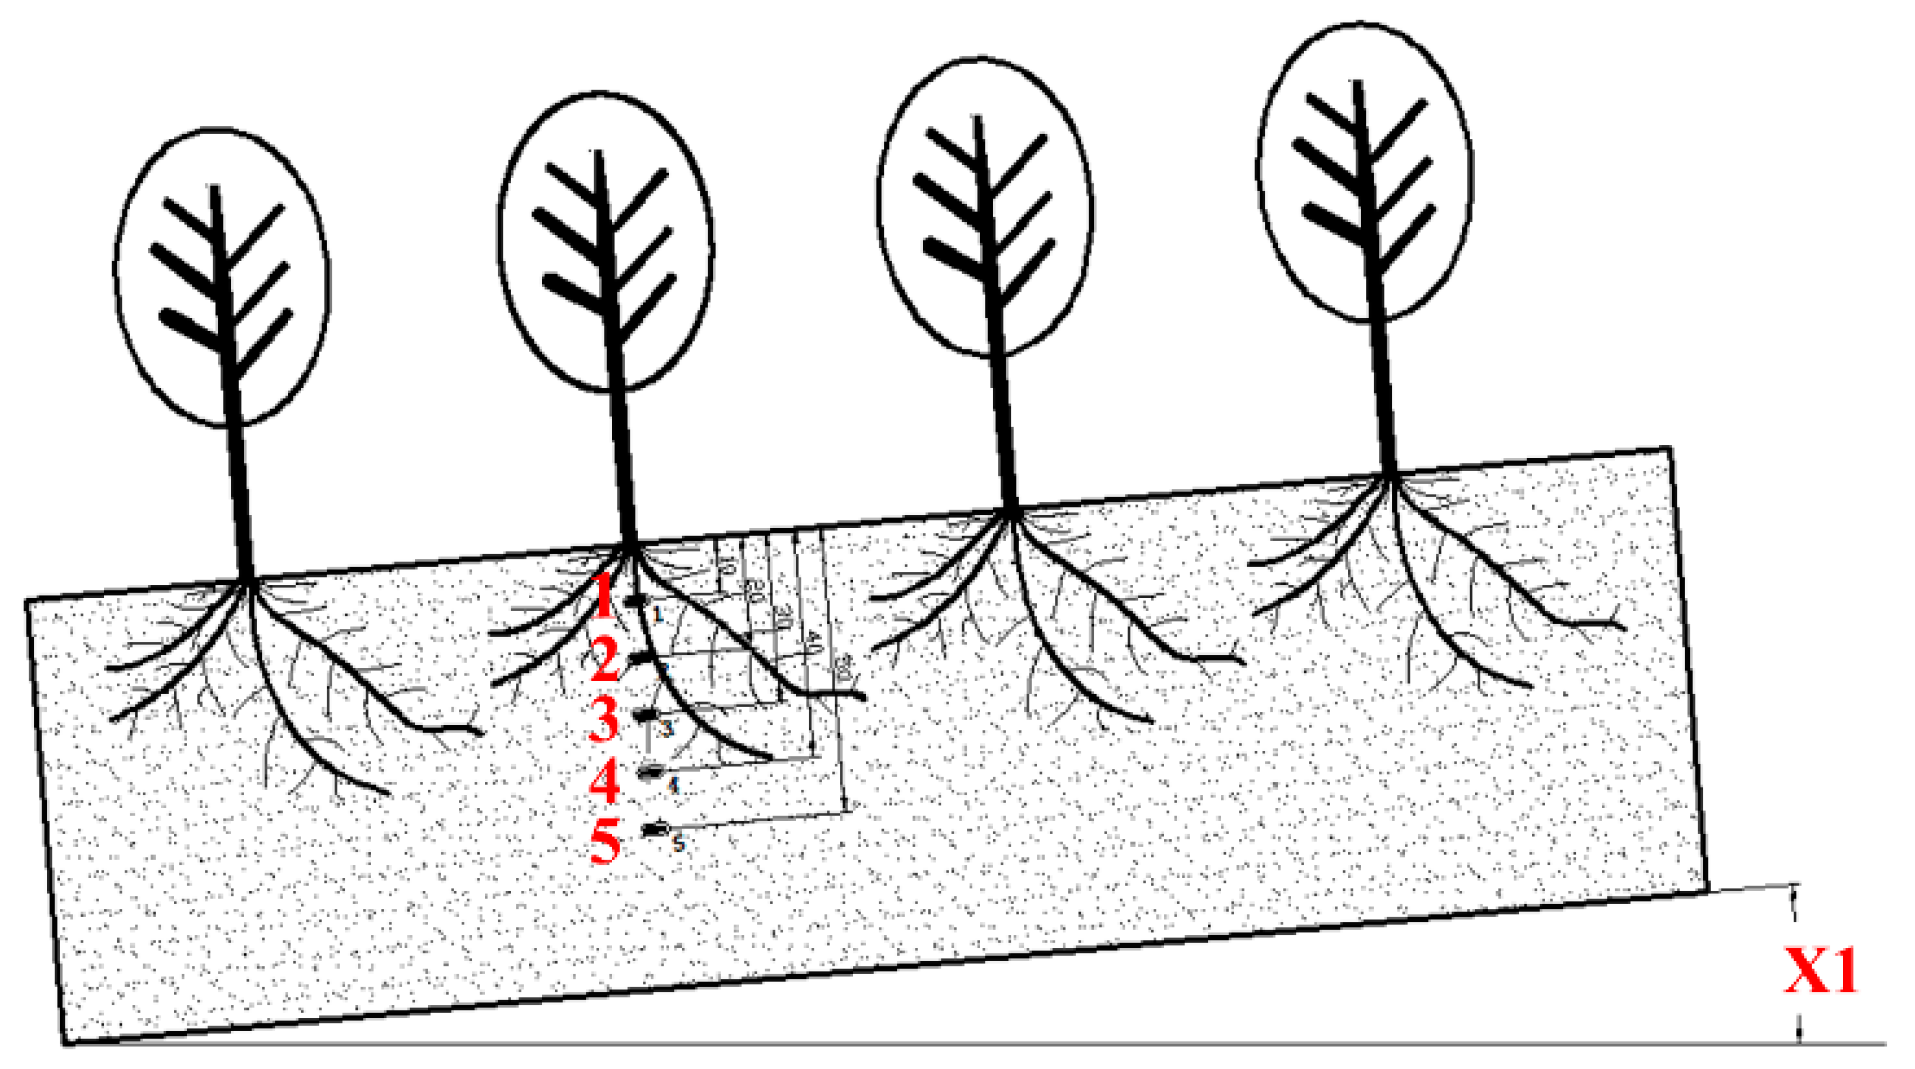
2.2.1. Sensor Layout

The soil in the experimental box frame was taken from the sprinkler irrigation area in the experimental tea farm. The sampling depths were 0–10.0 cm, 10.0–20.0 cm, 20.0–30.0 cm, 30.0–40.0 cm, 40.0–50.0 cm, and 50.0–80.0 cm (Figure 3). The sampled soil was air-dried, ground, and screened before layering it into the experimental box frame. The surface of the filled soil was hacked to reduce the influence of artificial compaction on soil water infiltration.
Infiltration depth and VWC were measured in this experiment. All soil moisture sensors were calibrated using the oven dry method before set-up. The time interval of data acquisition was 1.0 min.
Soil type in the experimental site was homogeneous sandy loam. The location of the color gradient of the soil was marked, and the depth of position was measured as the infiltration depth. The water infiltration process started with the irrigation and stopped when the irrigation stopped, and then the water continued to infiltrate. When the VWC of each layer no longer increased and showed a decreasing trend, the process of water redistribution stopped.

2.2.2. Characteristics of Soil Water Infiltration

Characteristics of the soil water infiltration experiments were determined in the frame box from 1–26 August 2016 (Table 3). Nine treatments were selected with three typical kinds of slope gradients and water application rates. The irrigation was stopped when the infiltration depth was 20.0 cm due to the average length of the tea plant roots. SPSS 17.0 was used to conduct the multivariate regression analysis of the relationship between slope gradient, water application rate, and the ratio of stopping irrigation depth to infiltration depth. The statistical tools root-mean-squared error (RMSE) and coefficient of determination (R2) were employed to validate the accuracy of the models built in this study. The calculations are presented below.

2.2.3. Infiltration Model Validation Experiments

The soil water infiltration model was established based on tea root depth, water application rate, and slope gradient. The reliability of the model was evaluated in the box frame experiments based on two cases which represented the most common terrains of tea farms in the Yangtze River region: (1) gradient 0° and 8.0 mm∙h−1 for water application rate; (2) gradient 8° and 4.0 mm∙h−1 for water application rate. The required irrigation time and expected infiltration depth were calculated. The VWC at depths of 10.0 cm, 20.0 cm, 30.0 cm, and 40.0 cm was measured. The ultimate infiltration depth was compared with the expected value to obtain the relative error between the measured and expected value.

3. Results and Discussion

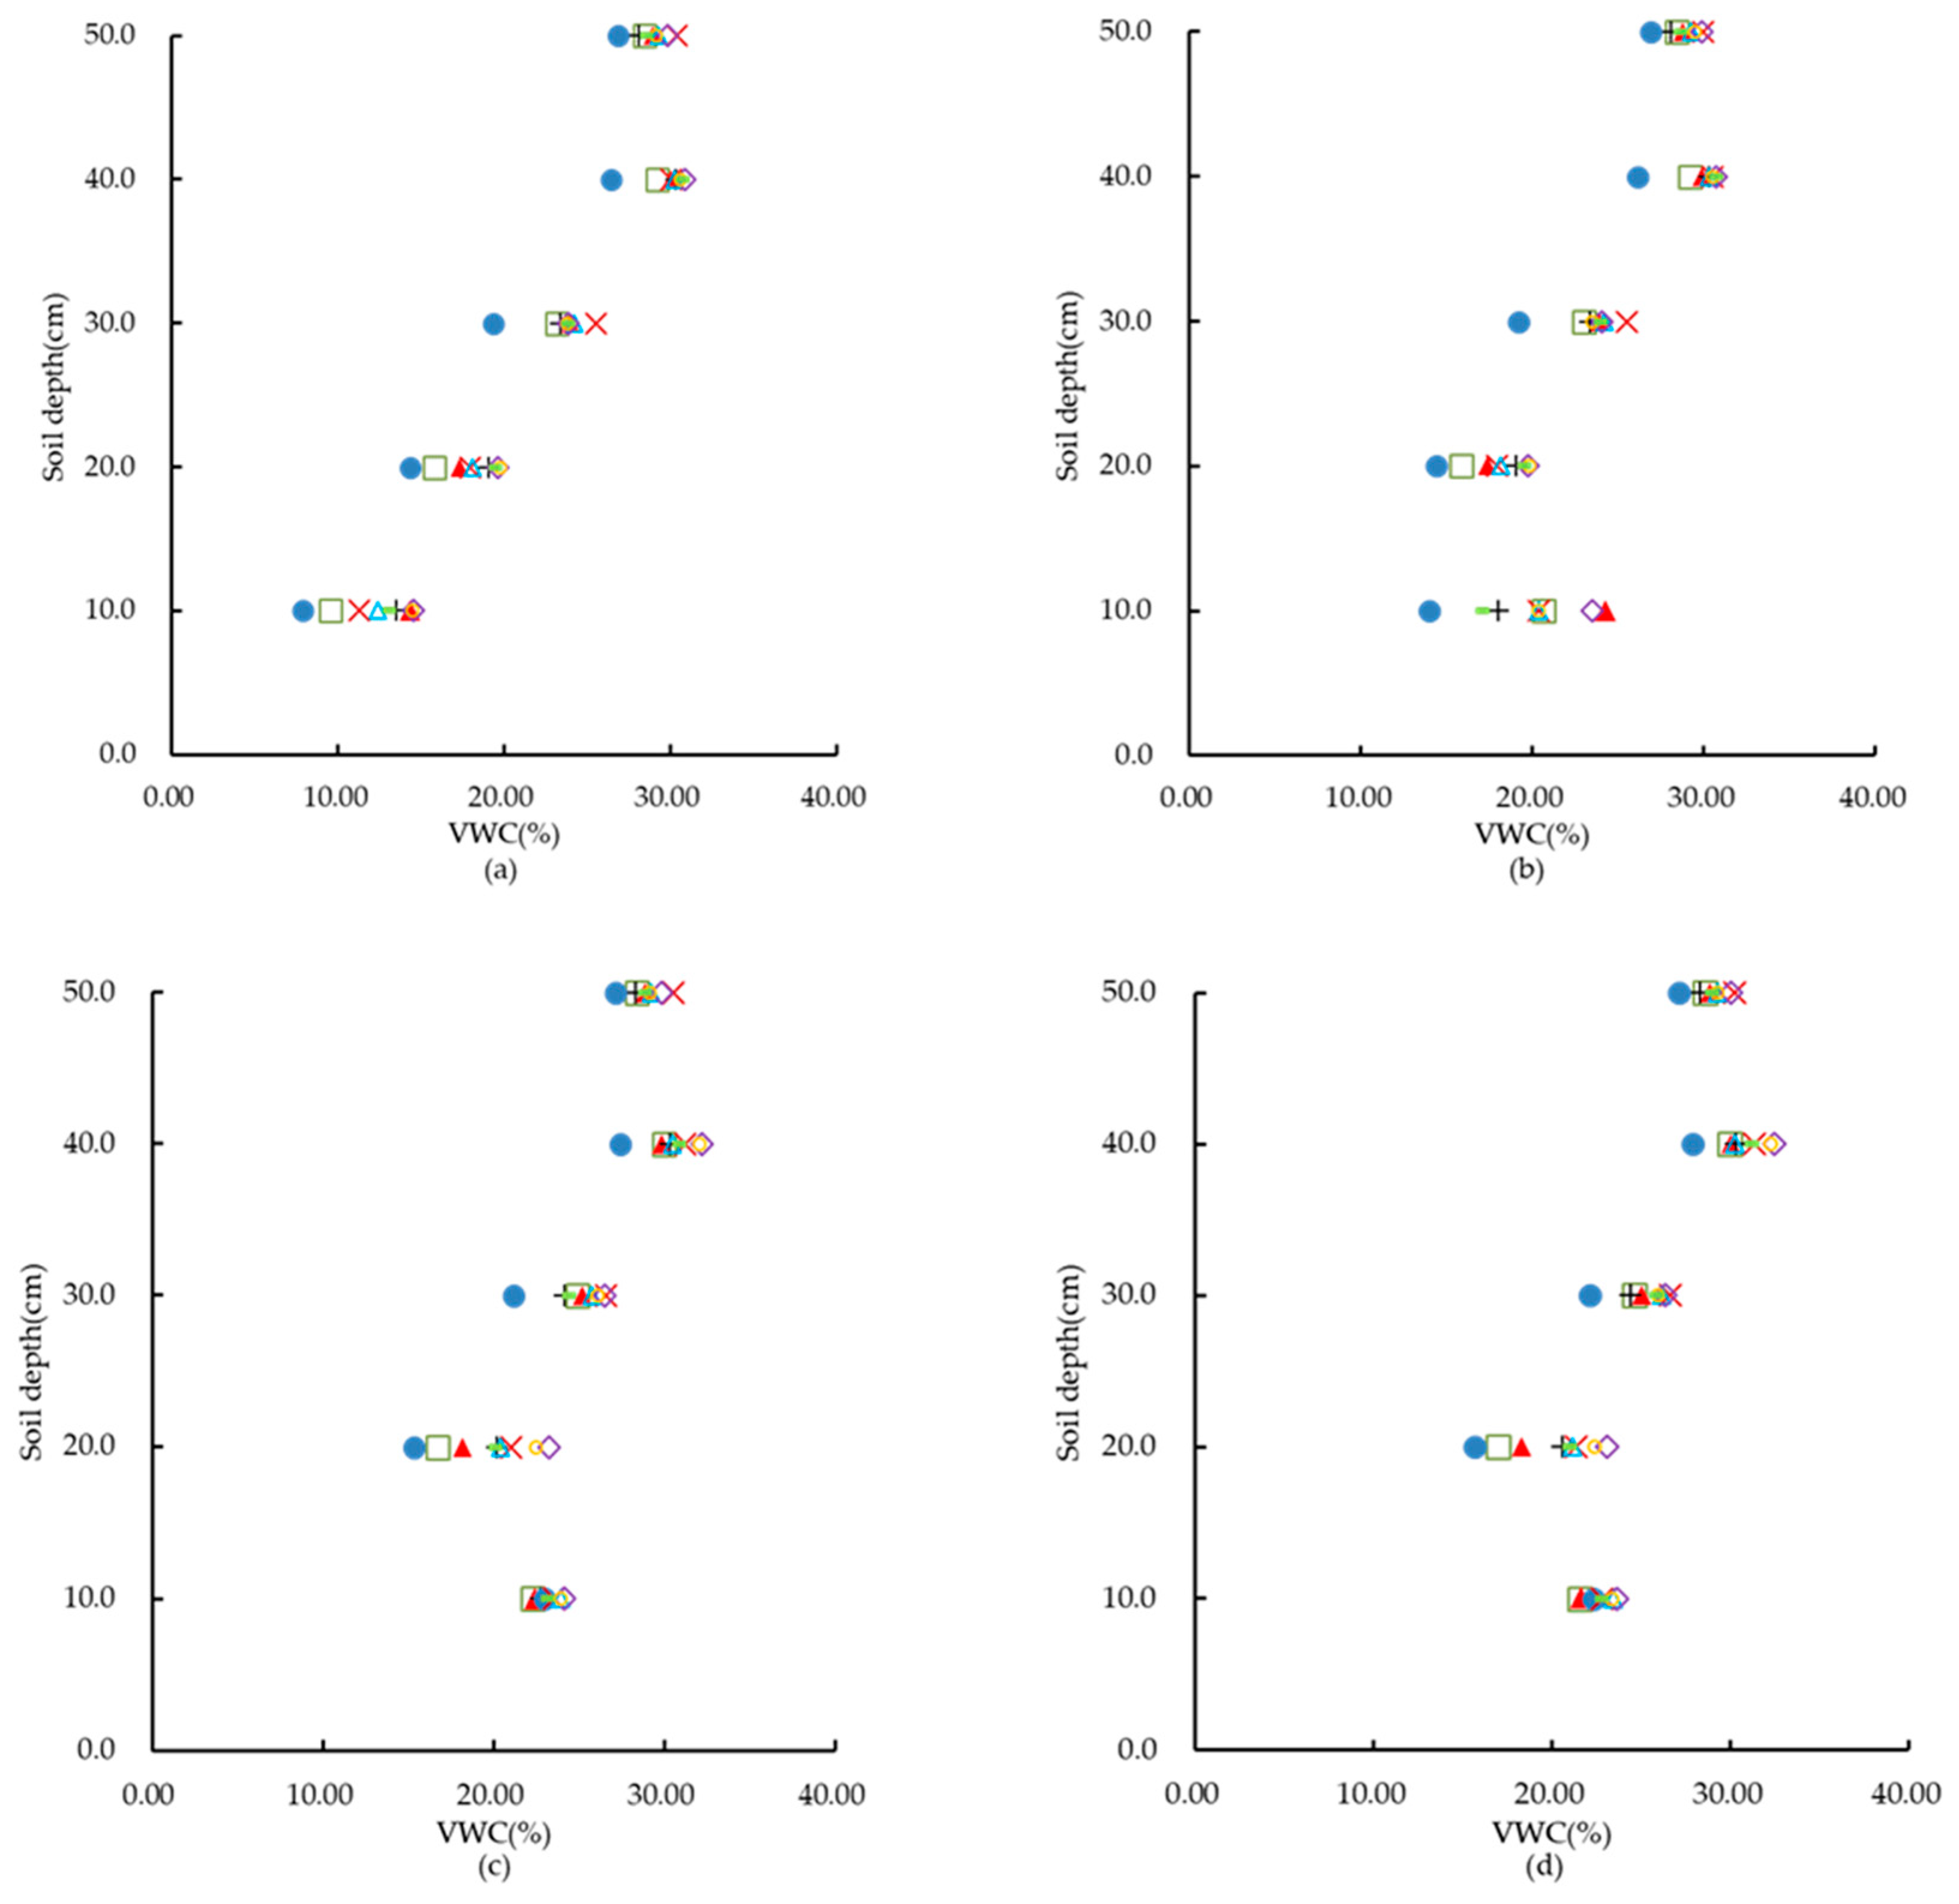
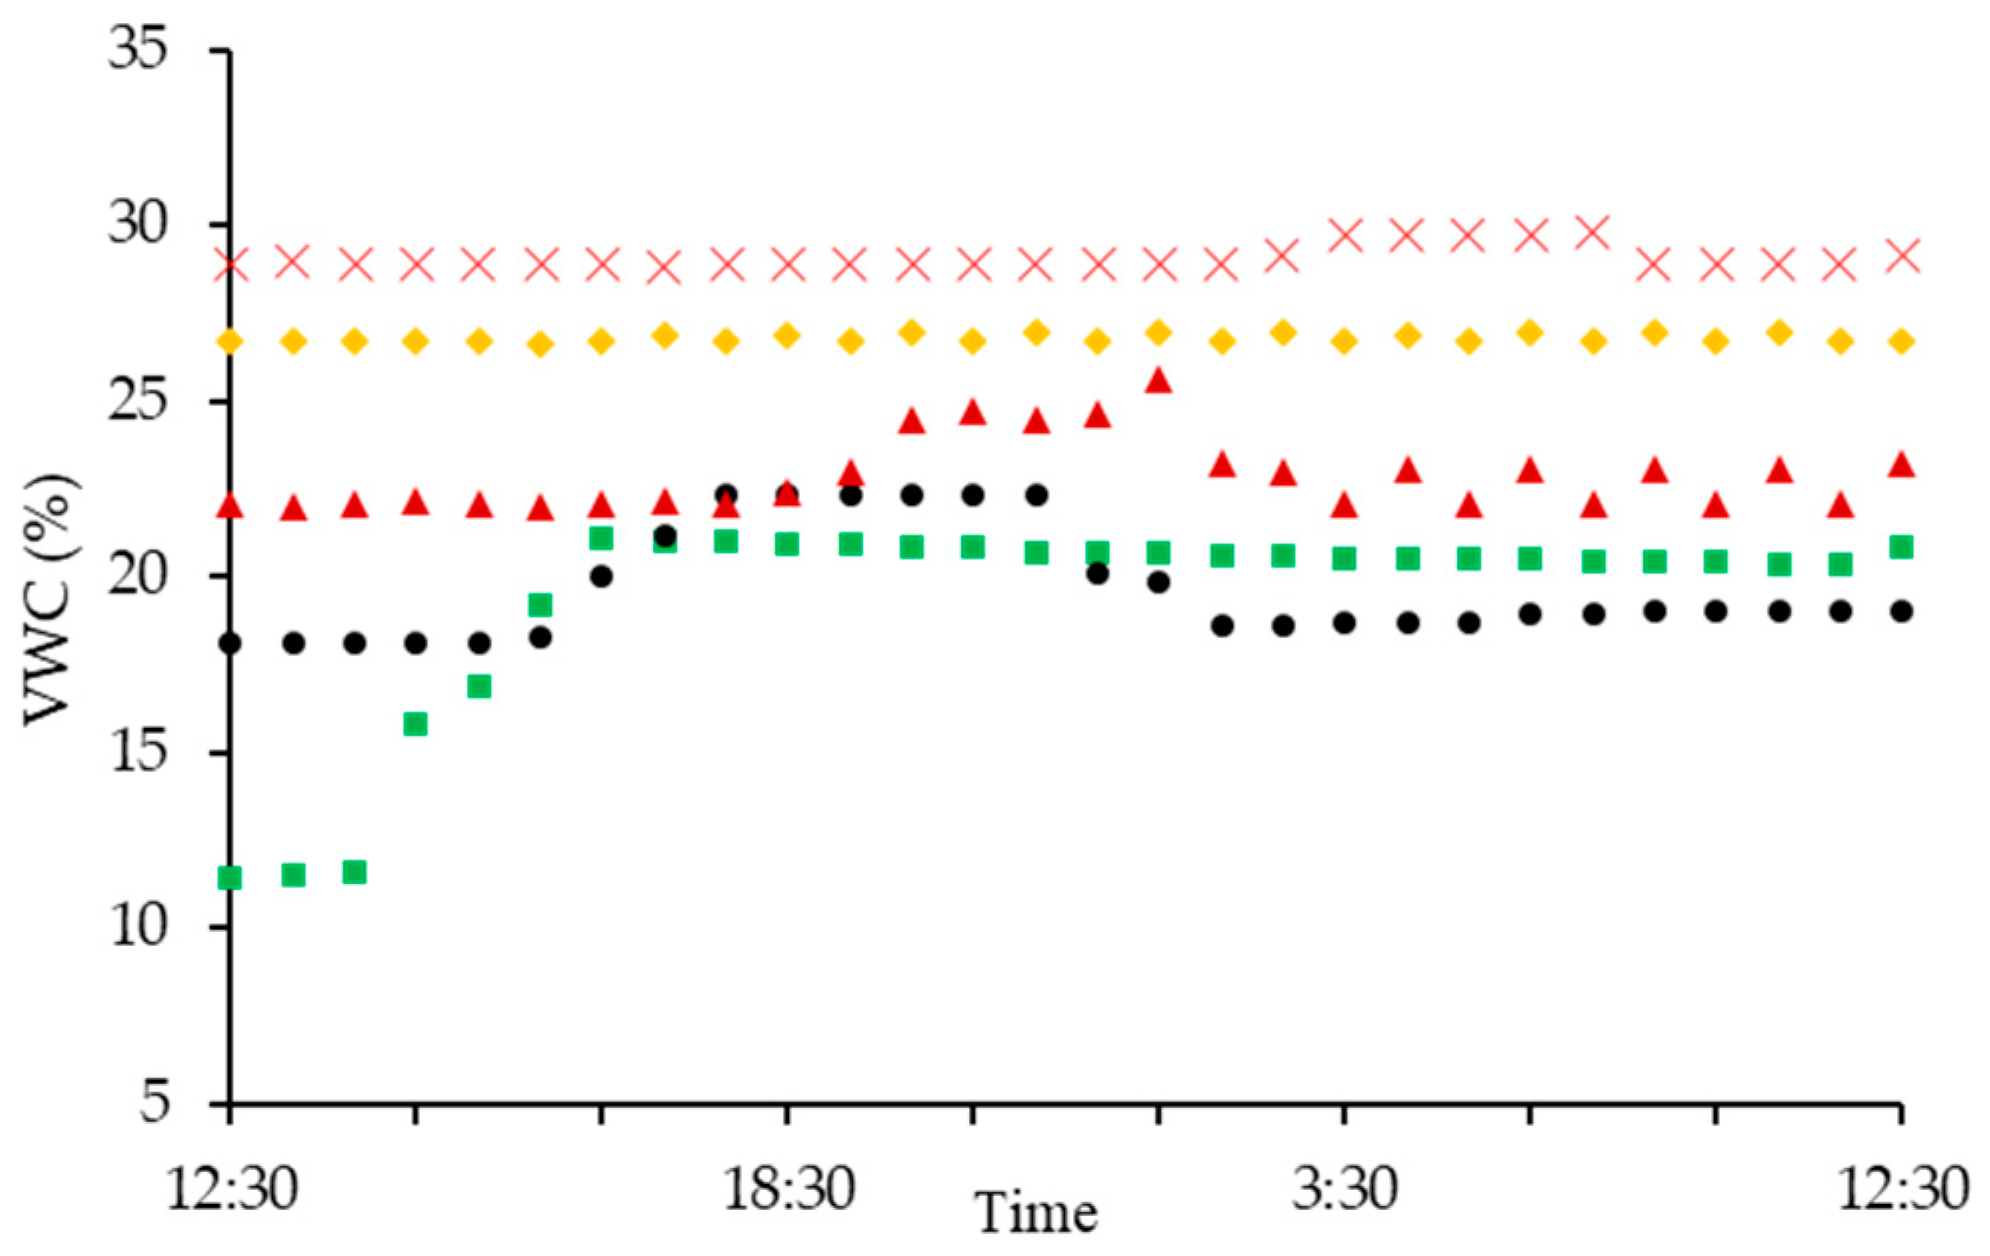
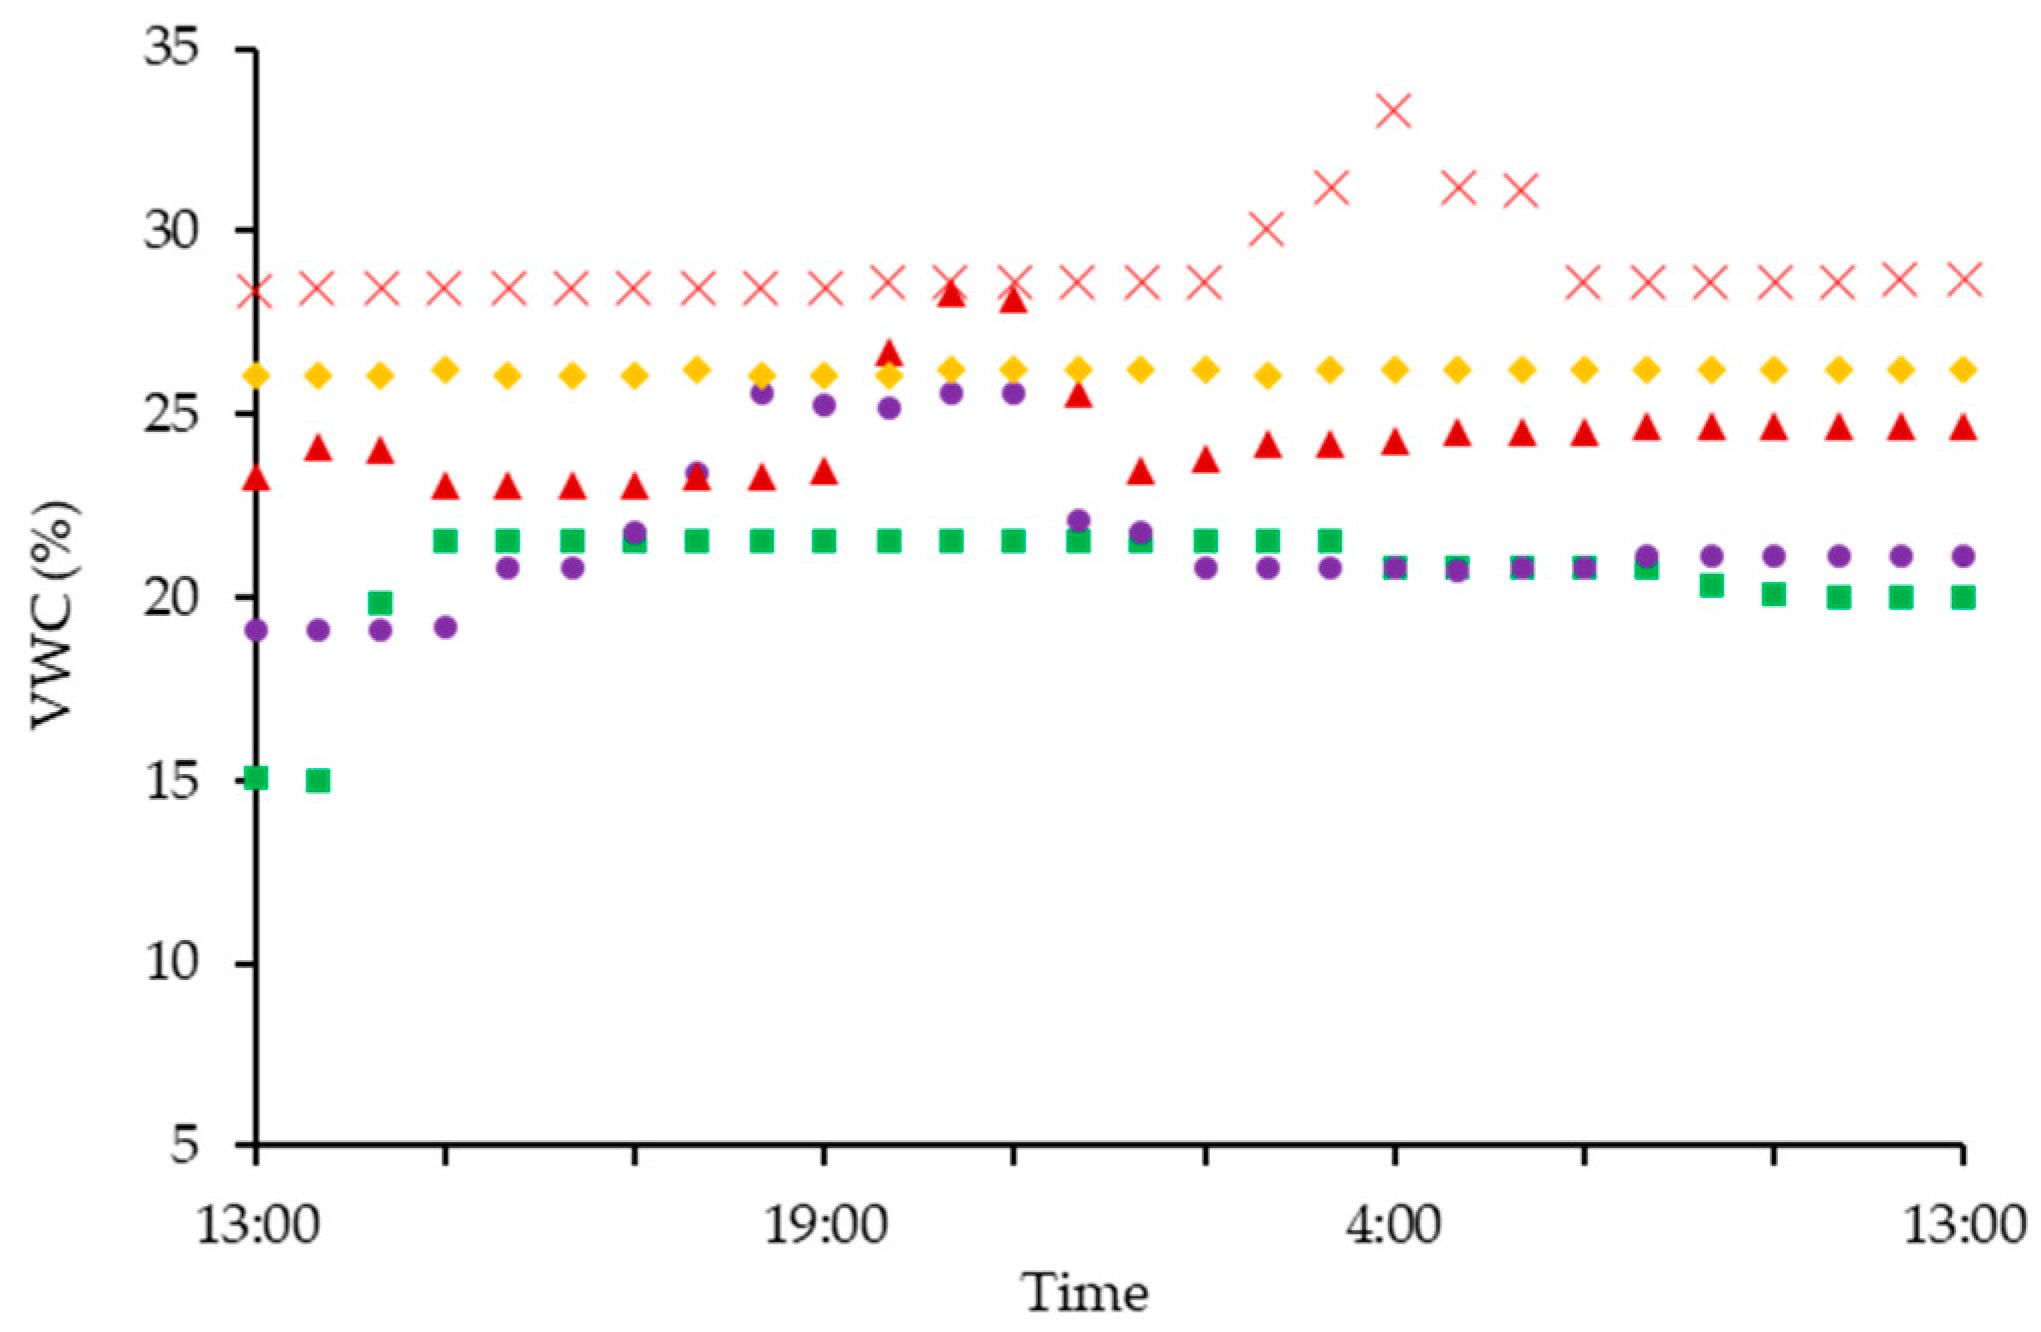
3.1. VWC at Different Slope Gradients and Water Application Rates

As the sprinkler irrigation stopped, under the action of gravity potential and matric potential, water redistribution began. After 24 h, the VWC no longer increased and showed a downward trend, signifying that the process of water redistribution stopped (Figure 4).
Compared with the VWC before irrigation, VWC at 20.0 cm increased at the time of stopping irrigation, and the increment of VWC at 10 cm under different treatments was different. When the slope gradient was 0°, the increments of VWC at 10.0 cm were 11.1%, 10.0%, and 4.5%, respectively. When the slope was 5°, the increments were 6.1%, 9.1%, and 8.0%, respectively. When the slope was 15°, the increments were 9.0%, 5.9%, and 4.0%, respectively (Figure 4b).
Twelve hours after irrigation, soil water at the soil layer depth of 0–20.0 cm started to redistribute (Figure 4c). Compared with VWC at the time of stopping irrigation, VWC at 10.0 cm decreased by 1.1% for the T2 treatment. For the other eight treatments, the VWC at 10.0 cm increased by 2.3%, 5.0%, 9.7%, 4.1%, 4.3%, 1.3%, 4.3%, and 6.5%, respectively. VWC at 20.0 cm increased for all nine treatments, whereas VWC at 30 cm, 40 cm, and 50 cm showed no change.
Infiltration depth showed an increasing trend under the processing of water redistribution (Figure 4d). Compared with VWC at 12 h after the irrigation, VWC at 10.0 cm showed decreasing trends for all nine treatments, while VWC at 20.0 cm continued increasing. This was probably because the amount of water drawn from the upper soil at 10.0 cm was less than the water absorbed by the lower soil layer, which resulted in a continuous decrease in VWC at 10.0 cm and a sustained increase in VWC below 20.0 cm.

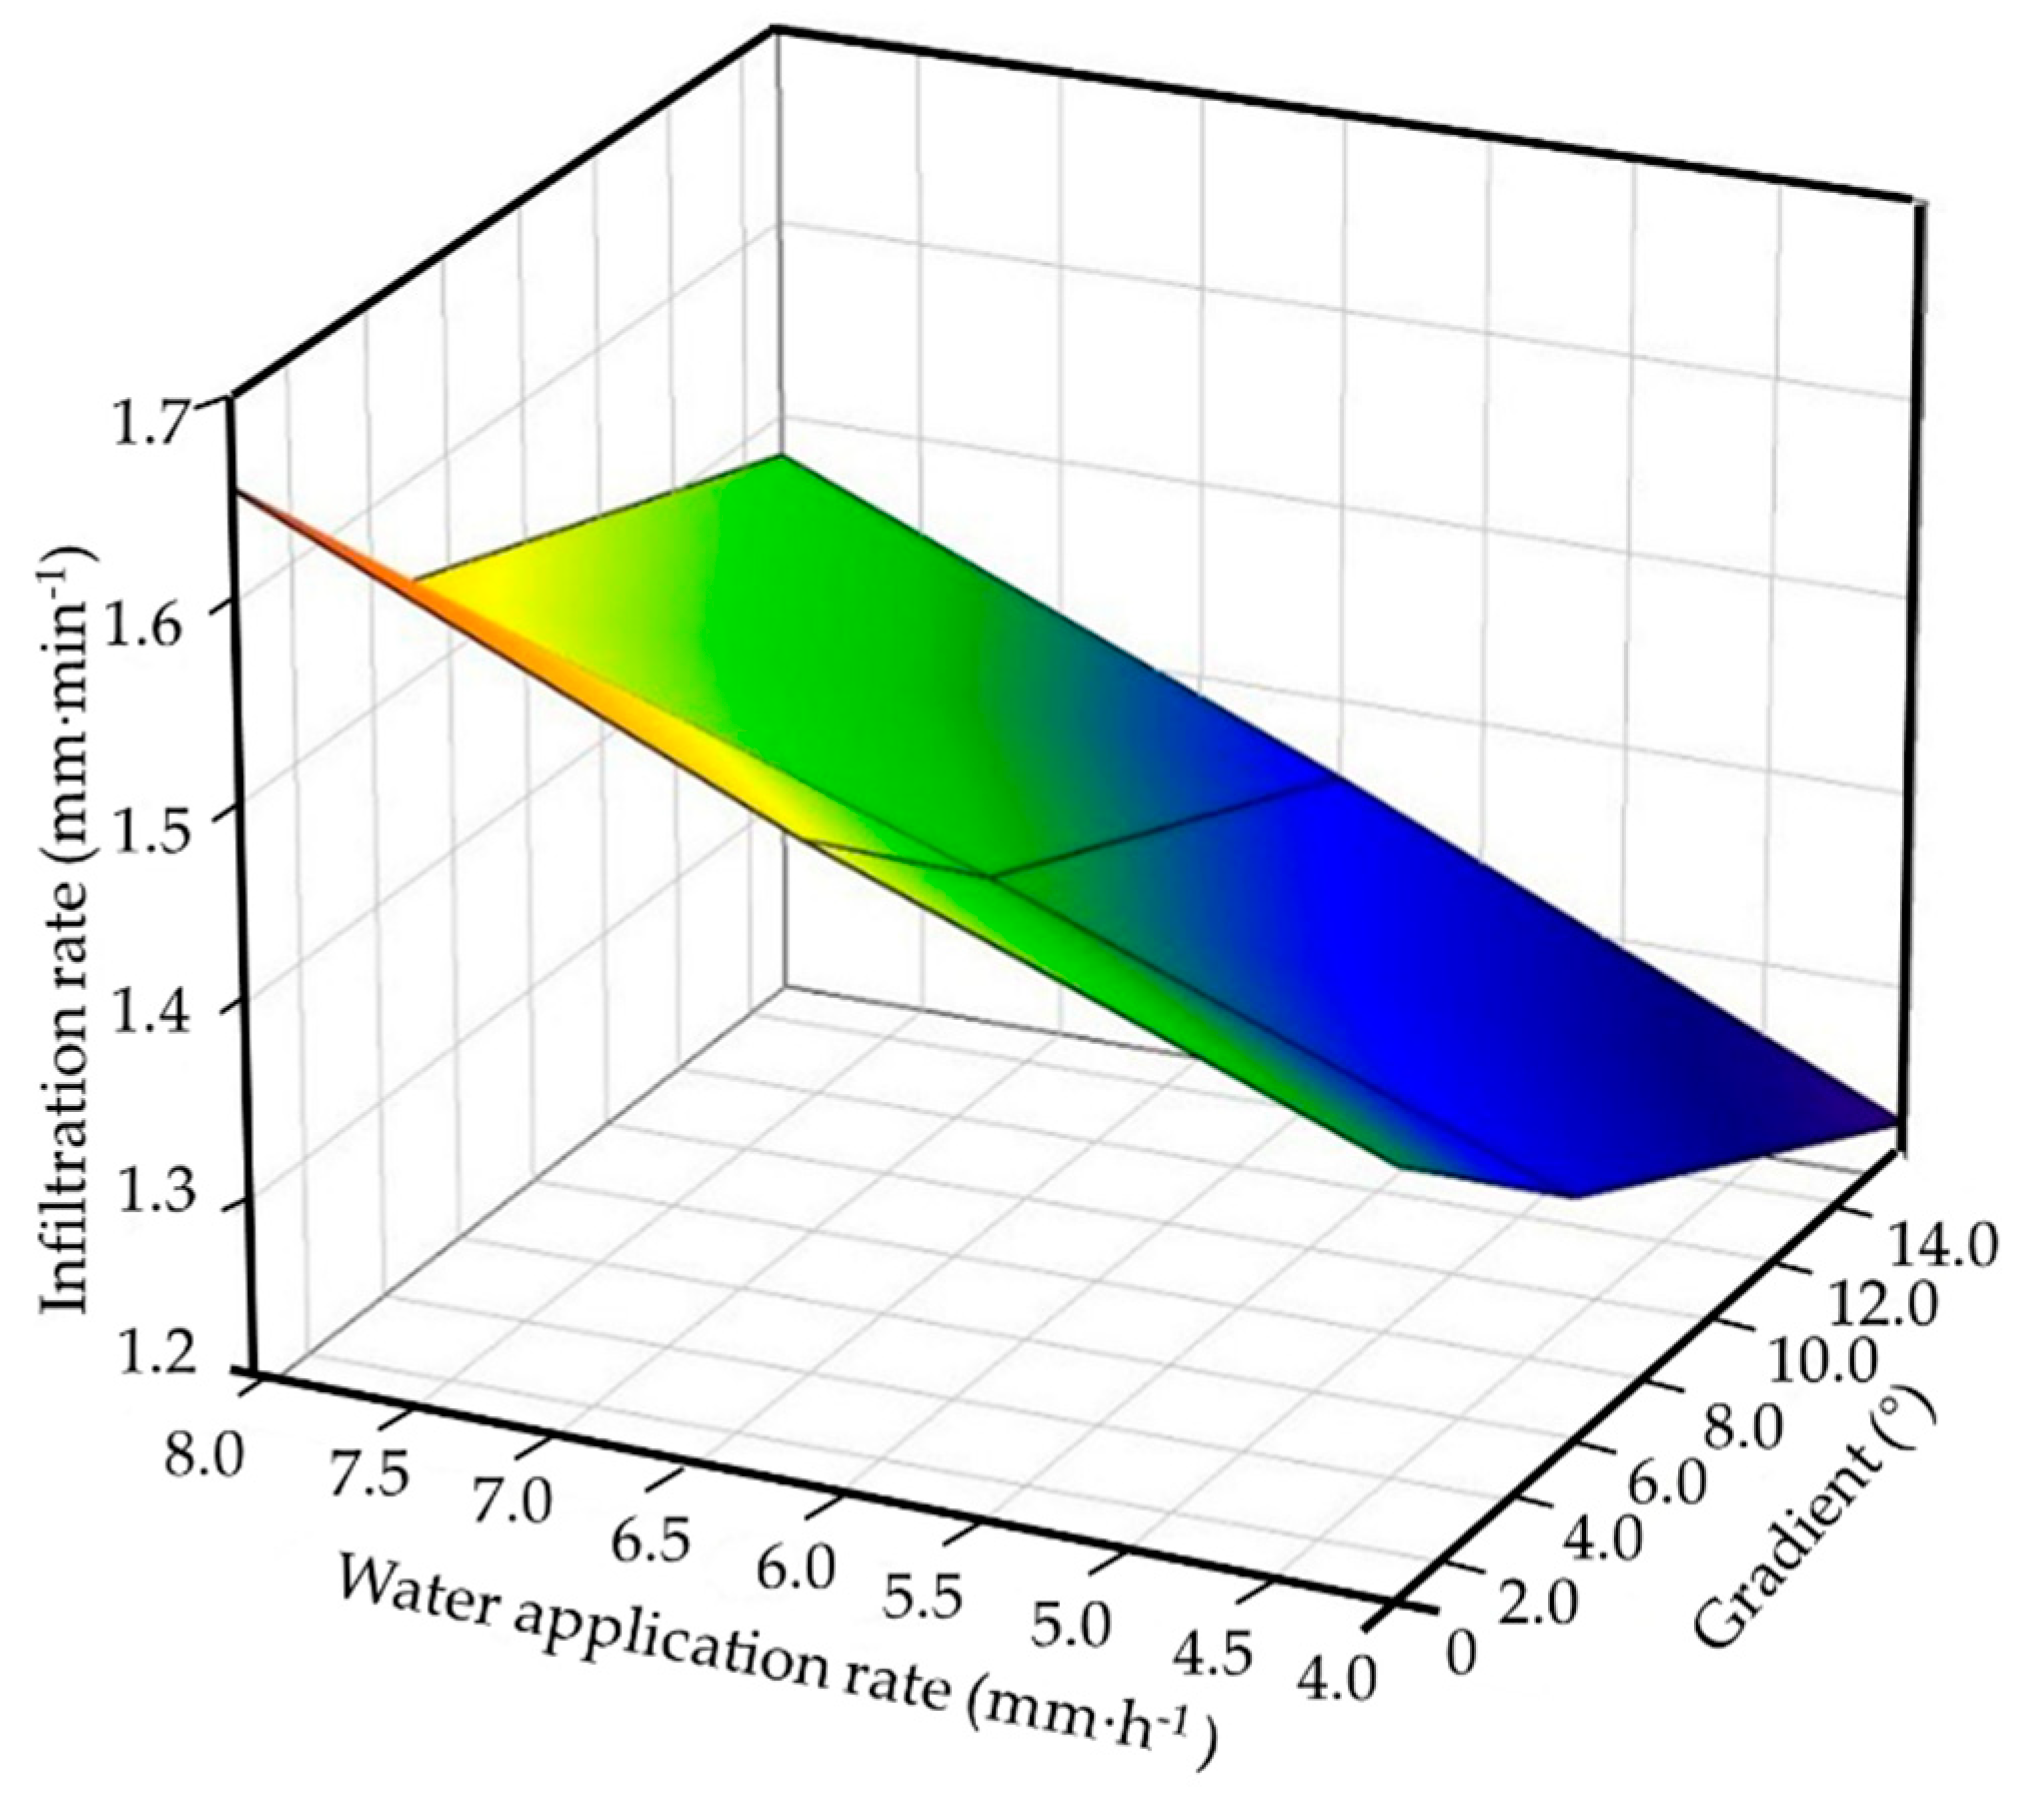
3.2. Effect of Water Application Rate and Slope Gradient on the Infiltration Depth and Rate

When the water application rate was constant, the infiltration depth increased as the slope gradient increased (Figure 5). This is because the pressure of the water perpendicular to the direction of the slope decreased, which increased the infiltration depth (Table 4).
Through the multivariate regression analysis, it could be concluded that the relationship between slope gradient, water application rate, and the ratio of stopping irrigation depth to infiltration depth was as follows:
Y 1 = 0.004 X 1 + 0.024 X 2 + 0.401 ,
where Y1 is the ratio of stopping irrigation depth to infiltration depth (mm), X1 is the slope gradient (°), and X2 is the water application rate (mm·h−1). The R2 was 0.83 and the RMSE was 0.02 mm.
Using multivariate regression analysis, the linear regression equations for infiltration rate, slope gradient, and water application rate were obtained. The R2 was 0.92 and the RMSE was 0.02 mm·h−1. The linear regression equations were as follows:
Y 2 = 0.012 X 1 + 0.058 X 2 + 1.181 ,
L 1 = L × ( 0.04 X 1 + 0.24 X 2 + 4.01 ) ,
T = L 1 Y 2 = ( 0.04 X 1 + 0.24 X 2 + 4.01 ) L 0.012 X 1 + 0.058 X 2 + 1.181 ,
where Y2 is the infiltration rate (mm·min−1), L1 is the required infiltration depth (cm), L is the root depth of the tested tea plant (cm), and T is the required sprinkler irrigation time (min).

3.3. The Reliability of Infiltration Model Testing

The average root length of the tested tea plants was 40.0 cm. When the slope gradient was 0° and the water application rate was 8.0 mm·h−1, the required irrigation time was 144 min. The expected stopping irrigation depth and observed infiltration depth were 23.7 cm and 40.0 cm, respectively.
Before irrigation, the VWC of each layer was 11.4%, 18.1%, 22.1%, 28.9%, and 26.7%, respectively (Figure 6). After 63 min of irrigation, the VWC at 10 cm was 11.6%; then, it increased gradually. Additionally, 125 min after irrigation, the VWC for the 10-cm and 20-cm soil layers was 15.8%, 18.1%, respectively, after which it increased gradually. The system stopped after 144 min of irrigation. At this time, the VWC of each soil layer was 19.2%, 18.3%, 22.0%, 28.9%, and 26.6%, and the infiltration depth was 23.2 cm. Then, 24 h after irrigation, the water infiltration stopped. The VWC of each layer was 20.8%, 19.0%, 23.2%, 29.1%, and 26.7%, and the infiltration depth measured was 38.75 cm. Compared with the required irrigation time and infiltration depth, the measured infiltration depth was 23.2 cm, giving an error between the measured and required value of 2.0%. The measured ultimate infiltration depth was 38.8 cm, giving an error between the measured and expected value of 3.1%.
When the slope gradient was 8° and the water application rate was 4.0 mm·h−1, the required irrigation time was 141 mins, and the expected infiltration depth and observed infiltration depth were 18.6 cm and 40.0 cm respectively. Before irrigation, the VWC of each layer was 15.0%, 19.1%, 23.1%, 28.5%, and 26.1%, respectively (Figure 7). After 141 min of irrigation, the sprinkler system stopped. The VWC of each layer was 21.5%, 19.2%, 23.1%, 28.5%, and 26.2%, respectively, and the infiltration depth was 18.7 cm. Then, 24 h after irrigation, the water infiltration stopped. The VWC of each layer was 20.0%, 21.1%, 24.7%, 28.7%, and 26.2%, and the ultimate infiltration depth measured was 41.1 cm. The measured infiltration depth was 18.9 cm, and the relative error between the measured and expected value was 1.4%. The measured ultimate infiltration depth was 41.1 cm, and the relative error between the measured and expected value was 2.7%.

4. Discussion

With the increase in slope gradient, the required water application rate decreased (Figure 4). When the water application rate was close to the required water application rate, the soil pores were gradually filled with water. This reduced the infiltration capacity and led to a decrease in the increment of VWC.
For a constant water application rate, the infiltration rate decreased as the slope gradient increased. This is because a larger water application rate caused a larger kinetic energy of the sprayed water droplets [39]. Therefore, as the infiltration rate and water application rate increased, the water pressure of the soil surface and soil layers all increased over time. As the kinetic energy of water droplets increased, more pressure was applied on the infiltration water, which resulted in an acceleration of the infiltration rate. The infiltration rate also showed a decreasing trend with the increase in water application rate. The reason was that the component force of the same thickness of the aquifer along the slope direction increased with an increase in slope, and the pressure perpendicular to the slope direction was reduced. Therefore, the pressure of infiltration water reduced, as did the infiltration rate [20,40,41,42].
At a constant slope gradient, the larger water application rate led to a lower infiltration depth. This was caused by the water application rate being lower than its own infiltration capacity, resulting in the water continuing to infiltrate over time [41]. With the increase in water application rate, the kinetic energy of the water droplets sprayed from the nozzle increased correspondingly, resulting in a reduction in infiltration capacity. A lower water application rate extended the irrigation time, but it was conducive to the vertical movement of water, which deepened the infiltration depth.
As we all know, the infiltration characteristic has a strong relationship with the kinetic energy of water drops and the change in physical properties of the soil surface, such as soil type, vegetation type, and terrain [43,44,45]. We know our research is limited; however, the results were obvious in the two selected experiments, where the ultimate infiltration was consistent with the boundary of the tea plant root system. Based on the characteristics of irrigation water infiltration and redistribution, the new infiltration model can be used to determine the required irrigation time for developing a sprinkler irrigation control strategy.

5. Conclusions

The sprinkler irrigation method is widely used for tea plants in the Yangtze River region. The traditional control strategy for sprinkler irrigation is based on the upper limit and lower limit of the required soil moisture. However, this strategy always causes the ultimate infiltration depth to exceed the boundary of the tea plant root system, leading to a waste of water. In this study, a new soil water infiltration model was provided by investigating the characteristics of soil water infiltration and redistribution under different water application rates and gradient slopes.
The infiltration characteristics showed that the infiltration rate changed with the water application rate and slope gradient. Water redistribution processes showed that the increment of VWC at 10.0 cm was different for various combinations of water application rate and slope gradient. Those differences affected the ultimate infiltration depth of the soil. When the slope gradient was kept constant, a lower water application rate led to a longer irrigation time, but it increased the ultimate infiltration depth. When the water application rate was kept constant, the infiltration depth increased with the increase in slope gradient. Based on the new soil water infiltration model, the ultimate infiltration depth was basically consistent with the boundary of the tea plant roots. Therefore, the model established in this paper can be generally applied to automatic sprinkler irrigation systems for tea fields in the Yangtze River region.

Author Contributions

Y.-g.H. conceptualized and designed the experiments. Y.-z.L. and P.-f.L. performed the experiments. Y.-z.L. analyzed the data and wrote the manuscript. K.-T.P.U. and A.M. contributed significant comments to improve the quality and language of the manuscript.

Funding

This research was funded by Jiangsu Agriculture Science and Technology Innovation Fund (CX(16)1045), the Key R&D Programs of Jiangsu Province and Zhenjiang (BE2016354, NY20160120037), the Project of Postgraduate Innovation of Jiangsu Province (KYCX17-1788), the China and Jiangsu Postdoctoral Science Foundation (2016M600376, 1601032C), the Six Talent Peaks Program in Jiangsu Province (2015-ZBZZ-021), the Priority Academic Program Development of Jiangsu Higher Education Institutions (2014-37).

Acknowledgments

The authors are grateful for the financial support from the Jiangsu Agriculture Science and Technology Innovation Fund (CX(16)1045), the Key R&D Programs of Jiangsu Province and Zhenjiang (BE2016354, NY20160120037), the Project of Postgraduate Innovation of Jiangsu Province (KYCX17-1788), the China and Jiangsu Postdoctoral Science Foundation (2016M600376, 1601032C), the Six Talent Peaks Program in Jiangsu Province (2015-ZBZZ-021), the Priority Academic Program Development of Jiangsu Higher Education Institutions (2014-37), and the China Scholarship Council (201708320220).

Conflicts of Interest

The authors declare no conflict of interest.

References

  1. Ding, Y.; Wang, W.; Song, R.; Shao, Q.; Jiao, X.; Xing, W. Modeling spatial and temporal variability of the impact of climate change on rice irrigation water requirements in the middle and lower reaches of the Yangtze River, China. Agric. Water Manag. 2017, 193, 89–101. [Google Scholar] [CrossRef]
  2. Song, S.; Xu, Y.P.; Zhang, J.X.; Li, G.; Wang, Y.F. The long-term water level dynamics during urbanization in plain catchment in Yangtze River Delta. Agric. Water Manag. 2016, 174, 93–102. [Google Scholar] [CrossRef]
  3. Maritim, T.K.; Kamunya, S.M.; Mireji, P.; Mwendia, C.; Muoki, R.C.; Cheruiyot, E.K.; Wachira, F.N. Physiological and biochemical response of tea [Camellia sinensis (L.) O. Kuntze] to water-deficit stress. J. Hortic. Sci. Biotechnol. 2015, 90, 395–400. [Google Scholar] [CrossRef]
  4. Netto, L.A.; Jayaram, K.M.; Puthur, J.T. Clonal variation of tea [Camellia sinensis (L.) O. Kuntze] in countering water deficiency. Physiol. Mol. Biol. Plants Int. J. Funct. Plant Biol. 2010, 16, 359–367. [Google Scholar] [CrossRef] [PubMed]
  5. Chakraborty, U.; Dutta, S.; Chakraborty, B. Drought induced biochemical changes in young tea leaves. Indian J. Plant Physiol. India 2001, 6, 103–106. [Google Scholar]
  6. Kigalu, J.M.; Kimambo, E.I.; Msite, I.; Gembe, M. Drip irrigation of tea (Camellia sinensis L.): 1. Yield and crop water productivity responses to irrigation. Agric. Water Manag. 2008, 95, 1253–1260. [Google Scholar] [CrossRef]
  7. Kumar, R.; Bisen, J.S.; Choubey, M.; Singh, M.; Bera, B. Influence of Changes Weather Conditions on Physiological and Biochemical Characteristics of Darjeeling Tea (Camellia sinensis L.). Glob. J. Biol. Agric. Health. Sci. 2016, 5, 55–60. [Google Scholar]
  8. Lin, S.K.; Lin, J.; Liu, Q.L.; Ai, Y.F.; Ke, Y.Q.; Chen, C.; Zhang, Z.Y.; He, H. Time-course of photosynthesis and non-structural carbon compounds in the leaves of tea plants (Camellia sinensis L.) in response to deficit irrigation. Agric. Water Manag. 2014, 144, 98–106. [Google Scholar] [CrossRef]
  9. Saretta, E.; de Camargo, A.P.; Botrel, T.A.; Frizzone, J.A.; Koech, R.; Molle, B. Test methods for characterising the water distribution from irrigation sprinklers: Design, evaluation and uncertainty analysis of an automated system. Biosyst. Eng. 2018, 169, 42–56. [Google Scholar] [CrossRef]
  10. Ratliff, L.F.; Ritchie, J.T.; Cassel, D.K. Field-Measured Limits of Soil Water Availability as Related to Laboratory-Measured Properties 1. Soil Sci. Soc. Am. J. 1983, 47, 770–775. [Google Scholar] [CrossRef]
  11. Thompson, R.B.; Gallardo, M.; Valdez, L.C.; Fernández, M.D. Using plant water status to define threshold values for irrigation management of vegetable crops using soil moisture sensors. Agric. Water Manag. 2007, 88, 147–158. [Google Scholar] [CrossRef]
  12. Wei, Y.; Wang, Z.; Wang, T.; Liu, K. Design of real time soil moisture monitoring and precision irrigation systems. Trans. Chin. Soc. Agric. Eng. 2013, 29, 80–86. [Google Scholar]
  13. Liu, Y.-Y.; Wang, A.-Y.; An, Y.-N.; Lian, P.-Y.; Wu, D.-D.; Zhu, J.-J.; Meinzer, F.C.; Hao, G.-Y. Hydraulics play an important role in causing low growth rate and dieback of aging Pinus sylvestris var. mongolica trees in plantations of Northeast China. Plant Cell Environ. 2018, 41, 1500–1511. [Google Scholar] [CrossRef] [PubMed]
  14. Vaz, C.M.P.; Jones, S.; Meding, M.; Tuller, M. Evaluation of Standard Calibration Functions for Eight Electromagnetic Soil Moisture Sensors. Vadose Zone J. 2013, 12. [Google Scholar] [CrossRef]
  15. Al-Ghobari, H.M.; El-Marazky, M.S.; Dewidar, A.Z.; Mattar, M.A. Prediction of wind drift and evaporation losses from sprinkler irrigation using neural network and multiple regression techniques. Agric. Water Manag. 2018, 195, 211–221. [Google Scholar] [CrossRef]
  16. AL-Kayssi, A.W.; Mustafa, S.H. Modeling gypsifereous soil infiltration rate under different sprinkler application rates and successive irrigation events. Agric. Water Manag. 2016, 163, 66–74. [Google Scholar] [CrossRef]
  17. Diamond, J.; Shanley, T. Infiltration rate assessment of some major soils. Ir. Geogr. 2003, 36, 32–46. [Google Scholar] [CrossRef] [Green Version]
  18. Fu, B.; Wang, Y.; Zhu, B.; Wang, D.; Wang, X.; Wang, Y.; Ren, Y. Experimental study on rainfall infiltration in sloping farmland of purple soil. Trans. Chin. Soc. Agric. Eng. 2008, 2008. [Google Scholar] [CrossRef]
  19. Liu, Z.; Li, P.; Hu, Y.; Wang, J. Wetting patterns and water distributions in cultivation media under drip irrigation. Comput. Electron. Agric. 2015, 112, 200–208. [Google Scholar] [CrossRef]
  20. Mu, W.; Yu, F.; Li, C.; Xie, Y.; Tian, J.; Liu, J.; Zhao, N.; Mu, W.; Yu, F.; Li, C.; et al. Effects of Rainfall Intensity and Slope Gradient on Runoff and Soil Moisture Content on Different Growing Stages of Spring Maize. Water 2015, 7, 2990–3008. [Google Scholar] [CrossRef] [Green Version]
  21. Zakwan, M.; Muzzammil, M.; Alam, J. Application of spreadsheet to estimate infiltration parameters. Perspect. Sci. 2016, 8, 702–704. [Google Scholar] [CrossRef] [Green Version]
  22. Smith, R.E.; Parlange, J.-Y. A parameter-efficient hydrologic infiltration model. Water Resour. Res. 1978, 14, 533–538. [Google Scholar] [CrossRef]
  23. Parhi, P.K.; Mishra, S.K.; Singh, R. A Modification to Kostiakov and Modified Kostiakov Infiltration Models. Water Resour. Manag. 2007, 21, 1973–1989. [Google Scholar] [CrossRef]
  24. Mazloom, H.; Foladmand, H. Evaluation and determination of the coefficients of infiltration models in Marvdasht region, Fars province. Int. J. Adv. Biol. Biomed. Res. 2013, 1, 822–829. [Google Scholar]
  25. Wilson, R.L. Comparing Infiltration Models to Estimate Infiltration Potential at Henry V Events. Bachelor’s Thesis, Portland State University, Portland, OR, USA, 2017. [Google Scholar]
  26. Feng, H.; Deng, L.S.; Zhang, C.L.; Guo, Y.B. Effect of Ground Slope on Water Infiltration of Drip Irrigation. J. Irrig. Drain. 2010, 29, 14–15. [Google Scholar]
  27. Pengfei, L.; Yongguang, H.; Feng, J.; Sheng, W. Influence of sloping tea fields on soil moisture migration. IFAC Pap. 2018, 51, 565–569. [Google Scholar] [CrossRef]
  28. Zhao, P.; Shao, M.; Melegy, A.A. Soil Water Distribution and Movement in Layered Soils of a Dam Farmland. Water Resour. Manag. 2010, 24, 3871–3883. [Google Scholar] [CrossRef]
  29. Jha, S.K.; Gao, Y.; Liu, H.; Huang, Z.; Wang, G.; Liang, Y.; Duan, A. Root development and water uptake in winter wheat under different irrigation methods and scheduling for North China. Agric. Water Manag. 2017, 182, 139–150. [Google Scholar] [CrossRef]
  30. Yan, Y.; Dai, Q.; Yuan, Y.; Peng, X.; Zhao, L.; Yang, J. Effects of rainfall intensity on runoff and sediment yields on bare slopes in a karst area, SW China. Geoderma 2018, 330, 30–40. [Google Scholar] [CrossRef]
  31. Wang, Y.; Zhang, X.; Chen, J.; Chen, A.; Wang, L.; Guo, X.; Niu, Y.; Liu, S.; Mi, G.; Gao, Q. Reducing basal nitrogen rate to improve maize seedling growth, water and nitrogen use efficiencies under drought stress by optimizing root morphology and distribution. Agric. Water Manag. 2019, 212, 328–337. [Google Scholar] [CrossRef]
  32. Wang, X.; Zhou, Y.; Wang, Y.; Wei, X.; Guo, X.; Zhu, D. Soil water characteristic of a dense jujube plantation in the semi-arid hilly Regions of the Loess Plateau in China. J. Hydraul. Eng. 2015, 46, 263–270. [Google Scholar]
  33. Li, N.; Kang, Y.; Li, X.; Wan, S.; Xu, J. Effect of the micro-sprinkler irrigation method with treated effluent on soil physical and chemical properties in sea reclamation land. Agric. Water Manag. 2019, 213, 222–230. [Google Scholar] [CrossRef]
  34. Li, Z.; Xu, X.; Pan, G.; Smith, P.; Cheng, K. Irrigation regime affected SOC content rather than plow layer thickness of rice paddies: A county level survey from a river basin in lower Yangtze valley, China. Agric. Water Manag. 2016, 172, 31–39. [Google Scholar] [CrossRef]
  35. Zhang, F.; Niu, X.; Zhang, Y.; Xie, R.; Liu, X.; Li, S.; Gao, S. Studies on the Root Characteristics of Maize Varieties of Different Eras. J. Integr. Agric. 2013, 12, 426–435. [Google Scholar] [CrossRef]
  36. Liu, X.; Wang, Y.; Ma, L.; Liang, Y. Relationship between Deep Soil Water Vertical Variation and Root Distribution in Dense Jujube Plantation. Trans. Chin. Soc. Agric. Mach. 2013, 44, 90–97. [Google Scholar]
  37. Chu, R.; Li, M.; Shen, S.; Islam, A.R.M.d.T.; Cao, W.; Tao, S.; Gao, P. Changes in Reference Evapotranspiration and Its Contributing Factors in Jiangsu, a Major Economic and Agricultural Province of Eastern China. Water 2017, 9, 486. [Google Scholar] [CrossRef]
  38. FAO. World Reference Base for Soil Resources 2014: International Soil Classification System for Naming Soils and Creating Legends for Soil Maps; FAO: Rome, Italy, 2014. [Google Scholar]
  39. Cui, S.F.; Pan, Y.H.; Wu, Q.Y.; Zhang, Z.H.; Zhang, B.X. Simulation of Runoff for Varying Mulch Coverage on a Sloped Surface. Appl. Mech. Mater. 2013, 409, 339–343. [Google Scholar] [CrossRef]
  40. Marshall, S.J. Hydrology. In Reference Module in Earth Systems and Environmental Sciences; Elsevier: Amsterdam, The Netherlands, 2013. [Google Scholar]
  41. Ge, S.; Gorelick, S.M. Hydrology, Floods and Droughts|Groundwater and Surface Water. In Encyclopedia of Atmospheric Sciences; Elsevier: Amsterdam, The Netherlands, 2015. [Google Scholar]
  42. Lehrsch, G.A.; Kincaid, D.C. Sprinkler Irrigation Effects on Infiltration and Near-Surface Unsaturated Hydraulic Conductivity. Trans. ASABE 2010, 53, 397–404. [Google Scholar] [CrossRef]
  43. Thompson, A.L.; James, L.G. Water droplet impact and its effect on infiltration. Trans. Am. Soc. Agric. Eng. 1985, 28, 1506–1510. [Google Scholar] [CrossRef]
  44. Zhu, X.; Yuan, S.; Liu, J. Effect of Sprinkler Head Geometrical Parameters on Hydraulic Performance of Fluidic Sprinkler. J. Irrig. Drain. Eng. 2012, 138, 1019–1026. [Google Scholar] [CrossRef]
  45. Mohammed, D.; Kohl, R.A. Infiltration response to kinetic energy. Trans. Am. Soc. Agric. Eng. 1987, 30, 108–111. [Google Scholar] [CrossRef]
Figure 1. Box frame sprinkler irrigation system: 1—pump station; 2—main pipe; 3—distribution pipe; 4—lateral pipe; 5—standpipe; 6—box frame; 7—sprinkler.
Agriculture 09 00206 g001
Figure 2. Tea plant distribution in the box frame.
Agriculture 09 00206 g002
Figure 3. Sensor layout. TRIME PICO 64 soil moisture sensors were arranged along the roots of tea plants. Numbers 1–5 represent the sensors located at depths of 10.0 cm, 20.0 cm, 30.0 cm, 40.0 cm, and 50.0 cm, respectively. X1 represents the slope gradient, which could be adjusted from 0–15°.
Agriculture 09 00206 g003
Figure 4. Volumetric water content (VWC) before irrigation, at the time of stopping irrigation, and 12 h and 24 h after sprinkler irrigation with different treatments, T1(), T2(), T3(+), T4(), T5(×), T6(), T7(), T8(), and T9(): (a) before irrigation; (b) at the time of stopping irrigation; (c) 12 h after irrigation; (d) 24 h after irrigation.
Agriculture 09 00206 g004
Figure 5. Infiltration rate under various water application rates and slope gradients.
Agriculture 09 00206 g005
Figure 6. VWC at the slope gradient of 0° and the water application rate of 8.0 mm∙h−1, with soil depths of 10 cm (), 20 cm () 30 cm (), 40 cm (×), and 50 cm ().
Agriculture 09 00206 g006
Figure 7. VWC at the slope gradient of 8° and the water application rate of 4.0 mm∙h−1, with soil depths of 10 cm (), 20 cm () 30 cm (), 40 cm (×), and 50 cm ().
Agriculture 09 00206 g007
Table 1. Technical parameters of the sprinkler.
No.Operating Pressure (MPa)Nozzle Diameter (mm)Flow Rate (m3·h−1)Pattern Radius (m)Rotation Cycle (s)
10.33.00.47.018.0
20.33.50.67.018.0
30.34.00.87.018.0
Table 2. Physical properties and the particle composition of the soil for experiment. VWC—volumetric water content.
Sampling Depth (cm)Size Composition (%)Bulk Density (g·cm−3)Saturated VWC (%)Soil Texture
<0.002 mm0.002–0.02 mm0.02–2 mm
0–10.0037.662.41.247.0 Sandy loam
10.0–20.0029.370.71.447.0
20.0–30.0039.760.31.449.0
30.0–40.0026.873.21.548.0
40.0–50.04.442.852.81.744.0Loam
50.0–80.08.640.650.81.643.0
Table 3. Sprinkler irrigation schedule.
TreatmentSlope Gradient (°)Water Application Rate (mm·h−1)
T104.0
T206.0
T308.0
T45.04.0
T55.06.0
T65.08.0
T715.04.0
T815.06.0
T915.08.0
Table 4. The ratios of different slope gradients and water application rates.
TreatmentSlope Gradient (°)Water Application Rate (mm·h−1)Infiltration Depth (cm)Ratio of Stopping Irrigation Depth to Infiltration Depth (%)
T104.040.9 48.9
T206.034.957.4
T308.032.5 61.6
T45.04.042.646.9
T55.06.041.3 48.4
T65.08.035.8 55.9
T715.04.043.2 46.3
T815.06.042.5 47.0
T915.08.037.3 53.6

