Article

Acquisition of Sorption and Drying Data with Embedded Devices: Improving Standard Models for High Oleic Sunflower Seeds by Continuous Measurements in Dynamic Systems

Institute of Agricultural Engineering, Universität Hohenheim, Garbenstrasse 9, 70599 Stuttgart, Germany
*
Author to whom correspondence should be addressed.
Agriculture 2019, 9(1), 1; https://doi.org/10.3390/agriculture9010001
Submission received: 7 October 2018 / Revised: 16 December 2018 / Accepted: 18 December 2018 / Published: 20 December 2018
(This article belongs to the Special Issue Sensors Application in Agriculture)

Abstract

:
Innovative methods were used to determine both sorption and drying data at temperatures typically found in the handling of agricultural products. A robust sorption measurement system using multiple microbalances and a high precision through flow laboratory dryer, both with continuous data acquisition, were employed as the basis for a water vapor deficit based approach in modeling the sorption and drying behavior of high oleic sunflower seeds. A coherent set of data for sorption (Temperature T = 25–50 °C, water activity aw = 0.10–0.95) and for drying (T = 30–90 °C, humidity of the drying air x = 0.010–0.020 kg·kg−1) was recorded for freshly harvested material. A generalized single-layer drying model was developed and validated (R2 = 0.99, MAPE = 8.3%). An analytical solution for predicting effective diffusion coefficients was also generated (R2 = 0.976, MAPE of 6.33%). The water vapor pressure deficit-based approach allows for an easy integration of meaningful parameters recorded during drying while maintaining low complexity of the underlying equations in order for embedded microcontrollers with limited processing power to be integrated in current agro-industrial applications.

Graphical Abstract

1. Introduction

Sunflower (Helianthus annuus L.) is one of the major oilseeds produced in the world. It is cultivated in different climatic zones with varying grain moisture content during the harvesting period. Drying is typically required in order to achieve an optimum final moisture content for safe storage. Excessive moisture levels may lead to a generally increased activity of microorganisms, heating of the product, dry matter losses, and high levels of free fatty acids in the extracted oil [1,2]. Several studies point out that only the non-fat components of the seeds are the critical parts for stability considerations in moisture-dependent storage [2,3,4]. Water activity aw holds information on the availability of water for the growth of microorganisms and thus allows inference on threshold levels, above which spoilage is unlikely to occur [5]. It is defined as the partial vapor pressure of water in the measured food, divided by the partial vapor pressure of pure water [6]. This is equal to the equilibrium relative humidity, at which the measured food is in equilibrium with the surrounding atmosphere and does not adsorb nor desorb water. Sorption isotherms describe the relationship between the equilibrium moisture content (MCe), formed at a given temperature and at the relative humidity, if the food is in equilibrium with the atmospheric surroundings. In general, water activity increases at higher moisture content and, consequently, microorganisms, such as molds, yeasts, and bacteria increasingly grow at aw > 0.70, while enzymatic activity is also promoted by high values of aw [5]. The commonly applied threshold value for safe farm level storage of agricultural products is found at water activities between 0.6 ≤ aw ≤ 0.7 [3,4,7].
In practice, vapor pressure manometers, capacitance hygrometers, and chilled mirror dew point hygrometers represent fast and robust techniques for the indirect measurement of water activity from a common set of partially dried samples [8]. However, these sorption techniques can not generate kinetic data. For the gravimetric measurement of moisture sorption, the static gravimetric method is considered a standard technique. Climatic test chambers have been used before. However, the sorption experiments were realized with discontinuous weight measurements on external balances or with balances inside the test chamber [9,10]. To minimize the negative effects associated with the discontinuous weight measurements, instruments using controlled atmosphere microbalances such as a Dynamic Vapor Sorption apparatus (DVS) have been employed for the automated moisture sorption analysis of food ingredients and other homogenous materials [11,12,13,14,15,16,17]. The DVS method is used to measure the equilibrium moisture content of a material at any desired relative humidity and selected temperatures in a short period of time. However, as DVS is designed for extremely small sample mass, bias in sorption measurements may occur when dealing with agricultural products and only a small part of a heterogeneous organ is being measured [7]. Based on the dynamic vapor sorption principle, an innovative experimental system for determining moisture sorption properties of heterogeneous agricultural products is needed. In addition, the system should enable monitoring of moisture sorption by measuring the weight gain or loss at regular time intervals and the automatic acquisition of mass data in more than one high precision ultra-microbalance.
The experimental determination of sorption characteristics allows for the description of moisture diffusivity to be a function of moisture content, partial vapor pressure, and temperature without the requirement to pre-define the mechanisms controlling diffusion [6]. Thus, these isotherms constitute a suitable tool in describing and modeling drying processes for agricultural products. Remarkably, the occurrence of hysteresis between adsorption and desorption is directly affected by the oil content while no significant difference can be observed [4] at values above 48.6%. Most studies on the sorption and drying of sunflower seeds have in common data from different varieties and harvest years, which are combined to provide an empirical basis for model development [3,18,19]. Additionally, seeds are usually remoistened to a desired moisture content, which potentially leads to experimental errors and an alteration of the drying behavior [19]. It is commonly agreed that moisture movement at the surface is negligible, compared to internal resistance, and, thus, the influence of air velocity becomes insignificant after a threshold of approximately 0.1 m∙s−1 [19,20,21]. Sunflower seeds are comparable to multi-domain composite foods, consisting of a fibrous outer shell, and an oily kernel. Both hulls and kernels show significantly different sorption behavior [2]. In addition, whole seeds and kernels are significantly different in most physical properties, such as volume and equivalent diameter [19,22]. Sunflower kernels show significantly slower moisture diffusivity compared to hulls and, thus, are the limiting factor in drying [3,19].
However, a literature research revealed remarkable differences between the seed/hull-ratio of examined traditional oil-seed varieties on which most sorption and drying studies are based. Given these distinct variations in physical properties, it is obvious that sunflower sorption and drying models should be updated and validated for modern high oleic varieties.
The aim of the present work is, therefore, to develop a robust semi-empirical drying model using a coherent set of experimental sorption and drying data for high oleic sunflower seeds (Helianthus annuus L.). The objectives are: (i) to experimentally determine a broad set of equilibrium moisture content data by an automatic, gravimetric analyzer, (ii) to obtain single-layer drying kinetic data in a high precision laboratory dryer at different temperature and absolute humidity of the drying air, and (iii) to establish a generalized single-layer drying model in which its parameters are a function of air conditions. In addition, these related datasets are used to analytically determine moisture effective diffusion coefficients.

2. Materials and Methods

2.1. Plant Material

High oleic sunflower seeds (Helianthus annuus L.), F1 of hybrid cultivar ‘PR65H22’ were harvested mid October 2014 from a farm 30 km east of Würzburg (Germany). The original bulk of approximately 500 kg was reduced to a representative sample of 110 kg. To evaluate the moisture content at harvest (0.317 ± 0.008 kg∙kg−1), 10 samples of 3 g each were used.

2.2. Moisture Content Determination

The moisture content MC of seeds and hulls was measured from samples of 3 g by a standard thermogravimetric analysis in a convection oven at 103 ± 2 °C, according to ISO 665:2000 [23] and expressed in kg water per kg dry matter (kg∙kg−1). All analyses were performed in triplicates, which is commonly applied in other studies [18,22].

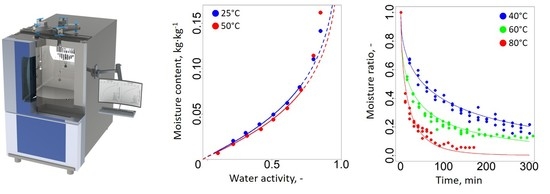
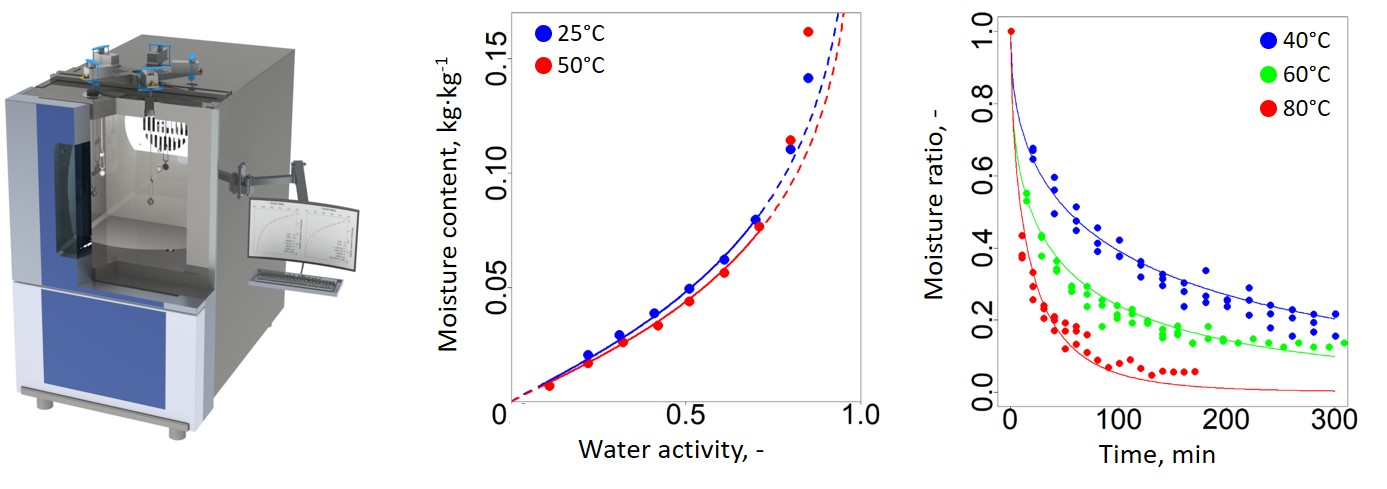
2.3. Determination of Dynamic Vapor Sorption Isotherms

The adsorption isotherms of seeds and hulls were separately determined by using an automated system designed at the Institute of Agricultural Engineering, University of Hohenheim (Stuttgart, Germany) (Figure 1). The system consists of a climatic test chamber (C + 10/600, CTS GmbH, Hechingen, Germany), which regulates air temperature between 10 °C and 95 °C while maintaining a relative humidity between 10% and 98% and ensuring air circulation. A weight measuring system, consisting of five high precision load cells (WZA1203-N, Sartorius AG, Goettingen, Germany) with an accuracy of 1 mg was mounted on top of the chamber to record the change in mass, caused either by adsorption or desorption of water vapor. Each load cell carries a perforated sample holder, which is suspended through the chamber ceiling. Load cell and climate chamber control is realized remotely. Direct control via an attached computer is also possible. Relative humidity is varied gradually at a pre-set temperature, which is held ceteris paribus during an experiment.
The test material was dried at 60 °C to a moisture content of 0.006 ± 0.004 kg∙kg−1 and manually cleaned from impurities. The seeds were ground to a particle size of approximately 5 mm. To obtain hulls, seeds were manually hulled. About 12 g of dried seeds or hulls were used per sorption experiment. The samples were loaded into the sample holder and the adsorption isotherms were measured at 25 °C and 50 °C, which increased the relative humidity gradually from 10% to 85% with increments of 10% and a final step of 5%. Mass, temperature, and humidity data were recorded in 20 min intervals. The equilibrium was considered to have been reached when observing a change in weight of less than 5% of the initial sample weight during 10 consecutive measurements. Three repetitions per temperature and material were performed, which resulted in a total of 160 individually determined equilibrium moisture content data points.

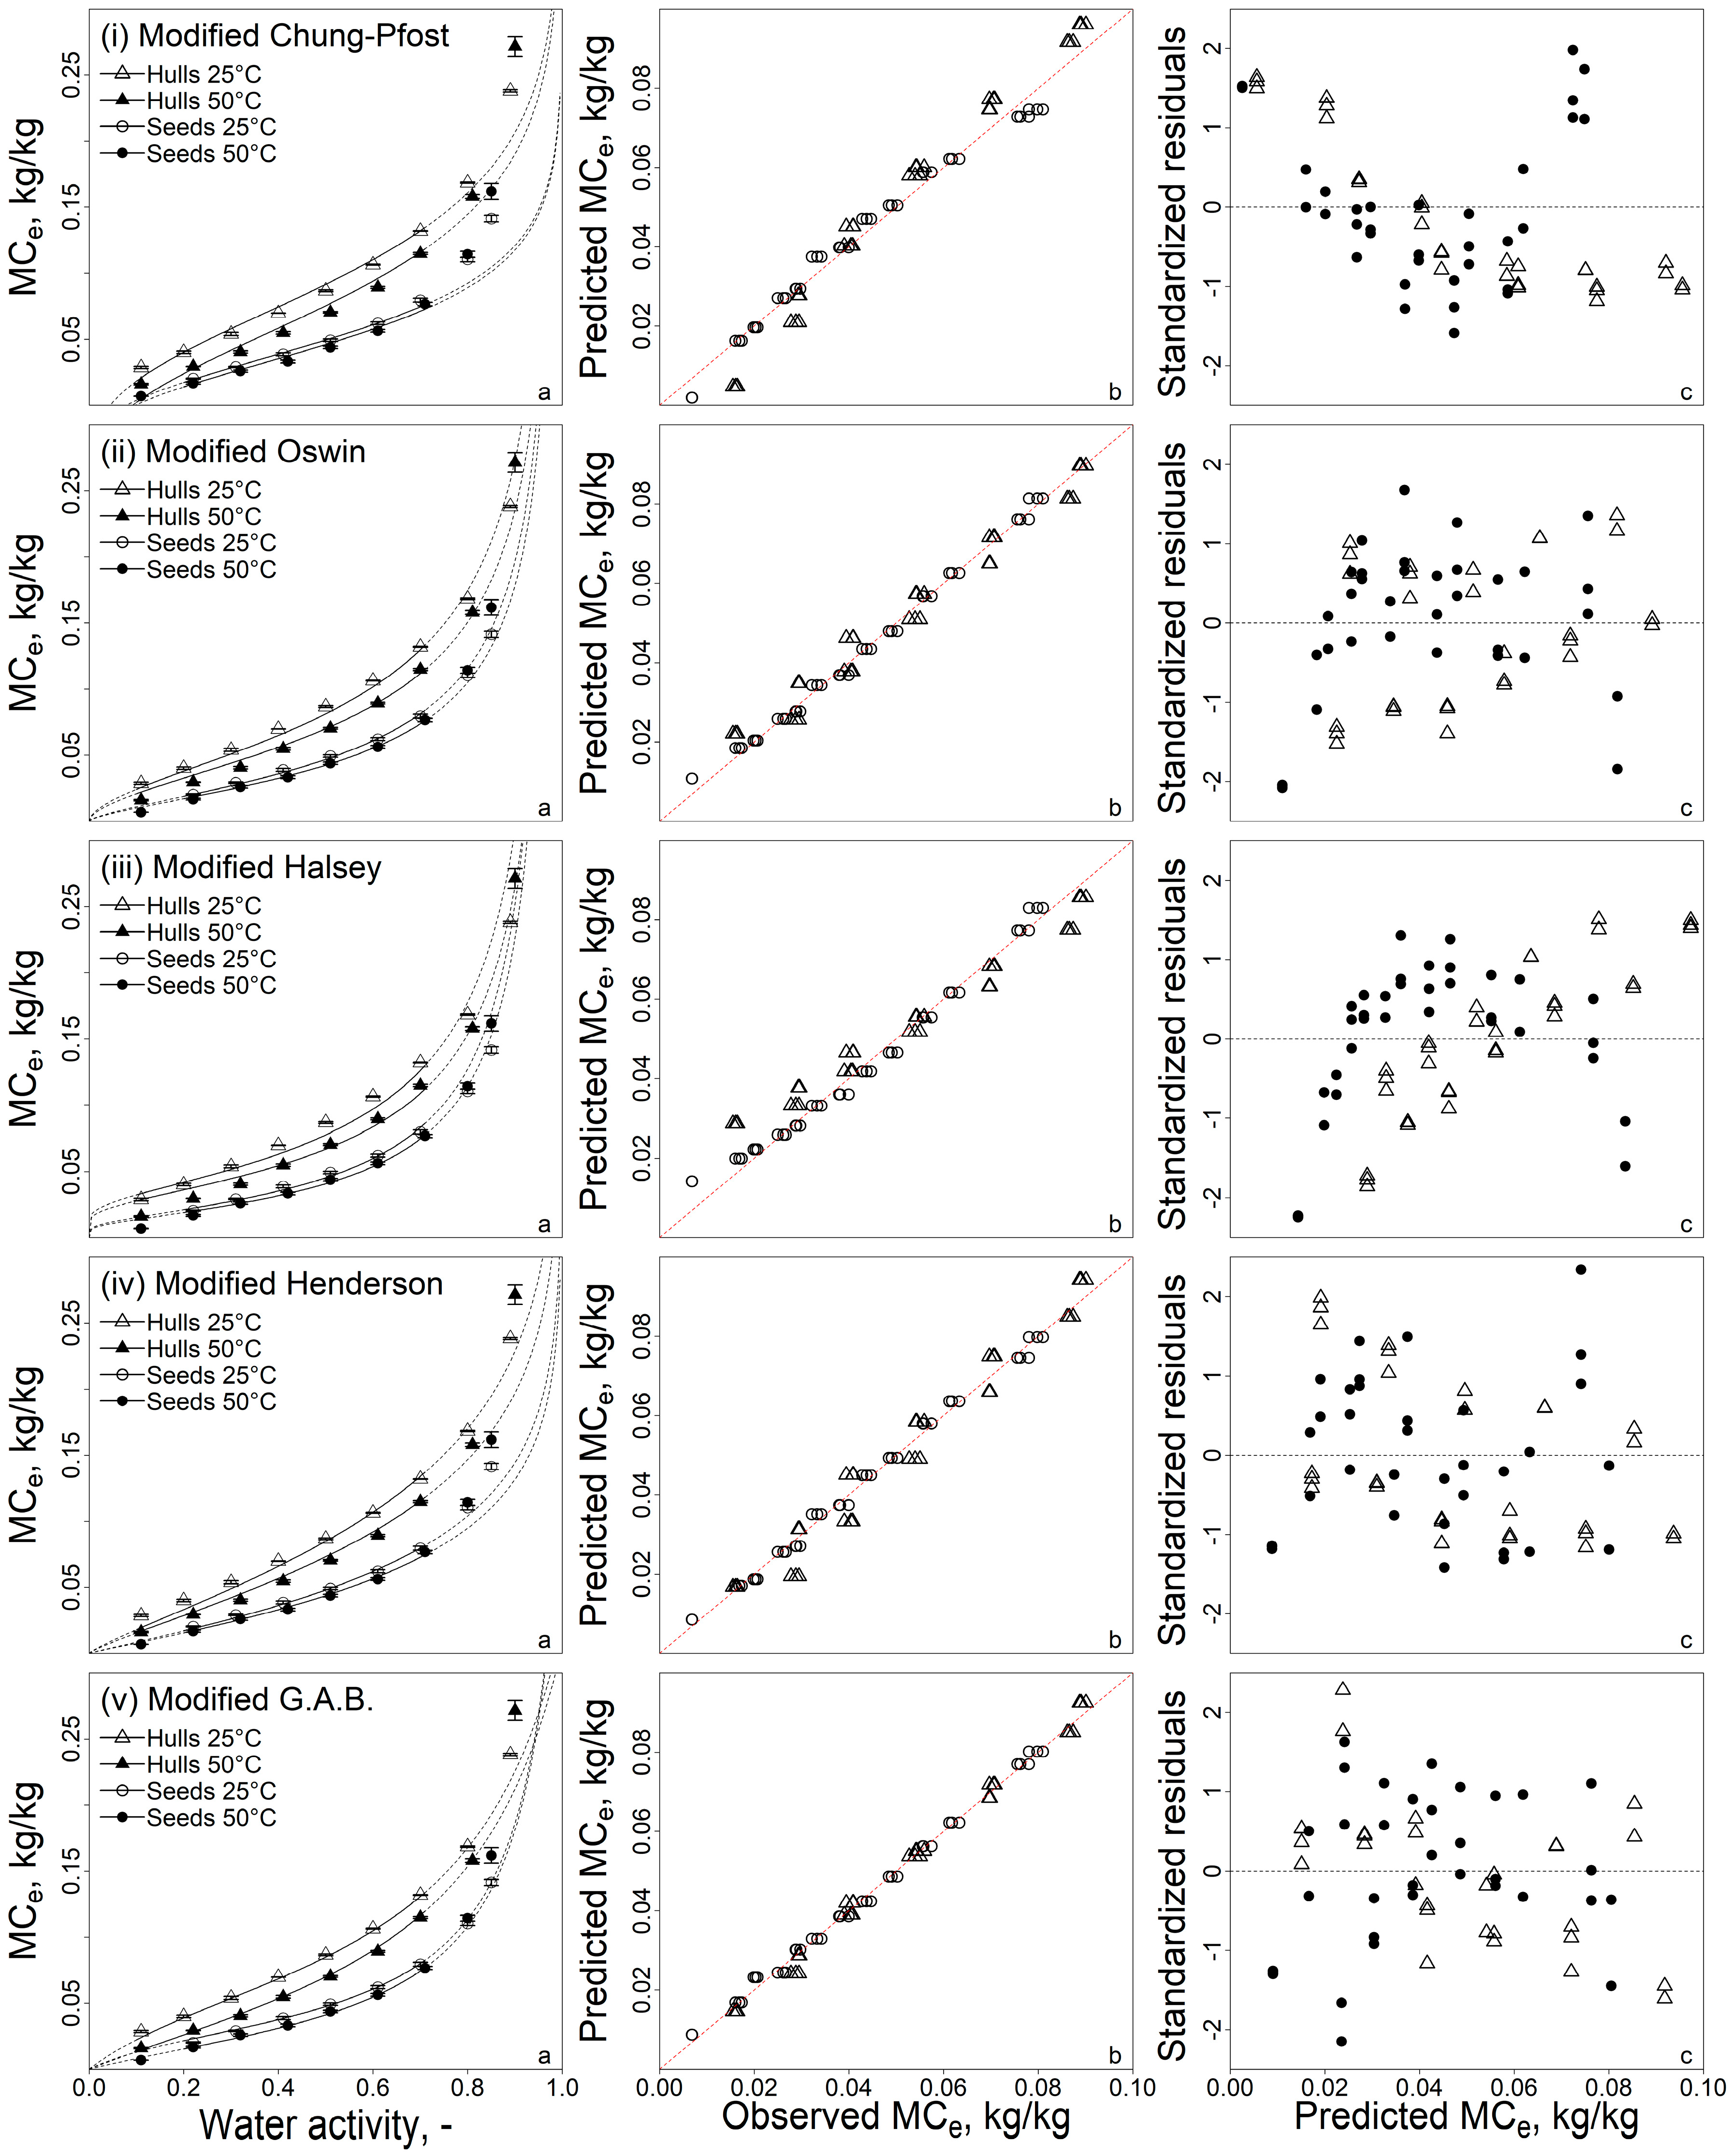
2.4. Sorption Isotherm Models

Five commonly applied, three parameter moisture sorption models were tested for their accuracy to describe the experimental sorption data [3,5,6,24]. The models are presented in terms of equilibrium moisture content MCe (kg∙kg−1), water activity aw (pvspsat−1), and a, b, c as model constants. The applied model equations and their ranges of validity are shown in Table 1.

2.5. Thin-Layer Drying Experiments

Thin-layer drying experiments were conducted using a high precision hot-air laboratory dryer designed at the Institute of Agricultural Engineering, University of Hohenheim (Stuttgart, Germany), which allowed the control of the desired drying conditions over a wide range of operating parameters. For the drying experiments, 500 kg of freshly harvested seeds were manually cleaned and 70 subsamples of 1.5 kg each were randomly taken, vacuum-sealed in PEHD bags and stored at 4 °C for no longer than four weeks. The experimental system has been previously described in detail by Argyropoulos et al. [25]. In total, 63 individual drying experiments were conducted at temperatures T between 30 and 90 ± 0.1 °C in steps of 10 °C and an absolute humidity x of 0.010, 0.015, and 0.020 kg water per kg of dry air. During the individual drying experiments, temperature and absolute humidity were kept constant and a uniform air flow through the sample was maintained at 0.6 ± 0.05 m∙s−1. The initial seed moisture during all drying experiments was 0.317 ± 0.008 kg∙kg−1. An initial mass of 0.400 ± 0.001 kg was evenly spread on a perforated drying tray, which resulted in a layer depth of 15 mm. The tray was supported on PC6 load cells (Flintec GmbH, Meckesheim, Germany). The weight was measured every 10 min. Meanwhile, a bypass valve was opened to prevent floating of the tray. The seeds were dried until a constant weight was achieved, once the total weight change for three consecutive measurements was below 0.5 g. The drying experiments were repeated at least three times for each drying condition. The moisture content of seeds before and after drying was determined as described above Section 2.2. In total, 63 experiments with 1291 single measurements were conducted.

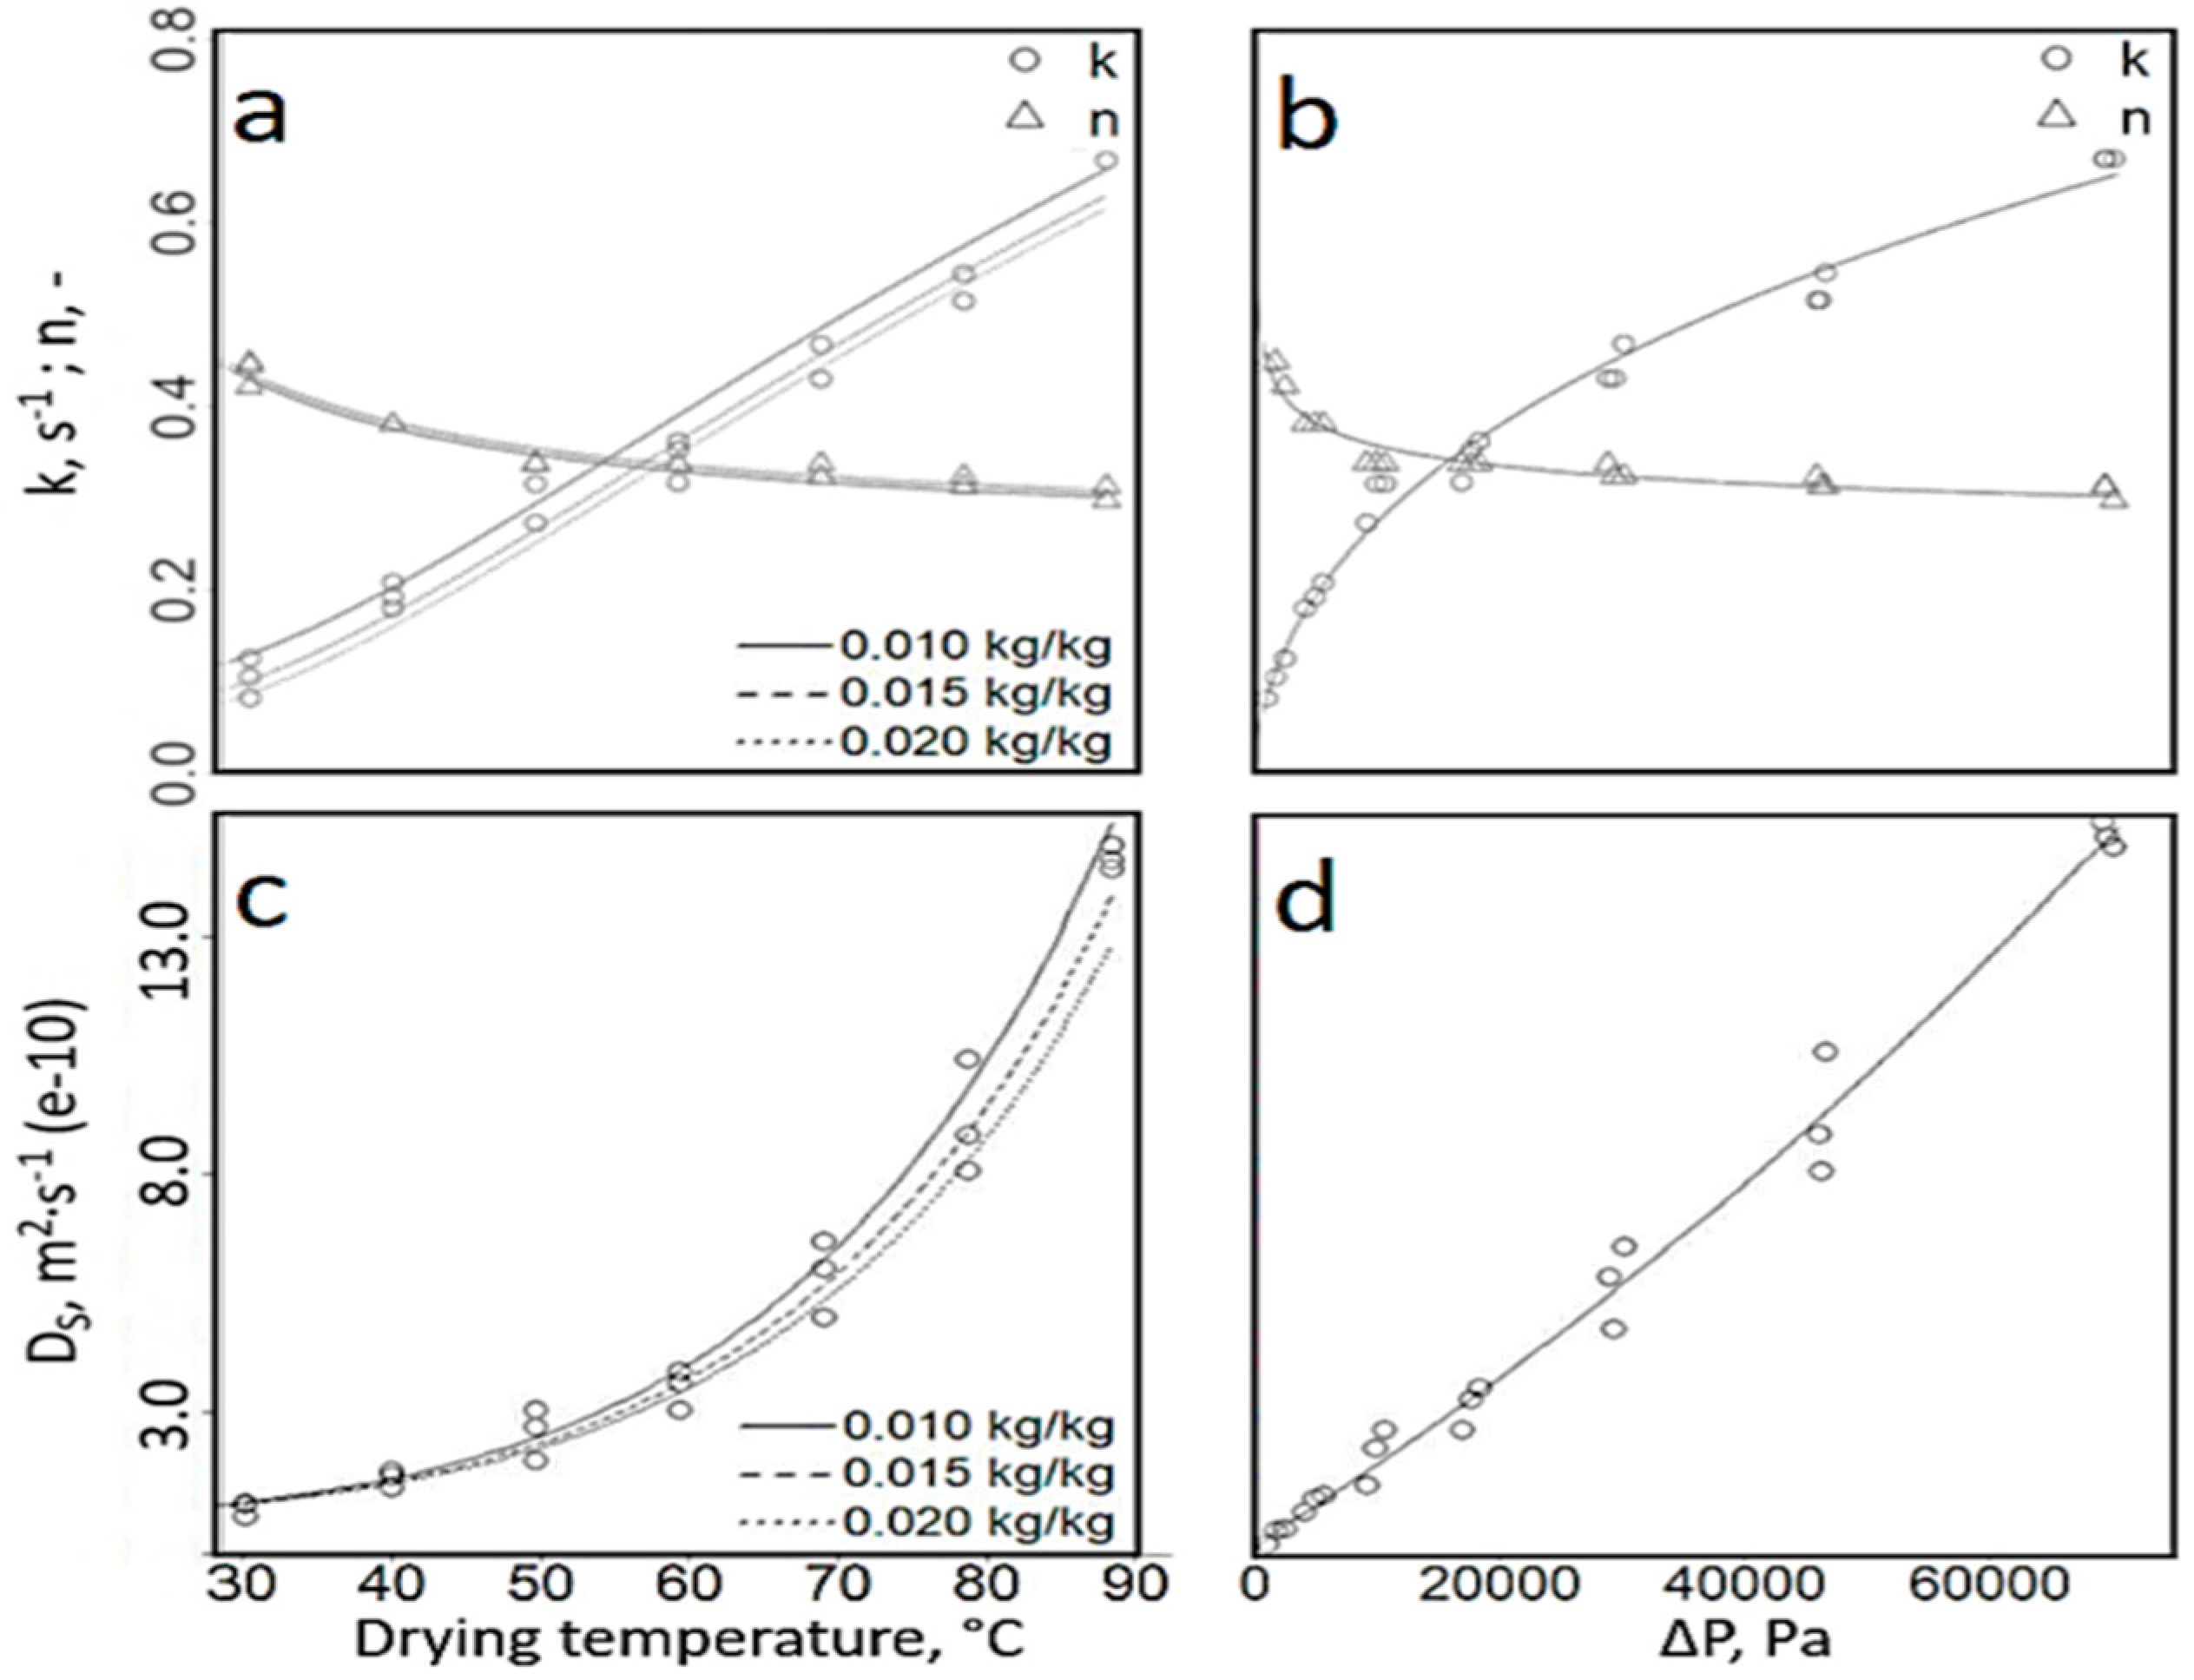
2.6. Empirical Drying Model

By including equilibrium moisture information from the previous experiments, the normalized moisture ratio (MR) was computed. MR (t) is the average moisture ratio at time t (minutes), MCt the moisture content at time t, MCe the equilibrium moisture content, and MC0 the initial moisture content (kg∙kg−1). The moisture ratio over time can be well depicted by the semi-empirical page equation (Equation (2)). This approach offers a compromise between inclusion of the physical theory and ease of use, which results in a semi-empirical model [6]. Fickian moisture migration, constant moisture diffusion coefficients isothermal conditions, and negligible shrinkage are the basics of this approach [26]. Two coefficients have to be fitted including k as the rate constant (min−1) and n as the dimensionless coefficient to improve the fit [19].
To provide a generalized, semi-empirical model capable of representing different temperatures and humidity of the drying medium, k and n were transformed to a function of drying conditions at time t. It is important to highlight that the actually recorded conditions from the drying chamber were employed in the model instead of the set-point conditions.
Two different approaches, based on (i) temperature T (°C) and absolute humidity x (kg∙kg−1) (Equation (3)) and water vapor pressure deficit ΔP (Pa) (Equation (4)), both described by an Arrhenius-type equation, were followed [27]. ΔP (Pa) was computed as the vapor pressure deficit between the drying air and saturated air under the same temperature conditions with Psat (Pa) derived from the Magnus-equation, T (°C), and rh as the relative humidity (%) (Equation (1)).
Δ P = P s a t × ( 1 r h 100 ) = 611.2 × exp ( 17.62 T 243.12 + T ) × ( 1 r h 100 )
M R ( t ) = M C t M C e M C 0 M C e = exp ( k t n )
with the following conditions: kT1 < kT2, nT1 > nT2 for T1 < T2 and x1 = x2, kx1 > kx2, nx1 < nx2 for T1 = T2 and x1 < x2
f ( k ,   n ) = d × exp ( e T ) + f x
M R ( t ) = exp ( ( d × exp ( e T ) + f x ) t d × exp ( e T ) + f x )
f ( k ,   n ) = g × log ( Δ P ) h
M R ( t ) = exp ( g × log ( Δ P ) h t g × log ( Δ P ) h )

2.7. Analytical Estimation of Diffusion Coefficients

The high oleic sunflower seeds used in this study are shaped like compressed, oval bodies with a sphericity of 0.45 to 0.55 and an equivalent diameter of 5.48 ± 0.64 mm [22]. Average moisture diffusivity D was assumed to remain constant during the relevant drying period [28]. Under these conditions, the special “short time “solution to the differential diffusion equation proposed by Becker (1959) can be applied. The physical basis of this solution is the restriction of changes in moisture to the vicinity of the surface [29]. The validity is limited to the fast drying region of 0.2 < MR < 1 including the name “short times solution”. The mathematical derivation was intensively discussed by Giner and Mascheroni [29], and Becker’s short time analytical solution was proven to be accurate, fast, and applicable in the practical drying range for agricultural products. For spheres, the thin layer equation takes the form of Equation (5) where av is the kernel’s surface specific area in m2∙m−3.
M R = M C t M C e M C 0 M C e = 1 2 π a v D t + f ( 0 ) 2 a v 2 D t
with the following conditions: MCt = MC0 for t = 0, MCt = MCe for t → ∞
The term f″(0) is a shape dependent factor, derived from the slope of Equation (6), expressed as a straight line [29].
Y = 1 M R a v D t = 2 π f ( 0 ) 2 a v D t
D can be derived from a moisture independent, Arrhenius type relationship, proposed by Sun and Woods [30].
D = 1.126 × R 2 × e x p ( 2806.5 T + 273.15 )
where R is the seeds’ equivalent radius. After correction of the shape dependent factor f″(0), the individual diffusion coefficients Ds can be determined with Equation (5). The limits of validity for spherical bodies, where Ds is no longer essentially constant, are found at MR = 0.2 [28]. The same approximation was also adapted by Giner and Mascheroni [31] for wheat as well as by Santalla and Mascheroni [19] for sunflower seeds.

2.8. Statistical Analysis

All statistical analyses were conducted using the R Project for Statistical Computing [32]. The sorption models and individual Page equations were fitted to the experimental data using R’s nls2 procedure [33]. The coefficient of determination R2 and the mean absolute percentage error MAPE with MCe,exp and MRexp as the observed and MCe,pre and MRpre as the predicted equilibrium moisture content and moisture ratio were taken as the main criteria for the goodness of fit.
R 2 = 1 ( M R e x p M R p r e ) 2 ( M R e x p M R ¯ e x p ) 2
M A P E = 100 n | M R e x p M R p r e | M R e x p
The effect of independent variables on the overall model constants was determined by regression analysis and analysis of variance (ANOVA). Asterisks mark significance at p < 0.05 (*), p < 0.01 (**), and p < 0.001 (***) level.

3. Results and Discussion

3.1. Analysis of Moisture Sorption Models

Figure 2a shows the experimentally derived sorption data for hulls and seeds at 25 °C and 50 °C and the curves as predicted by the selected models. At a constant temperature, the equilibrium moisture content increased with increasing water activity, which indicates an asymptotic convergence at aw = 1. In general, at constant water activity, the equilibrium moisture content decreased with increasing temperature. Remarkably, for hulls, this trend was only observed for aw ≤ 0.82 and for seeds for aw ≤ 0.72. Above these threshold values, the equilibrium moisture content increased with increasing temperature, which is a phenomenon that usually can be observed in high sugar foods [34,35].
Those sorption models are not designed to depict this inverse phenomenon. Therefore, data at aw > 0.82 for hulls and aw > 0.72 for seeds were excluded from the non-linear fitting procedure. A random 60% of the remaining dataset was used for fitting while the entire remaining dataset was used for model performance evaluation in terms of R2 and MAPE value. The fitted curves are shown as solid lines and continued as dashed lines when the above-mentioned limits of aw are exceeded, which shows what the corresponding models would predict. Figure 2b provides the predicted versus observed plots for employed sorption equations.
In Table 2, the model coefficients determined by the nonlinear least squares procedure and the corresponding performance parameters are summarized. For seeds, the Mod. Oswin, Mod. Henderson and Mod. G.A.B. equation all achieved R2 > 0.99 and MAPE < 10%. However, the residual plots (Figure 2c) reveal a patterned shape for all but the Mod. Henderson equation. For hulls, only the modified Oswin and modified G.A.B. equation showed R2 > 0.99. However, only the modified G.A.B. equation showed random distribution of residuals.
Furthermore, the experimental data for both seeds and hulls indicate the convex shape of a type III sorption isotherm, according to Brunauer’s classification [6]. This type is relatively uncommon and not generally found [36]. Physically, the type III isotherm does not show monolayer adsorption [36]. It is well known that plant seed sorption behavior should rather be depicted with type II sorption isotherms, which is generally adopted in many other studies [7,37,38]. Type II isotherms are an extension of Langumir-like monolayer adsorption isotherms to include unrestricted mono and multilayer adsorption [36], which result in the characteristic sigmoidal shape with a nearly straight segment. It is generally assumed that the beginning of this straight line portion represents the most likely point, where a completely saturated monolayer occurs [39]. From Figure 2, however, no transition from monolayer to multilayer adsorption is derivable, which indicates that the surface area was already covered with a monolayer below the lowest measured aw value. Sunflower seeds are very much comparable to complex multi-domain foods, with the hulls being a fibrous matrix, allowing two to four times faster diffusivity of moisture than the kernel [19]. In addition, it is clear that the oil content in kernels highly affects the equilibrium moisture content. Similar observations have been reported by other studies [2,40]. At a constant temperature, hulls usually reach a higher MCe than seeds, which again show a higher MCe than kernels [2,18,19]. The Mod. Henderson was the only model showing both satisfying fit and random residuals for seeds. Opposed to this, hulls alone were best modeled by the Mod. G.A.B. equation. Given the fact that safe moisture levels for oilseeds are found in the region of aw = 0.64–0.70, the limits of model validity and the observed anomaly at high values of aw were considered non-critical for the development of a drying model [1,3]. Based on these insights, the fitted Mod. Henderson equation and the coefficients found for seeds were integrated in Equation (2) in order to describe the drying process.

3.2. Modelling of Thin-Layer Drying Behavior

The individual drying data for T from 30 °C to 90 °C and x of 0.010, 0.015, and 0.020 kg∙kg−1 were described well by the Page equation with high R2 (>0.99) and low MAPE (<5%) values. The equilibrium moisture content MCe (kg∙kg−1) for seeds was calculated with the Mod. Henderson equation with a = 0.102, b = 207.939, and c = 1.145 (Table 2). The kinetic parameter k increased with increasing T at constant x, while n decreased. With increasing absolute humidity at constant T, k decreased and n increased. Equation (10) and Equation (10a) best described model parameters k and n as a function of T and x. The resulting course is shown in Figure 3a. Inclusion in Equation (2a) resulted in a temperature and absolute humidity-based generalized model describing the experimental data with an R2 value of 0.982 and MAPE of 9.4%.
k = 1.982 × exp ( 112.9 T ) + 8.384 × 10 4 x   , R 2 = 0.980 ,   M A P E = 6.13 %
n = 0.266 × exp ( 15.10 T ) + 1.624 × 10 4 x ,   R 2 = 0.960 ,   M A P E = 1.98 %
The description of k and n as a function of the water vapor pressure deficit ΔP was best described by Equation (11) and Equation (11a). The course of k and n vs. ΔP is depicted in Figure 2b. By inclusion in Equation (2b), a ΔP based, generalized, drying model is achieved, which is capable of describing the experimentally derived drying data with an overall R2 value of 0.988 and MAPE of 8.3%. This is slightly better than the model based on T and x.
k = 1.126 × 10 5 · log ( Δ P ) 4.540 ;   R 2 = 0.988 ,   M A P E = 4.25 %
n = 2.494 × log ( Δ P ) 0.880 ;   R 2 = 0.934 ,   M A P E = 2.25
Since ΔP is mainly dependent on T and x, it is a promising physical parameter for the description of drying processes. Regarding the slightly superior fit of the generalized model described by ΔP and the requirement of only four model constants instead of six, this relationship was chosen to further describe the drying process. The predicted vs. observed plot in Figure 4a shows a nearly straight line, which indicates a satisfying performance of the generalized model. The residuals plot in Figure 4b shows a random distribution, supporting the validity of the derived model.
Application of the short times equation indicated an increase of DS with increasing temperature T. With increasing absolute humidity x, DS showed a decreasing trend for temperatures up to 70 °C, from where no obvious trend was derivable. For T below 50 °C, the threshold of MR < 0.2 usually was not undershot. The shape dependent factor f″(0) found to be 0.428 with a standard error of 1.3%. By inclusion in Equation (6), the diffusion coefficients for short times (0.2 < MR < 1) can be calculated (Table 3).
The mean coefficient of determination was 0.984 with a MAPE of 7.09% for short times. Visual analysis of Figure 3c, which compares the measured data to the fit of Equation (12) revealed an overestimation when the limit of validity is approached. The derived diffusion coefficients, however, are in the same range as the ones reported by Santalla and Mascheroni [19]. In addition to their findings, that initial moisture content did not affect diffusion coefficients. The results from this study indicate an effect of x only in the lower temperature regions up to 70 °C. In an analogy with the approach for fitting a generalized empirical drying model, the same procedure was applied for the analytical solution. A generalized analytical model was fitted for DS = f(T,x), which is well described by Equation (12).
D S = 4.125 × 10 13 · exp ( T 0.4851 × x 0.033 ) ;   R 2 = 0.984 ,   M A P E = 12.75 %
Integration of Equation (12) in Equation (5) yielded a generalized model with an overall R2 of 0.966 and MAPE = 7.37%. The description of DS = f(ΔP) was described well with a similar function:
D S = 1.296 × 10 12 × exp ( Δ P 0.1747 ) ;   R 2 = 0.986 ,   M A P E = 10.03 %
Integration of Equation (13) in Equation (5) resulted in a generalized model based on ΔP, which was fitted with an overall R2 of 0.976 and MAPE = 6.33%. This is slightly better than the approach based on temperature and absolute humidity. The fit to the experimental data of both Equations (12) and (13) is given in Figure 3c,d.
An applicability to determine the effective diffusion coefficients in the initial, most relevant phase of drying is obviously given and commonly applied [19,29,31]. Especially, the calculation of the shape-depending factor f″(0), based on the physical properties of the investigated product, adds further meaning to the application of Becker’s equation, and is expected to increase the applicability of the thin-layer equation for dryer control and simulation.

4. Conclusions

The embedded systems employed for data recording during the sorption and drying experiments in the current study did allow the acquisition of a large amount of experimental inline-data from one year’s harvest. This information was used to fit semi-empirical and analytical sorption and drying models that are simple enough to be run on embedded microcontrollers with limited processing power. The sorption experiments revealed that, for high values of aw, the equilibrium moisture content increased with increasing temperature. An anomaly, which is usually found in high sugar foods, was not yet reported for sunflower seeds. It is remarkable that most of the commonly applied equations to describe sorption isotherms showed patterned residuals, which restricted their applicability and validity. This study found the Page equation to satisfactorily describe the drying process of high oleic sunflower seeds for a wide range of drying air temperatures and humidity. It also proposes the application of water vapor pressure deficit ΔP to calculate the parameters of the Page equation including both the effect of temperature and the humidity of the drying air. This approach was found to be superior to a prediction based on temperature. Values of diffusivity ascertained with the Becker equation and a correction of the shape dependent factor are comparable to those reported in other studies, which corroborates the applicability and accuracy in thin layer drying of high oleic sunflower seeds.

Author Contributions

Literature review: S.M., Methodology: S.M., D.A., J.M.; Concept and design: S.M.; Investigation: S.M., D.A.; Formal analysis: S.M.; Writing—Original Draft Preparation: S.M.; Writing—Review and Editing: S.M., D.A., J.M.

Funding

We would like to thank the German Federal Ministry of Education and Research (BMBF) for its financial support for the Trans-SEC (http://www.trans-sec.org) project (grant No. 031A249B) in which this research was carried out.

Conflicts of Interest

The authors declare no conflict of interest.

Abbreviations

awwater activity
MCmoisture content
MCeequilibrium moisture content
MCtmoisture content at time t
DVSdynamic vapour sorption apparatus
kgkilogram
ggram
mgmilligram
mmeter
mmmillimeter
rhrelative humidity, %
minminutes
Pvswater vapor partial pressure, Pa
Psatsaturation vapor pressure, Pa
Ttemperature, °C
a, b, c, d, e, f, gmodel constants
G.A.B.Guggenheim, Anderson, DeBoer
xabsolute humidity, kg water per kg of dry air
ssecond
MRmoisture ratio
ttime
krate constant, min−1
ndimensionless coefficient of page equation
Ppressure, Pa
Dmoisture diffusivity, m2∙s−1
avkernel’s surface specific area in m2∙m−3
ANOVAanalysis of variance
MAPEmean absolute perecentage error
R2coefficient of determination
pprobability level at which significance is assumed

References

  1. Robertson, J.A.; Chapman, G.W.; Wilson, R.L. Effect of moisture content of oil type sunflower seed on fungal growth and seed quality during storage. J. Am. Oil Chem. Soc. 1984, 61, 768–771. [Google Scholar] [CrossRef]
  2. Mazza, G.; Jayas, D.S.S. Equilibrium moisture characteristics of sunflower seeds, hulls, and kernels. Trans. ASAE 1991, 34, 534–538. [Google Scholar] [CrossRef]
  3. Giner, S.A.; Gely, M.C. Sorptional parameters of sunflower seeds of use in drying and storage stability studies. Biosyst. Eng. 2005, 92, 217–227. [Google Scholar] [CrossRef]
  4. Maciel, G.; De la Torre, D.; Izquierdo, N.; Cendoya, G.; Bartosik, R. Effect of oil content of sunflower seeds on the equilibrium moisture relationship and the safe storage condition. Agric. Eng. Int. 2015, 17, 248–258. [Google Scholar]
  5. Mujumdar, A.S.; Beke, J. Grain drying: Basic principles. In Handbook of Postharvest Technology: Cereals, Fruits, Vegetables, Tea, and Spices; Chakraverty, A., Mujumdar, A.S., Raghavan, G.S.V., Ramaswamy, H.S., Eds.; Marcel Dekker: New York, NY, USA, 2003; pp. 119–138. [Google Scholar]
  6. Guillard, V.; Bourlieu, C.; Gontard, N. Theoretical background. In Food Structure and Moisture Transfer; Springer: New York, NY, USA, 2013; pp. 3–33. [Google Scholar]
  7. Argyropoulos, D.; Alex, R.; Kohler, R.; Müller, J. Moisture sorption isotherms and isosteric heat of sorption of leaves and stems of lemon balm (Melissa officinalis L.) established by dynamic vapor sorption. LWT-Food Sci. Technol. 2012, 47, 324–331. [Google Scholar] [CrossRef]
  8. Argyropoulos, D.; Müller, J. Effect of convective-, vacuum- and freeze drying on sorption behaviour and bioactive compounds of lemon balm (Melissa officinalis L.). J. Appl. Res. Med. Aromat. Plants 2014, 1, 59–69. [Google Scholar] [CrossRef]
  9. Arslan, N.; Toğrul, H. Moisture sorption isotherms for crushed chillies. Biosyst. Eng. 2005, 90, 47–61. [Google Scholar] [CrossRef]
  10. Stubberud, L.; Arwidsson, H.G.; Graffner, C. Water-solid interactions: I. A technique for studying moisture sorption/desorption. Int. J. Pharm. 1995, 114, 55–64. [Google Scholar] [CrossRef]
  11. Hill, C.A.S.; Norton, A.J.; Newman, G. The water vapour sorption properties of Sitka spruce determined using a dynamic vapour sorption apparatus. Wood Sci. Technol. 2010, 44, 497–514. [Google Scholar] [CrossRef]
  12. Kachrimanis, K.; Noisternig, M.F.; Griesser, U.J.; Malamataris, S. Dynamic moisture sorption and desorption of standard and silicified microcrystalline cellulose. Eur. J. Pharm. Biopharm. 2006, 64, 307–315. [Google Scholar] [CrossRef] [PubMed]
  13. Kohler, R.; Dück, R.; Ausperger, B.; Alex, R. A numeric model for the kinetics of water vapor sorption on cellulosic reinforcement fibers. Compos. Interfaces 2003, 10, 255–276. [Google Scholar] [CrossRef]
  14. Liu, H.; Zhang, L.; Han, Z.; Xie, B.; Wu, S. The effects of leaching methods on the combustion characteristics of rice straw. Biomass Bioenergy 2013, 49, 22–27. [Google Scholar] [CrossRef]
  15. Vollenbroek, J.; Hebbink, G.A.; Ziffels, S.; Steckel, H. Determination of low levels of amorphous content in inhalation grade lactose by moisture sorption isotherms. Int. J. Pharm. 2010, 395, 62–70. [Google Scholar] [CrossRef] [PubMed]
  16. Xie, Y.; Hill, C.A.S.; Jalaludin, Z.; Curling, S.F.; Anandjiwala, R.D.; Norton, A.J.; Newman, G. The dynamic water vapour sorption behaviour of natural fibres and kinetic analysis using the parallel exponential kinetics model. J. Mater. Sci. 2011, 46, 479–489. [Google Scholar] [CrossRef]
  17. Nurhadi, B.; Roos, Y.H. Dynamic water sorption for the study of amorphous content of vacuum-dried honey powder. Powder Technol. 2016, 301, 981–988. [Google Scholar] [CrossRef]
  18. Santalla, E.M.; Mascheroni, R.H. Equilibrium moisture characteristics of high oleic sunflower seeds and kernels. Dry. Technol. 2003, 21, 147–163. [Google Scholar] [CrossRef]
  19. Santalla, E.M.; Mascheroni, R.H. Moisture diffusivity in high oleic sunflower seeds and kernels. Int. J. Food Prop. 2010, 13, 464–474. [Google Scholar] [CrossRef]
  20. Henderson, S.M.; Pabis, S. Grain drying theory IV, The effect of airflow rate on the drying index. J. Agric. Eng. Res. 1962, 7, 85–89. [Google Scholar]
  21. Hutchinson, D.; Otten, L. Thin-layer air drying of soybeans and white beans. Int. J. Food Sci. Technol. 1983, 18, 507–522. [Google Scholar] [CrossRef]
  22. Munder, S.; Argyropoulos, D.; Müller, J. Class-based physical properties of air-classified sunflower seeds and kernels. Biosyst. Eng. 2017, 164, 124–134. [Google Scholar] [CrossRef]
  23. ISO 665:2000 Oilseeds—Determination of Moisture and Volatile Matter Content; International Organization for Standardization (ISO): Geneva, Switzerland, 2000.
  24. Al-Muhtaseb, A.H.; McMinn, W.A.M.; Magee, T.R.A. Moisture sorption isotherm characteristics of food products: A review. Food Bioprod. Process. 2002, 80, 118–128. [Google Scholar] [CrossRef]
  25. Argyropoulos, D.; Heindl, A.; Müller, J. Assessment of convection, hot-air combined with microwave-vacuum and freeze-drying methods for mushrooms with regard to product quality. Int. J. Food Sci. Technol. 2011, 46, 333–342. [Google Scholar] [CrossRef]
  26. Shahari, N.A. Mathematical Modelling of Drying Food Products: Application to Tropical Fruits. Ph.D. Thesis, University of Nottingham, Nottingham, UK, 2012. [Google Scholar]
  27. Udomkun, P.; Argyropoulos, D.; Nagle, M.; Mahayothee, B.; Janjai, S.; Müller, J. Single layer drying kinetics of papaya amidst vertical and horizontal airflow. LWT-Food Sci. Technol. 2015, 64, 67–73. [Google Scholar] [CrossRef]
  28. Becker, H.A. A study of diffusion in solids of arbitrary shape, with application to the drying of the wheat kernel. J. Appl. Polym. Sci. 1959, 1, 212–226. [Google Scholar] [CrossRef]
  29. Giner, S.A.; Mascheroni, R.H. PH—Postharvest technology. J. Agric. Eng. Res. 2001, 80, 351–364. [Google Scholar] [CrossRef]
  30. Sun, D.W.; Woods, J.L. Low temperature moisture transfer characteristics of wheat in thin layers. Trans. ASAE 1994, 37, 1919–1926. [Google Scholar] [CrossRef]
  31. Giner, S.A.; Mascheroni, R.H. PH—Postharvest technology. Biosyst. Eng. 2002, 81, 85–97. [Google Scholar] [CrossRef]
  32. R Core Team. R: A Language and Environment for Statistical Computing 2015. Available online: https://www.r-project.org (accessed on 17 September 2015).
  33. Grothendieck, G. nls2: Non-Linear Regression with Brute Force 2013. Available online: https://cran.r-project.org/web/packages/nls2/nls2.pdf (accessed on 17 September 2015).
  34. Djendoubi Mrad, N.; Bonazzi, C.; Boudhrioua, N.; Kechaou, N.; Courtois, F. Influence of sugar composition on water sorption isotherms and on glass transition in apricots. J. Food Eng. 2012, 111, 403–411. [Google Scholar] [CrossRef]
  35. Saravacos, G.D.; Tsiourvas, D.A.; Tsami, E. Effect of temperature on the water adsorption isotherms of sultana raisins. Dry. Technol. 1986, 4, 633–649. [Google Scholar] [CrossRef]
  36. Ling, M. Manometrische Bestimmung der NO2-Sorptionsisothermen von Superberliner Blau—Derivaten und Charakterisierung der inneren Oberflächen mittels der BET—Methode. Ph.D. Thesis, Universität Hamburg, Hamburg, Germany, 2001. [Google Scholar]
  37. Simha, H.V.V.; Pushpadass, H.A.; Franklin, M.E.E.; Kumar, P.A.; Manimala, K. Soft computing modelling of moisture sorption isotherms of milk-foxtail millet powder and determination of thermodynamic properties. J. Food Sci. Technol. 2016, 53, 2705–2714. [Google Scholar] [CrossRef] [Green Version]
  38. Mathlouthi, M.; Rogé, B. Water vapour sorption isotherms and the caking of food powders. Food Chem. 2003, 82, 61–71. [Google Scholar] [CrossRef]
  39. Brunauer, S. The Adsorption Of Gases And Vapors Vol I; Oxford University Press: London, UK, 1943. [Google Scholar]
  40. Pixton, S.W.; Warburton, S. Moisture content relative humidity equilibrium, at different temperatures, of some oilseeds of economic importance. J. Stored Prod. Res. 1971, 7, 261–269. [Google Scholar] [CrossRef]
Figure 1. Cutaway view of automated system for dynamic vapor sorption recording.
Agriculture 09 00001 g001
Figure 2. (a) Sorption isotherm for high oleic sunflower seeds (circles) and hulls (triangles) at 25 °C (hollow) and 50 °C (solid) predicted with different models as specified in the plot. Slashed lines are an extrapolation beyond the dataset used for fitting. (b) observed equilibrium moisture content vs. predicted equilibrium moisture content and (c) standardized residuals vs. predicted equilibrium moisture content.
Agriculture 09 00001 g002
Figure 3. Parameters k, n, and the fitted models from (a) Equations (10) and (10a) for k, n = f(T,x) in °C and kg∙kg−1 and (b) modeled with Equation (11) and (11a) for k, n = f(ΔP) in Pa. (c) DS = f(T,x) for temperature from 30 °C to 90 °C and absolute humidity of the drying air of 0.010, 0.015, and 0.020 kg∙kg−1 modeled with Equation (12) and (d) DS = f(ΔP) for the same temperature and humidity range, modeled with Equation (13).
Agriculture 09 00001 g003
Figure 4. Model performance for MR expressed as a function of ΔP calculated with Equation (2b), (a) predicted MR versus observed MR values are concentrated closely to the perfect fit line of x = y, and (b) the residuals are equally distributed and do not show any trend.
Agriculture 09 00001 g004
Table 1. Models for sorption isotherms. MCe = equilibrium moisture content. T = temperature in °C. aw = water activity. a, b, c = model constants [7].
ModelOriginal Plant MaterialValidity (aW)
Modified Chung-Pfost
M C e = 1 a ln ( ( T + b ) c ln ( a W ) ) Maize and maize components0.1–0.9
Modified Oswin
M C e = ( a + b × T ) ( a W 1 a W ) 1 c Various0.3–0.5
Modified Halsey
M C e = ( e x p ( a + b × T ) ln ( a W ) ) 1 c Maize, wheat flour, laurel, nutmeg0.1–0.8
Modified Henderson
M C e = ( ln ( 1 a W ) a ( T + b ) ) 1 c Maize-
Modified G.A.B.
M C e = a b ( c T ) a W ( a b a W ) ( 1 b a W + ( c T ) b a W ) Various<0.94
Table 2. Coefficients a, b, and c, coefficient of determination R2 and MAPE for the (i) Mod. Chung-Pfost, (ii) Mod. Oswin, (iii) Mod. Halsey, (iv) Mod. Henderson, and (v) Mod. G.A.B. equation fitted for high oleic sunflower seeds in the range of 10–70% equilibrium relative humidity at 31 degrees of freedom and hulls in the range of 10–80% equilibrium relative humidity and 34 degrees of freedom.
Equation a b c R2MAPE, %
(i) Mod. Chung-PfostSeeds28.181***208.987***611.811***0.9887.900
(ii) Mod. Oswin0.048***−1.58 · 10−4***1.607***0.9928.131
(iii) Mod. Halsey−3.895***−4.60 · 10−3***1.159***0.97813.884
(iv) Mod. Henderson0.102***207.939***1.145***0.9955.408
(v) Mod. G.A.B.2.88 · 10−2***0.919***167.831***0.9945.923
(i) Mod. Chung-PfostHulls17.761***47.204***240.673***0.9859.173
(ii) Mod. Oswin9.94 · 10−2***−0.001***1.776***0.9926.618
(iii) Mod. Halsey−3.255***−9.87 · 10−3***1.245***0.9829.964
(iv) Mod. Henderson0.208***54.690***1.299***0.9916.112
(v) Mod. G.A.B.0.070***0.775***122.616***0.9973.207
Significant contribution to the model on the p ≤ 0.05, p ≤ 0.01, and p ≤ 0.001 level, respectively, are indicated by one, two, or three asterisks.
Table 3. Moisture diffusion coefficients D for short times (MR ≥ 0.2), calculated with Equation (5) for different absolute humidity x and temperature T of the drying air, coefficient of determination R2 and MAPE.
xT, °CD (m2∙s−1)∙10−10R2MAPE, %
0.010 kg·kg−1300.643***0.9794.088
401.317***0.9856.935
502.620***0.9916.217
603.467***0.97010.903
706.277***0.9897.547
8010.190***0.9965.059
9014.800***0.9957.399
0.015 kg·kg−1300.593***0.9844.303
401.231***0.9875.591
502.258***0.97411.780
603.222***0.97911.238
704.627***0.96911.187
807.796***0.9907.829
9014.310**0.9975.611
0.020 kg·kg−1300.342***0.9793.556
400.978***0.9805.790
501.529***0.95410.944
602.634***0.9885.715
705.696***0.9829.844
808.559***0.9935.203
9014.490**0.9992.152
Significant contribution to the model on the p ≤ 0.05, p ≤ 0.01, and p ≤ 0.001 level, respectively, are indicated by one, two, or three asterisks.

