Article

Do Phytomer Turnover Models of Plant Morphology Describe Perennial Ryegrass Root Data from Field Swards?

1
Institute of Agriculture and Environment PN 433, Massey University, Private Bag 11-222, Palmerston North 4442, New Zealand
2
AgResearch Grasslands Private Bag 11-008, Palmerston North 4442, New Zealand
3
Department of Genetics and Plant Breeding, Bangladesh Agricultural University, Mymensingh 02202, Bangladesh
*
Author to whom correspondence should be addressed.
Agriculture 2016, 6(3), 28; https://doi.org/10.3390/agriculture6030028
Submission received: 21 March 2016 / Revised: 12 June 2016 / Accepted: 29 June 2016 / Published: 8 July 2016
(This article belongs to the Special Issue Forage Plant Ecophysiology)

Abstract

:
This study aimed to elucidate seasonal dynamics of ryegrass root systems in field swards. Established field swards of perennial ryegrass with white clover removed by herbicide and fertilised with nitrogen (N) to replace clover N fixation were subjected to lax and hard grazing management and root biomass deposition monitored using a root ingrowth core technique over a 13 month period. A previously published phytomer-based model of plant morphology that assumes continuous turnover of the root system was used to estimate mean individual root weight (mg) not previously available for field swards. The predicted root weights compared credibly with root data from hydroponic culture and the model output explained much of the seasonal variation in the field data. In particular, root deposition showed a seasonality consistent with influence of an architectural signal (AS) determined by plant morphology. This AS arises because it is theoretically expected that with rising temperatures and decreasing phyllochron in early summer, more than one leaf on average would feed each root bearing node. Conversely, in autumn the reverse would apply and root deposition is expected to be suppressed. The phytomer-based model was also able to explain deeper root penetration in summer dry conditions, as seen in the field data. A prediction of the model is that even though total root deposition is reduced by less than 10% under hard grazing, individual root weight is reduced proportionately more because the available substrate is being shared between a higher population of tillers. Two features of the field data not explained by the phytomer based model, and therefore suggestive of hormonal signaling, were peaks of root production after summer drought and in late winter that preceded associated herbage mass rises by about one month. In summary, this research supports a view that the root system of ryegrass is turning over on a continuous basis, like the leaves above ground. The phytomer based model was able to explain much of the seasonal variation in root deposition in field swards, and also predicts a shift of root deposition activity, deeper in summer and shallower in winter.

Graphical Abstract

1. Introduction

Historic studies of grass sward dynamics have tended to focus separately on behavior of leaves [1,2], tiller populations [3], or roots [4]. Compartmentalisation of sward dynamics studies in this way probably occurred, in part, as a pragmatic reaction to the fact that such studies are extremely time consuming, and focusing on one aspect of sward behavior helps ensure data quality. However, the disadvantage of single sward attribute studies is they can give the impression plant organs respond independently to external stimuli. Some attempts have been made to examine interrelationships between shoot traits, both conceptually [5,6] and from experimental data [7,8]. One study that attempted to synthesise a picture of root–shoot interactions of field swards of perennial ryegrass [9] achieved this by coordination of above- [10] and below-ground [11] measurements in separate studies of the same lax- or hard-grazed perennial ryegrass swards.
Root systems were described by Davidson [12] as ‘the forgotten component of pastures’, but that comment may represent a perception rather than fact, considering that a monograph by Troughton [13] two decades earlier had cited over 800 references. Moreover, there has been a steady stream of ongoing studies. A literature search in Web of Science by the authors identified just over 100 papers from 1995 to 2015 with both ‘root’ and ‘ryegrass’ in the title. Approximately 20 of these explore some aspect of the physical morphology and turnover of the root system. For example, one series of reports of New Zealand research compared root development in wild and bred ryegrass populations [14], in 200 genotypes of a ryegrass QTL mapping population [15] and in cloned ryegrass plants with or without fungal endophyte [16]. Apart from those which examined shoot:root ratio, all of these studies have looked at roots in terms of their rate of arrival or population density in specific soil layers without consideration of the underlying plant dynamics regulating root production. By contrast, research elsewhere has tended to focus on physiological function of roots, such as factors affecting abiotic stress resistance of roots or the various roles of root exudates [17,18].
Pursuit of these two emphases of researching root mass or density in defined soil layers or the physiological function of roots, while clearly valuable, has left a large gap in the knowledge about perennial ryegrass root systems. Specifically, we now understand from organising data on the growth of single leaves [19,20] how the phytomer-based plant morphology contributes to leaf tissue generation and loss in ryegrass swards over a defoliation interval, and there has been recent extension of this understanding to hydroponically grown ryegrass and wheat plants [21,22,23,24]. However, there is no study known to the authors that has explored quantitatively, the relationship between root presence in soil and phytomer-level events of the single tillers that comprise the sward.
The present paper arises from the first author deciding to submit for publication the remainder of a data set from a large field experiment studying root-shoot relations in perennial ryegrass swards, conducted almost 30 years ago, and only partly published at the time [9]. The experiment in question used an ‘ingrowth core’ technique adapted from European research [25] to measure seasonality of new root production (kg DM/ha/day) in lax- or hard-grazed ryegrass plots rotationally grazed by sheep. Here we add to the previously published data for 0–250 mm soil depth, data for the 250–600 mm soil layer and seasonal root and shoot production data. We draw on emerging awareness of phytomer-level organisation of the grass root system [21,22,23,24,26,27,28,29] to develop a phytomer-oriented mechanistic model; and attempt to reconcile the annual cycle of field data collected from December 1986 to January 1988 with the output from the phytomer based model. The aim is to show the quantitative link between root appearance rates measured in units of mass flow typically used for herbage accumulation (kg DM/ha/day) in the field swards of perennial ryegrass described above on the one hand, and root formation events at each phytomer on individual tillers on the other hand. It should be noted that a parallel concept for leaf turnover above ground is now well established in research targeted at informing extension advice to farmers [20,30], and so extending this approach to include understanding of the root system is overdue. The development of a theoretical framework for phytomer-based turnover of the root system represents a step change from previous thinking which has generally assumed that roots are replaced annually [31,32]. One feature that needs inclusion in the calculations is a representation of the proposed ‘architectural signal’ (AS) [26,33], whereby root:shoot ratio potentially changes during the year, reflecting variation in the number of leaves available to ‘feed’ developing roots at different times of the year. The model should also be capable of providing insight into the effects of lax and hard grazing on root development.

2. Materials and Methods

2.1. Field Plots

The experiment was conducted from 1986 to 1988 [9,10,11]. Briefly, white clover was removed using herbicide from established sheep-grazed perennial ryegrass swards at Palmerston North, New Zealand. The soil at the site is a fine silt loam formed from a blanket of wind-blown loess at least 2 m deep over marine sediments of an uplifted former shore platform. The experiment comprised 4 grazing managements including “lax” (L) (approx. 2000 and 3000 kg DM/ha, post- and pre-grazing herbage mass, respectively) and hard (H) (approx. 800 and 1500 kg DM/ha, post- and pre-grazing) which were maintained in 4 replicates in a Latin square design on 100 m2 plots from December 1986 to February 1988, so as to collect root data over an annual cycle. Four additional H and four L plots were used for L-to-H and H-to-L crossover grazing management treatments from November 1987 and their data are not reported here. Within this period new root growth was allowed to accumulate for approximately 40 days into core-holes of 75 mm diameter and approx. 700 mm depth, filled with builders’ sand [11] (online version of [11] contains photographs at pp. 33–34). Cores were then destructively harvested, root ingrowth determined as kg DM/ha/day ash free DM by weight loss on combustion of samples at 650 °C [34], and root length as km/ m2 using a grid intersect method [35], and a new set of ingrowth cores established. Mean root diameter was estimated from the ratio of root length:root mass recovered from ingrowth cores at each harvest [11]. For simplicity of presentation, in this paper and focus on the morphology of root mass deposition in the field, we present the root mass data and a relative root length, obtained by adjusting the root mass deposition for diameter differences between harvest dates.
The cycle of ingrowth core placement and harvest was repeated 12 times from October 1986 to May 1988 and data for 9 of those harvests are presented here to achieve one year of continuous observation of root formation rates for the 1988 calendar year. Grazing occurred ‘as needed’ to keep herbage mass of plots within predetermined target values above, as far as possible. L plots were grazed 16 times H plots 19 times during the experiment, with grazing interval 40 to 60 days in autumn-winter and as short as 15 days in spring-summer. Ryegrass tiller population density was determined at each root harvest using a coring method [36]. Herbage mass was determined 11 times during the experiment on dates approximately coordinated with root harvesting, using four 0.1 m2 quadrats (20 cm × 50 cm) cut to ground level, but these data were not coordinated with grazing and so herbage accumulation could not be determined from them. For December to August, herbage accumulation was estimated from weather and soil fertility data for the site using the model “Grow” [37] and for the remainder of the experiment herbage accumulation data was obtained from combining leaf elongation and tiller density data for 2 or 3 representative time periods within each interval between grazing events [9]. Root ingrowth (kg DM/ha/day) and herbage accumulation were plotted together to elucidate the relationship between them. Nitrogen fertilizer was applied at 9 kg N/ha, approximately twice monthly during the experiment, a rate judged from the literature [38] to replace N fixation by clover rhizobia.

2.2. Mechanistic Modeling of Phytomer Root Production

We selected Equation (5) of Matthew et al. [26] for use in this study, which, when reorganized to suit the data collected in this experiment can be expressed (with reconciliation of units below):
Fr = T × P × AS × Rn × Wr × UC/(b·x·f)
(kg/ha·day) = (no./m2) × (P/day) × (day/day) × (roots/P) × (mg/root) × (kg/mg) × (m2/ha)
where Fr denotes mass flux of root formation (kg DM/ha/day); T denotes tiller population density per m2; P is the number of phyllochrons per day (units: days−1); AS (architectural signal) is the ratio between the phyllochron at the time of leaf formation and the phyllochron at the time of root formation, denoted by [26] as It–d/It; Rn denotes the average number of roots produced by each phytomer on the tiller axis (assuming steady state turnover); Wr denotes the average weight of a single root (mg root−1); UC is a unit correction (0.01) to convert units of mg/m2 on the right hand side of Equation (1) to kg DM/ha/day on the left hand side; b is a calibration coefficient indicating any difference from unity in the comparative rates of root colonization of refilled cores and undisturbed soils; and f is an adjustment to represent the proportion of tillers which are large and/or dominant within the population and responsible for a majority of sward root formation activity while another sub-population of subservient daughter tillers produce little new root biomass. The coefficient b was determined by using a fibre optic viewing device (Ultrafine Technology, London, UK) to count and compare root arrival events in 3 pairs of 25 mm diameter plastic observation tubes with one core of each pair installed in the centre of a root ingrowth core and the other 50 cm away in undisturbed soil. This calibration was performed for 6 successive cycles of ingrowth cores over a period of approximately 8 months. Equation (1) was solved for Wr to estimate the mean dry weight per root (mg) required to generate the observed root ingrowth in refilled cores. Of the required entities for this calculation, Fr, T and b were measured in the field experiment as described above, P and DF were calculated, as described below, and Rn had to be assumed based on values reported in the literature [21,26]. The coefficient f is an estimate at this stage, taken from visual observation of tiller status in ryegrass swards similar to those used in the experiment.
To calculate P, a thermal time methodology was used with the base temperature and leaf appearance interval for ryegrass taken from subsequent New Zealand studies [39,40] as being 2.0 °C and 101 °C·d, respectively. Daily maximum and minimum temperature data for Palmerston North weather station NAN3238, approximately 1 km distant from the experiment site were downloaded from the ‘Cliflo’ online database of the New Zealand National Institute of Water and Atmospheric Research Ltd. (Auckland, New Zealand). The thermal time (°C·d/day) was then calculated for each day from installation to harvest of each cycle of root ingrowth cores and the thermal time per day averaged for each root harvest cycle. The ryegrass thermal time phyllochron of 101 °C·d was then divided by these values to obtain an estimated value in days for the average ryegrass leaf appearance interval within each of the 9 root harvest periods.
AS is a theoretical morphogenetic influence on Wr [26,33] which arises because leaf formation at any particular phytomer on the tiller axis precedes root formation at the same phytomer by about 5 phyllochrons (505 °C·d thermal time) on average [21,41]. Within that delay between leaf and root formation at the same phytomer the phyllochron can change because of seasonal factors like day length. This means that in spring fractionally more than one leaf-bearing phytomer feeds each root bearing phytomer, while in autumn the reverse would occur [33]. Because 5 phyllochrons (30–65 days) was broadly similar to the harvesting interval of root ingrowth cores (approx. 40 days), in the interests of simplicity AS was taken as the ratio between the mean value of P for a given root harvest and for the following harvest.
Correlations of P and AS (and their reciprocals) with root deposition and root mean diameter data were explored. In order to explore whether P was acting simply as a surrogate variable for day length and/or insolation, a cosine curve was constructed based on a 360° cycle over 365 days from the 22 December 1986, and data correlation with this seasonal cosine curve was also examined.
The experiment site is prone to summer drought with a mean November to April plant water deficit of 258 mm (range 106–432 mm) for the years 2002–2011 [42]. For the summer of 1986/1987, 22.4 mm rainfall was recorded at the nearby weather station between installing and harvesting first cycle of ingrowth cores (indicative of water deficit stress); and 133.5 mm between installing and harvesting the second cycle (indicative of water deficit alleviation).

2.3. Statistical Analysis

Field data from the H and L plots of each harvest were analyzed using a repeated measures option in Proc GLM of SAS (SAS Institute Inc., Cary, NC, USA), in order to obtain relevant standard errors for comparing annual means of H and L grazing management treatments, or to compare the harvest mean of H and L treatments at different harvest dates. Calculations of mean root weight (mg) using Equation (1), were performed in MicrosoftXL. Pearson correlation coefficients to assess similarities of seasonal trends for P, AS, and other entities, were calculated using Minitab version 10.51 (Minitab Inc., 2081 Enterprise Drive, State College, PA, USA).

3. Results

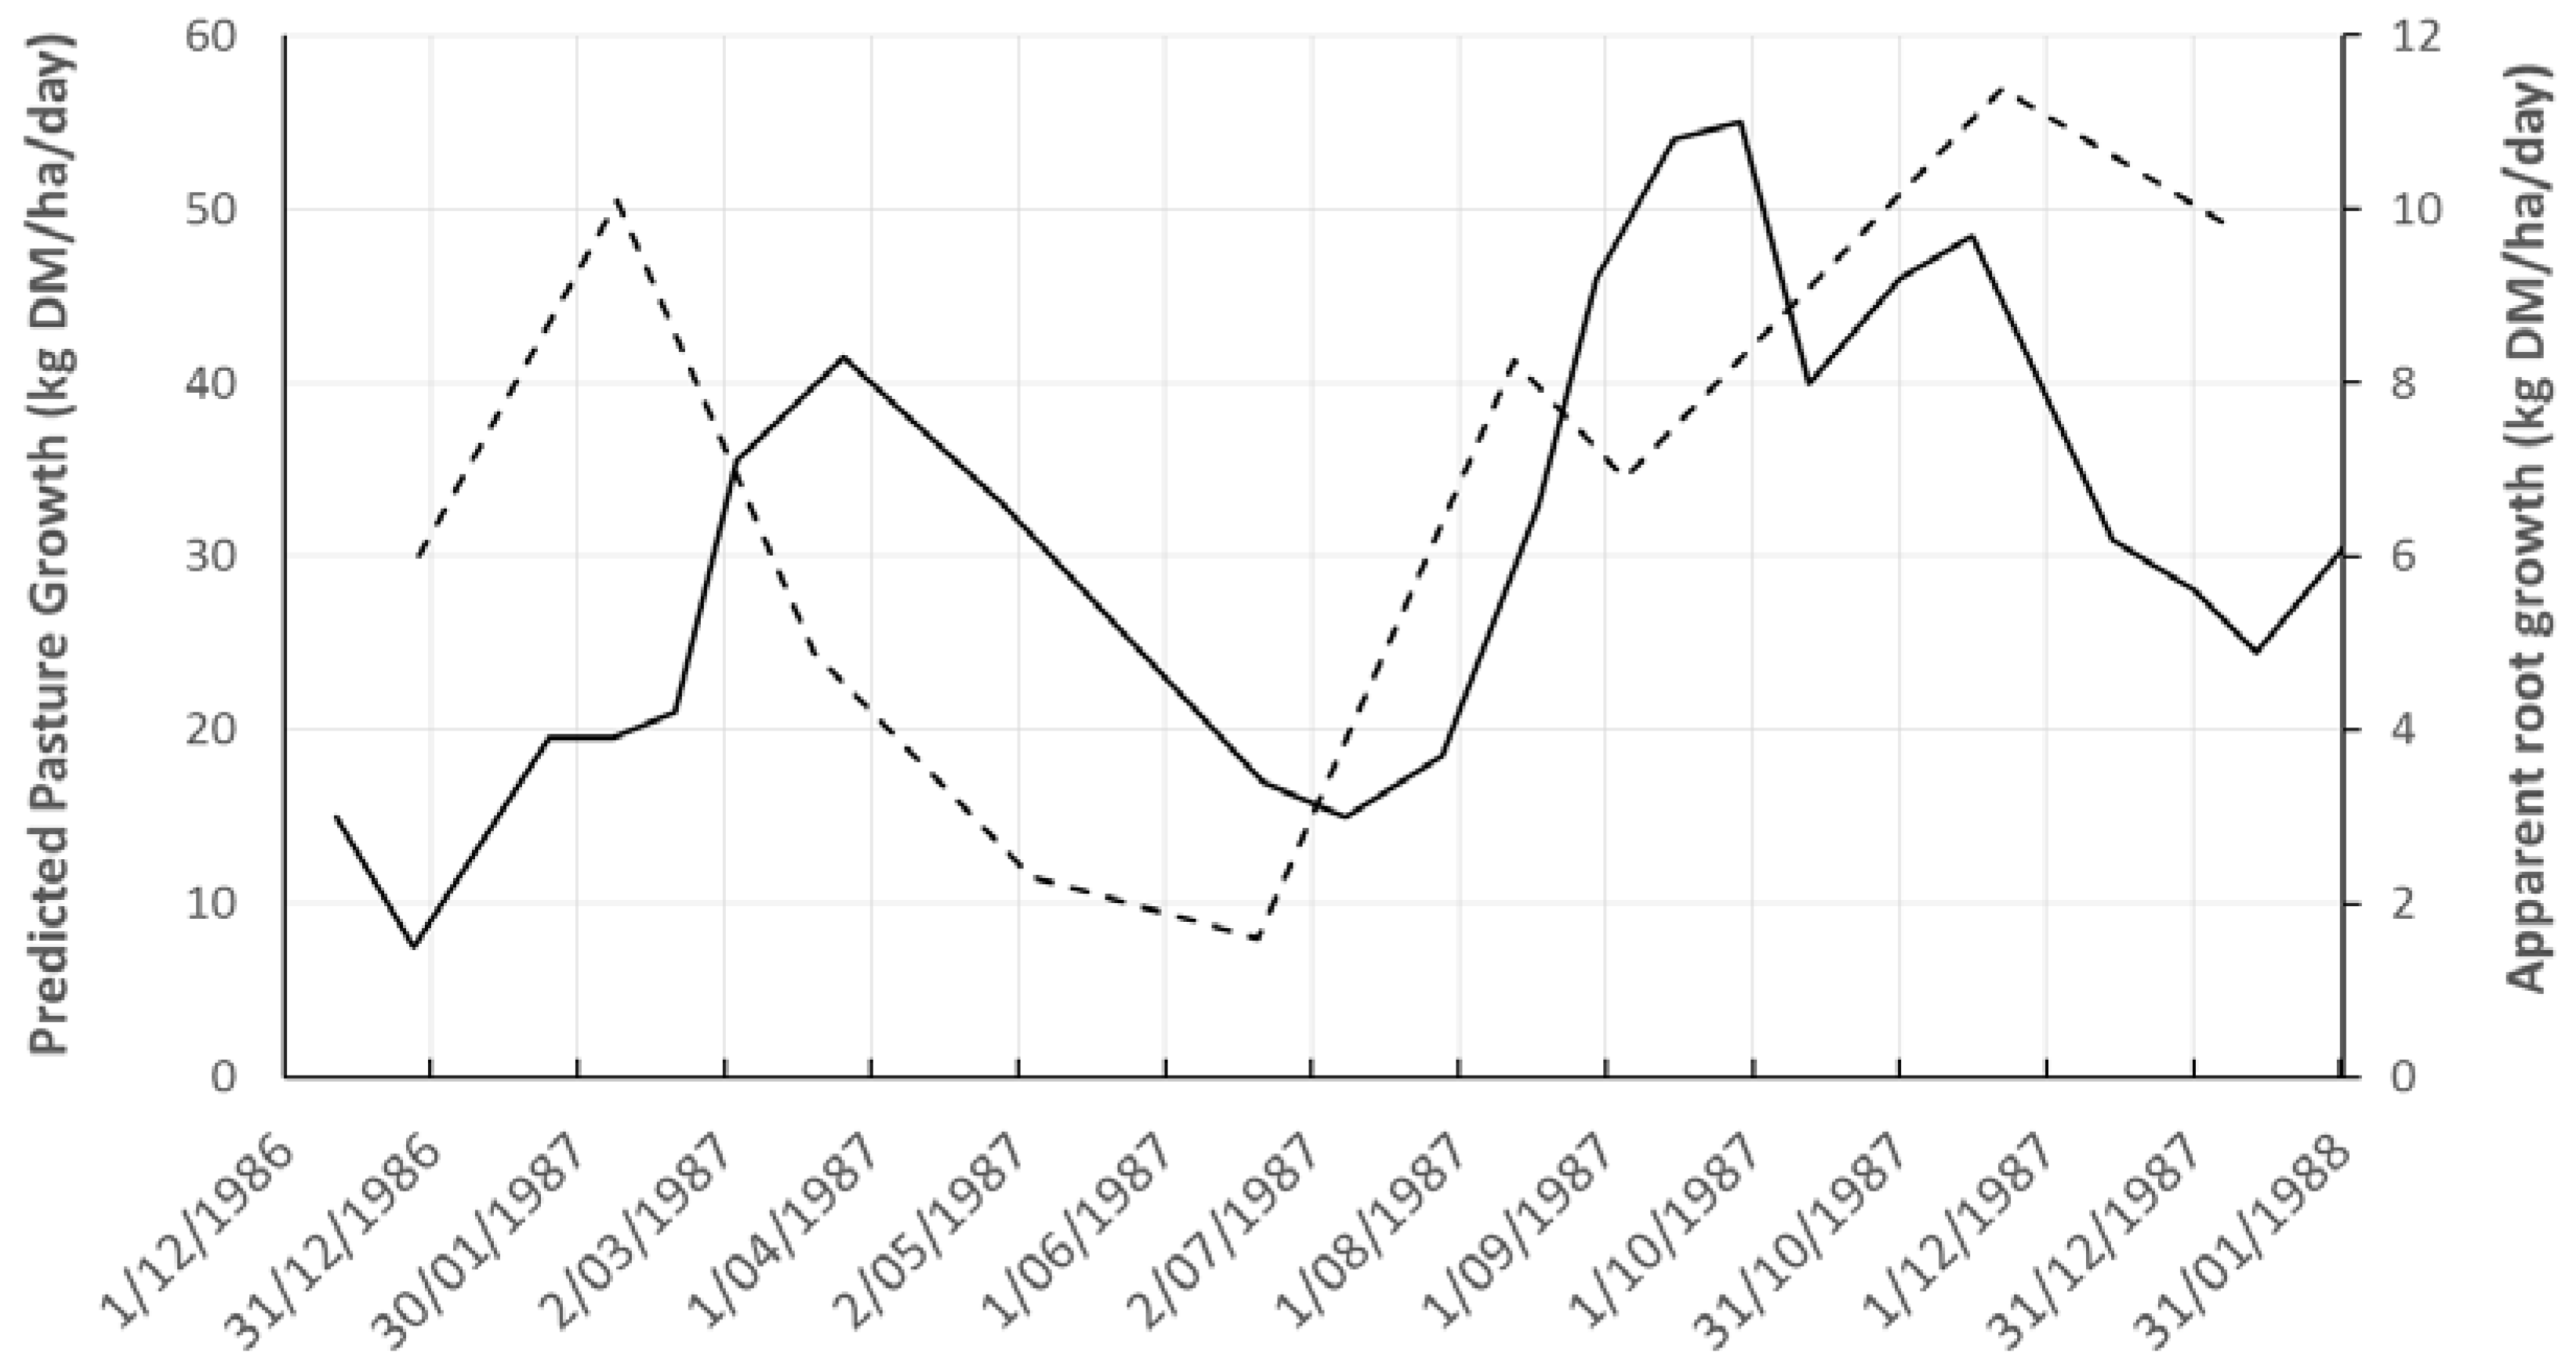
3.1. Root and Herbage Biomass Fluxes

Root biomass deposition differed little between L and H grazing management regimes, but showed an approximately logarithmic decline with increasing soil depth. Marked seasonal variation, ranging from a low of less than 2 kg DM/ha/day in June to a high of 13.5 kg DM/ha/day in November was also recorded (Table 1). The 250–600 mm soil depth could not be harvested from June to October because of a high water table, physically preventing core extraction. This should not have compromised root deposition data as no evidence of root formation below the water table was observed in this period. When plotted with herbage accumulation, root biomass deposition was found to be about 15% of above ground herbage accumulation, with a similar seasonality, but with root deposition bursts in late winter and following autumn rain, preceding the corresponding above ground events by approximately one month. However, the highest recorded values of Fr occurred during an early summer burst of root growth, in November (Figure 1). The early summer root growth would coincide with flowering, and this is explored further below.
Tiller population density was always significantly lower in L swards (mean 5270 tillers/m2) than in H swards (mean 7820 tillers/m2) and showed summer peaks and a winter low (Table 1). Mean herbage mass averaged over the whole experiment was 2700 and 1095 kg DM/ha for L and H grazing treatments, respectively. This gives an indicative mean tiller weight of 51 mg DM/tiller for L swards, and 14 mg/tiller for H swards.

3.2. Determination of Phyllochron (P) and Rainfall Pattern

The accumulated thermal time from the National Institute of Water and Atmospheric Research (NIWA) weather data for the 1987 calendar year was 4174 °C·d, which converts to 41.3 phyllochrons per year. Mean phyllochron for root ingrowth periods ranged from 6.4 days in December/January to a little over 13 days in June/July (Table 2). Notable features in the seasonal pattern of thermal time units per day are that the summer maximum and winter minimum follow the longest and shortest days, respectively, by about one month, and that the period of most rapid temperature rise following winter in this particular year, which could potentially create AS responses, occurred in late September, October and November (Figure 2).

3.3. Determination of Architectural Signal (AS), and Root Dry Weight Per Phytomer (Wr)

Based on values reported in the literature [21,26] Rn was taken as 1.3; based on comparing counts of root arrivals at the centre of ingrowth cores and in nearby undisturbed soil as described above, b was taken as 0.5 [11]; and based on dissection of ryegrass plants from a field pasture, f was taken as 0.8. Inclusion of these values in Equation (1), together with ingrowth core root deposition data from Equation 1 yielded Wr values varying seasonally from 0.6 mg in winter to 2.3 mg in early summer in L-grazed swards with corresponding values of 0.2 mg and 1.6 mg for H-grazed swards (Table 2).

3.4. Relationship between Root Traits and Seasonal Change in Phyllochron (P) and Architectural Signal (AS)

An unexpected finding in the root data was a tendency for negative correlation between Fr and root diameter. While the correlation between Fr (0–600) and mean root diameter was non-significant (p = 0.203), the correlation between Fr (70–600) and mean root diameter neared significance (r = −0.591, p = 0.094) and the correlation between AS and mean root diameter was statistically significant (r = −0.700, p = 0.036).
Correlation between thermal time elapsed during each root ingrowth core sampling cycle, as defined by P (or its reciprocal) and the root deposition and diameter traits, was typically not significant, while for AS (or its reciprocal) there was normally a strong correlation. The cosine function was significantly correlated with the root traits, but less so than AS (Table 3).
Visual inspection of seasonal alignment of Fr, RRL and AS, indicates that the November Fr peak in root deposition coincides with the seasonal peak in the AS signal, and that increased Fr associated with decreased root diameter at this time combines to create greater seasonal response magnitude in RRL (Figure 3).

4. Discussion

4.1. Ingrowth Core Data Provides Insight Complementary to that from Other Techniques

Understanding of the field behavior of the root system of grasses remains partial. The difficulty in developing suitable measurement techniques is one factor in this situation. Window methods [43,44] can give information about rates of root tip arrival and some information about proliferation at the two-dimensional surface of the window. This can be regarded as a random sample of undisturbed soil and can provide data on traits like root tip elongation rate or interactions with soil fauna, but it is difficult to build up a complete three-dimensional picture of the whole root or quantify mass flow using this technique alone. Core break methods can yield information on root length density within the soil profile but have been found to be of limited accuracy [45]. Root length density data does allow inference about nutrient and water capture, not possible by other methods [46]. Destructive sampling in field swards provides limited insight into root dynamics because of the slow decomposition rate of dead roots, resulting in a high proportion of dead roots in samples that are difficult to distinguish from live roots [9,11]. Destructive sampling of plants grown in deep pots or pipes for a limited period of time provides valuable information on inherent genetic differences in root biomass distribution with soil depth and root:shoot biomass allocation ratios, making this technique potentially valuable for plant breeding purposes [14,15,16]. Studying plants grown in hydroponic culture allows building of understanding on whole root characteristics, or root:shoot relations [21,47], but leaves uncertainties about extrapolation of results to the field, since the hydroponic environment tends to be unnatural in many respects, including usually the light and temperature regime, and lack of physical resistance to root elongation.
The particular advantage of ingrowth cores is that they allow comparison between experiment factors (in this case L and H grazing management and season) of mass flow of root DM. While installation of ingrowth cores creates a disturbance to root growth, this approach does allow inference and insight complementary to that obtained from techniques described above, and fills a gap in present knowledge by providing information about the seasonal cycle of root development and deposition in grazed field swards.

4.2. Signals Determining Seasonality of Root Deposition (Fr) and Root Diameter

The finding that field swards will generate a flush of root growth both at the end of winter and after a summer drought event (Figure 1) would appear to indicate a temporary increase in substrate allocation to roots. The seasonal timing of these two root growth events does not match the postulated AS and would appear to arise from root:shoot ratio control by the plant, several models for which were described by Wilson [48]. In short, there is evidence from the field data of root-shoot ‘cross-talk’ that ensures seasonal shoot growth flushes are preceded by root deposition activity that will presumably deliver N and other nutrients required by the leaves. Such responses, especially post-drought root responses would be variable from year to year and this may partly explain variation in reported seasonal patterns of root deposition. This point is also relevant to both extension advice to farmers on pasture husbandry and to modeling of pasture herbage accumulation. Farmers can be advised to avoid high grazing pressure when root system recovery is occurring, and when modeling pasture herbage accumulation based on temperature or radiation a correction term can be included for the temporary period of preferential root allocation.
With respect to the proposed ‘architectural signal’ termed here AS and first identified theoretically almost two decades ago [26], this is the first evaluation, to the authors’ knowledge, of field data for indication of the expression of such a signal. Despite theoretical calculations showing an AS could exist, the actual existence of the signal, can not necessarily be assumed, because various plant internal compensations such as seasonal differences in area of individual leaves or their photosynthesis rates could neutralize it. Since the identification of the theoretical AS signal, one question has been: ‘How could it be measured?’ In this study, the finding that root biomass deposition rates of field swards correlate more strongly with the estimated value of the AS, than thermal time as represented by P, or a cosine curve representing insolation, provides circumstantial evidence for, but not proof of the operation of the AS as a factor in determining seasonality of root growth in these swards. The fact that total root deposition correlates with the AS indicates that root:shoot partitioning is altered seasonally by the AS, not just the weight of individual roots. If AS reflects the relative mass of tiller source and sink tissues, this is logical, but confirmation from further research would be desirable. By way of comparison with P-values assumed here based on thermal time studies for ryegrass in New Zealand, longer P-values of 9 and 35 days for summer and winter, respectively, have been reported from a colder UK climate [49]
Prior to making the thermal time calculation from the temperature data (Figure 2), we intuitively expected the AS signal earlier in the spring and autumn than indicated Figure 3. It can be seen that there was indeed a peak in Fr coinciding with the early summer peak in AS, and there was also low root growth coincident with an AS less than 1.0 in June (Figure 3). Logically, if root allocation is driven by a regular pattern of root initiation and shoot:root allocation of DM on senescence of successive leaves (Figure 4), except perhaps for some variation during the flowering period [50], Fr should correlate best with seasonal changes in thermal time. To the contrary, correlations between Fr in the various soil depth horizons and P or its reciprocal were generally non-significant, while correlations between Fr and AS or its reciprocal were mostly strongly significant, even though the AS clearly does not account for the ‘late winter’ and ‘drought recovery’ root flushes.
Previously, root diameter reduction in spring was assumed to relate to the appearance of large numbers of new tillers, many of these formed at the base of flowering tillers [9,11]. It is possible, however, that more rapid elongation results in narrower diameter roots and vice versa. This point is deserving of future study.

4.3. Reconciliation of Fr Data from Field Swards with Phytomer Turnover Models of Root Formation

In hydroponic culture where almost every phytomer on the tiller axis produces one or more roots in an approximately steady state turnover, roots of ryegrass typically cease dry weight increase and main axis elongation about five phyllochrons after initiation [21]. This cessation presumably arises from the accumulation of younger roots higher on the tiller axis capturing the basipetal flow of photosynthate from leaves before it reaches roots more distant from the youngest root-bearing phytomer [21,24]. In this context, Equation (1) is not intended to imply that all the substrate from one leaf is allocated to root formation at a particular phytomer, but rather that over the period of root elongation the sum of partial contributions from the contributing leaves is equivalent to the total contribution of one leaf.
It is useful at this point to review the morphology of a ryegrass tiller base (Figure 4), and to note that live roots are present over a span of approximately 10–12 phytomers at any one time with young roots forming above, and older roots dying below [21,41]. A similar behavior is observed in wheat and rice [22,23,24,51].
An inference from Figure 4 is that ryegrass roots will be ‘architecturally’ limited in depth penetration by the root tip elongation attainable within the ‘feeding period’ after initiation (as mentioned above, typically five phyllochrons in hydroponic culture). It is a hypothesis for further study that the root elongation period may be extended either if a daughter tiller has initiated at a particular phytomer and is feeding substrate to the region of the tiller axis where that root is attached, or if new root formation is temporarily suppressed. This latter point is a very interesting insight from our data. Both an earlier field study in New Zealand [31], and a UK glasshouse study [52] found that that new root initiation does not occur in ryegrass in dry summer conditions. It seems logical then, that suspension of new root initiation would provide for supply of substrate moving basipetally to continue to reach existing roots for an extended period allowing those roots to penetrate below 250 mm soil depth in summer (Figure 3).
The use of the field root deposition rate data (Fr) to estimate individual root dry weight, Wr is somewhat hypothetical, but instructive even so, as it gives a preliminary evaluation, subject to refinement, of the morphological details of root system formation. Of the parameters assumed for this calculation in this paper, a mean value for Rn can be determined by low power microscopy of tiller bases collected from a sward [26], and the same would be true for f. The value for b used here was obtained by calibration during a subsequent experiment [11], though the calibration work was time consuming. It is intuitively likely that low nutrient levels in the builders sand used to fill the ingrowth cores might have reduced root colonization and resulted in a lower value for b. This might be overcome in future experiments either by adding a small amount of slow release fertilizer to the material used to refill root ingrowth cores or by refilling cores with the same soil material bored out and using some kind of sleeve to delineate the ingrowth core for future harvest, as is common practice in other studies.
Early discussion of ryegrass root systems assumed an annual root replacement event [31,53] and this was at least partially supported by the pattern of new root emergence through an annual cycle [32]. This does not reconcile well with the picture of phytomer-based steady state turnover implied by hydroponic studies [21], nor by the morphology seen in Figure 4. However, the data presented here go a considerable way to showing how a phytomer based plant morphology can deliver an annual cycle of root development under field conditions. Several signals operate to modify the underlying steady state turnover generated by new phytomer addition on the tiller axis. There is evidence for seasonal variation in root:shoot allocation (Figure 1; [50]), P varies seasonally (Figure 2) and root deposition rates would be expected to be influenced. There is also evidence that an AS further modifies seasonality of root deposition with suppression of root deposition in mid-winter and enhancement in early summer, possibly with associated effects on root diameter. Lastly, where summer moisture deficit suppresses new root initiation, existing roots should receive additional substrate and penetrate deeper.
Considering that ryegrass tillers in hydroponic culture [21] had a mean dry weight of 425 mg with 191 mg root dry weight, comprising on average 15.2 live roots per tiller weighing 12.6 mg, the Wr values of 0.2 to 2.3 mg DW root−1 (Table 2) seem low but credible and indicate that these calculations are worth developing in future studies for the insight they can offer on root dynamics. A perspective that emerges from this calculation is that although Fr is little changed under hard grazing, dividing the smaller substrate pool among a larger tiller population density results in a proportionately larger drop in allocation to individual roots, in H-grazed swards, especially in winter, unless there is some compensation within the tiller. For example, a decrease in Rn, in H-grazed swards could neutralize the Wr difference between L and H swards obtained from Equation (1) here. Further investigation would be desirable, since this point is important when providing husbandry recommendations to farmers, as an extension opinion sometimes promoted is that hard grazing to enhance tiller density will be beneficial [54]. While hard grazing does indeed increase tiller density in most situations (Table 1), the implications of defoliation severity for root weight reduction (Table 2), and sward leaf area index reduction [55] also need to be considered.

5. Conclusions

Root deposition rate as determined by an ingrowth core technique was about 15% of above ground herbage accumulation and showed a very similar seasonal pattern.
Peaks of root deposition after summer drought and in late winter preceded above ground herbage accumulation by about one month and likely relate to conventional root:shoot signaling.
Data support the existence of a plant morphology-driven ‘architectural signal’ partly determining root deposition rate through seasonal changes in the number of leaves feeding sites where roots are being formed.
The architectural signal theoretically results in root formation being boosted in rising temperatures and suppressed in falling temperatures and field data correlate significantly with the theoretical signal.
A model based on the phytomer structure of the tiller axis produced credible values for the weight of individual roots in field swards as affected by season and grazing intensity. A tentative insight from this model for confirmation by further research is that hard grazing will limit individual root size, especially in winter.
The root system of perennial ryegrass is dynamic, with an inbuilt tendency to shift deposition activity deeper in summer and shallower in winter.

Supplementary Files

Supplementary File 1

Acknowledgments

The first author warmly thanks Alex C.P. Chu and John Hodgson for their guidance as Supervisors. The field study of ryegrass root deposition over a 12 month cycle was labor intensive and was assisted by more than a dozen people at different times [11]. We thank the C. Alma Baker Trust, The Massey University Research Fund, The Massey University Agricultural Research Foundation, and the T.R. Ellett Agricultural Research Trust for funding support. We thank Cécile Duranton for preparation of Figure 1.

Author Contributions

This work was a part of the PhD study of Cory Matthew with Alec Mackay as supervisor and active participant. Arif Hasan Khan Robin contributed expert knowledge on root turnover in the compilation of the manuscript.

Conflicts of Interest

The authors declare no conflict of interest

References

  1. Parsons, A.J.; Leafe, E.L.; Collett, B.; Stiles, W. The physiology of grass production under grazing. I. Characteristics of leaf and canopy photosynthesis of continuously-grazed swards. J. Appl. Ecol. 1983, 20, 117–126. [Google Scholar] [CrossRef]
  2. Parsons, A.J.; Leafe, E.L.; Collett, B.; Penning, P.D.; Lewis, J. The physiology of grass production under grazing. II. Photosynthesis, crop growth and animal intake of continuously-grazed swards. J. Appl. Ecol. 1983, 20, 127–139. [Google Scholar] [CrossRef]
  3. Korte, C.J. Tillering in ‘Grasslands Nui’perennial ryegrass swards 2. Seasonal pattern of tillering and age of flowering tillers with two mowing frequencies. N. Z. J. Agric. Res. 1986, 29, 629–638. [Google Scholar] [CrossRef]
  4. Garwood, E.A. Seasonal variation in appearance and growth of grass roots. Grass Forage Sci. 1967, 22, 121–129. [Google Scholar] [CrossRef]
  5. Chapman, D.F.; Lemaire, G. Morphogenetic and structural determinants of plant regrowth after defoliation. In Proceedings of the XVII International Grassland Congress, Palmerston North, New Zealand, 8–21 February 1993; pp. 95–104.
  6. Bahmani, I.; Hazard, L.; Varlet-Grancher, C.; Betin, M.; Lemaire, G.; Matthew, C.; Thom, E.R. Differences in tillering of long-and short-leaved perennial ryegrass genetic lines under full light and shade treatments. Crop Sci. 2000, 40, 1095–1102. [Google Scholar] [CrossRef]
  7. Van Loo, E.N. On the Relation between Tillering, Leaf Area Dynamics and Growth of Perennial Ryegrass (Lolium perenne L.). Ph.D. Thesis, Wageningen University, Wageningen, The Netherlands, May 1993. [Google Scholar]
  8. Sartie, A.M.; Matthew, C.; Easton, H.S.; Faville, M.J. Phenotypic and QTL analysis of herbage production-related traits in perennial ryegrass (Lolium perenne L.). Euphytica 2011, 182, 295–315. [Google Scholar] [CrossRef]
  9. Matthew, C.; Xia, J.; Chu, A.; Mackay, A.; Hodgson, J. Relationship between root production and tiller appearance rates in perennial ryegrass (Lolium perenne L.). In Plant Root Growth—An Ecological Perspective; Atkinson, D., Ed.; British Ecological Society Special Publication, Blackwell Scientific Publications: London, UK, 1991; pp. 281–290. [Google Scholar]
  10. Xia, J.X. The Effects of Defoliation on Tissue Turnover and Pasture Production in Perennial Ryegrass, Prairie Grass and Smooth Bromegrass Pasture. Ph.D. Thesis, Massey University, Palmerston North, New Zealand, 1991. [Google Scholar]
  11. Matthew, C. A Study of Seasonal Root and Tiller Dynamics in Swards of Perennial Ryegrass (Lolium perenne L.). Ph.D. Thesis, Massey University, Palmerston North, New Zealand, 1993. Available online: http://mro.massey.ac.nz/xmlui/bitstream/handle/10179/3289/02_whole.pdf (accessed on 11 June 2016). [Google Scholar]
  12. Davidson, R.L. Root systems—The forgotten component of pastures. In Plant Relations in Pastures; Wilson, J.R., Ed.; CSIRO: Melbourne, Australia, 1978; pp. 86–94. [Google Scholar]
  13. Troughton, A. The Underground Organs of Herbage Grasses; Bulletin No. 44; Commonwealth Bureau of Pastures and Field Crops: Hurley, UK, 1957. [Google Scholar]
  14. Crush, J.R.; Nichols, S.N.; Easton, H.S.; Ouyang, L.; Hume, D.E. Comparisons between wild populations and bred perennial ryegrasses for root growth and root/shoot partitioning. N. Z. J. Agric. Res. 2009, 52, 161–169. [Google Scholar] [CrossRef]
  15. Crush, J.R.; Easton, H.S.; Waller, J.E.; Hume, D.E.; Faville, M.J. Genotypic variation in patterns of root distribution, nitrate interception and response to moisture stress of a perennial ryegrass (Lolium perenne L.) mapping population. Grass For. Sci. 2007, 62, 265–273. [Google Scholar] [CrossRef]
  16. Crush, J.R.; Popay, A.J.; Waller, J. Effect of different Neotyphodium endophytes on root distribution of a perennial ryegrass (Lolium perenne L.) cultivar. N. Z. J. Agric. Res. 2004, 47, 345–349. [Google Scholar] [CrossRef]
  17. Cartes, P.; Jara, A.A.; Pinilla, L.; Rosas, A.; Mora, M.L. Selenium improves the antioxidant ability against aluminium-induced oxidative stress in ryegrass roots. Ann. Appl. Biol. 2010, 156, 297–307. [Google Scholar] [CrossRef]
  18. Xu, W.H.; Liu, H.; Ma, Q.F.; Xiong, Z.T. Root exudates, rhizosphere Zn fractions, and Zn accumulation of ryegrass at different soil Zn levels. Pedosphere 2007, 17, 389–396. [Google Scholar] [CrossRef]
  19. Bircham, J.S.; Hodgson, J. The influence of sward condition on rates of herbage growth and senescence in mixed swards under continuous stocking management. Grass For. Sci. 1983, 38, 323–331. [Google Scholar] [CrossRef]
  20. Donaghy, D.J.; Fulkerson, W.J. Plant-soluble carbohydrate reserves and senescence—Key criteria for developing an effective grazing management system for ryegrass-based pastures: A review. Aust. J. Exp. Agric. 2001, 41, 261–275. [Google Scholar]
  21. Robin, A.H.K.; Matthew, C.; Crush, J. Time course of root initiation and development in perennial ryegrass—A new perspective. Proc. N. Z. Grassl. Assoc. 2010, 72, 233–239. [Google Scholar]
  22. Robin, A.H.K.; Uddin, M.J.; Bayazid, K.N. Polyethylene glycol (PEG)-treated hydroponic culture reduces length and diameter of root hairs of wheat varieties. Agronomy 2015, 5, 506–518. [Google Scholar] [CrossRef]
  23. Robin, A.H.K.; Uddin, M.J.; Afrin, S.; Paul, P.R. Genotypic variations in root traits of wheat varieties at phytomer level. J. Bangladesh Agric. Univ. 2014, 12, 45–54. [Google Scholar] [CrossRef]
  24. Robin, A.H.K.; Matthew, C.; Uddin, M.J.; Bayazid, K.N. Salinity-induced reduction in root surface area and changes in major root and shoot traits at the phytomer level in wheat. J. Exp. Bot. 2016. [Google Scholar] [CrossRef] [PubMed]
  25. Steen, E. Variation in root growth in a grass ley studied with a mesh bag technique. Swed. J. Agric. Res. 1984, 14, 93–97. [Google Scholar]
  26. Matthew, C.; Yang, J.Z.; Potter, J.F. Determination of tiller and root appearance in perennial ryegrass (Lolium perenne) swards by observation of the tiller axis, and potential application in mechanistic modelling. N. Z. J. Agric. Res. 1998, 41, 1–10. [Google Scholar] [CrossRef]
  27. Bos, H.J.; Neuteboom, J.H. Morphological analysis of leaf and tiller number dynamics of wheat (Triticum aestivum L.): Responses to temperature and light Intensity. Ann. Bot. 1998, 81, 131–139. [Google Scholar] [CrossRef]
  28. Hitch, P.A.; Sharman, B.C. Vascular pattern of festucoid grass axes, with particular reference to nodal plexi. Bot. Gaz. 1971, 132, 38–56. [Google Scholar] [CrossRef]
  29. Etter, A.G. How Kentucky bluegrass grows. Ann. MO. Bot. Gard. 1951, 38, 293–375. [Google Scholar] [CrossRef]
  30. Henessy, D.; O’Donovan, M.; French, P.; Laidlaw, A.S. Factors influencing tissue turnover during winter in perennial ryegrass-dominated swards. Grass For. Sci. 2008, 63, 202–211. [Google Scholar] [CrossRef]
  31. Caradus, J.R.; Evans, P.S. Seasonal root formation of white clover, ryegrass and cocksfoot in New Zealand. N. Z. J. Agric. Res. 1977, 20, 337–342. [Google Scholar] [CrossRef]
  32. Jacques, W.A. Root development in some common New Zealand pasture plants. IX. The root replacement pattern in perennial ryegrass (Lolium perenne). N. Z. J. Sci. Technol. A 1956, 38, 160–165. [Google Scholar]
  33. Matthew, C.; Van Loo, E.N.; Thom, E.R.; Dawson, L.A.; Care, D.A. Understanding shoot and root development. In Proceedings of the XIX International Grassland Congress, Sao Pedro, Brazil, 11–21 February 2001; pp. 19–27.
  34. Bohm, W. Methods of studying root systems. In Ecological Studies—Analysis and Synthesis; Billings, W.D., Golley, F., Lange, O.L., Olson, J.S., Eds.; Springer-Verlag: Berlin, Germany, 1979; Volume 33. [Google Scholar]
  35. Tennant, D. A test of a modified line intersect method of estimating root length. J. Ecol. 1975, 63, 995–1001. [Google Scholar] [CrossRef]
  36. Mitchell, K.J.; Glenday, A.C. The tiller population of pasture. N. Z. J. Agric. Res. 1958, 1, 305–318. [Google Scholar]
  37. Butler, B.M.; Matthew, C.; Heerdegen, R. The greenhouse effect—What consequences for seasonality of pasture production. Weather Clim. 1990, 10, 55–60. [Google Scholar]
  38. Hoglund, J.H.; Crush, J.R.; Brock, J.L.; Carran, R.A. Nitrogen fixation in pasture. 12. General discussion. N. Z. J. Exp. Agric. 1979, 1, 45–51. [Google Scholar]
  39. Moot, D.J.; Scott, W.R.; Roy, A.M.; Nicholls, A.C. Base temperature and thermal time requirements for germination and emergence of temperate pasture species. N. Z. J. Agric. Res. 2000, 43, 15–25. [Google Scholar] [CrossRef]
  40. Black, A.D.; Moot, D.J.; Lucas, R.J. Seedling development and growth of white clover, Caucasian clover, and perennial ryegrass sown in field and controlled environments. Proc. N. Z. Grassl. Assoc. 2002, 64, 197–204. [Google Scholar]
  41. Yang, J.Z.; Matthew, C.; Rowland, R.E. Tiller axis observations for perennial ryegrass (Lolium perenne) and tall rescue (Festuca arundinacea): Number of active phytomers, probability of tiller appearance, and frequency of root appearance per phytomer for three cutting heights. N. Z. J. Agric. Res. 1998, 41, 11–18. [Google Scholar] [CrossRef]
  42. Matthew, C.; van der Linden, A.; Hussain, S.; Easton, H.S.; Hatier, J.-H.B.; Horne, D.J. Which way forward in the quest for drought tolerance in perennial ryegrass. Proc. N. Z. Grassl. Assoc. 2012, 74, 195–200. [Google Scholar]
  43. Sackville Hamilton, C.A.G.; Cherrtt, J.M. The development of clover and ryegrass root systems in a pasture and their interactions with the soil fauna. In Plant Root Growth—An Ecological Perspective; Atkinson, D., Ed.; British Ecological Society Special Publication, Blackwell Scientific Publications: London, UK, 1991; pp. 291–301. [Google Scholar]
  44. Evans, P.S. The effect of repeated defoliation to three different levels on root growth of five pasture species. N. Z. J. Agric. Res. 1973, 16, 31–34. [Google Scholar] [CrossRef]
  45. Bland, W.L. Estimating root length density by the core break method. Soil Sci. Soc. Am. J. 1989, 53, 1595–1597. [Google Scholar] [CrossRef]
  46. De Willigen, P.; van Noordwijk, M. Roots, Plant Production and Nutrient Use Efficiency. Ph.D. Thesis, Wageningen University, Wageningen, The Netherlands, 1987. [Google Scholar]
  47. Gastal, F.; Saugier, B. Relationships between nitrogen uptake and carbon assimilation in whole plants of tall fescue. Plant Cell Environ. 1989, 12, 407–418. [Google Scholar] [CrossRef]
  48. Wilson, J.B. A review of evidence on the control of root:shoot ratio in relation to models. Ann. Bot. 1988, 61, 433–449. [Google Scholar]
  49. Davies, A. Structure of the grass sward. In Animal Production from Temperate Grassland; Gilsenan, B., Ed.; Irish Grassland and Animal Production Association: Dublin, Ireland, 1977; pp. 36–44. [Google Scholar]
  50. Troughton, A. Further studies on the relationship between root and shoot systems of grasses. J. Br. Grassl. Soc. 1960, 15, 4–47. [Google Scholar] [CrossRef]
  51. Robin, A.H.K.; Saha, P.S. Morphology of lateral roots of twelve rice cultivars of Bangladesh: Dimension increase and diameter reduction in progressive root branching at the vegetative stage. Plant Root 2015, 9, 34–42. [Google Scholar] [CrossRef]
  52. Troughton, A. Production of root axes and leaf elongation in perennial ryegrass in relation to dryness of the upper soil layer. J. Agric. Sci. 1980, 95, 533–538. [Google Scholar] [CrossRef]
  53. Stuckey, I.H. Seasonal growth of grass roots. Am. J. Bot. 1941, 28, 486–491. [Google Scholar] [CrossRef]
  54. Edwards, G.R.; Chapman, D.F. Plant responses to defoliation and relationships with pasture persistence. In Pasture Persistence Symposium; Mercer, C.F., Ed.; New Zealand Grassland Association: Dunedin, New Zeaalnd, 2011; pp. 99–108. [Google Scholar]
  55. Matthew, C.; Lemaire, G.; Sackville Hamilton, N.R.; Hernandez-Garay, A. A modified self-thinning equation to describe size/density relationships for defoliated swards. Ann. Bot. 1995, 76, 579–587. [Google Scholar] [CrossRef]
Figure 1. Seasonality of new root deposition (– – –) (Fr) in perennial ryegrass swards at Palmerston North, plotted with herbage accumulation rate (––––––) estimated by computer modeling from weather data, as described by Butler et al. [37]. Peaks of root growth occurred after summer rain (January–February 1987), in late winter (August 1987), and approximately coincident with flowering in early summer (November 1987).
Agriculture 06 00028 g001
Figure 2. Seasonal variation in daily thermal time (°C·d/day) for each of 9 ingrowth core placement and harvest cycles completed between December 1986 and January 1988.
Agriculture 06 00028 g002
Figure 3. Seasonal pattern of root deposition in 3 soil depths and relative root length (RRL) for mean of Lax- and Hard-grazed swards at Palmerston North, New Zealand. The hypothetical ‘architectural signal’ (AS) arising from seasonal increase or decrease in the number of leaves expected to feed each root is also shown, and correlates with root deposition significantly better than thermal time or a cosine curve representing insolation (Table 3).
Agriculture 06 00028 g003
Figure 4. A ryegrass tiller base with 6 visible tillers or buds, representing approximately 12 phytomers on the tiller axis, since alternate tiller buds appear alternately on opposite sides. The young white roots on the uppermost root bearing phytomer are typically short and unbranched, having only recently been initiated, and branching begins one or two phyllochrons later [24]. At around 12 phytomers distance from the uppermost root, roots are typically highly branched and dead or dying [21]. An animation showing roots and leaves in ‘steady state’ turnover on the ryegrass tiller axis, as in hydropnic culture can be viewed at Supplementary file.
Agriculture 06 00028 g004
Table 1. Apparent root deposition as measured by ingrowth cores (kg DM/ha/day ash-free DM), mean root diameter (mm), relative root length (RRL), and tiller population density for three soil depths and two grazing managements determined from ingrowth core samples for the period December 1986 to January 1988. Dates shown are those for the median of each cycle of ingrowth core placement and harvest.
Harvest Number and Median Date of Root Ingrowth Core Capture
TraitGrazingSoil Depth2345678910MEANS.E. 1S.E. 2
(mm)25 December 19863 February 198713 March 19871 May 198710 June 19872 August 198726 September 198714 November 198729 December 1987
Root deposition (kg DM/ha/day)L0–704.37.63.12.31.26.14.26.85.94.60.40.9
70–2501.83.31.40.9-224.62.82.20.30.6
250–6001.10.60.40.1- 3--2.41.41.10.30.4
0–6007.211.54.93.31.88.16.213.810.1
H0–703.863.60.90.95.84.87.87.74.60.40.9
70–2502.13.41.80.40.42.62.83.53.12.20.30.6
250–6001.90.80.60.1- 3--1.831.40.30.4
0–6007.810.261.41.38.47.613.113.8
Mean0–7046.83.31.61.164.57.36.84.60.30.6
70–2501.93.41.60.60.52.32.442.92.20.20.4
250–6001.30.60.50.1- 3--2.22.21.20.20.3
Mean diameter (mm)Mean 0.240.250.270.220.30.310.210.180.220.240.0110.011
Relative root length 4Mean 0.811.150.490.320.120.591.092.71.741n.d. 5n.d.
Tiller population density (Tillers·m−2)L 4183825756154624385352844624440466065270622289
H 572511,00979277266660666066606748611,1197820
Notes: 1 Standard error for testing differences between H and L grazing; 2 Standard error for testing seasonal differences; 3 No root deposition as water table rose to approx. 300 mm soil depth at this time; 4 Denotes root length recovered from ingrowth cores on a scale where the annual mean = 1.0; 5 Not determined.
Table 2. Mean values of phyllochron (P), architectural signal (AS) and modelled weight per root (Wr, mg) using Equation (1) for the 9 ingrowth core cycles from December 1986 to January 1988. Dates shown are those for the mid-point of each ingrowth core cycle. AS is a numerical index quantifying a theoretical tendency, predicted by plant architecture considerations [26], for one root to be fed by fewer leaves in autumn and more leaves in early summer.
GrazingHarvest Number and Median Date of Root Ingrowth Core Capture
2345678910MEAN
25 December 19863 February 198713 March 19871 May 198710 June 19872 August 198726 September 198714 November 198729 December 1987
P 1 (days) 6.46.67.49.413.113.210.57.66.68.8a
AS 1.030.970.890.790.720.991.261.381.15
WrL1.10.90.60.60.61.91.42.31.01.2
H0.80.60.50.20.21.61.21.30.80.8
Note: 1 Total thermal time for the 1987 calendar year was 4174 °C·d; at 101 °C·d/leaf this is 43.1 leaves/year.
Table 3. Correlations (and statistical probabilities) between root deposition in the 3 soil depths of the ingrowth cores, total root deposition, and root diameter, phyllochron (P) and architectural signal (AS) or their reciprocals, and a cosine function representing annual seasonal change in insolation.
Fr(0–70)Fr(70–250)Fr(250–600)Fr(0–600)Diameter
P−0.409−0.475−0.690−0.5210.587
(0.275)(0.196)(0.040)(0.150)(0.097)
1/P0.4430.4850.7080.547−0.476
(0.232)(0.186)(0.033)(0.127)(0.195)
AS0.7580.8300.6200.804−0.700
(0.018)(0.006)(0.075)(0.009)(0.036)
1/AS−0.816−0.856−0.609−0.8420.642
(0.007)(0.003)(0.002)(0.004)(0.062)
Cos day of year 10.6600.7200.8070.760−0.614
(0.053)(0.029)(0.009)(0.018)(0.078)
1 Note: Day of year was multiplied by 360/365 to create a 360° annual cycle beginning 22 December to form a covariate for insolation, to test environmental factors associated with root ingrowth into refilled cores.

