


Evaluation of Cropland Utilization Eco-Efficiency and Influencing Factors in Primary Grain-Producing Regions of China

Abstract
:1. Introduction
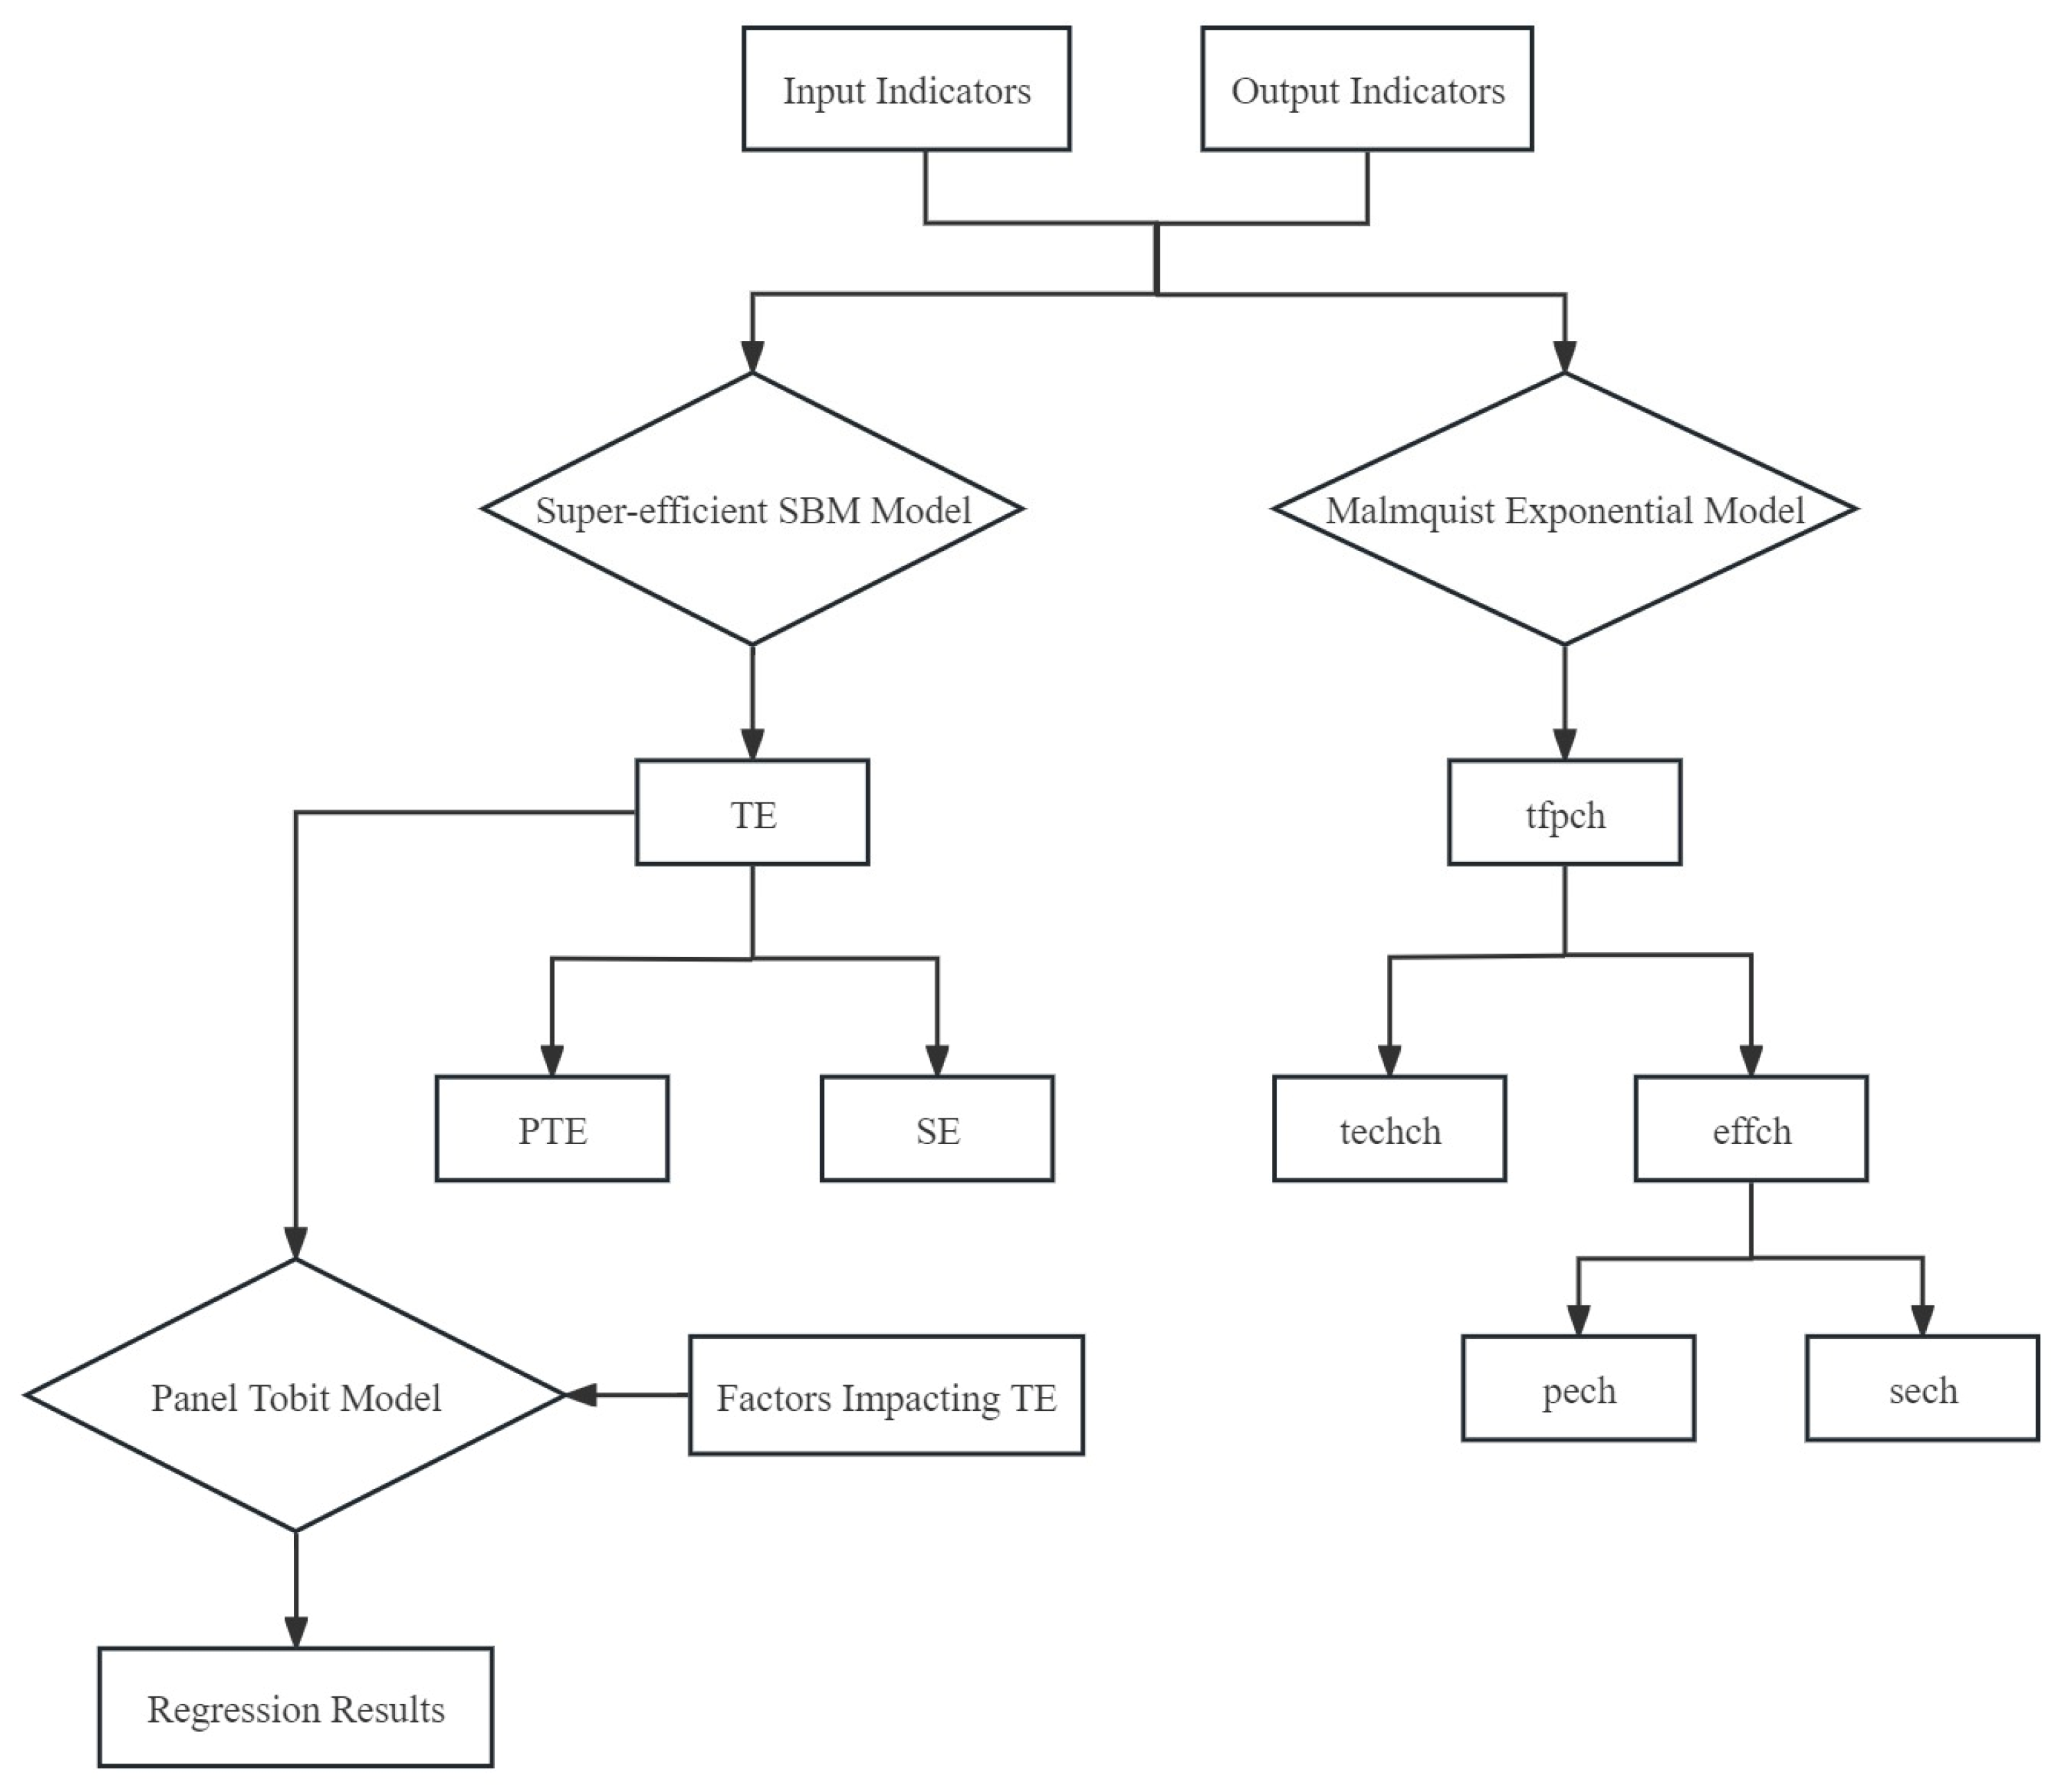
2. Methods
2.1. Super-Efficient SBM Model
2.2. Malmquist Exponential Model
2.3. Tobit Model
3. Selection of Indicators and Data Sources
3.1. Construction of Evaluation Index System for Eco-Efficiency of Cropland Utilization
3.2. Construction of the Index System for Factors Influencing the Eco-Efficiency of Cropland Utilization
3.2.1. Impact Forecast of Resource Endowment
3.2.2. Impact Forecast of Economic and Technological Development
3.2.3. Impact Forecast of Agricultural Production Inputs
3.3. Data Sources
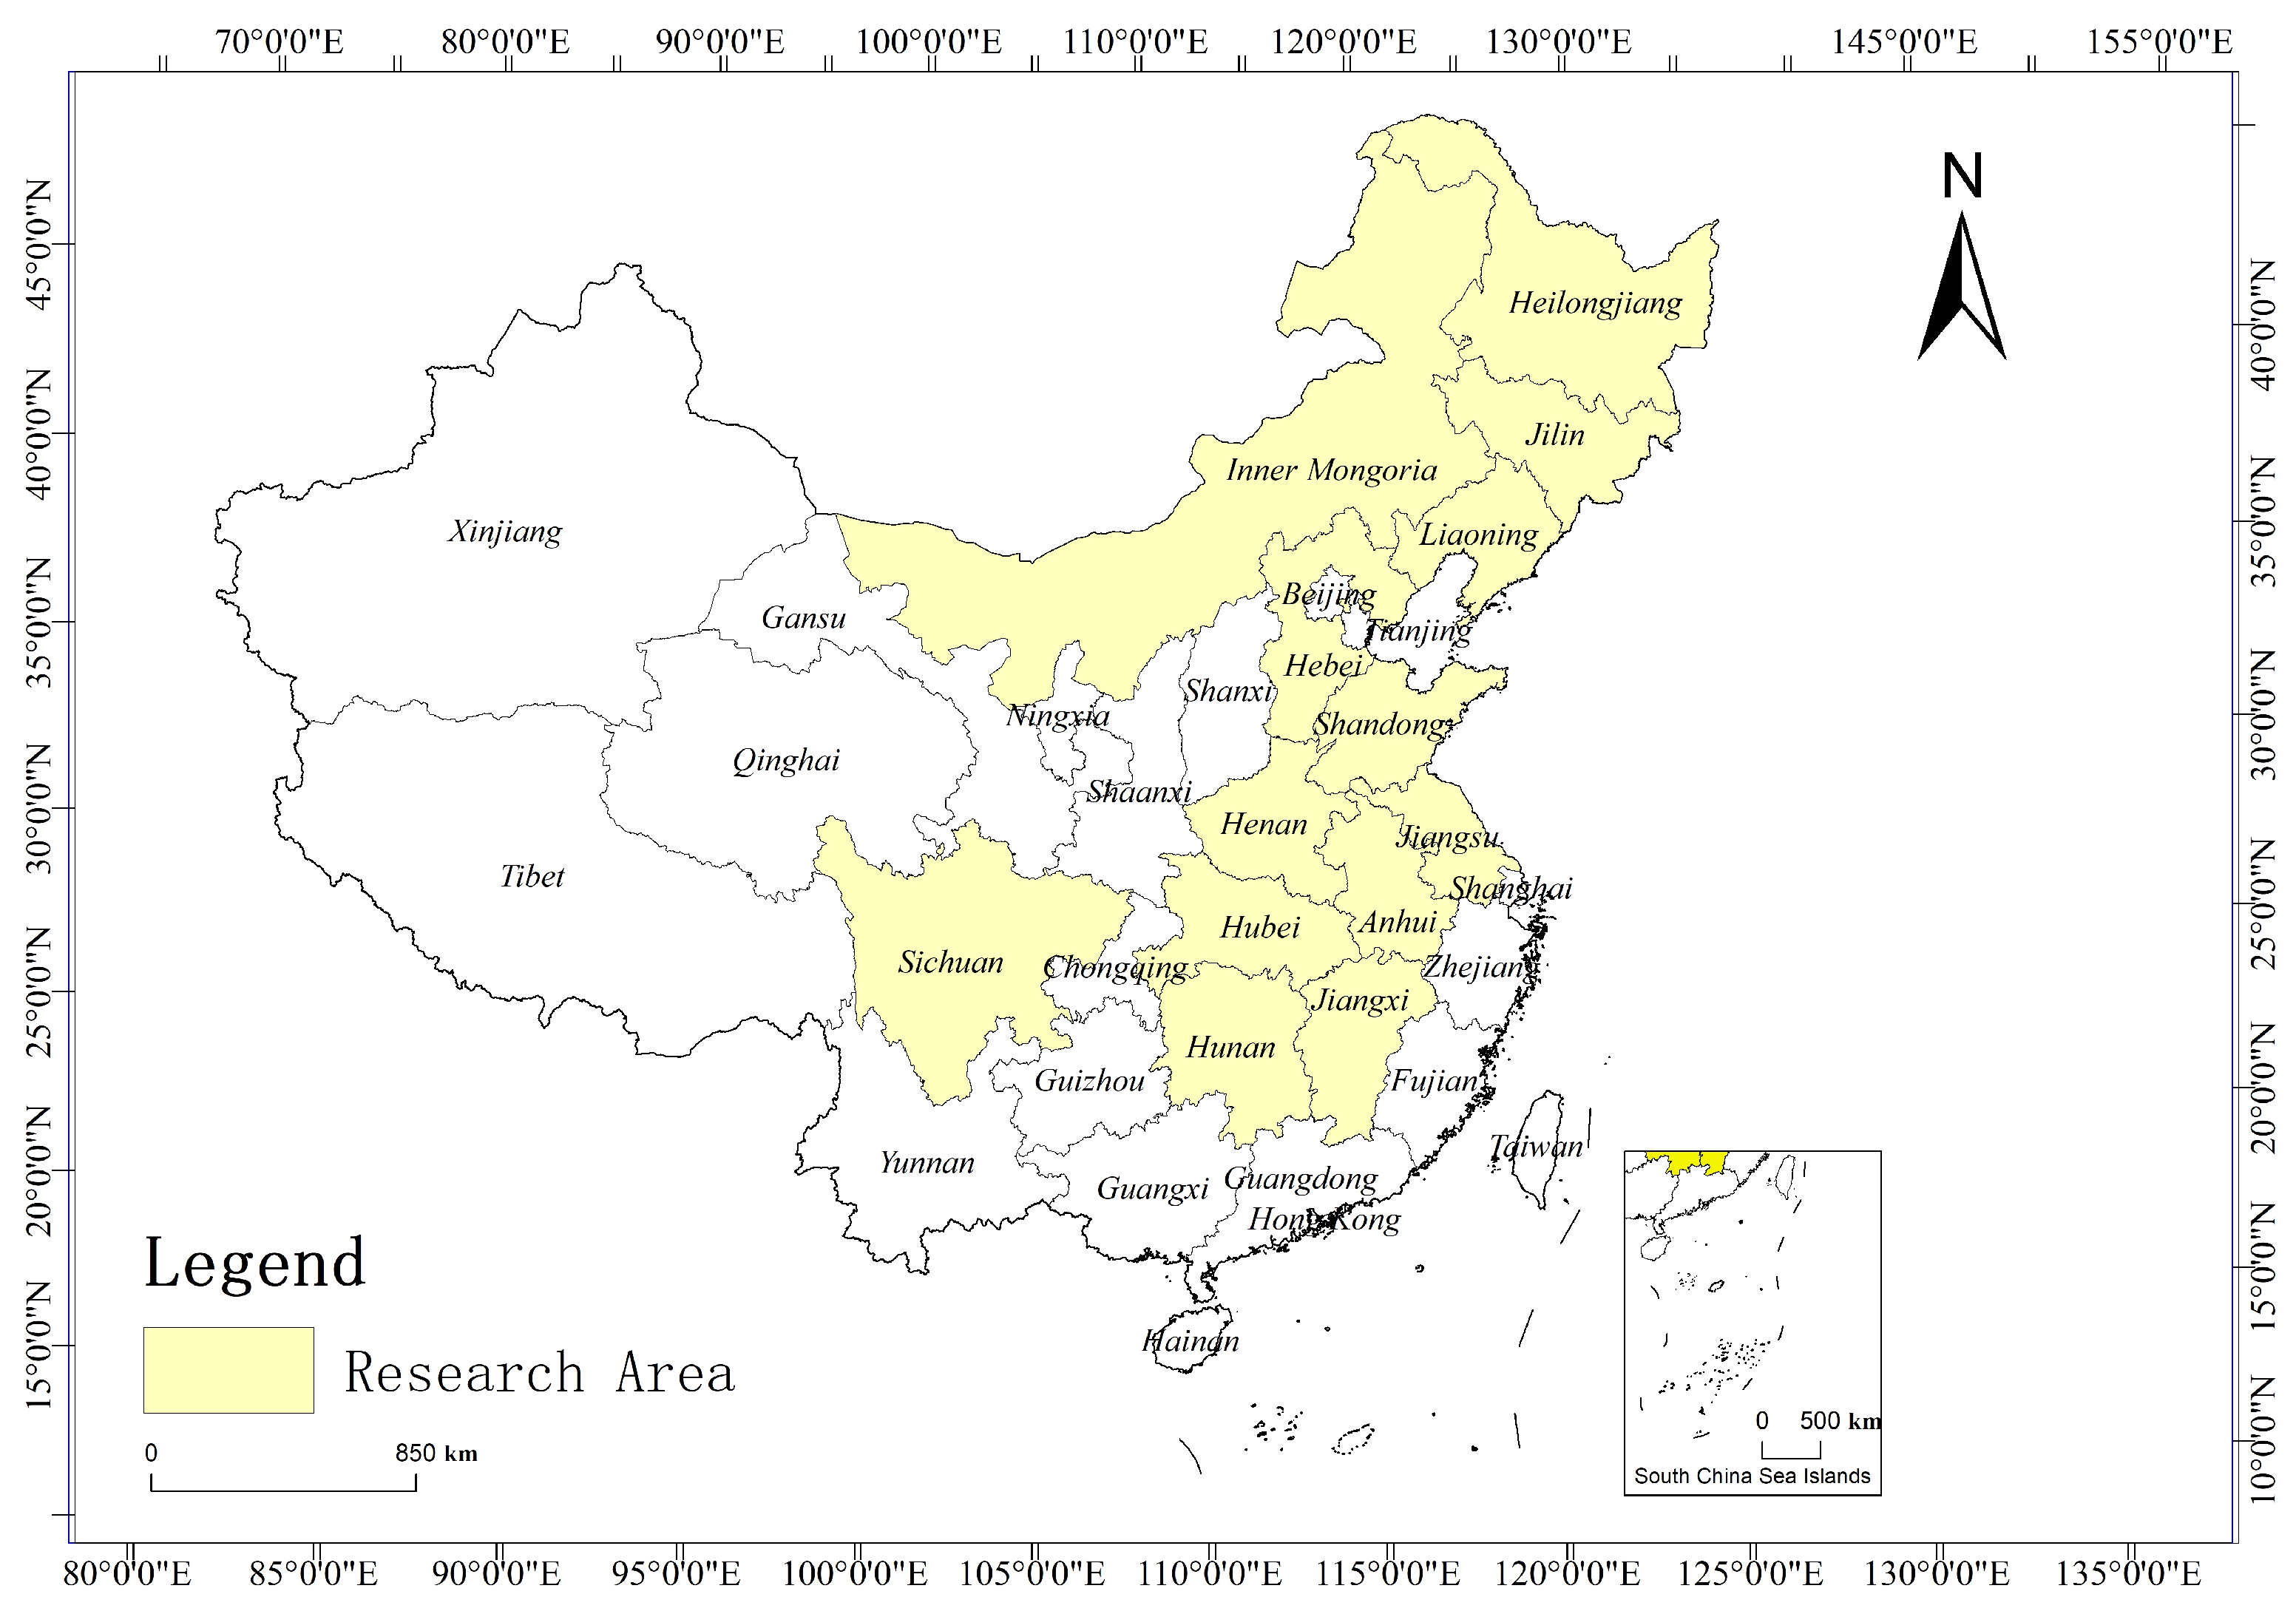
3.3.1. Regional Overviews
3.3.2. Data Sources
4. Results
4.1. Static Analysis of the Super-Efficient SBM Model
4.1.1. Overall Summary of Ecological Efficiency
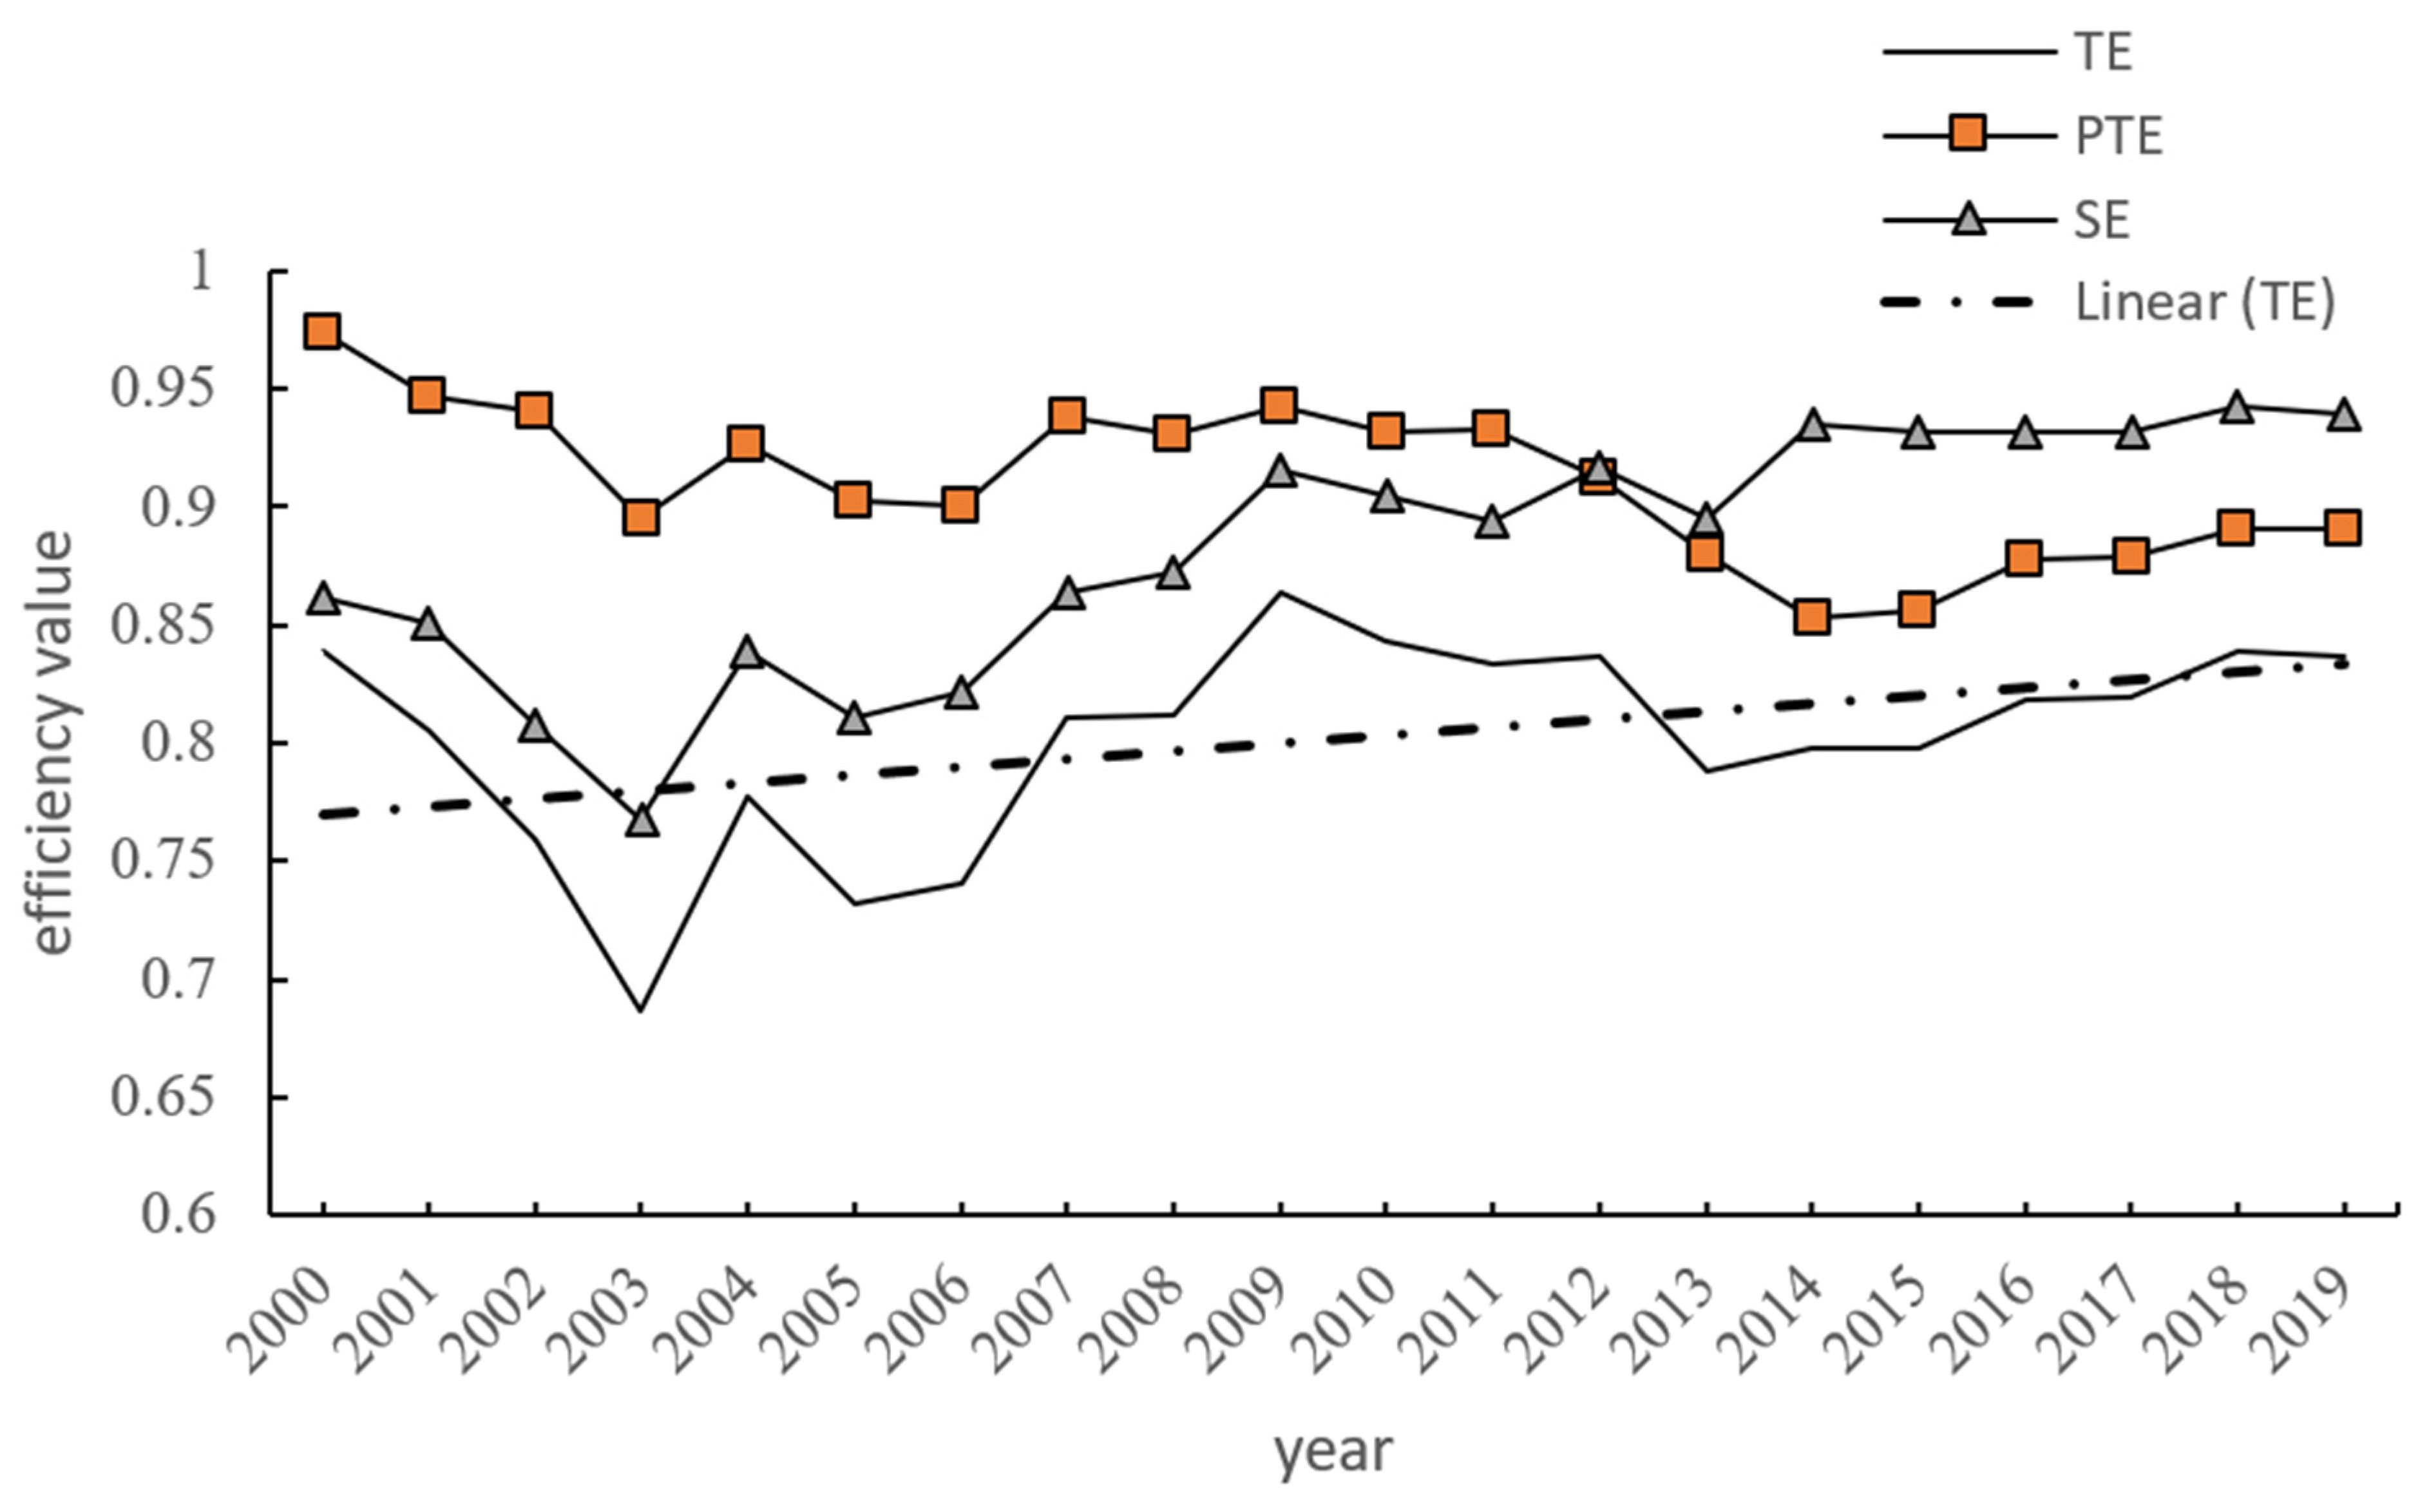
4.1.2. Overview of the Temporal Evolution of Ecological Efficiency
4.1.3. Spatial Distribution of Ecological Efficiency
4.2. Dynamic Analysis of the Malmquist Index
- Overall Dynamic Efficiency Analysis
- 2.
- Regional Analysis of Dynamic Efficiency
5. Analysis of Influencing Factors
- Impact Analysis of Labor Input per Unit Area
- 2.
- Explore Distinct Approaches to Reduce Regional Disparities
- 3.
- Establishing the Concept of Green Production and Reducing the Utilization of Chemical Inputs in Agriculture
6. Conclusions
- Overview of the Trend in Ecological Efficiency Changes
- 2.
- Significant Regional Differences in Ecological Efficiency of Cropland
- 3.
- Diversity of Influencing Factors on Ecological Efficiency
Author Contributions
Funding
Institutional Review Board Statement
Informed Consent Statement
Data Availability Statement
Acknowledgments
Conflicts of Interest
References
- Li, H. Great potential for carbon sequestration and emission reduction in agricultural soils. Farmers’ Daily, 27 August 2021. [Google Scholar]
- Zhao, R.; Qin, M.; Huang, A. Measures and potentials of soil carbon sequestration in cropland. Ecol. Environ. 2004, 1, 81–84. [Google Scholar]
- Tian, W.; Yang, L.; Jiang, J. Measurement and analysis of China’s agricultural environmental efficiency from a low-carbon perspective—SBM model based on non-expected output. China Rural Obs. 2014, 119, 59–71+95. [Google Scholar]
- Schaltegger, S.; Sturm, A. Ökologische rationalität: Ansatzpunkte zur ausgestaltung you okologieorienttierten management instrumenten. Die Unternehm. 1990, 4, 273–290. [Google Scholar]
- Caiado RG, G.; de Freitas Dias, R.; Mattos, L.V.; Quelhas, O.L.G.; Leal Filho, W. Towards sustainable development through the perspective of eco-efficiency—A systematic literature review. J. Clean. Prod. 2017, 165, 890–904. [Google Scholar] [CrossRef]
- Sun, X.; Li, J.; Li, L. Estimating circular agricultural efficiency using dea methods. Agro Food Ind. Hi-Tech 2016, 27, 94–98. [Google Scholar]
- Song, J.; Chen, X. Eco-efficiency of grain production in China based on water footprints: A stochastic frontier approach. J. Clean. Prod. 2019, 236, 117685. [Google Scholar] [CrossRef]
- Mehmeti, A.; Todorovic, M.; Scardigno, A. Assessing the eco-efficiency improvements of Sinistra Ofanto irrigation scheme. J. Clean. Prod. 2016, 138, 208–216. [Google Scholar] [CrossRef]
- Deng, X.; Gibson, J. Improving eco-efficiency for the sustainable agricultural production: A case study in Shandong, China. Technol. Forecast. Soc. Chang. 2019, 144, 394–400. [Google Scholar] [CrossRef]
- Orea, L.; Wall, A. A Parametric Approach to Estimating Eco-Efficiency. J. Agric. Econ. 2017, 68, 901–907. [Google Scholar] [CrossRef]
- Pang, J.; Yin, J.; Li, S.; Zou, Y.; Zhang, Y.; Liang, X.; Huang, R. The Ecological Footprint and Allocation of Guangxi Beibu Gulf Urban Agglomeration. Sustainability 2022, 14, 15360. [Google Scholar] [CrossRef]
- Yang, B.; Yang, J.; Tan, L.; Xiao, J. Understanding the change of land space utilization efficiency with different functions and its coupling coordination: A case study of Urban Agglomeration in the Middle Reaches of the Yangtze River, China. J. Geogr. Sci. 2023, 33, 289–310. [Google Scholar] [CrossRef]
- Liu, J.; Jin, X.; Xu, W.; Gu, Z.; Yang, X.; Ren, J.; Fan, Y.; Zhou, Y. A new framework of land use efficiency for the coordination among food, economy and ecology in regional development. Sci. Total Environ. 2020, 710, 135670. [Google Scholar] [CrossRef]
- Tang, X.; Sheng, L.; Zhou, Y. Exploring complex urban growth and land use efficiency in China’s developed regions: Implications for territorial spatial planning. Front. Earth Sci. 2022, 16, 1040–1051. [Google Scholar] [CrossRef]
- Zhang, H.; Song, G. Ecological efficiency of cropland utilization and its internal coordination in Heilongjiang reclamation area. J. Huazhong Agric. Univ. 2019, 4, 160–168+178. [Google Scholar]
- Liu, M.; Zhang, A.; Wen, G. Spatial and temporal patterns and evolutionary trends of ecological efficiency of cropland utilization in the main grain producing areas in the middle and lower reaches of the Yangtze River. China Land Sci. 2021, 35, 50–60. [Google Scholar]
- Wu, Y.; Zhang, P.; Li, J.; Hou, J. Spatial Distribution Evolution and Optimization Path of Eco-Efficiency of cultivated land Use: A Case Study of Hubei Province, China. Sustainability 2022, 14, 11417. [Google Scholar] [CrossRef]
- Ma, L.; Zhang, R.; Pan, Z.; Wei, F. Evolution of spatio-temporal pattern of ecological efficiency of cropland utilization among provinces in China and analysis of influencing factors—Based on panel data from 2000–2019. China Land Sci. 2022, 36, 74–85. [Google Scholar]
- Huang, H.; Wang, Z. Analysis of spatial and temporal differences in eco-efficiency of agricultural land in Jiangxi Province and the factors affecting it—Based on the dual perspectives of surface source pollution and carbon emission. Yangtze River Basin Resour. Environ. 2020, 29, 412–423. [Google Scholar]
- Yang, B.; Wang, Z.; Zou, L.; Zou, L.; Zhang, H. Exploring the eco-efficiency of cultivated land utilization and its influencing factors in China’s Yangtze River Economic Belt, 2001–2018. J. Environ. Manag. 2021, 294, 112939. [Google Scholar] [CrossRef] [PubMed]
- Yang, X.; Zhou, H.; Liu, X. Analysis of land utilization efficiency of different types of farm households in mountainous areas and their influencing factors—an empirical study based on 18 typical villages in Wuling Mountain Area. China Agric. Resour. Zoning 2020, 41, 122–130. [Google Scholar]
- Zhang, C.; Su, Y.; Yang, G.; Chen, D.; Yang, R. Spatial-temporal characteristics of cultivated land use efficiency in major function-oriented zones: A case study of Zhejiang province, China. Land 2020, 9, 114. [Google Scholar] [CrossRef]
- Hu, X.; Liu, M.; Wen, G. Characterization of spatial and temporal variability in the coupled coordination of intensive utilization of cultivated land and eco-efficiency in China. Yangtze River Basin Resour. Environ. 2022, 31, 2282–2294. [Google Scholar]
- Wang, J.; Su, D.; Wu, Q.; Li, G.; Cao, Y. Study on eco-efficiency of cultivated land utilization based on the improvement of ecosystem services and emergy analysis. Sci. Total Environ. 2023, 882, 163489. [Google Scholar] [CrossRef]
- Fan, Z.; Deng, C.; Fan, Y.; Zhang, P.; Lu, H. Spatial-temporal pattern and evolution trend of the cultivated land use eco-efficiency in the National Pilot Zone for ecological conservation in China. Int. J. Environ. Res. Public Health 2022, 19, 111. [Google Scholar] [CrossRef] [PubMed]
- Zhu, J.; Li, X.; Zeng, X.; Zhong, K.; Xu, Y. cultivated land-Use Benefit Evaluation and Obstacle Factor Identification: Empirical Evidence from Northern Hubei, China. Land 2022, 11, 1386. [Google Scholar] [CrossRef]
- Lu, X.; Qu, Y.; Sun, P.; Yu, W.; Peng, W. Green transition of cultivated land use in the Yellow River Basin: A perspective of green utilization efficiency evaluation. Land 2020, 9, 475. [Google Scholar] [CrossRef]
- Liu, Y.; Zhang, A.; Liu, M. Spatial and temporal pattern analysis of the coupled coordination between urbanization and ecological efficiency of cultivated land use in the main grain producing areas in the middle and lower reaches of the Yangtze River. China Agric. Resour. Zoning 2022, 43, 106–118. [Google Scholar]
- Cui, N.; Wang, X.; Yu, Z. Evaluation of cultivated land eco-efficiency and analysis of influencing factors in the main grain producing areas of Northeast China. Ecol. Econ. 2021, 37, 104–110. [Google Scholar]
- Tone, K. A slacks-based measure of efficiency in data envelopment analysis. Eur. J. Oper. Res. 2001, 130, 498–509. [Google Scholar] [CrossRef]
- Tone, K. A slacks-based measure of super-efficiency in data envelopment analysis. Eur. J. Oper. Res. 2002, 143, 32–41. [Google Scholar] [CrossRef]
- Färe, R.; Grosskopf, S.; Norris, M.; Zhang, Z. Productivity growth, technical progress, and efficiency change in industrialized countries. Am. Econ. Rev. 1994, 84, 66–83. [Google Scholar]
- Zhang, Z.; Liao, X.; Li, C.; Yang, C.; Yang, S.; Li, Y. Spatio-temporal characteristics of agro-ecological efficiency and its influencing factors in counties of Hunan Province. Econ. Geogr. 2022, 42, 181–189. [Google Scholar]
- Ji, X.; Shang, J. Research on China’s agroecological efficiency based on the three-stage SBM model. China Agric. Resour. Zoning 2021, 42, 210–217. [Google Scholar]
- Ren, H. Comprehensive measurement of agroecological efficiency based on DEA model. Stat. Decis. Mak. 2019, 35, 99–103. [Google Scholar]
- Li, B.; Zhang, J.; Li, H. Spatial and temporal characteristics of agricultural carbon emissions in China and decomposition of influencing factors. China Popul. Resour. Environ. 2011, 21, 80–86. [Google Scholar]
- Wu, F.L.; Li, L.; Zhang, H.L.; Chen, F. Effects of conservation tillage on net carbon release from farmland ecosystems. J. Ecol. 2007, 26, 2035–2039. [Google Scholar]
- West, T.O.; Marland, G. A synthesis of carbon sequestration, carbon emissions, and net carbon flux in agriculture: Comparing tillage practices in the United States. Agric. Ecosyst. Environ. 2002, 91, 217–232. [Google Scholar] [CrossRef]
- Zhi, J.; Gao, J. Comparative analysis of carbon emissions from food consumption of urban and rural residents in China. Prog. Geosci. 2009, 28, 429–434. [Google Scholar]
- Eggleston, H.S.; Buendia, L.; Miwa, K.; Ngara, T.; Tanabe, K. 2006 IPCC Guidelines for National Greenhouse Gas Inventories; The Institute for Global Environmental Strategies (IGES) for the IPCC: Hayama, Japan, 2006. [Google Scholar]
- Dubey, A.; Lal, R. Carbon footprint and sustainability of agricultural production systems in Punjab, India, and Ohio, USA. J. Crop Improv. 2009, 23, 332–350. [Google Scholar] [CrossRef]
- Wang, B.; Zhang, W. Interprovincial differences and influencing factors of agroecological efficiency in China—A panel data analysis based on 31 provinces from 1996 to 2015. China Rural Econ. 2018, 1, 46–62. [Google Scholar]
- Yan, M.; Qiao, J.; Qu, M.; Han, D. Research on agroecological efficiency measurement, spatial spillover and influencing factors in Henan Province. J. Ecol. Rural Environ. 2022, 38, 1396–1405. [Google Scholar]
- Hong, K.; Chen, C.; Feng, C.; Huang, J. Spatio-temporal differences and influencing factors of agro-ecological efficiency. J. South China Agric. Univ. 2016, 15, 31–41. [Google Scholar]
- Fang, F.; Zhang, Y. Analysis of changes in China’s agricultural total factor productivity and its influencing factors--Based on the Malmquist index method from 1991 to 2008. Econ. Theory Econ. Manag. 2010, 237, 5–12. [Google Scholar]
- Li, J.; Sun, Z.; Zhou, J.; Sow, Y.; Cui, X.; Chen, H.; Shen, Q. The Impact of the Digital Economy on Carbon Emissions from Cultivated Land Use. Land 2023, 12, 665. [Google Scholar] [CrossRef]
- Lu, Z. Research on the impact of agricultural scientific and technological progress on agricultural carbon emissions under the provincial perspective. Sci. Res. 2013, 31, 674–683. [Google Scholar]
- Liu, H.; Bao, Z.; Yang, Q. Regional disparities in agricultural carbon emissions and the dynamic evolution of their distribution in China-An empirical study based on Dagum’s Gini coefficient decomposition and nonparametric estimation methods. Agric. Technol. Econ. 2013, 215, 72–81. [Google Scholar]
- Liu, M.; Zhang, A.; Wen, G. Regional differences and spatial convergence in the ecological efficiency of cultivated land utilization in the main grain producing areas in the middle and lower reaches of the Yangtze River. J. Nat. Resour. 2022, 37, 477–493. [Google Scholar]
- Wen, G.; Liu, M.; Hu, X.; Zhao, J. Spatial correlation and spatial effect of ecological efficiency of cultivated land utilization in Dongting Lake Plain. Geoscience 2022, 42, 1102–1112. [Google Scholar]


| Type of Indicator | Indicator Elements | Indicator Name | Indicator Unit |
|---|---|---|---|
| Input indicators | Plowed Area | Thousand hectares | |
| Labor Input | Ten thousand people | ||
| Fertilizer Use | Tons | ||
| Pesticide Use | Tons | ||
| Agricultural Diesel Use | Tons | ||
| Agricultural Film Use | Tons | ||
| Cropland Irrigated Area | Thousand hectares | ||
| Output indicators | Expected outputs | Regional Gross Agricultural Product | Billions |
| Grain Production | Tons | ||
| Non-expected outputs | Carbon Emissions | Tons |
| Level 1 Indicators | Secondary Indicators | Description of Variables | Impact |
|---|---|---|---|
| Resource Endowment | Labor Input per Unit Area | Agricultural Labor Inputs/Sown Area (persons/ha) | Uncharted |
| Labor Force Quality | Rural per Capita Years of Schooling (years) | Forward | |
| Economic and technological development | Disposable Income per Capita | Per Capita Disposable Income of Rural Residents (thousand CNY/person) | Negative Direction |
| Machinery Density | Total Power of Agricultural Machinery/Area Sown (kW/ha) | Uncharted | |
| Agricultural Production Inputs | Chemical Input per Unit Area | Agrochemical Inputs/Sown Area (tons/ha) | Uncharted |
| Multiple Cropping Index | Grain Crop Planting Area/Cultivated Land Area (%) | Uncharted | |
| Irrigation Index | Irrigated Area/Total Sown Area of Crops (%) | Uncharted | |
| Government Financial Input Proportion | Government Expenditure on Agriculture, Forestry, and Water/Total Expenditure (%) | Forward |
| Year | Technical | Pure Technical Efficiency | Scale Efficiency |
|---|---|---|---|
| 2000 | 0.839 | 0.974 | 0.862 |
| 2001 | 0.805 | 0.946 | 0.851 |
| 2002 | 0.760 | 0.941 | 0.807 |
| 2003 | 0.687 | 0.895 | 0.768 |
| 2004 | 0.778 | 0.927 | 0.839 |
| 2005 | 0.732 | 0.903 | 0.811 |
| 2006 | 0.740 | 0.901 | 0.822 |
| 2007 | 0.811 | 0.938 | 0.864 |
| 2008 | 0.812 | 0.930 | 0.873 |
| 2009 | 0.863 | 0.943 | 0.916 |
| 2010 | 0.843 | 0.932 | 0.904 |
| 2011 | 0.833 | 0.932 | 0.894 |
| 2012 | 0.837 | 0.912 | 0.917 |
| 2013 | 0.788 | 0.880 | 0.896 |
| 2014 | 0.798 | 0.853 | 0.935 |
| 2015 | 0.798 | 0.857 | 0.932 |
| 2016 | 0.818 | 0.878 | 0.932 |
| 2017 | 0.819 | 0.879 | 0.932 |
| 2018 | 0.839 | 0.891 | 0.942 |
| 2019 | 0.836 | 0.891 | 0.939 |
| 20-year average | 0.801 | 0.910 | 0.880 |
| Year | Technical Effectiveness Rate Change | Technological Progress | Purely Technical Efficiency Rate of Change | Scale Efficiency Rate of Change | Total Factor Productivity |
|---|---|---|---|---|---|
| 2000–2001 | 0.9593 | 1.0671 | 0.9721 | 0.9869 | 1.0237 |
| 2001–2002 | 0.9434 | 1.1054 | 0.9939 | 0.9493 | 1.0428 |
| 2002–2003 | 0.9048 | 1.0671 | 0.9510 | 0.9514 | 0.9655 |
| 2003–2004 | 1.1317 | 1.0000 | 1.0361 | 1.0922 | 1.1316 |
| 2004–2005 | 0.9411 | 1.0990 | 0.9743 | 0.9659 | 1.0342 |
| 2005–2006 | 1.0117 | 1.0346 | 0.9976 | 1.0142 | 1.0467 |
| 2006–2007 | 1.0946 | 0.9417 | 1.0412 | 1.0513 | 1.0308 |
| 2007–2008 | 1.0018 | 1.1113 | 0.9921 | 1.0098 | 1.1133 |
| 2008–2009 | 1.0633 | 0.9251 | 1.0135 | 1.0491 | 0.9837 |
| 2009–2010 | 0.9762 | 1.1161 | 0.9882 | 0.9879 | 1.0895 |
| 2010–2011 | 0.9886 | 1.1310 | 1.0005 | 0.9881 | 1.1182 |
| 2011–2012 | 1.0040 | 1.0619 | 0.9786 | 1.0259 | 1.0662 |
| 2012–2013 | 0.9420 | 1.1432 | 0.9643 | 0.9768 | 1.0768 |
| 2013–2014 | 1.0123 | 0.9912 | 0.9693 | 1.0444 | 1.0034 |
| 2014–2015 | 1.0003 | 1.0584 | 1.0042 | 0.9961 | 1.0587 |
| 2015–2016 | 1.0251 | 0.9975 | 1.0248 | 1.0003 | 1.0226 |
| 2016–2017 | 1.0013 | 1.0401 | 1.0015 | 0.9998 | 1.0415 |
| 2017–2018 | 1.0247 | 1.0057 | 1.0133 | 1.0112 | 1.0305 |
| 2018–2019 | 0.9967 | 1.1413 | 0.9997 | 0.9970 | 1.1375 |
| 2000–2019 Average | 0.9998 | 1.0527 | 0.9953 | 1.0045 | 1.0525 |
| Provinces | Technical Efficiency Changes | Technological Progress | Purely Technical Efficiency Rate of Change | Scale Efficiency Rate of Change | Total Factor Productivity | Total Factor Productivity Ranking |
|---|---|---|---|---|---|---|
| Hebei | 0.9980 | 1.0509 | 0.9907 | 1.0074 | 1.0488 | 8 |
| Inner Mongolia | 0.9853 | 1.0608 | 0.9762 | 1.0093 | 1.0452 | 10 |
| Liaoning | 1.0096 | 1.0541 | 0.9991 | 1.0105 | 1.0642 | 2 |
| Jilin | 1.0018 | 1.0577 | 1.0014 | 1.0004 | 1.0596 | 3 |
| Helongjiang | 1.0121 | 1.0641 | 1.0092 | 1.0028 | 1.0770 | 1 |
| Jiangsu | 1.0089 | 1.0499 | 0.9994 | 1.0095 | 1.0592 | 4 |
| Anhui | 0.9929 | 1.0449 | 0.9859 | 1.0071 | 1.0375 | 13 |
| Jiangxi | 0.9936 | 1.0529 | 0.9887 | 1.0049 | 1.0462 | 9 |
| Shandong | 1.0058 | 1.0463 | 0.9983 | 1.0075 | 1.0523 | 6 |
| Henan | 1.0007 | 1.0434 | 1.0005 | 1.0002 | 1.0441 | 12 |
| Hubei | 1.0002 | 1.0491 | 1.0002 | 1.0000 | 1.0494 | 7 |
| Hunan | 0.9889 | 1.0559 | 0.9889 | 1.0000 | 1.0442 | 11 |
| Sichuan | 1.0005 | 1.0553 | 1.0009 | 0.9996 | 1.0558 | 5 |
| Eastern China | 1.0127 | 1.1544 | 0.9884 | 1.0245 | 1.1690 | 1 |
| Western China | 0.9928 | 1.0581 | 0.9885 | 1.0044 | 1.0505 | 3 |
| Central China | 0.9953 | 1.0492 | 0.9929 | 1.0024 | 1.0442 | 4 |
| Northeastern | 1.0078 | 1.0586 | 1.0032 | 1.0046 | 1.0669 | 2 |
| Average Value by Region | 0.9998 | 1.0527 | 0.9953 | 1.0045 | 1.0525 | - |
| Variables | Coefficient | Standard Deviation | p-Value | 95% Confidence Interval | Significance |
|---|---|---|---|---|---|
| Labor input per unit | 0.006 | 0.002 | 0.007 | 0.002~0.011 | *** |
| Quality of labor force | −0.024 | 0.023 | 0.287 | −0.692~−0.021 | |
| Per capita disposable income | −0.001 | 0.002 | 0.641 | −0.005~0.003 | |
| Mechanical density | 0.007 | 0.005 | 0.144 | −0.002~0.016 | |
| Chemical inputs per unit area | −0.038 | 0.008 | 0.000 | −0.053~−0.023 | *** |
| Multiple-crop index | 0.028 | 0.041 | 0.49 | −0.052~0.108 | |
| Irrigation index | 0.245 | 0.123 | 0.046 | 0.004~0.486 | ** |
| Proportion of government financial input | 0.011 | 0.003 | 0.001 | 0.004~0.170 | *** |
| Constant | 0.8677 | 0.177 | 0.000 | 0.523~1.213 | *** |
| Log likelihood = 271.20155 | Prob ≥ chibar2 = 0.000 | ||||
Disclaimer/Publisher’s Note: The statements, opinions and data contained in all publications are solely those of the individual author(s) and contributor(s) and not of MDPI and/or the editor(s). MDPI and/or the editor(s) disclaim responsibility for any injury to people or property resulting from any ideas, methods, instructions or products referred to in the content. |
© 2024 by the authors. Licensee MDPI, Basel, Switzerland. This article is an open access article distributed under the terms and conditions of the Creative Commons Attribution (CC BY) license (https://creativecommons.org/licenses/by/4.0/).
Share and Cite
Li, J.; Sun, Z.; Gao, Q.; Qi, Y. Evaluation of Cropland Utilization Eco-Efficiency and Influencing Factors in Primary Grain-Producing Regions of China. Agriculture 2024, 14, 255. https://doi.org/10.3390/agriculture14020255
Li J, Sun Z, Gao Q, Qi Y. Evaluation of Cropland Utilization Eco-Efficiency and Influencing Factors in Primary Grain-Producing Regions of China. Agriculture. 2024; 14(2):255. https://doi.org/10.3390/agriculture14020255
Chicago/Turabian StyleLi, Jie, Zhengchuan Sun, Qin Gao, and Yanbin Qi. 2024. "Evaluation of Cropland Utilization Eco-Efficiency and Influencing Factors in Primary Grain-Producing Regions of China" Agriculture 14, no. 2: 255. https://doi.org/10.3390/agriculture14020255