
Economic Competitiveness of Dairy Farms from the Top Milk-Producing Countries in the EU: Assessment in 2014–2021

Abstract
:1. Introduction
2. Materials and Methods
3. Results
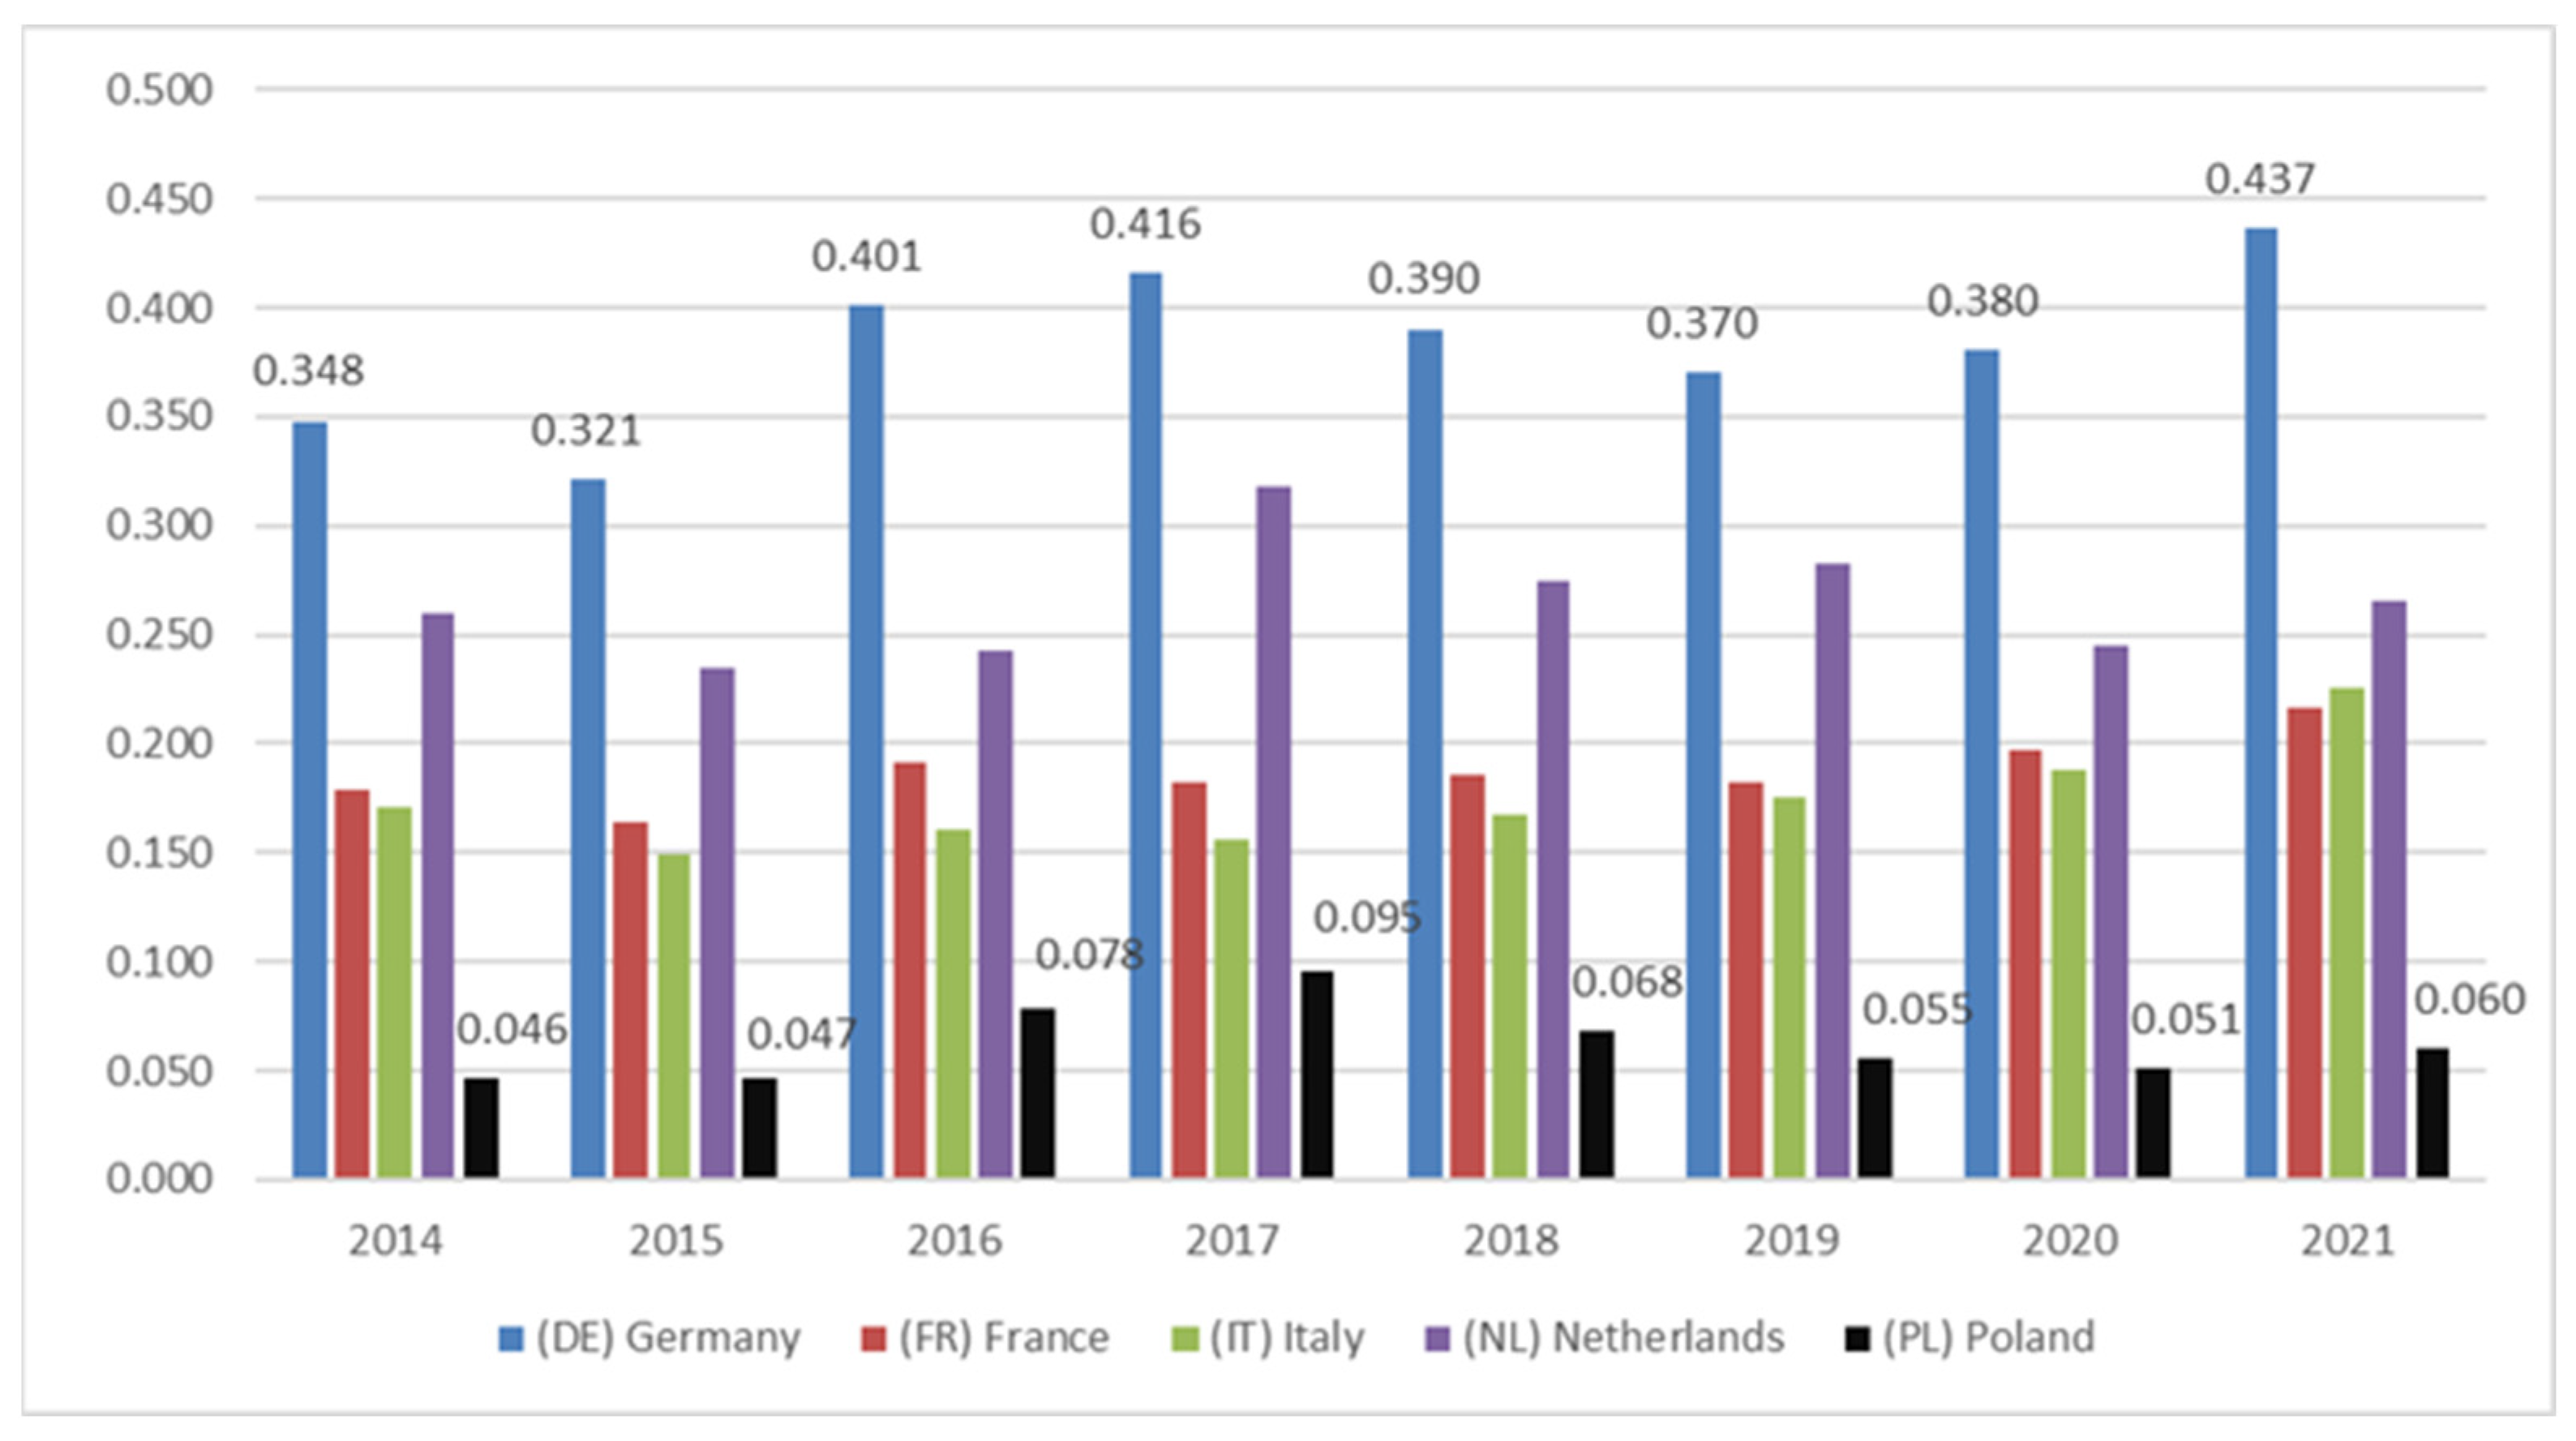
3.1. Competitive Position of Average Dairy Farms from the Studied EU Countries
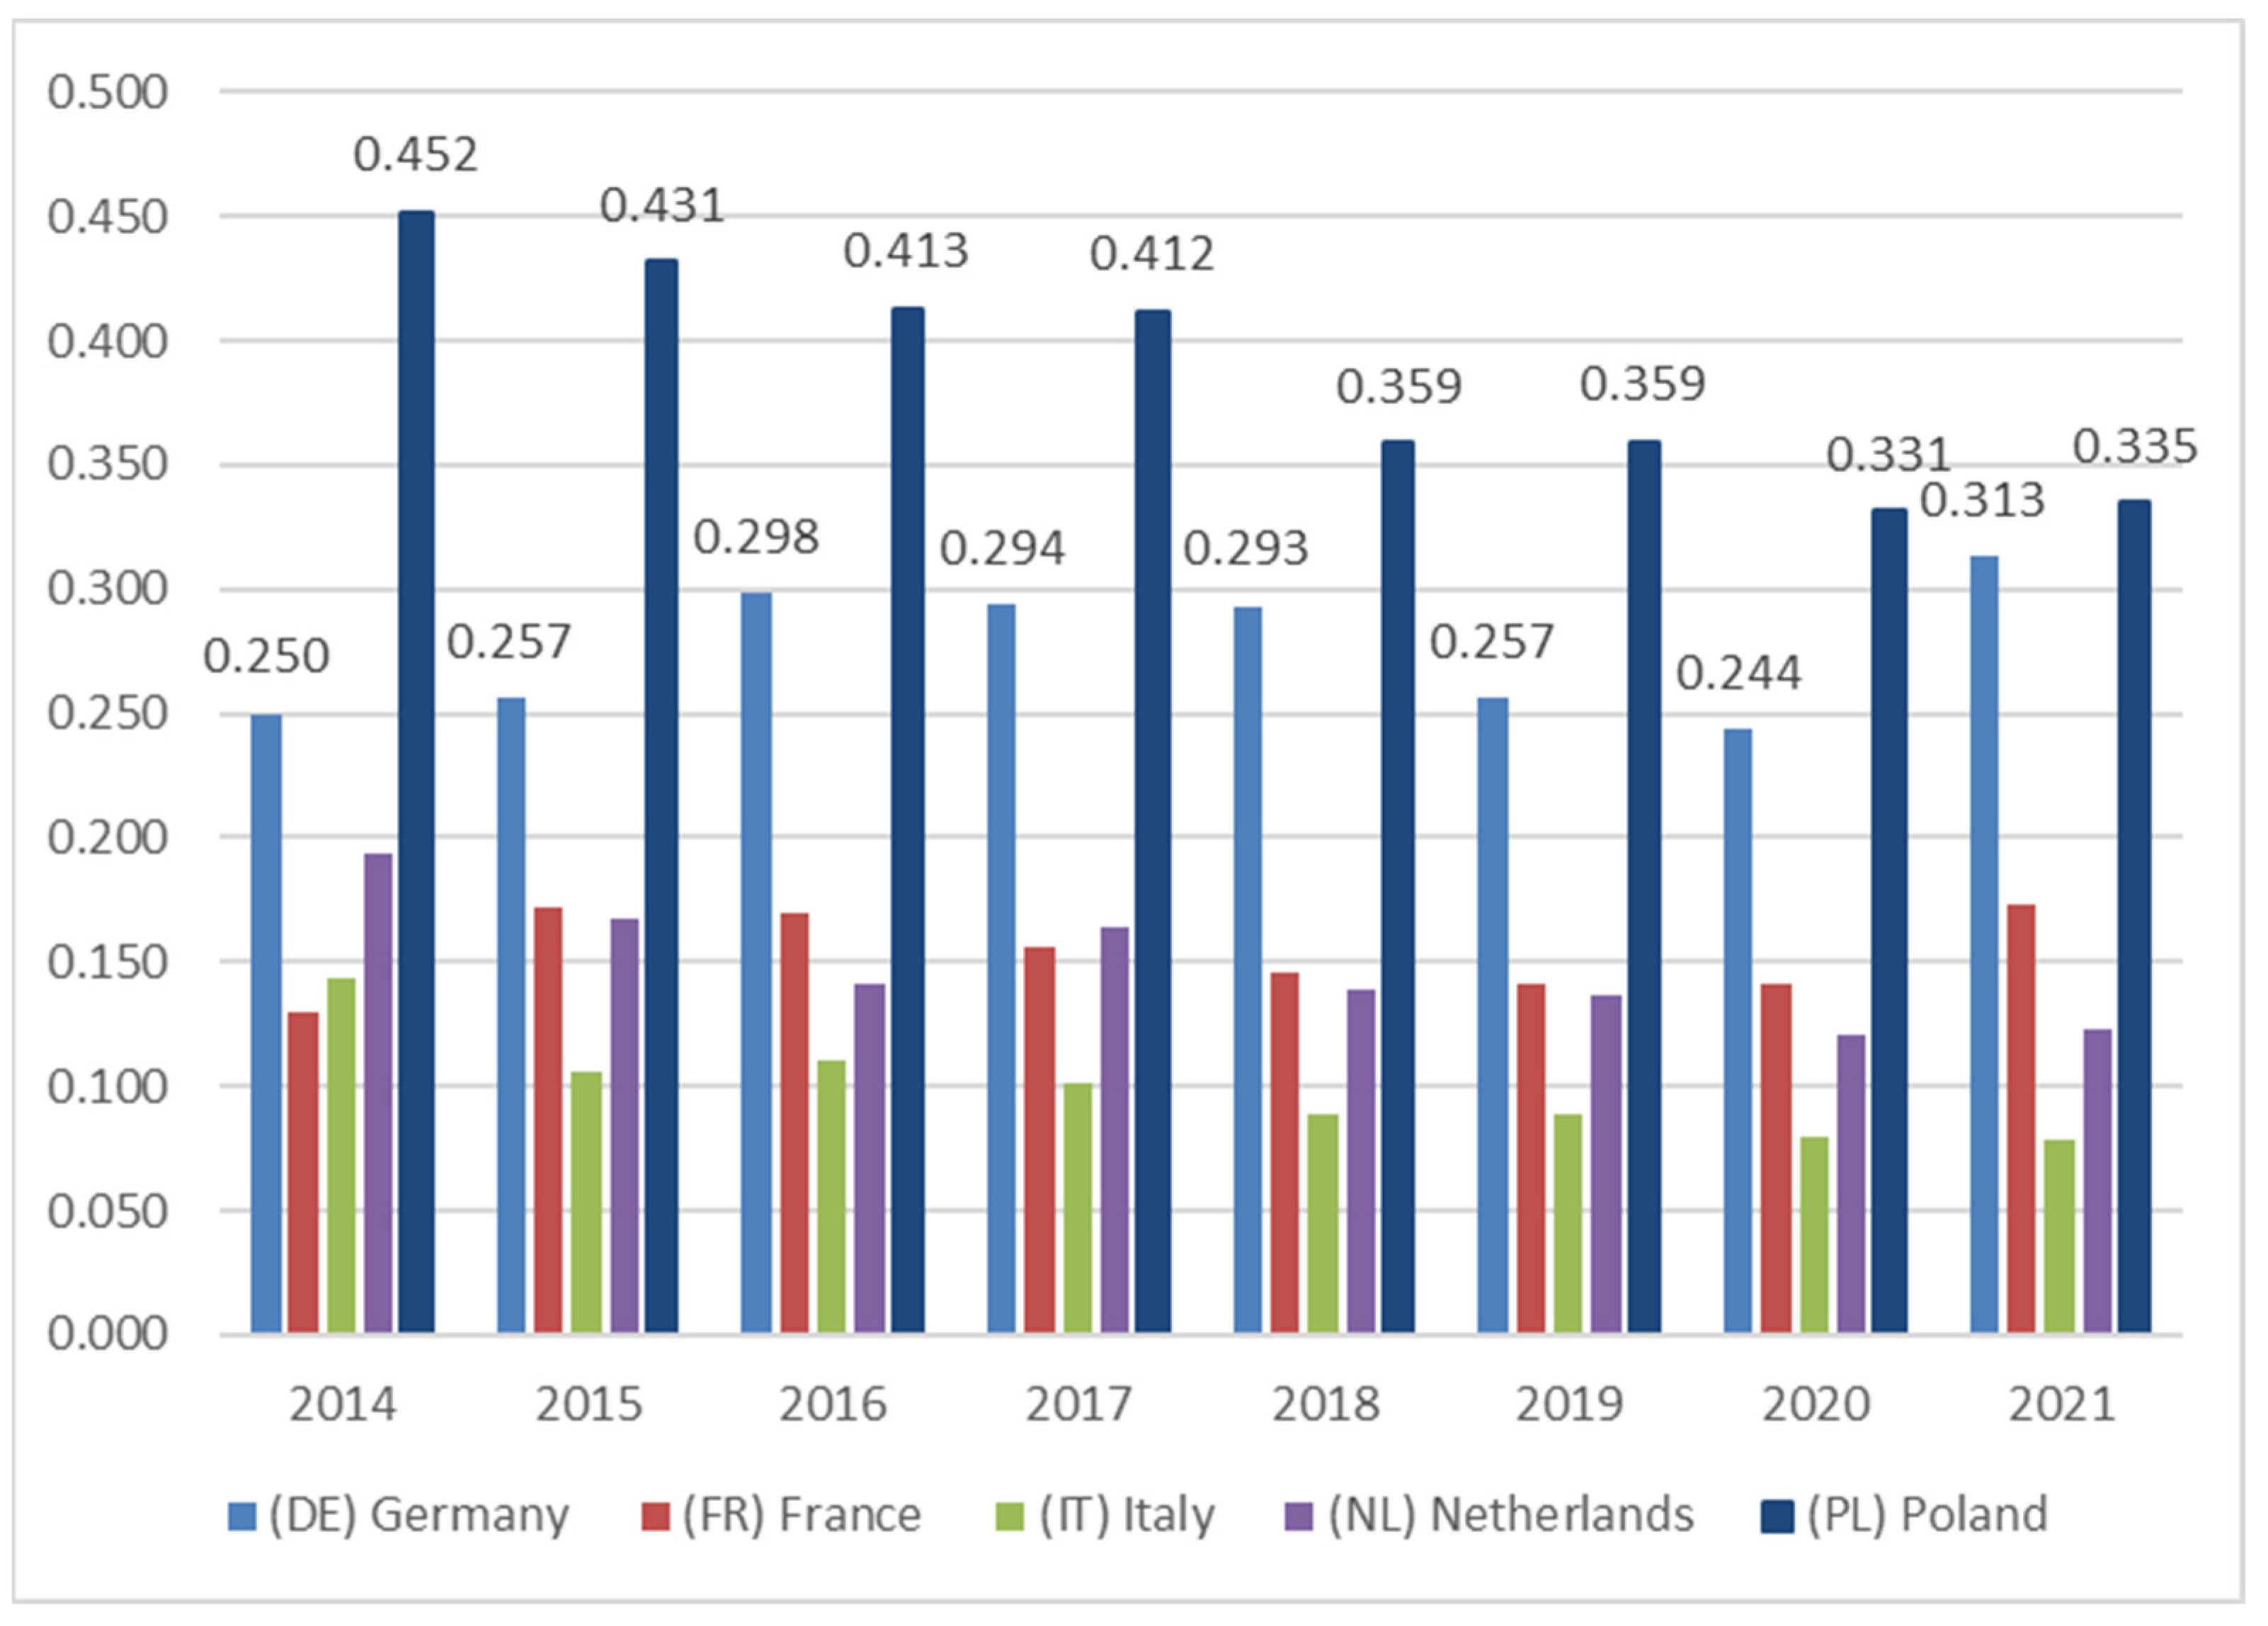
3.2. Competitive Position of Large Dairy Farms from the Studied EU Countries
4. Discussion
The Limitations of the Study and Areas for Further Research
5. Summary and Conclusions
- In the years 2014–2021, out of the five analyzed EU countries with the highest milk production in 2020 (Germany, France, The Netherlands, Italy, and Poland), average dairy farms in Poland had the smallest production potential resulting from their possessed resources. In 2020, the average dairy farm in Poland used more than four times less agricultural land than the average dairy farm in France, and the value of tangible fixed assets (excluding land) on Dutch farms was almost five times higher than that on Polish farms;
- The highest value of the Synthetic Measure of Competitive Position in 2014–2021 was achieved by dairy farms from Germany. Throughout the analyzed period, the position in the rankings of German dairy farms was strengthening and the value of the Synthetic Measure of Competitive Position increased in 2021 by 25.5% compared to 2014. Dairy farms from The Netherlands, second in the ranking, achieved an increase in the synthetic measure of only 2.4%;
- The same analysis conducted on the group of large dairy farms (holdings with the value of Standard Output from EUR 100,000 to EUR 500,000) showed that the competitive position, measured with the Synthetic Measure of Competitive Position, was the highest in the case of Polish dairy farms. It should also be noted that, over time, the competitive position of large Polish dairy farms decreased compared to peer dairy farms from other studied countries. The reasons for this situation should be seen primarily in changes in the economic environment, mainly the increase in prices of agricultural land lease, the increase in the prices of hired labor, and the decreasing profitability of the farmers’ own work in relation to wages outside agriculture.
Author Contributions
Funding
Institutional Review Board Statement
Data Availability Statement
Conflicts of Interest
References
- Stankiewicz, M.J. Konkurencyjność przedsiębiorstwa. In Budowanie Konkurencyjności Przedsiębiorstwa w Warunkach Globalizacji; Wydawnictwo TNOiK “Dom Organizatora”: Toruń, Poland, 2005; 463p. [Google Scholar]
- Siudek, T.; Zawojska, A. Competitiveness in the economic concepts, theories and empirical research. Acta Sci. Pol. Oecon. 2014, 13, 91–108. [Google Scholar]
- Johnson, G.; Scholes, K.; Whittington, R. Exploring Corporate Strategy, 8th ed.; Prentice Hall: Upper Saddle River, NJ, USA, 2008. [Google Scholar]
- Golovchenko, O.; Saiensus, M.; Sorokoumov, G.; Onofriichuk, O.; Zubko, O.; Liu, L. Management of Efficiency and Competitiveness of Enterprises; Economic Affairs: New Delhi, India, 2022; Volume 67. [Google Scholar]
- Dzikowska, M.; Gorynia, M. Theoretical Aspects of Enterprise Competitiveness: Toward an Eclectic Approach? Gospod. Nar. 2012, 255, 1–30. [Google Scholar] [CrossRef]
- Poczta-Wajda, A. Economic viability of family farms in Europe—A literature review. Ann. Polish Assoc. Agric. Agribus. Econ. 2020, 22, 62–73. [Google Scholar] [CrossRef]
- Smędzik-Ambroży, K.; Guth, M.; Majchrzak, A.; Muntean, A.C.; Maican, S.S. The socio-economics factors in family farms with different economic sustainability levels from central and eastern Europe. Sustainability 2021, 13, 8262. [Google Scholar] [CrossRef]
- Varga, P. Fiscal Barriers to Trade within the EU Internal Market. Teka Kom. Prawniczej PAN Oddział Lublin. 2022, 14, 473–485. [Google Scholar] [CrossRef]
- Eurostat. Agriculture. 2023. Available online: https://ec.europa.eu/eurostat/web/main/data/database (accessed on 20 November 2023).
- Kleinhanss, W. Competitiveness of the major types of agricultural holdings in Germany. Probl. Agric. Econ. 2015, 342, 24–39. [Google Scholar] [CrossRef]
- Skinner, A.S. Edward Chamberlin: The Theory of Monopolistic Competition: A Reorientation of the Theory of Value. J. Econ. Stud. 1986, 13, 27–44. [Google Scholar] [CrossRef]
- Wright, P.M.; Mcmahan, G.C.; Mcwilliams, A. The International Journal of Human Resource Management Human resources and sustained competitive advantage: A resource-based perspective. Int. J. Hum. Resour. Manag. 1994, 5, 301–326. [Google Scholar] [CrossRef]
- Barney, J.B.; Ketchen, D.J.; Wright, M. Resource-Based Theory and the Value Creation Framework. J. Manag. 2021, 47, 1936–1955. [Google Scholar] [CrossRef]
- Peteraf, M.A. The cornerstones of competitive advantage: A resource-based view. Strateg. Manag. J. 1993, 14, 179–191. [Google Scholar] [CrossRef]
- Itami, H.; Roehl, T.W. Mobilizing Invisible Assets. Mobilizing Invisible Assets; Harvard University Press: Cambridge, MA, USA, 1987. [Google Scholar]
- Romanowska, M. Kształtowanie wartości firmy w oparciu o kapitał intelektualny. In Wywiad Gospodarczy a Konkurencyjność Przedsiębiorstwa; Difin: Warsaw, Poland, 2001. [Google Scholar]
- Krakowiak-Bal, A. Wykorzystanie wybranych miar syntetycznych do budowy miary rozwoju infrastruktury technicznej. Infrastrukt Ekol Teren. Wiej. 2005, 3, 71–82. [Google Scholar]
- Bełdycka-Bórawska, A.; Bórawski, P.; Guth, M.; Parzonko, A.; Rokicki, T.; Klepacki, B.; Wysokiński, M.; Maciąg, A.; Dunn, J.W. Price changes of dairy products in the european union. Agric. Econ. 2021, 67, 373–381. [Google Scholar] [CrossRef]
- Hornowski, A.; Parzonko, A.; Kotyza, P.; Kondraszuk, T.; Bórawski, P.; Smutka, L. Factors determining the development of small farms in central and eastern Poland. Sustainability 2020, 12, 5095. [Google Scholar] [CrossRef]
- Wojewodzic, T. Procesy Dywestycji i Dezagraryzacji w Rolnictwie o Rozdrobnionej Strukturze Agrarnej; The University of Agriculture in Krakow: Krakow, Poland, 2017; 287p. [Google Scholar]
- Schmidt, N.M. The impact of climate change on European agricultural policy. Eur. View. 2019, 18, 171–177. [Google Scholar] [CrossRef]
- Poczta, W.; Średzińska, J.; Chenczke, M. Economic situation of dairy farms in identified clusters of european union countries. Agriculture 2020, 10, 92. [Google Scholar] [CrossRef]
- Chen, G. Agricultural Land Use Change Options and Climate Change. Curr. Investig. Agric. Curr. Res. 2019, 7, 1020–1022. [Google Scholar] [CrossRef]
- O’Neill, A. Share of Economic Sectors in the Global Gross Domestic Product (GDP) from 2011 to 2021. Statista 2022. Available online: https://www.statista.com/statistics/256563/share-of-economic-sectors-in-the-global-gross-domestic-product/ (accessed on 23 November 2023).
- Kiryluk-Dryjska, E.; Baer-Nawrocka, A.; Okereke, O. The Environmental and Climatic CAP Measures in Poland vs. Farmers’ Expectations—Regional Analysis. Energies 2022, 15, 4529. [Google Scholar] [CrossRef]
- Kim, J.-K. Features and Implications of the 2013 EU Common Agricultural Policy Reform. J. Eur. Union Stud. 2015, 40, 3–34. [Google Scholar] [CrossRef]
- Bórawski, P.; Pawlewicz, A.; Parzonko, A.; Harper, J.K.; Holden, L. Factors shaping cow’s milk production in the EU. Sustainability 2020, 12, 420. [Google Scholar] [CrossRef]
- Ziętara, W.; Adamski, M. Competitiveness of the Polish dairy farms at the background of farms from selected European Union countries. Probl. Agric. Econ. 2018, 354, 56–79. [Google Scholar] [CrossRef]
- Wilczyński, A.; Kołoszycz, E. Economic resilience of eu dairy farms: An evaluation of economic viability. Agriculture 2021, 11, 510. [Google Scholar] [CrossRef]
- Parzonko, A.; Bórawski, P. Competitiveness of Polish dairy farms in the European Union. Agric. Econ. 2020, 66, 168–174. [Google Scholar] [CrossRef]
- Perrot, C.; Caillaud, D.; Chatellier, V.; Ennifar, M.; You, G. Diversity seen in French dairy farms and production regions as the era of milk production quotas comes to an end. Fourrages 2015, 2015, 57–68. [Google Scholar]
- Klopčič, M.; Kuipers, A.; Malak-Rawlikowska, A.; Stalgiene, A.; Ule, A.; Erjavec, K. Dairy farmers’ strategies in four European countries before and after abolition of the milk quota. Land Use Policy 2019, 88, 104169. [Google Scholar] [CrossRef]
- Palma-Molina, P.; Hennessy, T.; Dillon, E.; Onakuse, S.; Moran, B.; Shalloo, L. Evaluating the effects of grass management technologies on the physical, environmental, and financial performance of Irish pasture-based dairy farms. J. Dairy Sci. 2023, 106, 6249–6262. [Google Scholar] [CrossRef]
- Czubak, W.; Pawłowski, K.P.; Sadowski, A. Outcomes of farm investment in Central and Eastern Europe: The role of financial public support and investment scale. Land Use Policy 2021, 108, 105655. [Google Scholar] [CrossRef]
- Kusz, D. Level of investment expenditure versus changes in technical labour equipment and labour efficiency in agriculture in Poland. In Proceedings of the 2018 International Scientifi c Conference ‘Economic Sciences for Agribusiness and Rural Economy’ No 1, Warsaw, Poland, 7–8 June 2018; pp. 315–320. [Google Scholar] [CrossRef]
- Wilson, P. Decomposing variation in dairy profitability: The impact of output, inputs, prices, labour and management. J. Agric. Sci. 2011, 149, 507–517. [Google Scholar] [CrossRef]
- Krpalkova, L.; Cabrera, V.E.; Kvapilik, J.; Burdych, J. Dairy farm profit according to the herd size, milk yield, and number of cows per worker. Agric. Econ. 2016, 62, 225–234. [Google Scholar] [CrossRef]
- Kusz, B.; Kusz, D.; Bąk, I.; Oesterreich, M.; Wicki, L.; Zimon, G. Selected Economic Determinants of Labor Profitability in Family Farms in Poland in Relation to Economic Size. Sustainability 2022, 14, 13819. [Google Scholar] [CrossRef]
- Kryszak, Ł.; Guth, M.; Czyżewski, B. Determinants of farm profitability in the EU regions. Does farm size matter? Agric. Econ. 2021, 67, 90–100. [Google Scholar] [CrossRef]
- Barral, S.; Detang-Dessendre, C. Reforming the Common Agricultural Policy (2023–2027): Multidisciplinary views. Rev. Agric. Food Environ. Stud. 2023, 104, 47–50. [Google Scholar] [CrossRef]
- Adenaeuer, L.; Breen, J.; Hayden, A. Insights in overcoming the non-adoption of voluntary agricultural ghg mitigation measures in Ireland. Econ. Agro-Alimentare. 2020, 22, 1–26. [Google Scholar] [CrossRef]
- OECD/FAO. Chapter 7. Dairy and Dairy Products. OECD-FAO Agric Outlook 2022–2031. 2022. Available online: https://www.fao.org/3/CC0308EN/Dairy.pdf (accessed on 23 November 2023).


| Stimulants | Destimulants | ||
|---|---|---|---|
| Area of own agricultural land (ha) | X1 | Agricultural land lease price (EUR/ha) | X7 |
| Area of leased agricultural land (ha) | X2 | Employee rental price (EUR/hour) | X8 |
| Value of farm buildings (EUR/farm) | X3 | Output rate in financing assets with liabilities (%) | X9 |
| Value of tractors, agricultural machinery, and equipment (EUR/farm) | X4 | Disparity in income from work on a dairy farm in relation to the potential wage outside agriculture (%) | X10 |
| Number of cows (average) | X5 | ||
| Milk yield of cows (kg/year) | X6 | ||
| Country | Year | Indicators (Stimulants) | |||||
|---|---|---|---|---|---|---|---|
| X1 | X2 | X3 | X4 | X5 | X6 | ||
| (DE) Germany | 2014 | 26.84 | 45.41 | 127,374.00 | 122,113.00 | 62.29 | 7448.27 |
| 2015 | 27.54 | 49.21 | 142,424.00 | 126,472.00 | 67.43 | 7678.47 | |
| 2016 | 28.01 | 49.62 | 141,119.00 | 126,329.00 | 69.19 | 7586.93 | |
| 2017 | 28.21 | 49.40 | 141,323.00 | 133,145.00 | 70.10 | 7836.31 | |
| 2018 | 30.76 | 58.39 | 166,402.00 | 159,182.00 | 78.59 | 8031.55 | |
| 2019 | 31.37 | 59.07 | 173,232.00 | 168,263.00 | 78.71 | 8278.38 | |
| 2020 | 31.47 | 60.57 | 174,238.00 | 173,921.00 | 79.11 | 8317.47 | |
| 2021 | 31.22 | 60.99 | 177,146.00 | 183,582.00 | 80.02 | 8273.72 | |
| (FE) France | 2014 | 11.68 | 78.74 | 108,488.00 | 86,426.00 | 58.36 | 6929.01 |
| 2015 | 11.04 | 87.31 | 116,649.00 | 94,044.00 | 63.69 | 7019.03 | |
| 2016 | 11.41 | 86.11 | 114,673.00 | 90,960.00 | 63.65 | 6871.51 | |
| 2017 | 12.03 | 84.74 | 111,577.00 | 90,884.00 | 64.46 | 6926.47 | |
| 2018 | 12.05 | 98.34 | 136,915.00 | 108,096.00 | 72.25 | 7045.36 | |
| 2019 | 10.58 | 98.30 | 137,596.00 | 108,216.00 | 72.61 | 7077.45 | |
| 2020 | 11.23 | 99.10 | 150,989.00 | 118,464.00 | 73.02 | 7237.76 | |
| 2021 | 11.47 | 99.28 | 158,676.00 | 124,778.00 | 74.19 | 7255.09 | |
| (IT) Italy | 2014 | 9.79 | 19.14 | 67,351.00 | 42,230.00 | 53.95 | 6057.36 |
| 2015 | 10.30 | 21.78 | 70,263.00 | 40,385.00 | 51.40 | 6284.93 | |
| 2016 | 10.99 | 21.48 | 63,961.00 | 40,462.00 | 54.11 | 6017.46 | |
| 2017 | 11.78 | 21.24 | 73,639.00 | 40,310.00 | 55.96 | 5752.05 | |
| 2018 | 13.07 | 27.92 | 82,184.00 | 48,008.00 | 68.30 | 6058.55 | |
| 2019 | 13.34 | 25.86 | 85,483.00 | 51,654.00 | 67.86 | 6281.41 | |
| 2020 | 12.73 | 28.08 | 91,602.00 | 59,380.00 | 69.44 | 6352.70 | |
| 2021 | 12.66 | 29.79 | 92,874.00 | 62,150.00 | 70.06 | 6602.94 | |
| (NL) The Netherlands | 2014 | 34.03 | 19.39 | 298,092.00 | 134,014.00 | 94.16 | 8033.12 |
| 2015 | 34.84 | 20.85 | 339,257.00 | 139,861.00 | 101.65 | 8238.08 | |
| 2016 | 34.48 | 21.88 | 329,957.00 | 131,312.00 | 104.02 | 8323.49 | |
| 2017 | 36.17 | 21.36 | 340,047.00 | 139,612.00 | 104.12 | 8711.56 | |
| 2018 | 37.92 | 22.22 | 349,464.00 | 148,539.00 | 105.24 | 8873.58 | |
| 2019 | 35.94 | 24.14 | 324,741.00 | 156,469.00 | 104.25 | 8825.15 | |
| 2020 | 37.42 | 23.90 | 322,875.00 | 166,732.00 | 106.07 | 8877.16 | |
| 2021 | 35.12 | 26.47 | 311,141.00 | 168,358.00 | 105.76 | 8764.25 | |
| (PL) Poland | 2014 | 15.89 | 5.55 | 46,714.00 | 42,214.00 | 16.10 | 5349.95 |
| 2015 | 16.79 | 6.11 | 48,650.00 | 45,195.00 | 17.74 | 5465.39 | |
| 2016 | 16.34 | 5.74 | 45,351.00 | 39,811.00 | 16.92 | 5630.18 | |
| 2017 | 17.14 | 6.37 | 49,811.00 | 45,172.00 | 18.47 | 5868.14 | |
| 2018 | 17.90 | 8.59 | 54,656.00 | 49,988.00 | 20.38 | 6190.33 | |
| 2019 | 18.22 | 8.42 | 55,446.00 | 50,542.00 | 20.91 | 6324.16 | |
| 2020 | 17.77 | 8.07 | 52,889.00 | 50,494.00 | 20.86 | 6422.44 | |
| 2021 | 17.46 | 7.38 | 50,963.00 | 51,496.00 | 20.85 | 6291.11 | |
| Country | Year | Indicators (Stimulants) | |||
|---|---|---|---|---|---|
| X7 | X8 | X9 | X10 | ||
| (DE) Germany | 2014 | 280.16 | 14.12 | 22.4 | 25.26 |
| 2015 | 284.05 | 14.04 | 24.8 | 42.66 | |
| 2016 | 293.57 | 13.91 | 25.4 | 22.12 | |
| 2017 | 307.23 | 14.66 | 24.6 | −22.20 | |
| 2018 | 312.01 | 15.56 | 26.4 | 11.70 | |
| 2019 | 317.84 | 15.91 | 27.5 | 26.22 | |
| 2020 | 314.28 | 16.38 | 27.6 | 25.19 | |
| 2021 | 323.04 | 16.97 | 27.3 | −22.96 | |
| (FE) France | 2014 | 149.28 | 12.99 | 45.45 | 33.08 |
| 2015 | 150.93 | 12.61 | 49.04 | 47.33 | |
| 2016 | 147.66 | 12.37 | 49.88 | 58.37 | |
| 2017 | 144.28 | 12.52 | 47.86 | 23.26 | |
| 2018 | 142.68 | 12.88 | 52.06 | 34.00 | |
| 2019 | 142.81 | 12.91 | 51.27 | 22.83 | |
| 2020 | 145.57 | 13.21 | 52.61 | 28.14 | |
| 2021 | 149.74 | 13.31 | 51.81 | 12.88 | |
| (IT) Italy | 2014 | 277.01 | 11.38 | 3.39 | −140.92 |
| 2015 | 226.77 | 11.74 | 1.92 | −85.28 | |
| 2016 | 234.17 | 11.99 | 1.23 | −90.92 | |
| 2017 | 234.65 | 11.38 | 1.61 | −97.56 | |
| 2018 | 224.89 | 12.37 | 1.77 | −142.38 | |
| 2019 | 249.73 | 12.37 | 1.39 | −124.11 | |
| 2020 | 217.20 | 12.44 | 1.47 | −152.60 | |
| 2021 | 223.13 | 12.83 | 1.80 | −148.26 | |
| (NL) The Netherlands | 2014 | 865.24 | 15.24 | 33.12 | 5.04 |
| 2015 | 602.45 | 14.90 | 35.40 | 37.21 | |
| 2016 | 699.50 | 15.77 | 36.72 | 60.31 | |
| 2017 | 784.55 | 16.44 | 34.21 | −34.48 | |
| 2018 | 892.93 | 17.48 | 25.92 | 10.68 | |
| 2019 | 761.10 | 17.81 | 27.21 | −6.54 | |
| 2020 | 778.16 | 18.47 | 27.48 | 32.40 | |
| 2021 | 783.87 | 19.26 | 25.24 | 11.53 | |
| (PL) Poland | 2014 | 87.93 | 2.76 | 5.19 | 18.80 |
| 2015 | 87.23 | 2.94 | 5.26 | 32.56 | |
| 2016 | 89.55 | 2.70 | 4.85 | 24.89 | |
| 2017 | 94.03 | 2.94 | 5.22 | −4.60 | |
| 2018 | 93.95 | 5.76 | 6.26 | 0.51 | |
| 2019 | 97.39 | 6.64 | 5.84 | 3.97 | |
| 2020 | 98.27 | 6.04 | 5.16 | 5.12 | |
| 2021 | 103.93 | 5.40 | 4.65 | −10.20 | |
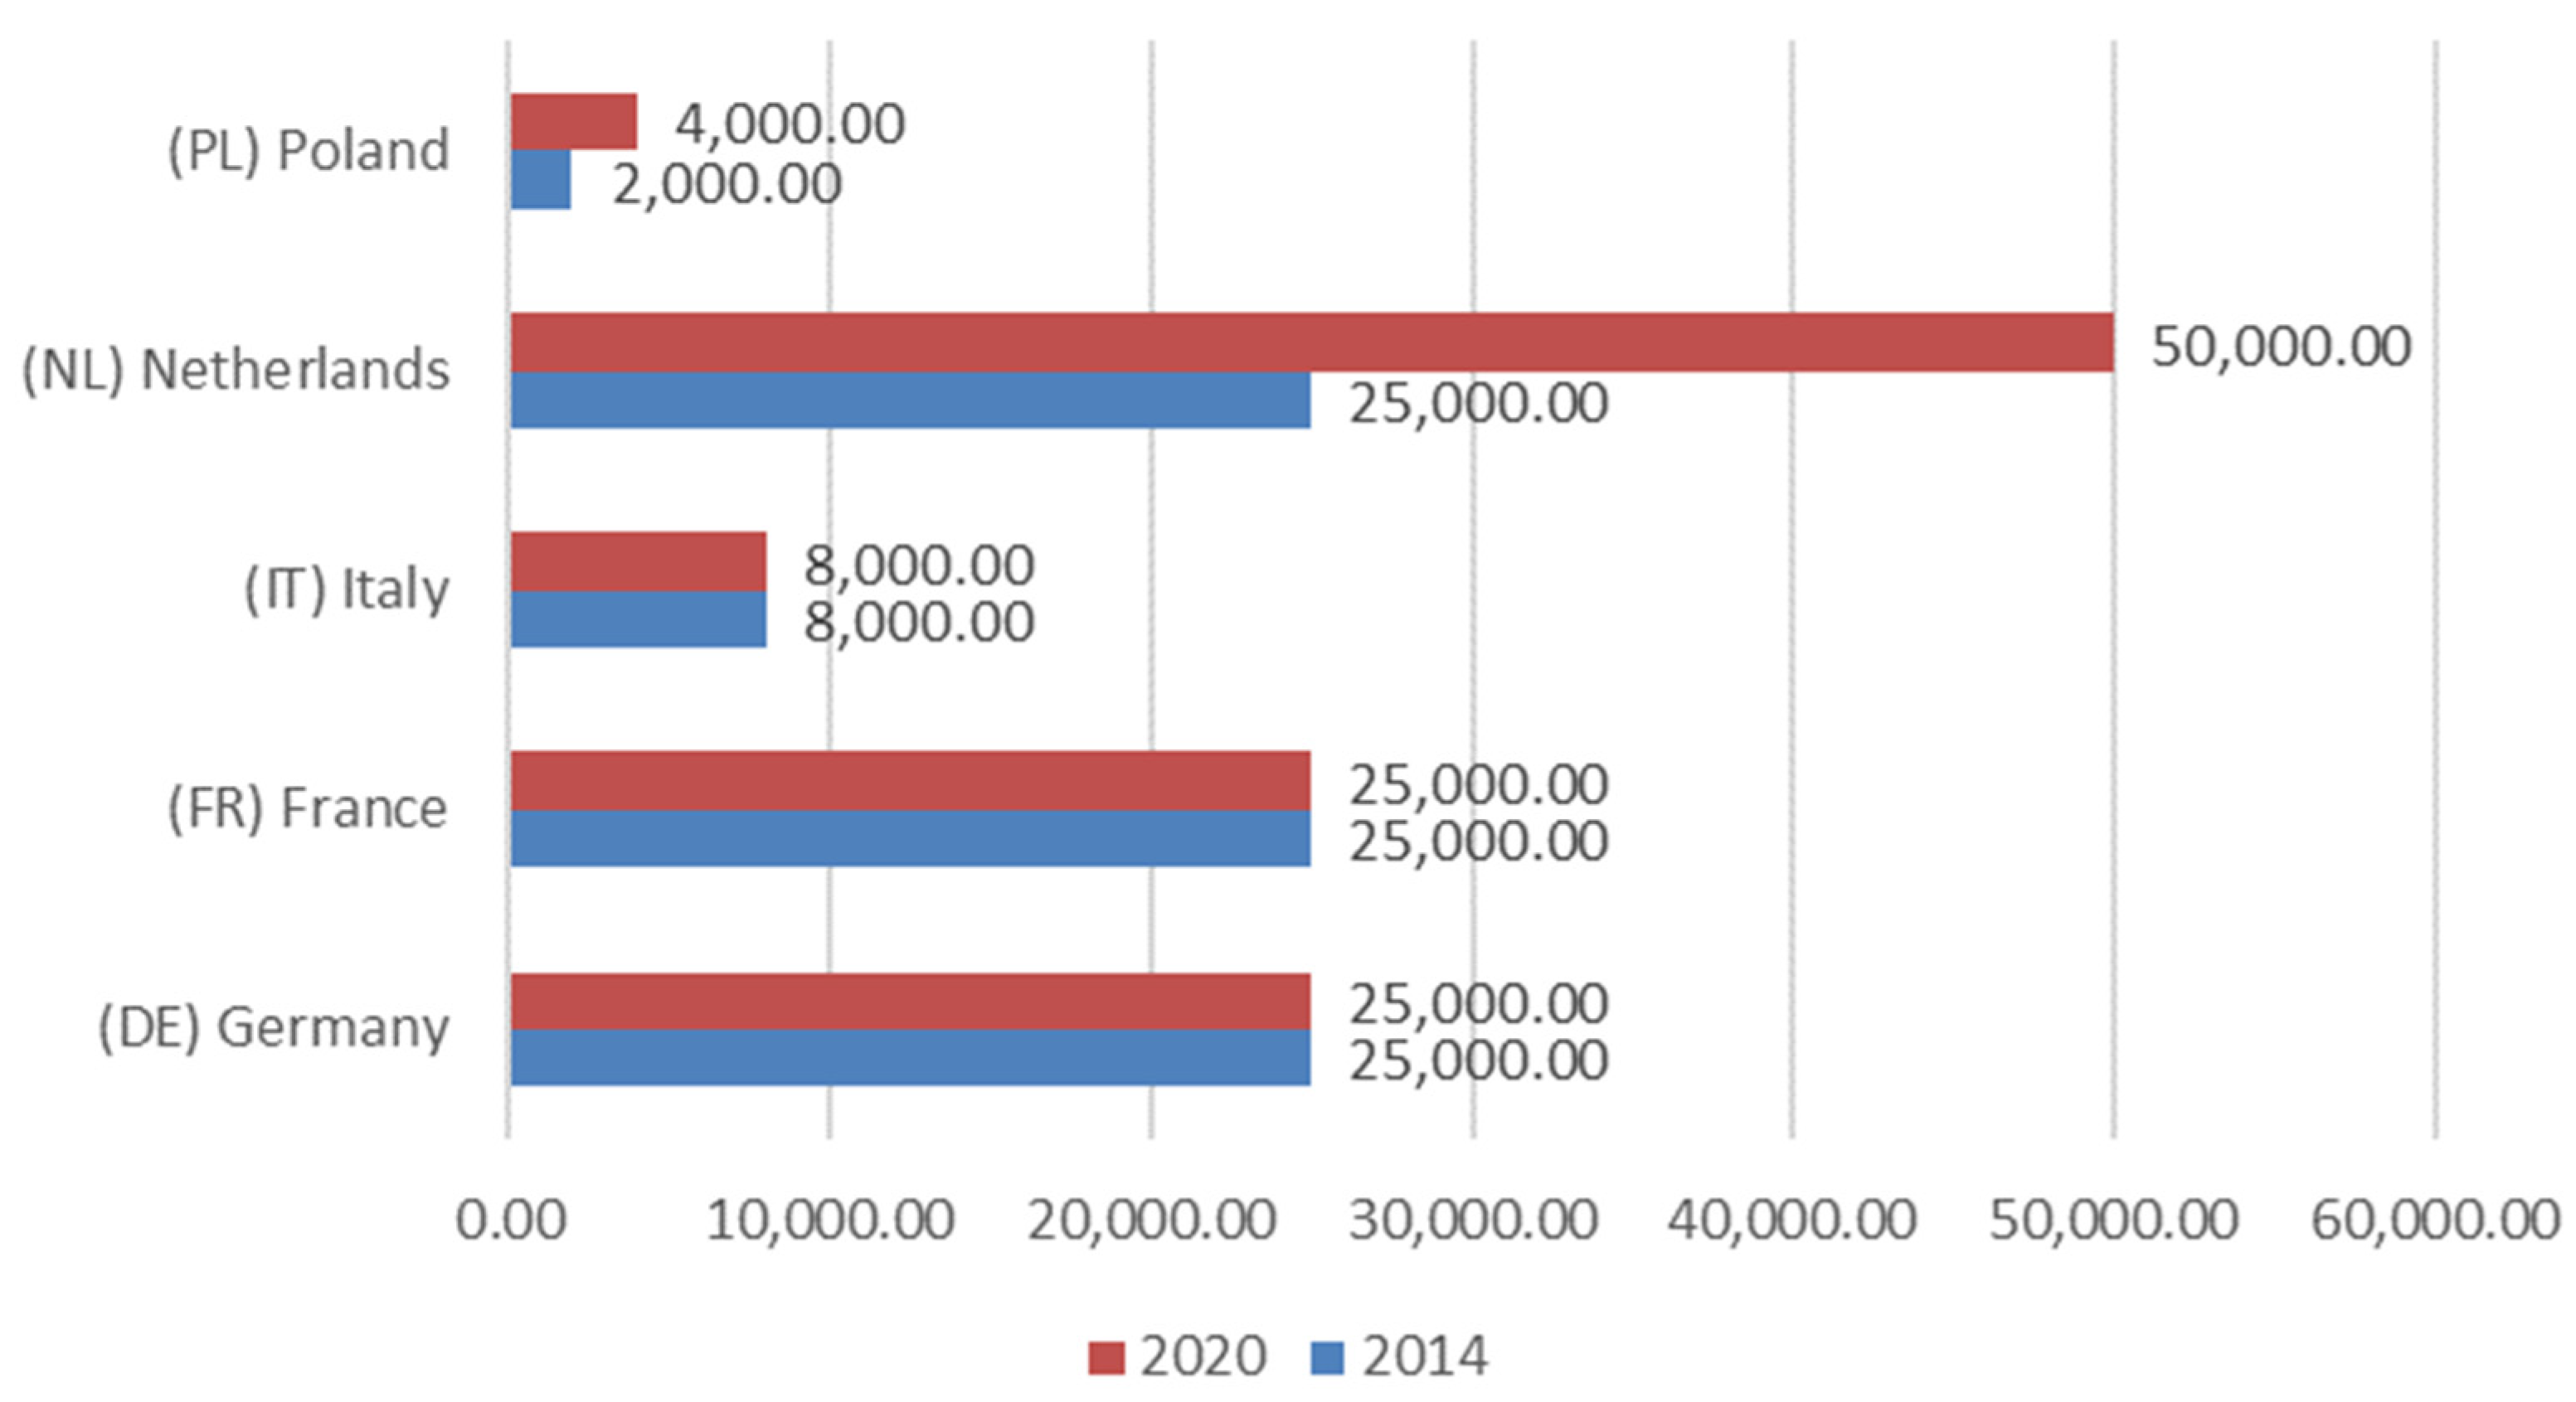
| Ordinal Number | Size Group | Standard Output Thresholds [EUR] |
|---|---|---|
| 1 | Very small | 2000 ≤ EUR < 8000 |
| 2 | Small | 8000 ≤ EUR < 25,000 |
| 3 | Medium-small | 25,000 ≤ EUR < 50,000 |
| 4 | Medium-large | 50,000 ≤ EUR < 100,000 |
| 5 | Large | 100,000 ≤ EUR < 500,000 |
| 6 | Very large | EUR ≥ 500,000 |
| Country | Year | Indicators (Stimulants) | |||||
|---|---|---|---|---|---|---|---|
| X1 | X2 | X3 | X4 | X5 | X6 | ||
| (DE) Germany | 2014 | 27.36 | 45.52 | 139,476.00 | 132,653.00 | 67.78 | 7338.36 |
| 2015 | 26.30 | 44.41 | 138,265.00 | 123,985.00 | 65.35 | 7451.38 | |
| 2016 | 26.64 | 44.89 | 133,667.00 | 122,630.00 | 66.91 | 7324.65 | |
| 2017 | 26.93 | 44.62 | 134,045.00 | 128,632.00 | 67.73 | 7565.14 | |
| 2018 | 27.09 | 46.99 | 142,829.00 | 138,797.00 | 68.41 | 7616.03 | |
| 2019 | 27.38 | 47.15 | 149,301.00 | 149,273.00 | 68.74 | 7895.79 | |
| 2020 | 27.48 | 48.33 | 147,247.00 | 154,489.00 | 68.74 | 7883.33 | |
| 2021 | 26.84 | 49.06 | 150,511.00 | 162,214.00 | 68.98 | 7790.24 | |
| (FE) France | 2014 | 10.17 | 92.65 | 125,804.00 | 100,242.00 | 67.06 | 7096.00 |
| 2015 | 10.06 | 93.52 | 123,010.00 | 98,865.00 | 67.42 | 7088.77 | |
| 2016 | 10.29 | 92.77 | 122,140.00 | 97,069.00 | 67.94 | 6938.46 | |
| 2017 | 11.05 | 91.82 | 120,096.00 | 97,195.00 | 68.80 | 6976.50 | |
| 2018 | 11.44 | 97.53 | 126,572.00 | 103,946.00 | 70.88 | 6977.18 | |
| 2019 | 9.81 | 98.58 | 129,338.00 | 107,434.00 | 71.00 | 7025.16 | |
| 2020 | 10.31 | 99.84 | 144,293.00 | 117,999.00 | 71.35 | 7191.60 | |
| 2021 | 10.32 | 100.05 | 144,642.00 | 122,877.00 | 72.34 | 7144.46 | |
| (IT) Italy | 2014 | 11.74 | 31.87 | 59,514.00 | 44,802.00 | 85.02 | 6073.83 |
| 2015 | 11.29 | 30.40 | 60,224.00 | 34,227.00 | 73.01 | 5786.07 | |
| 2016 | 12.38 | 30.17 | 57,944.00 | 35,613.00 | 77.53 | 5483.80 | |
| 2017 | 14.13 | 28.76 | 65,198.00 | 34,002.00 | 79.58 | 5243.84 | |
| 2018 | 13.75 | 33.47 | 70,161.00 | 38,680.00 | 74.44 | 5709.36 | |
| 2019 | 14.26 | 31.15 | 74,331.00 | 42,861.00 | 76.95 | 5947.00 | |
| 2020 | 13.83 | 35.28 | 79,686.00 | 56,223.00 | 79.96 | 6171.90 | |
| 2021 | 14.00 | 36.53 | 70,783.00 | 55,559.00 | 77.31 | 6245.52 | |
| (NL) Netherlands | 2014 | 28.53 | 17.88 | 241,660.00 | 110,118.00 | 79.37 | 7881.48 |
| 2015 | 26.39 | 17.67 | 243,968.00 | 102,169.00 | 74.03 | 7974.89 | |
| 2016 | 26.19 | 18.45 | 238,966.00 | 94,885.00 | 75.56 | 7966.03 | |
| 2017 | 27.26 | 17.76 | 248,492.00 | 103,214.00 | 75.69 | 8422.32 | |
| 2018 | 28.02 | 17.91 | 246,578.00 | 110,568.00 | 74.16 | 8523.07 | |
| 2019 | 26.89 | 19.47 | 238,930.00 | 114,863.00 | 75.48 | 8539.60 | |
| 2020 | 28.01 | 19.29 | 232,303.00 | 120,866.00 | 76.57 | 8576.30 | |
| 2021 | 26.70 | 21.20 | 215,245.00 | 121,352.00 | 76.69 | 8479.98 | |
| (PL) Poland | 2014 | 47.49 | 26.78 | 169,427.00 | 184,095.00 | 63.69 | 6875.42 |
| 2015 | 41.43 | 23.48 | 152,905.00 | 166,054.00 | 57.75 | 7198.26 | |
| 2016 | 41.61 | 22.96 | 142,216.00 | 148,620.00 | 58.12 | 7281.12 | |
| 2017 | 41.10 | 24.45 | 145,053.00 | 151,869.00 | 58.61 | 7452.86 | |
| 2018 | 38.07 | 23.25 | 136,008.00 | 141,999.00 | 55.51 | 7426.32 | |
| 2019 | 37.92 | 23.27 | 135,249.00 | 140,951.00 | 56.44 | 7637.27 | |
| 2020 | 37.15 | 22.78 | 126,613.00 | 141,618.00 | 55.83 | 7720.85 | |
| 2021 | 36.17 | 22.28 | 124,866.00 | 148,967.00 | 56.61 | 7601.85 | |
| Country | Year | Indicators (Stimulants) | |||
|---|---|---|---|---|---|
| X7 | X8 | X9 | X10 | ||
| (DE) Germany | 2014 | 182.09 | 13.58 | 22.0 | 18.0 |
| 2015 | 175.05 | 12.68 | 22.3 | 37.1 | |
| 2016 | 182.33 | 12.73 | 22.1 | 16.6 | |
| 2017 | 186.76 | 13.56 | 21.1 | −27.6 | |
| 2018 | 190.29 | 14.59 | 21.9 | 9.8 | |
| 2019 | 196.79 | 14.85 | 22.9 | 25.1 | |
| 2020 | 197.51 | 15.37 | 22.5 | 22.5 | |
| 2021 | 202.77 | 15.77 | 22.5 | −15.4 | |
| (FE) France | 2014 | 139.08 | 12.98 | 47.61 | 29.59 |
| 2015 | 137.74 | 12.36 | 49.76 | 46.28 | |
| 2016 | 134.22 | 12.24 | 50.81 | 56.36 | |
| 2017 | 130.49 | 12.41 | 48.72 | 20.28 | |
| 2018 | 125.89 | 12.51 | 50.74 | 33.26 | |
| 2019 | 127.95 | 12.53 | 50.31 | 23.86 | |
| 2020 | 130.40 | 12.98 | 52.15 | 28.22 | |
| 2021 | 133.62 | 12.92 | 51.03 | 15.08 | |
| (IT) Italy | 2014 | 197.71 | 11.08 | 5.33 | −215.22 |
| 2015 | 158.53 | 10.61 | 2.24 | −111.60 | |
| 2016 | 142.07 | 10.72 | 1.30 | −129.49 | |
| 2017 | 165.35 | 10.84 | 2.04 | −126.35 | |
| 2018 | 142.27 | 11.16 | 2.40 | −143.28 | |
| 2019 | 158.23 | 11.13 | 1.83 | −123.36 | |
| 2020 | 141.97 | 10.85 | 1.90 | −152.99 | |
| 2021 | 150.96 | 12.28 | 2.00 | −132.61 | |
| (NL) The Netherlands | 2014 | 301.94 | 13.64 | 30.34 | 21.12 |
| 2015 | 224.94 | 13.33 | 31.72 | 51.46 | |
| 2016 | 254.26 | 14.98 | 33.16 | 64.56 | |
| 2017 | 280.21 | 16.05 | 29.90 | 0.24 | |
| 2018 | 322.95 | 17.08 | 22.84 | 37.69 | |
| 2019 | 286.32 | 17.45 | 23.92 | 25.67 | |
| 2020 | 277.04 | 16.83 | 23.09 | 50.26 | |
| 2021 | 304.03 | 19.12 | 21.20 | 39.38 | |
| (PL) Poland | 2014 | 35.91 | 2.79 | 11.43 | −211.13 |
| 2015 | 38.99 | 2.76 | 10.99 | −120.42 | |
| 2016 | 37.22 | 2.65 | 11.21 | −130.69 | |
| 2017 | 41.97 | 3.01 | 11.74 | −226.53 | |
| 2018 | 44.49 | 3.09 | 11.47 | −160.61 | |
| 2019 | 46.56 | 3.44 | 10.76 | −156.35 | |
| 2020 | 47.34 | 3.85 | 9.57 | −143.85 | |
| 2021 | 47.46 | 3.83 | 8.47 | −181.63 | |
Disclaimer/Publisher’s Note: The statements, opinions and data contained in all publications are solely those of the individual author(s) and contributor(s) and not of MDPI and/or the editor(s). MDPI and/or the editor(s) disclaim responsibility for any injury to people or property resulting from any ideas, methods, instructions or products referred to in the content. |
© 2024 by the authors. Licensee MDPI, Basel, Switzerland. This article is an open access article distributed under the terms and conditions of the Creative Commons Attribution (CC BY) license (https://creativecommons.org/licenses/by/4.0/).
Share and Cite
Parzonko, A.; Parzonko, A.J.; Bórawski, P. Economic Competitiveness of Dairy Farms from the Top Milk-Producing Countries in the EU: Assessment in 2014–2021. Agriculture 2024, 14, 123. https://doi.org/10.3390/agriculture14010123
Parzonko A, Parzonko AJ, Bórawski P. Economic Competitiveness of Dairy Farms from the Top Milk-Producing Countries in the EU: Assessment in 2014–2021. Agriculture. 2024; 14(1):123. https://doi.org/10.3390/agriculture14010123
Chicago/Turabian StyleParzonko, Andrzej, Anna Justyna Parzonko, and Piotr Bórawski. 2024. "Economic Competitiveness of Dairy Farms from the Top Milk-Producing Countries in the EU: Assessment in 2014–2021" Agriculture 14, no. 1: 123. https://doi.org/10.3390/agriculture14010123