Article

A Method for Calculating the Leaf Area of Pak Choi Based on an Improved Mask R-CNN

1
School of Mechanical Engineering, Shanghai Jiao Tong University, Shanghai 200240, China
2
Key Laboratory of Intelligent Agricultural Technology (Yangtze River Delta), Ministry of Agriculture and Rural Affairs, Shanghai 200240, China
*
Author to whom correspondence should be addressed.
Agriculture 2024, 14(1), 101; https://doi.org/10.3390/agriculture14010101
Submission received: 12 December 2023 / Revised: 3 January 2024 / Accepted: 4 January 2024 / Published: 5 January 2024

Abstract

:
The leaf area of pak choi is a critical indicator of growth rate, nutrient absorption, and photosynthetic efficiency, and it is required to be precisely measured for an optimal agricultural output. Traditional methods often fail to deliver the necessary accuracy and efficiency. We propose a method for calculating the leaf area of pak choi based on an improved Mask R-CNN. We have enhanced Mask R-CNN by integrating an advanced attention mechanism and a two-layer fully convolutional network (FCN) into its segmentation branch. This integration significantly improves the model’s ability to detect and segment leaf edges with increased precision. By extracting the contours of reference objects, the conversion coefficient between the pixel area and the actual area is calculated. Using the mask segmentation output from the model, the area of each leaf is calculated. Experimental results demonstrate that the improved model achieves mean average precision (mAP) scores of 0.9136 and 0.9132 in detection and segmentation tasks, respectively, representing improvements of 1.01% and 1.02% over the original Mask R-CNN. The model demonstrates excellent recognition and segmentation capabilities for pak choi leaves. The error between the calculation result of the segmented leaf area and the actual measured area is less than 4.47%. These results indicate that the proposed method provides a reliable segmentation and prediction performance. It eliminates the need for detached leaf measurements, making it suitable for real-life leaf area measurement scenarios and providing valuable support for automated production technologies in plant factories.

1. Introduction

A plant factory is an agricultural facility controlled by artificial means [1]. Unmanned cultivation and production technology is a future development trend in plant factories. Automatic monitoring of plant growth stages is a crucial technology currently under development. Pak choi are a significant cultivated vegetable valued for their high nutritional content and short cultivation cycle, making them well suited for large-scale production in plant factories [2]. The leaf area is a critical indicator of pak choi’s growth rate, yield, and varietal characteristics. Currently, technologies such as digital infrared thermography and near-infrared and hyperspectral imaging have been used to identify the photosynthetic activity, diseases, and nutritional status of pak choi leaves. However, there is limited research on the digital and automated assessments of the pak choi leaf area. Therefore, there is an urgent need to develop a method that can automatically and accurately measure the leaf area of pak choi.
Recently, image processing technology has been widely applied in agriculture, encompassing crop classification [3,4], pest and disease identification [5,6], and yield estimation [7,8]. Non-contact methods for acquiring plant phenotypic information have become a focal point of interest [9]. Leaf segmentation, a crucial part of plant phenotypic research, has prompted the introduction of various methods proposed to improve accuracy [10]. With the advancement of machine learning theory, deep learning algorithms based on convolutional neural networks (CNNs) have been widely applied in leaf segmentation [11]. A concise overview of the literature on leaf segmentation is presented in Table 1. Zhang et al. proposed an algorithm for segmenting cucumber leaf lesions using multi-scale feature fusion convolutional neural networks, which enhanced the accuracy of segmenting diseased leaves [12]. Zhao et al. utilized the Mask R-CNN model to research the diagnosis of water stress in greenhouse tomato leaves and fine-tuned the DenseNet169 image classification model to classify leaf water stress [13]. Trivedi et al. utilized UNet for leaf segmentation and calculated the total area of the segmented leaves to monitor plant growth. However, the total leaf area may not fully reflect plant growth [14]. Liu et al. proposed an improved SOLO V2 model for segmenting diseased tomato leaves, which involved optimizing the convolutional structure and loss function [15]. Weyler et al. proposed a method based on ERFNet and clustering to segment crop leaves and plants collected by UAVs (unmanned aerial vehicles) [16]. Yuan et al. proposed an improved DeepLab v3+ deep learning network for the segmentation of grapevine leaf black rot spots with a feature fusion branch based on a feature pyramid network [17]. Bhagat et al. proposed a novel method called Eff-UNet++ for leaf segmentation and counting with redesigned skip connections and a residual block in the decoder [18]. Deb et al. proposed a novel convolutional neural network called LS-Net for the leaf segmentation of rosette plants [19]. Zhu et al. proposed a novel two-stage DeepLabv3+ with adaptive loss, reverse attention, and a channel attention block for the segmentation of apple leaf disease images in complex scenes [20]. Zhang et al. integrated the Sobel operator into the segmentation branch of Mask R-CNN, improving the performance of the segmentation branch and achieving precise segmentation of cucumber leaves, and proposed a method for measuring the area based on cucumber leaf segmentation [21]. Banu et al. proposed a novel AWUNet (attention-gated wavelet pooled UNet) model integrating wavelet pooling and an attention gate module for leaf area segmentation [22]. Yang et al. proposed an approach that fuses YOLOv8, and improved DeepLabv3+ for the precise image segmentation of individual leaves [23]. In summary, the application of convolutional neural networks and the enhancement of their structures have greatly contributed to resolving leaf segmentation problems and obtaining leaf phenotype information.
Based on the aforementioned research, we propose a method for calculating the leaf area of pak choi using an improved Mask R-CNN. We enhanced the original Mask R-CNN model by incorporating an attention mechanism and a two-layer FCN into its segmentation branch. This modification significantly enhances the model’s ability to detect and segment leaf edges, leading to masks that more accurately depict the contours of the leaves. By extracting the contours of reference objects, we calculated a conversion coefficient between the pixel area and actual area. This allows for the calculation of the individual leaf area using the mask segmentation output from the model. This method can provide valuable support for the development of automated production technologies in plant factories.

2. Materials and Methods

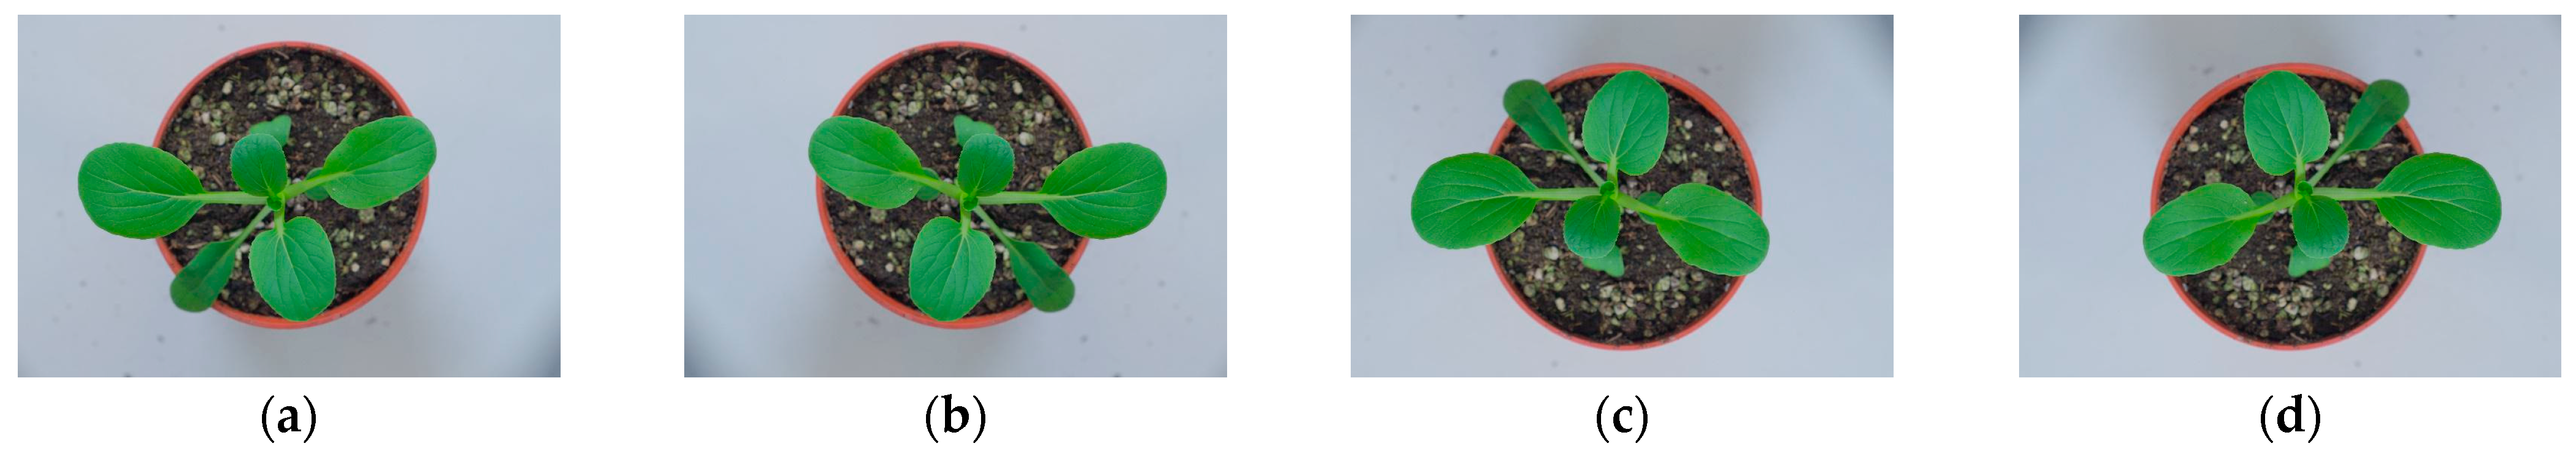
2.1. Pak Choi Planting and Image Acquisition

To ensure that the image data of pak choi accurately reflect the real-world conditions in plant factory production, we conducted a meticulous cultivation experiment at the School of Agriculture and Biological Engineering, Shanghai Jiao Tong University, Shanghai, China. This study was conducted during the optimal growth months of September and October 2023. It involved the careful cultivation of two trays, each containing 20 pak choi plants of the “Hua Wang” variety. The controlled environment within the plant cultivation greenhouse was meticulously maintained to mirror optimal growing conditions. These conditions included a stable day/night temperature regime set at 25 °C/20 °C, a photoperiod consisting of a 14 h light and 10 h dark cycle, and a relative humidity maintained between 50% and 75%. Crucially, LED lighting (Guixiang Optoelectronics Co. Ltd., Qingzhou, China) was used to enhance natural light, ensuring optimal growth conditions for the pak choi. Furthermore, the plants were irrigated with a rigorously quantified regimen of a nutrient solution, specifically formulated for pak choi. This solution, consisting of a 0.5% high-potassium water-soluble fertilizer (Duofen Agriculture Co. Ltd., Qingzhou, China) with a composition of 15-15-30-TE, was formulated to promote vigorous growth. Considering the consistent planting in porous seedling trays and the workload of image annotation, image data collection was conducted for individual pak choi. The dataset was systematically divided, with images from 30 pak choi plants allocated to the training and validation datasets, and images from an additional 10 plants designated for the test dataset. To ensure the quality and stability of the images, in this study, we used a Fujifilm X-T5 digital camera equipped with a kit lens (FUJIFILM Imaging Systems (Suzhou) Co. Ltd., Suzhou, China), along with a tripod to ensure steady shooting. To minimize the potential effects of external factors, such as weather changes, on image collection, shooting was scheduled during the well-lit hours of 2–3 PM each day. To ensure the consistency of the collected images, the height of the tripod and the angle of the camera were fixed, essentially maintaining the same exposure settings for each shooting session. The image collection system used in this study is shown in Figure 1. Throughout the entire growth cycle of 40 pak choi, a total of 800 high-quality images were collected. Dataset 1 comprises 600 model training and validation images, and Dataset 2 comprises 200 images used for model testing. Figure 2 shows images of pak choi at different growth stages. In the seedling stage, the leaves are smaller, and there is no overlapping between them. During the growth period, there is a slight overlap between the leaves. In the mature stage, the overlap between the leaves becomes more severe.

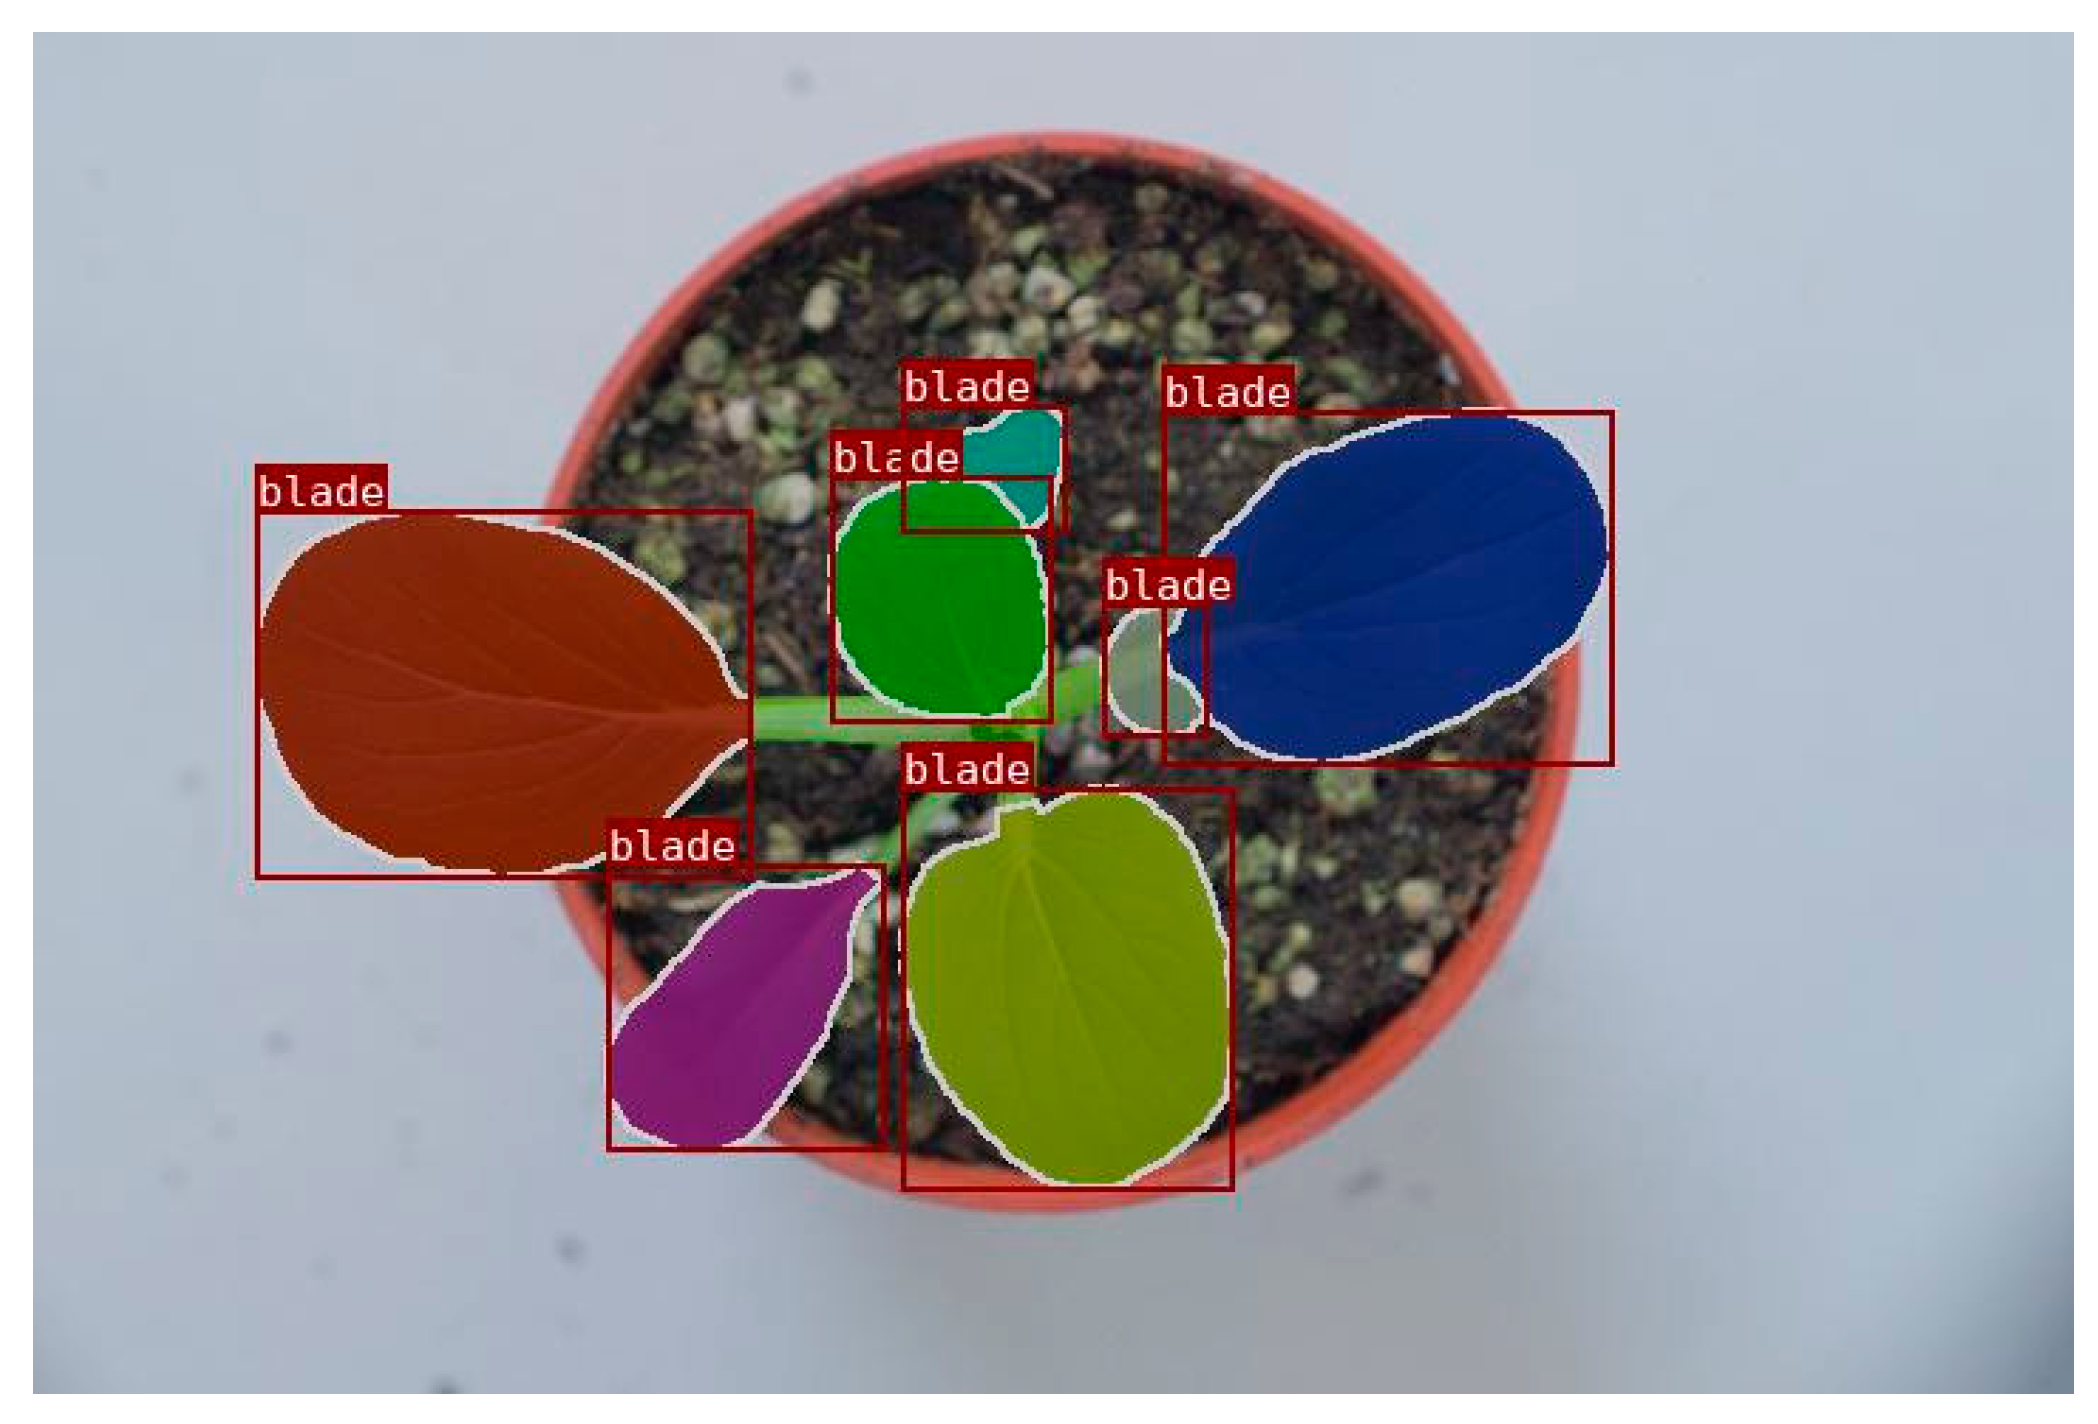
2.2. Image Annotation and Preprocessing

To fulfill the supervised learning requirements of Mask-RCNN, detailed annotation of the training images was initially carried out. To reduce the complexity of training, images were uniformly resized to 720 pixels by 480 pixels. Subsequently, the open-source annotation tool LabelMe was used for image annotation. Using the polygon tool, accurate annotations of leaf areas and contours were created, resulting in corresponding JSON files for each image, as shown in Figure 3. After annotating 800 original images, Dataset 1 was split into a training dataset and a validation dataset in an 8:2 ratio, with 480 images for training and 120 images for validation. Additionally, Dataset 2, which comprises 200 images, was used to build the testing dataset. To improve the data diversity and generalization ability, data augmentation techniques, as shown in Figure 4, such as horizontal and vertical mirroring and rotation were applied. This expanded the training dataset to 1920 images and the validation dataset to 480 images. To adapt to the Mask-RCNN network input, the annotated images and JSON files were converted into the COCO dataset format. Furthermore, for a visual demonstration of the annotation results, Figure 5 shows the visualization of images annotated using the LabelMe tool. Based on these annotated data, an instance segmentation network was trained to accurately extract features such as the color characteristics and contour edges of the pak choi leaves in the images. The network outputs individual segmentation masks for each leaf, enabling accurate calculation of the area of each leaf.

2.3. Improved Mask R-CNN Instance Segmentation Model
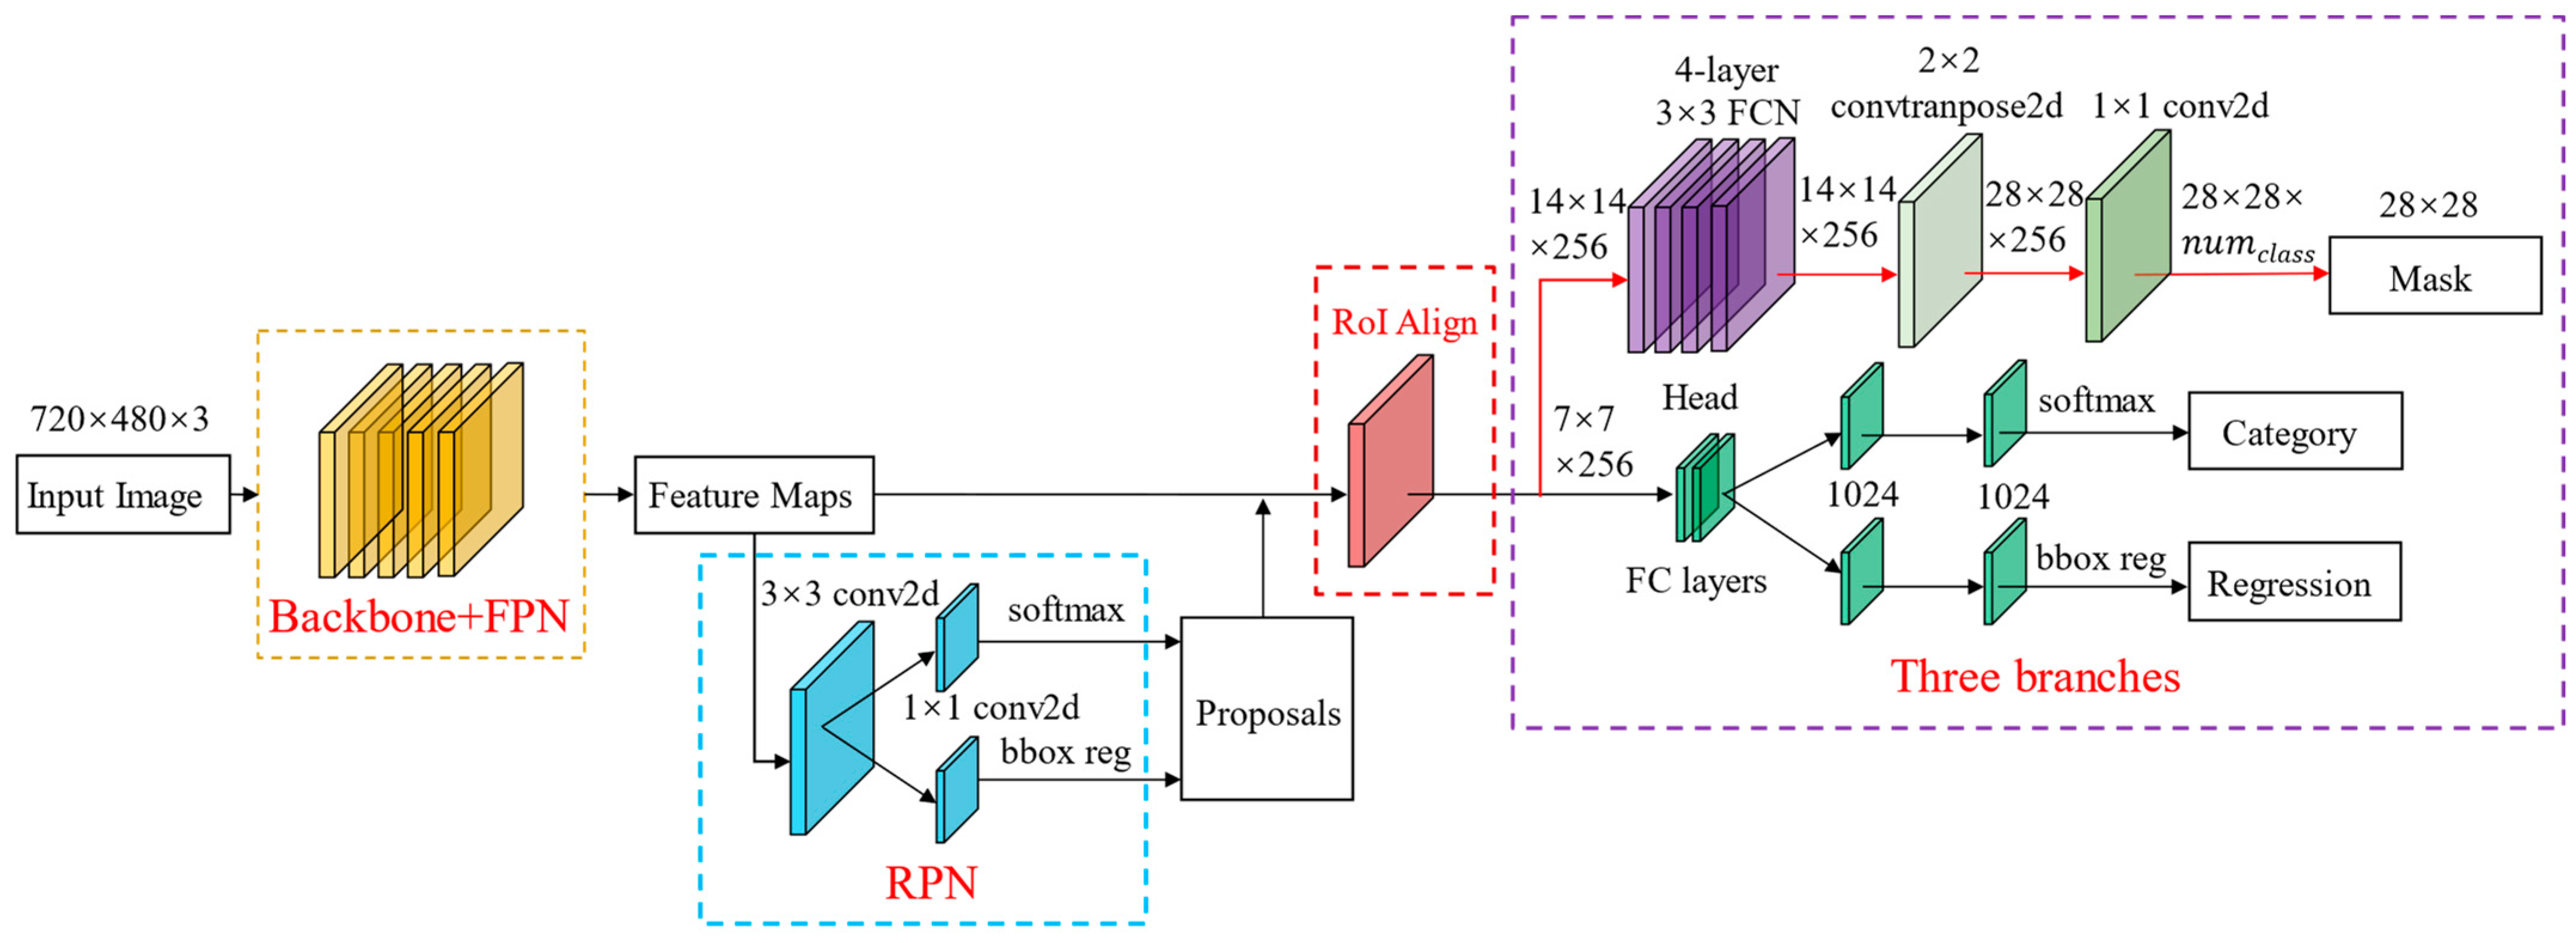
2.3.1. Mask R-CNN

Mask R-CNN [24] is an instance segmentation framework based on Faster R-CNN. It is known for its high-precision target localization and high-quality pixel mask generation, making it suitable for pixel-level segmentation tasks. This framework enables the acquisition of geometric attributes such as the shape, area, and contours of the target. The model primarily consists of four components: a backbone network, a region proposal network (RPN), a region of interest (ROI) align classifier, and output branches. The structure of the network is shown in Figure 6.
The backbone network comprises a feature extraction network and a feature pyramid network (FPN). The feature extraction network is tasked with extracting features from the input image and generating four feature maps, which contain Feature 1 (56 × 56 × 256), Feature 2 (28 × 28 × 256), Feature 3 (14 × 14 × 256), and Feature 4 (7 × 7 × 256). The FPN is responsible for integrating high-level semantic information with low-level feature information. The region proposal network (RPN) generates candidate boxes using a sliding window mechanism. During the training phase, the selection of positive and negative samples is determined by their intersection over union (IoU) with the ground truth labels. Subsequently, the non-maximum suppression (NMS) technique is used to eliminate redundant anchor points for the same target as the pre-selected bounding boxes, thereby generating initial proposal boxes. The ROI align network has been developed to facilitate the mapping of proposal boxes of different sizes back to the original image. This process transforms the proposal boxes into feature maps of uniform size, creating the region of interest (ROI). The method uses bilinear interpolation to precisely calculate the feature map locations, thereby minimizing inaccuracies caused by direct quantization. The output branches consist of a classification branch, a regression branch, and a mask branch. The classification branch uses fully connected layers to categorize each ROI and determine its class. The regression branch finely tunes the position and size of each ROI. The mask branch generates a binary mask for each identified object.

2.3.2. Improved Mask R-CNN Segmentation Branch

When addressing the segmentation of pak choi leaves, the Mask R-CNN network often encounters challenges with low precision at the edges of the leaves. This is mainly caused by significant fluctuations in pixel values at the boundaries between leaves and the background, which affects the model’s accuracy in localizing edges. To address this issue, this study incorporates an attention mechanism to optimize the segmentation network. Specifically, an attention module and additional convolutional layers are incorporated into the segmentation branch to improve the weighting of edge features, thereby enhancing the model’s capability to recognize and process edges. SeNet [25] enhances the sensitivity of CNN networks to crucial features through two steps: Squeeze (global information compression) and Excitation (feature activation). During the Squeeze phase, global average pooling is used to aggregate features across each channel. This process condenses condensing features in the spatial dimension of a channel into a single value, reducing the parameter count and computational complexity. The Excitation phase utilizes two fully connected layers to learn the nonlinear relationships between channels. Initially, it reduces the number of features to decrease the computational load and then restores the original dimensions. Sigmoid functions are used to determine the weight of each channel. Ultimately, these weights are combined with the original feature map to recalibrate features, emphasizing important information and enhancing the network’s feature detection capabilities.
In this study, the segmentation branch initially processes through four layers of 3 × 3 convolutional layers to deeply extract features of the leaves. Subsequently, the feature map is input into the SeNet module for attention weighting, adjusting its spatial dimensions and expanding the receptive field to enhance the global perception of leaf edges. This is followed by further enhancement of edge feature representation through an additional two 3 × 3 convolutional layers, thereby enhancing the segmentation accuracy. In this study, a 256-channel feature representation is maintained from the ROI align output to ensure the effectiveness of features after dimension reduction. Meanwhile, considering both the model’s performance and efficiency, the reduction ratio of the SeNet module is set to 16 to optimize the leaf edge segmentation results. The improved segmentation branch is shown in Figure 7.

2.3.3. Loss Function

The loss function of Mask R-CNN, LMask R-CNN, comprises the classification loss Lcls, the bounding box regression loss Lreg, and the mask branch loss Lmask, as illustrated in Equation (1). The classification loss Lcls primarily represents the extent of loss in the target’s category classification, as illustrated in Equation (2). The bounding box regression loss Lreg characterizes the extent of loss in the target’s detection box coordinates, as illustrated in Equation (3). The mask branch loss Lmask is a binary cross-entropy loss, which is used to quantify the discrepancy between the predicted mask and the ground truth. This component of the loss represents the segmentation loss generated during the model’s training process, as illustrated in Equation (4).
L M a s k   R C N N = L c l s + L r e g + L m a s k
L c l s = log [ p i p i * ( 1 p i * ) ( 1 p i ) ]
where p i and p i * represent the probability and expected probability values that a candidate region contains a target, respectively.
L r e g = S m o o t h L 1 ( x ) = 0.5   x 2 ,   if   x < 1 x 0.5 ,   other
L m a s k = y [ y log ( 1 y ^ ) + ( 1 y ) log ( 1 y ^ ) ]
where y and y ^ represent the actual leaf mask and the network-predicted output mask, respectively.

2.4. Algorithm for Calculating the Leaf Area of Pak Choi

Firstly, the pixel area of the pak choi leaves is extracted. The collected pak choi images, after being processed by the Mask R-CNN network, generate corresponding mask information for each leaf. These masks encompass both image category and pixel segmentation information. In these masks, pixels identified as pak choi leaves are marked with values ranging from 0 to 1, while non-leaf pixels are marked as 0. By setting a threshold value of T = 0.5 , the number of pixels exceeding this threshold is calculated, which determines the pixel area of the mask and, consequently, the pixel area of each segmented pak choi leaf, as illustrated in Equation (5).
Secondly, the conversion coefficient between the pixel area and the actual area is calculated, as illustrated in Equation (6). Considering the uniformity of the seedling pot area, in this study, the seedling pot is utilized as a standard reference object for calculating the conversion coefficient. In the first step, the collected images of complete seedling pots are converted from RGB color mode to grayscale, followed by bilateral binarization and Gaussian blur to reduce image noise. In the second step, the Canny operator is used for edge detection to identify the edges of the seedling pot in the image. In the third step, a series of image contours is extracted post-edge detection using the FindContours function in OpenCV. In the fourth step, contours that represent seedling pots based on specific shape and size thresholds are filtered. The ContourArea function is used to calculate the pixel area. Finally, the average pixel area of thirty seedling pots is calculated. The actual diameter of the seedling pot is 10 cm, and the conversion coefficient between the pixel area and the actual area is calculated, as illustrated in Equation (6).
Finally, the pak choi’s leaf area is calculated. Using the conversion coefficient obtained in the previous step, the pixel area of each leaf is converted to its actual area, as illustrated in Equation (7).
L e a f   A r e a p i x e l = i = 1 M m a s k j = 1 N m a s k 1 M i j > T
where M m a s k and N m a s k  are the number of rows and columns in the mask,  M i j   is the value of the pixel at row i and column j in the mask, and 1 M i j > T is an indicator function that equals 1 if M i j > T and 0 otherwise.
L p i x e l a c t u a l = A c t u a l   a r e a   o f   r e f e r e n c e   o b j e c t A v e r a g e   p i x e l   a r e a   o f   r e f e r e n c e   o b j e c t s
L e a f   a r e a a c t u a l = A r e a l e a f _ p i x e l × L p i x e l _ a c t u a l
The algorithm flowchart is shown in Figure 8.

2.5. Experimental Environment

Experiments involving the Mask R-CNN model and its enhancements were carried out on a Windows 10 system. For model training, transfer learning was initially utilized with pre-trained weights from the COCO dataset to initialize the network parameters. Subsequently, the self-constructed pak choi leaf dataset was converted into the COCO dataset format for network training. Network training in this study was conducted using an NVIDIA GeForce RTX 4060Ti graphics card; the input image was an RGB three-channel color image with dimensions of 720 × 480 × 3. The experimental environments and parameter settings of the model during the training process are presented in Table 2.

2.6. Evaluation Metrics

The task of calculating leaf area involves segmenting a single leaf and subsequently calculating its area. To evaluate the method’s performance in the task, it is crucial to assess both the instance segmentation performance and the accuracy of the leaf area calculation.
The dataset format for the instance segmentation task of the leaf is COCO. The mean average precision (mAP) was employed to evaluate the algorithm’s performance in leaf detection and leaf segmentation. The precise definitions are presented in Equations (8)–(11). In the task of calculating leaf area, the evaluation metric is the area error rate, which is precisely defined in Equation (12).
P r e c i s i o n = T P T P + F P
R e c a l l = T P T P + F N
where TP (True Positive) represents the number of samples correctly identified as leaves; FP (False Positive) refers to the number of samples incorrectly identified as leaves when they are background; FN (False Negative) represents the number of samples incorrectly identified as background when they are leaves.
A P = 0 1 P ( R ) d R
where AP represents the area under the precision–recall (PR) curve, reflecting the recall rate corresponding to different precision outcomes for leaves.
m A P = 1 10 i = 1 10 A P I o U = T i
where T i represents the IoU threshold and ranges from 0.50 to 0.95 in increments of 0.05.
A e r = 1 S C S T
where S C  represents the calculated area of the pak choi leaf after segmentation, and  S T  represents the true area of the pak choi leaf which was acquired by measuring the leaf area with a CI-203 handheld laser leaf area meter.

3. Results and Discussion

3.1. Comparative Experiments Based on Different Backbone Networks

To determine the optimal model performance on the dataset, we conducted training comparisons using four backbone networks of varying depths: EffcientNet_B0, MobileNet_V3, ResNet 50, and ResNet 101. Models equipped with these different backbone networks were trained and tested on the pak choi leaf dataset. Post-convergence loss data and training times were recorded, and the mean average precision (mAP) values of leaf detection and leaf segmentation were calculated on the test dataset. Five rounds of training and testing were conducted on the dataset, and the results were averaged to reduce errors. The total loss of Mask R-CNN with different backbone networks is shown in Figure 9. The comparative test results of different backbone networks are presented in Table 3.
The results in Figure 10 and Table 3 indicate that Mask R-CNN with ResNet101 as the backbone network demonstrates a superior performance in detecting and segmenting pak choi leaves. Compared to ResNet101, the mean average precision of leaf detection decreases by 8.02% with EffcientNet_B0, 6.24% with MobileNet_V3, and 0.15% with ResNet 50. Similarly, the mean average precision of leaf segmentation decreases by 9.28% with EffcientNet_B0, 7.65% with MobileNet_V3, and 0.1% with ResNet 50. However, the increased depth and parameter count of ResNet 101 resulted in a 150% increase in the training time. Considering factors such as model precision and lightweight deployment, ResNet 50 was selected as the backbone network for Mask R-CNN in the following experiments.

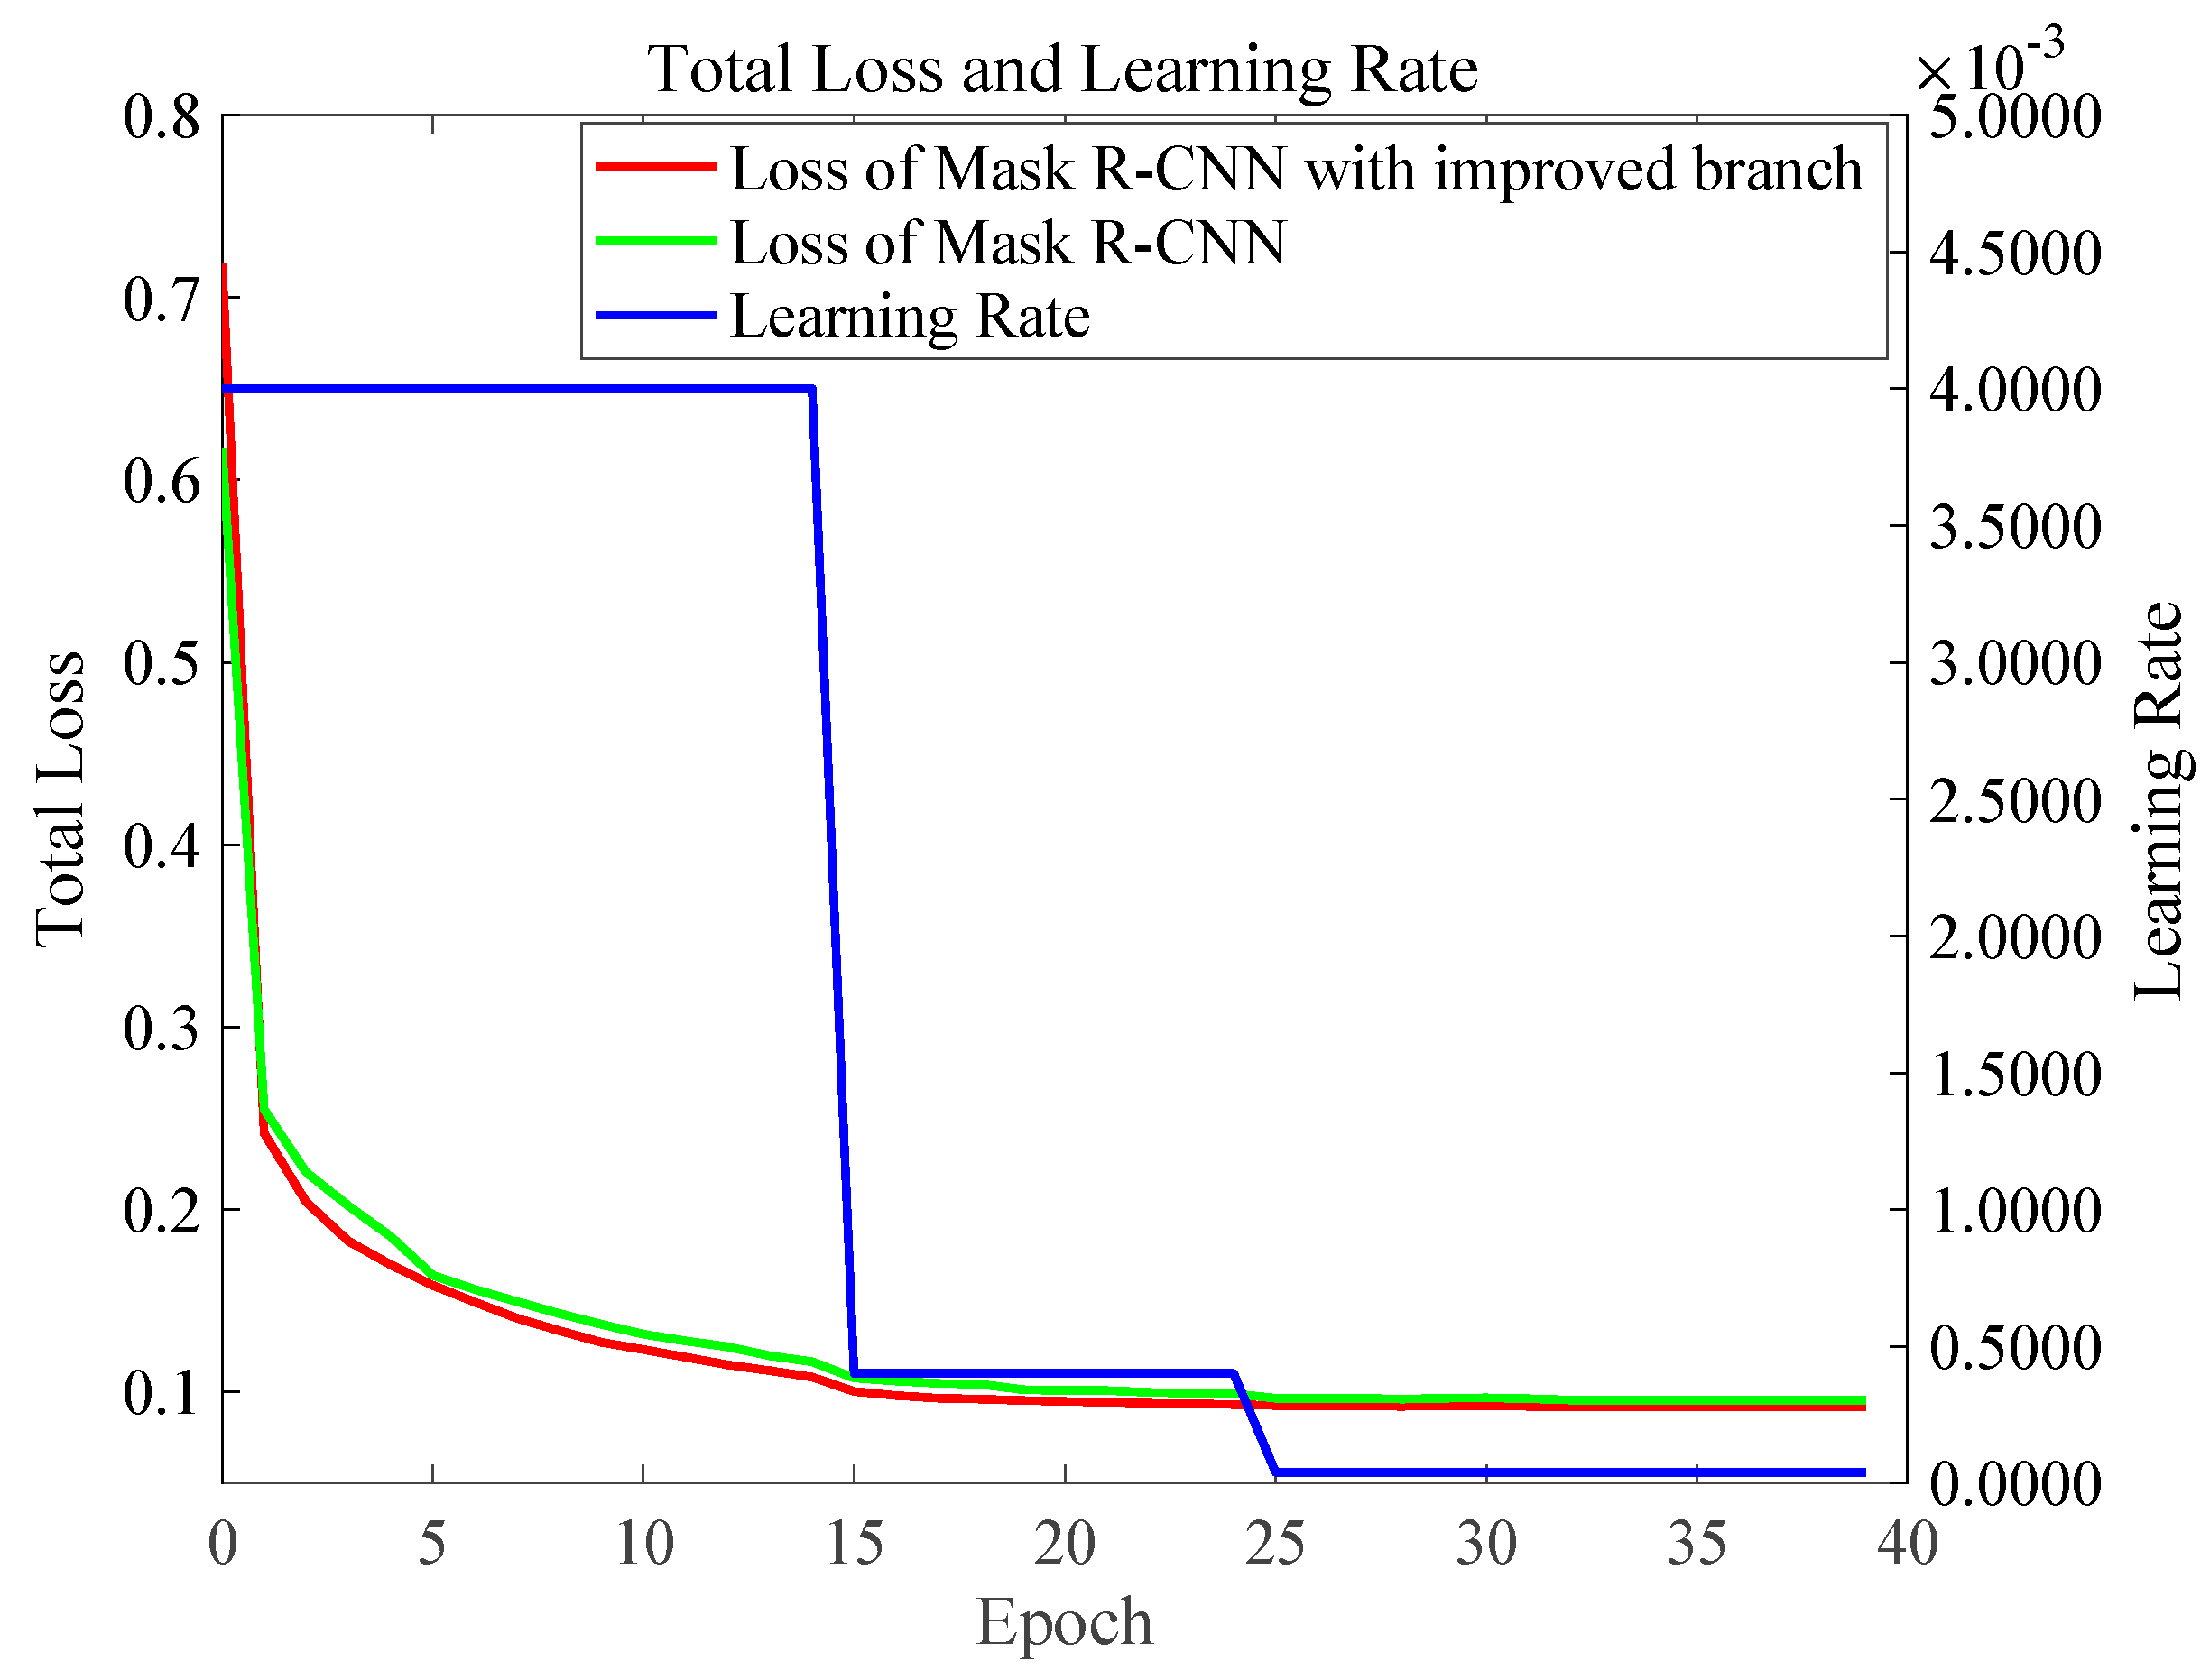
3.2. Comparative Experiments Based on the Improved Segmentation Branch

According to the results of the comparative experiments on backbone networks, ResNet 50 + FPN was selected as the backbone network for Mask R-CNN. Comparative experiments were conducted on the pak choi leaf dataset to compare the original segmentation branch with the improved mask branch of the model.
To visually illustrate the mean accuracy of the models before and after optimization, the training results of the models were plotted on the same graph. Figure 10 shows the changes in the total loss and learning rate of the instance segmentation model before and after the segmentation branch improvement, while Figure 11 shows the changes in mean average precision (mAP) during the training process.
Figure 10 shows that as the number of iterations increases, both the original and the optimized models exhibit a gradual decrease in loss values, followed by stabilization. The training loss of the optimized model demonstrates a more pronounced downward trend, converging around the 20th training epoch with a lower total loss, indicating that the increased complexity of the segmentation branch did not result in increased loss.
Figure 11 shows that as the training epochs progress, the mAP of the instance segmentation model with the improved segmentation branch begins to stabilize from the 10th epoch and finally stabilizes at 0.9136. In contrast, the mAP of the original model begins to stabilize around the 14th epoch and finally stabilizes at 0.9032. The optimized model shows earlier cessation of fluctuations, reaching a stable value more rapidly and achieving a higher stable value. This demonstrates improved stability and convergence.
Training and testing were conducted on the dataset. Post-convergence loss information was recorded, and metrics such as the mAP for leaf detection, the mAP for leaf segmentation, and A e r were calculated, as presented in Table 4.
The results presented in Table 4 indicate that Mask R-CNN with an improved segmentation branch outperforms the original Mask R-CNN across various metrics, including average loss, the mean average precision (mAP) for leaf detection and segmentation, and the area error rate. Specifically, the modified model shows a decrease in the average loss of 0.0033, an increase in the mAP for leaf detection of 1.01%, an increase in the mAP for leaf segmentation of 1.02%, and a decrease in the area error rate of 0.68%.
To reduce the influence of a single dataset split on the performance and generalizability of the improved Mask R-CNN, a five-fold cross-validation approach was utilized (Table 5). This methodological decision was made to evaluate the performance and stability of the model. The experimental findings presented in Table 5 illustrate the good generalization abilities of the model and its consistent and stable outcomes.
When there are only 800 images in the pak choi dataset, Experiments 6–8 were conducted to explore the impact of different splitting ratios on the model performance of the improved Mask R-CNN. These experiments were set up with training set and validation set ratios of 7:3, 6:4, and 5:5, respectively. The number of training and test sets and the results of experiments are shown in Table 6. As shown in Table 6, with a training data proportion of 70% (Experiment 6), the mean average precision (mAP) for detection remained at 0.9103 and that of segmentation at 0.9101, with an area error ( A e r ) of 4.65%. These metrics indicate minimal deviation from the original experiment (Experiment 1). When the training data proportion was decreased to 60% (Experiment 7), the mean average precision (mAP) for detection slightly decreased to 0.9027 and that for segmentation decreased to 0.9022, with the average error rate ( A e r ) increasing to 5.17%. Further decreasing the proportion of training data to 50% (Experiment 8) resulted in a mAP for detection of 0.8952 and segmentation of 0.8950, with an A e r of 5.68%. Compared to the original experiment, Experiments 7 and 8 showed a decrease in the mAP and A e r , but the mAP values remained above 0.8952 and 0.8950. Analysis of these results suggests that with a dataset of only 800 images, reducing the proportion of the training set below 70%, even with data augmentation, leads to a decrease in feature diversity. Nevertheless, the improved Mask R-CNN model consistently maintained the mAP above 0.8952 and 0.8950 across all splitting ratios, and the area error rate remained below 5.68%, confirming the model’s generalizability. Future work will involve expanding the pak choi leaf dataset further.
To further evaluate the leaf segmentation performance of the improved Mask R-CNN, specifically across different growth stages of pak choi, the test dataset was systematically divided into three subsets: the seedling stage, the growth stage, and the mature stage. Subsequently, the performance of the model was quantitatively assessed on these datasets. The results presented in Table 7 demonstrate that the improved model exhibits commendable segmentation performance across different growth stages of pak choi. Significantly, the model achieves the highest accuracy in segmentation and the lowest error rate in the area during the seedling stage. In contrast, the precision of segmentation is at its lowest during the maturity stage, while also being accompanied by the highest area error rate. The variation in performance can be ascribed to the gradual occlusion of leaves. At the seedling stage, there is minimal overlap among leaves. However, as the plant grows, slight leaf occlusions begin to appear during the growth stage, eventually leading to significant overlap in the mature stage.
Figure 12 shows a compelling visual comparison of the segmentation results of the original Mask R-CNN model and its improved version when applied to identical pak choi leaf images. In this comparison, the original model demonstrates commendable segmentation capabilities, with the generated mask aligning reasonably well with the actual leaf edges. However, as indicated by the red dotted boxes in the images, there is still a noticeable discrepancy between the mask edges and the actual leaf boundaries. This small gap highlights an area for potential improvement in the model’s accuracy in edge detection. In contrast, the improved segmentation branch of the modified Mask R-CNN model shows a significant enhancement in edge delineation. The masks produced by this improved model demonstrate a much closer alignment with the actual contours of the leaf. This heightened precision in edge detection represents a notable advancement, indicating the model’s improved ability to recognize features, particularly in accurately identifying leaf edges. The criticality of this advancement lies in its direct impact on the accuracy of leaf area calculations. As the segmentation mask more precisely reflects the actual leaf periphery, the computed leaf area becomes more accurate, resulting in a consequent reduction in the leaf area error rate.
To validate the superiority of the segmentation performance of the improved model presented in this paper, a comparative analysis was conducted against three mainstream open-source instance segmentation models: BlendMask [26], PolarMask [27], and SOLO [28]. Firstly, a comprehensive overview of the characteristics of the models is presented in Table 8. The comparison experiments utilized quantitative metrics, including mean average precision (mAP), the area error rate ( A e r ), and the average segmentation time. The results are presented in Table 9. The indices corresponding to the bold data indicate the best performance.
Table 9 demonstrates that the improved Mask R-CNN model outperforms all compared methods in terms of mean average precision (mAP) and area error rate ( A e r ), with scores of 0.9132 and 4.47%, respectively. The image segmentation time is 0.079 s per image, representing a slight increase of 0.001 s compared to the original Mask R-CNN, and at 0.003 s longer than the fastest model, SOLO. This increase in segmentation time is attributed to the augmented computational load caused by the additional model parameters in the improved segmentation branch. In contrast, the SOLO model, with its fewer parameters and simpler structure, achieves faster segmentation times. However, it falls short in performance metrics, with a 2.71% decrease in mAP and a 1.83% increase in A e r compared to the improved Mask R-CNN. The comparative results indicate that the improved model proposed in this study demonstrates a commendable segmentation performance. Future work should focus on refining the architecture of the model to decrease its parameter count and computational load. The goal is to achieve a better balance between segmentation precision and processing speed, thereby improving the overall performance and usefulness of the model in real-world applications.

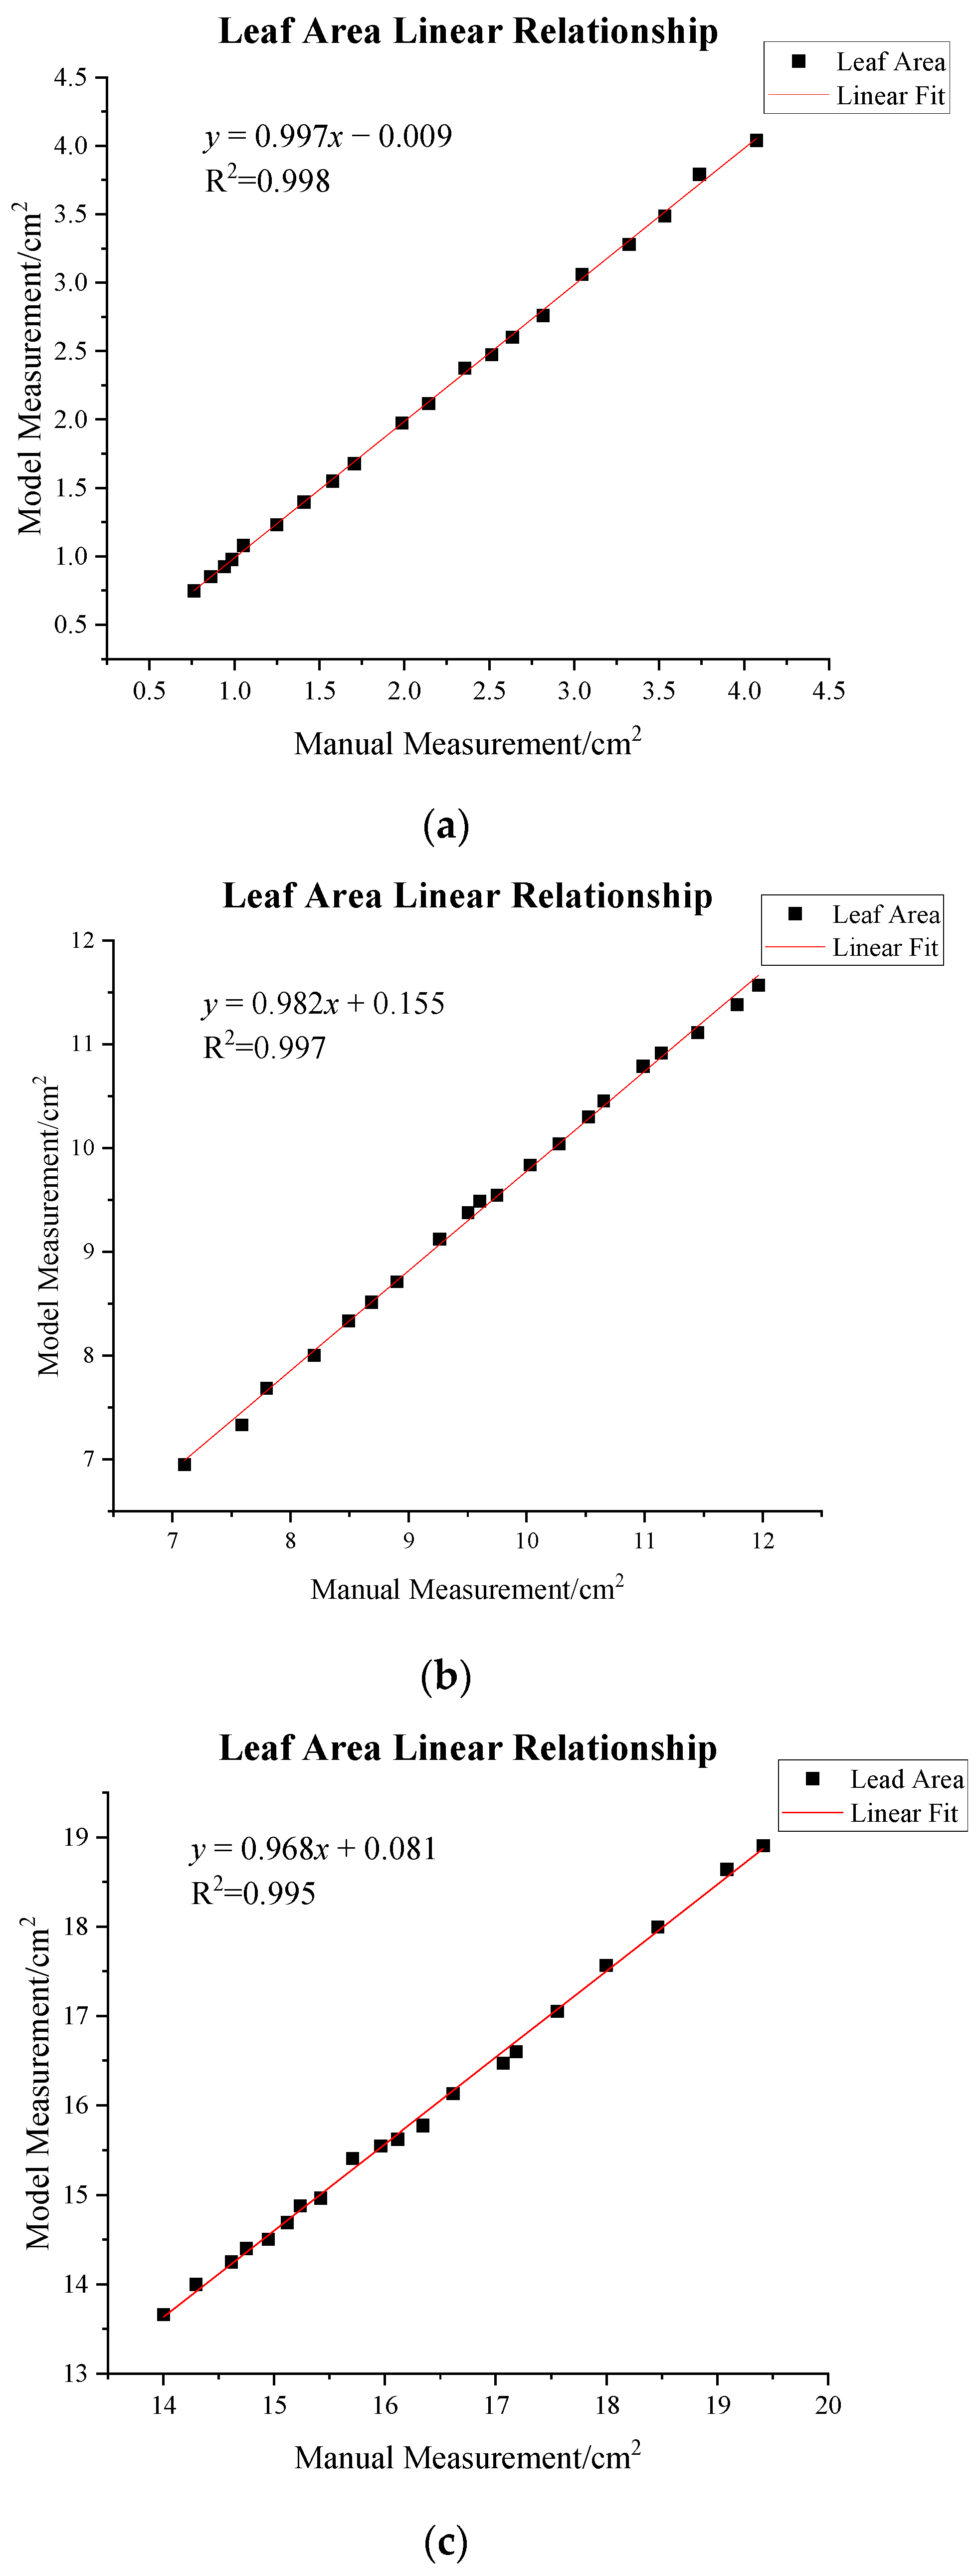
3.3. Analysis of Leaf Area Calculation Results

To evaluate the effectiveness of the improved Mask R-CNN in calculating leaf area, 60 samples were randomly selected from the test dataset, ensuring comprehensive coverage across different growth stages of pak choi, including 20 images of pak choi leaves during the seedling stage, 20 images from the growth stage, and 20 images from the mature stage. Both manual measurements and model-based estimations of leaf area were conducted, and a linear correlation analysis was performed between these two sets of data. The comparative results are shown in Figure 13.
Figure 13 depicts a comparative analysis of the manually measured leaf area (x-axis) and the model-calculated leaf area (y-axis), showing a strong linear relationship across different growth stages of pak choi. This strong correlation indicates the model’s robustness in accurately estimating leaf area, confirming its effectiveness across different stages of pak choi development. The analysis also reveals a notable trend: as the leaves grow larger, there is a growing disparity between the model-generated leaf area and the actual measurements. This observation can be attributed to several factors inherent in the dynamic nature of pak choi growth. One significant factor is the growing likelihood of leaves overlapping or obstructing each other as they grow, which can hinder the model’s ability to accurately recognize and segment each leaf. Additionally, the leaf plane is not entirely parallel to the camera plane, and there is a certain angle. As the leaf grows, this angle will change, leading to an increase in error in the leaf area. Future work will aim to address these limitations by adopting a more comprehensive approach to leaf analysis. One promising approach is to collect leaf images from multiple angles, which would provide a more comprehensive understanding of each leaf’s structure and orientation. Analyzing leaf angles and integrating this information into the model could greatly reduce the errors caused by different leaf orientations.

3.4. Discussion of the Method

The results of quantitative and qualitative tests indicate that integrating the attention mechanism into the segmentation branch of Mask R-CNN significantly improves the model’s accuracy in recognizing and segmenting the edges of pak choi leaves. Comparative experiments with open-source algorithms also validate the effectiveness of the model enhancements. Testing with images of pak choi at various growth stages demonstrates that the proposed method performs well in estimating leaf area throughout different stages of growth. A linear regression analysis between manually measured leaf areas and those calculated by the algorithm reveals a strong linear relationship, with minimal error in the algorithm’s calculations. This precision enables accurate monitoring of pak choi’s growth stages and conditions, making it suitable for use in plant factories. The method is not limited to pak choi but can be applied to other leafy crops, provided that sufficient image data of various vegetables are collected to train the model and improve its generalizability.
However, the current method relies on 2D images, which may not always ensure a consistent alignment between the leaf plane and the camera’s focal plane. In actual production, the angle between these planes can significantly impact the accuracy of leaf area measurements, with larger angles resulting in an underestimation of leaf area. Future work will involve collecting images from various angles to analyze how leaf angles impact area calculations. Additionally, the research will focus on developing leaf segmentation models based on 3D point clouds to enhance the accuracy of area calculations for precise segmentation and phenotypic monitoring.

4. Conclusions

This paper proposes a method for calculating the leaf area of pak choi based on an improved Mask R-CNN. Training and testing datasets were established using images captured throughout the entire growth cycle of pak choi. This study compared the performance of different backbone networks and incorporated an attention mechanism and a two-layer FCN into the segmentation branch to enhance the model’s ability to recognize leaf edges. The improved model achieved mean Average precision (mAP) scores of 0.9136 and 0.9132 in detection and segmentation tasks, respectively, indicating improvements of 1.01% and 1.02% over the original Mask R-CNN. This demonstrates the excellent recognition and segmentation of pak choi leaves. The area of pak choi leaves was calculated using the segmented mask information, revealing that the predicted leaf area closely matched the actual leaf area with an area error rate of less than 4.47%. There is a strong linear relationship between the area calculated by the model and the manually measured area, eliminating the need for detached leaf measurements and making it more suitable for real-life leaf area measurements. Compared with other open-source models, our method demonstrates a better segmentation performance, providing valuable support for the development of automated production technologies in plant factories.

Author Contributions

Conceptualization, F.H. and Y.L.; methodology, F.H. and Y.L.; software, F.H. and Z.L.; investigation, F.H., Y.L. and Z.L.; resources, Y.L.; visualization, F.H. and Z.L.; validation, F.H., Y.L. and Z.L.; writing—original draft preparation, F.H., Y.L. and Z.L.; writing—review and editing, F.H., Y.L. and L.G.; supervision, Y.L., L.G. and C.L.; project administration, Y.L. and C.L.; funding acquisition, Y.L. All authors have read and agreed to the published version of the manuscript.

Funding

This work was supported by the 2020 Shanghai “Science and Technology Innovation Action Plan” Agricultural Field Program (grant number 20392000900).

Institutional Review Board Statement

Not applicable.

Data Availability Statement

The data presented in this study are available on request from the corresponding author. The data are not publicly available due to privacy.

Conflicts of Interest

The authors declare no conflicts of interest.

References

  1. Al-Chalabi, M. Vertical Farming: Skyscraper Sustainability? Sustain. Cities Soc. 2015, 18, 74–77. [Google Scholar] [CrossRef]
  2. Mao, P.; Duan, F.; Zheng, Y.; Yang, Q. Blue and UV-A Light Wavelengths Positively Affected Accumulation Profiles of Healthy Compounds in Pak-choi. J. Sci. Food Agric. 2021, 101, 1676–1684. [Google Scholar] [CrossRef] [PubMed]
  3. Wang, L.; Wang, J.; Liu, Z.; Zhu, J.; Qin, F. Evaluation of a Deep-Learning Model for Multispectral Remote Sensing of Land Use and Crop Classification. Crop J. 2022, 10, 1435–1451. [Google Scholar] [CrossRef]
  4. Wang, L.; Wang, J.; Zhang, X.; Wang, L.; Qin, F. Deep Segmentation and Classification of Complex Crops Using Multi-Feature Satellite Imagery. Comput. Electron. Agric. 2022, 200, 107249. [Google Scholar] [CrossRef]
  5. Dananjayan, S.; Tang, Y.; Zhuang, J.; Hou, C.; Luo, S. Assessment of State-of-the-Art Deep Learning Based Citrus Disease Detection Techniques Using Annotated Optical Leaf Images. Comput. Electron. Agric. 2022, 193, 106658. [Google Scholar] [CrossRef]
  6. Khan, A.I.; Quadri, S.M.K.; Banday, S.; Latief Shah, J. Deep Diagnosis: A Real-Time Apple Leaf Disease Detection System Based on Deep Learning. Comput. Electron. Agric. 2022, 198, 107093. [Google Scholar] [CrossRef]
  7. Zhu, J.; Yang, G.; Feng, X.; Li, X.; Fang, H.; Zhang, J.; Bai, X.; Tao, M.; He, Y. Detecting Wheat Heads from UAV Low-Altitude Remote Sensing Images Using Deep Learning Based on Transformer. Remote Sens. 2022, 14, 5141. [Google Scholar] [CrossRef]
  8. Li, X.; Geng, H.; Zhang, L.; Peng, S.; Xin, Q.; Huang, J.; Li, X.; Liu, S.; Wang, Y. Improving Maize Yield Prediction at the County Level from 2002 to 2015 in China Using a Novel Deep Learning Approach. Comput. Electron. Agric. 2022, 202, 107356. [Google Scholar] [CrossRef]
  9. Pieruschka, R.; Schurr, U. Plant Phenotyping: Past, Present, and Future. Plant Phenomics 2019, 2019, 7507131. [Google Scholar] [CrossRef]
  10. Nikbakhsh, N.; Baleghi, Y.; Agahi, H. A Novel Approach for Unsupervised Image Segmentation Fusion of Plant Leaves Based on G-Mutual Information. Mach. Vis. Appl. 2021, 32, 5. [Google Scholar] [CrossRef]
  11. Jiang, Y.; Li, C. Convolutional Neural Networks for Image-Based High-Throughput Plant Phenotyping: A Review. Plant Phenomics 2020, 2020, 4152816. [Google Scholar] [CrossRef] [PubMed]
  12. Zhang, S.; Wang, Z.; Wang, Z. Method for image segmentation of cucumber disease leaves based on multi-scale fusion convolutional neural networks. Trans. Chin. Soc. Agric. Eng. 2020, 36, 149–157. [Google Scholar]
  13. Zhao, Q.; Li, L.; Zhang, M.; Lan, T.; Sigrimis, N. Water Stress Diagnosis Algorithm of Greenhouse Tomato Based on Fine-tuning Learning. Trans. Chin. Soc. Agric. Mach. 2020, 51, 340–347+356. [Google Scholar]
  14. Trivedi, M.; Gupta, A. Automatic Monitoring of the Growth of Plants Using Deep Learning-Based Leaf Segmentation. Int. J. Appl. Sci. Eng. 2021, 18, 2020281. [Google Scholar] [CrossRef]
  15. Liu, W.; Ye, T.; Li, Q. Tomato Leaf Disease Detection Method Based on Improved SOLO V2. Nongye Jixie Xuebao Trans. Chin. Soc. Agric. Mach. 2021, 52, 213–220. [Google Scholar] [CrossRef]
  16. Weyler, J.; Magistri, F.; Seitz, P.; Behley, J.; Stachniss, C. In-Field Phenotyping Based on Crop Leaf and Plant Instance Segmentation. In Proceedings of the 2022 IEEE/CVF Winter Conference on Applications of Computer Vision (WACV), Waikoloa, HI, USA, 3–8 January 2022; pp. 2968–2977. [Google Scholar]
  17. Yuan, H.; Zhu, J.; Wang, Q.; Cheng, M.; Cai, Z. An Improved DeepLab V3+ Deep Learning Network Applied to the Segmentation of Grape Leaf Black Rot Spots. Front. Plant Sci. 2022, 13, 795410. [Google Scholar] [CrossRef] [PubMed]
  18. Bhagat, S.; Kokare, M.; Haswani, V.; Hambarde, P.; Kamble, R. Eff-UNet++: A Novel Architecture for Plant Leaf Segmentation and Counting. Ecol. Inform. 2022, 68, 101583. [Google Scholar] [CrossRef]
  19. Deb, M.; Garai, A.; Das, A.; Dhal, K.G. LS-Net: A Convolutional Neural Network for Leaf Segmentation of Rosette Plants. Neural Comput. Appl. 2022, 34, 18511–18524. [Google Scholar] [CrossRef]
  20. Zhu, S.; Ma, W.; Lu, J.; Ren, B.; Wang, C.; Wang, J. A Novel Approach for Apple Leaf Disease Image Segmentation in Complex Scenes Based on Two-Stage DeepLabv3+ with Adaptive Loss. Comput. Electron. Agric. 2023, 204, 107539. [Google Scholar] [CrossRef]
  21. Zhang, Y.; Xie, Y.; Xu, X. Measuring the cucumber leaf area using improved Mask R-CNN. Trans. Chin. Soc. Agric. Eng. 2023, 39, 182–189. [Google Scholar] [CrossRef]
  22. Banu, A.S.; Deivalakshmi, S. AWUNet: Leaf Area Segmentation Based on Attention Gate and Wavelet Pooling Mechanism. Signal Image Video Process. 2023, 17, 1915–1924. [Google Scholar] [CrossRef]
  23. Yang, T.; Zhou, S.; Xu, A.; Ye, J.; Yin, J. An Approach for Plant Leaf Image Segmentation Based on YOLOV8 and the Improved DEEPLABV3+. Plants 2023, 12, 3438. [Google Scholar] [CrossRef]
  24. He, K.; Gkioxari, G.; Dollár, P.; Girshick, R. Mask R-CNN. In Proceedings of the IEEE International Conference on Computer Vision 2017, Venice, Italy, 22–29 October 2017. [Google Scholar]
  25. Hu, J.; Shen, L.; Sun, G. Squeeze-and-Excitation Networks. In Proceedings of the 2018 IEEE/CVF Conference on Computer Vision and Pattern Recognition, Salt Lake City, UT, USA, 18–23 June 2018; pp. 7132–7141. [Google Scholar]
  26. Chen, H.; Sun, K.; Tian, Z.; Shen, C.; Huang, Y.; Yan, Y. BlendMask: Top-Down Meets Bottom-Up for Instance Segmentation. In Proceedings of the IEEE/CVF Conference on Computer Vision and Pattern Recognition, CVPR, Seattle, WA, USA, 14–19 June 2020. [Google Scholar]
  27. Xie, E.; Sun, P.; Song, X.; Wang, W.; Liang, D.; Shen, C.; Luo, P. PolarMask: Single Shot Instance Segmentation with Polar Representation. In Proceedings of the IEEE/CVF Conference on Computer Vision and Pattern Recognition, Seattle, WA, USA, 14–19 June 2020. [Google Scholar]
  28. Wang, X.; Kong, T.; Shen, C.; Jiang, Y.; Li, L. SOLO: Segmenting Objects by Locations. In Proceedings of the Computer Vision—ECCV 2020: 16th European Conference, Glasgow, UK, 23–28 August 2020. [Google Scholar]
Figure 1. Schematic diagram of the image collection system.
Agriculture 14 00101 g001
Figure 2. Schematic diagram of collected pak choi images. (a) Seeding stage; (b) growth stage; (c) mature stage.
Agriculture 14 00101 g002
Figure 3. Schematic diagram of leaf labeling.
Agriculture 14 00101 g003
Figure 4. Image data enhancement. (a) Original image; (b) horizontally mirrored; (c) vertically flipped; (d) rotated 270 degrees.
Agriculture 14 00101 g004
Figure 5. Image visualization result of LabelMe annotation.
Agriculture 14 00101 g005
Figure 6. Structure of Mask R-CNN.
Agriculture 14 00101 g006
Figure 7. Improved segmentation branch with attention and an FCN module.
Agriculture 14 00101 g007
Figure 8. Flow diagram of pak choi leaf area calculation algorithm.
Agriculture 14 00101 g008
Figure 9. Total loss of Mask R-CNN with different backbone networks.
Agriculture 14 00101 g009
Figure 10. Result of total loss and learning rate change of the instance segmentation model.
Agriculture 14 00101 g010
Figure 11. Result of the mAP changes for the instance segmentation model.
Agriculture 14 00101 g011
Figure 12. Comparison images of segmentation. (a) Segmentation images of the original Mask R-CNN; (b) segmentation images of the improved Mask R-CNN.
Agriculture 14 00101 g012
Figure 13. Comparison of manually measured and model-estimated leaf area of pak choi. (a) The seedling stage; (b) the growth stage; (c) the mature stage.
Agriculture 14 00101 g013
Table 1. The literature focusing on leaf segmentation and areas of plant phenotyping.
No.ReferenceObjectiveDatasetModelResult
1.Zhang
et al. [12]
Cucumber leaf lesion segmentation760 diseased cucumber leaf imagesMulti-Scale Fusion CNNsMean accuracy is 93.12%
2.Zhao
et al. [13]
To diagnose water stress of tomato leaves 2000 tomato leaf imagesMask R-CNN +
DenseNet169
Segmentation accuracy is 94.37%,
Classification accuracy is 94.68%
3.Trivedi
et al. [14]
Leaf segmentation; growth monitoringLeaf segmentation challengeUnetDice accuracy is 95.05%,
MAE of growth index is 0.0019
4.Liu
et al. [15]
Diseased tomato leaf segmentationPlant village tomato leaf datasetSOLO V2+ DCN v2Mean average precision is 57.2%
5.Weyler
et al. [16]
In-field phenotyping1316 plant imagesERFNet+ ClusteringAverage precision is 60.4
6.Yuan
et al. [17]
Diseased grape leaf segmentation1180 images of grape leavesDeepLabv3+
+ ECA
Accuracy is 98.7%, mIOU is 0.848
7.Bhagat
et al. [18]
Leaf segmentation and countingKOMATSUNA, MSU-PID, and
CVPPP dataset
Eff-UNet++BestDice is 83.44, 77.17, and 78.27
8.Deb
et al. [19]
Leaf segmentation of rosette plants KOMATSUNA and CVPPP LS-NetAccuracy is 98.92%,
Dice score is 96.51
9.Zhu
et al. [20]
Apple leaf disease
image segmentation
1491 diseased apple leaf imagesDeepLabv3+
+ CAB
IOU of leaf is 98.70%,
IOU of disease is 86.56%
10.Zhang
et al. [21]
To measure the area
of cucumber leaves
1025 cucumber leaf imagesMask R-CNN + SobelAverage precision is 99.1%,
Area error rate is 5.45%
11.Banu
et al. [22]
Plant leaf area
segmentation
Crop Weed Field Image DatasetUNet +
Wavelet Pooing
IOU score is 94.81%
12.Yang
et al. [23]
Plant leaf image
segmentation
9763 plant leaf
images
YOLO v8 + DeepLabv3mIOU is 90.8%,
Pixel accuracy is 93.0%
Table 2. Parameter settings of the pak choi leaf instance segmentation model.
ParameterValue
CPUIntel Core i5-11400F
Memory/GB32 GB
GPUNVIDIA GeForce RTX 4060Ti
SystemWindows 10
Development toolPyCharm
Network frameworkPython 3.8.17 + PyTorch 1.13.1
Batch size8
Epoch40
OptimizerSGD
Momentum0.9
Weight decay coefficient0.0001
Basic learning rate0.004
Learning rate decay coefficient0.1
Epoch of learning rate decay15, 25
Input image size720 × 480 × 3
Table 3. Results of experiments with different backbone networks.
BackboneTraining Time/minAverage LossmAP (Detection)mAP (Segmentation)
EffcientNet_B0380.54750.82580.8175
MobileNet_V3400.32540.84110.8280
ResNet 50800.09550.90350.9030
ResNet1012000.09200.90500.9040
Bold indicates the best value of each index.
Table 4. Results of leaf detection and segmentation experiments with different branch structures.
ModelAverage LossmAP
(Detection)
mAP
(Segmentation)
A e r
Mask R-CNN0.09550.90350.90305.15%
Mask R-CNN + Improved Segmentation Branch0.09220.91360.91324.47%
Bold indicates the best value of each index.
Table 5. Results of the five-fold cross-validation experiment.
Experiment NumbermAP (Detection)mAP (Segmentation) A e r
Experiment 1 (Original)0.91360.91324.47%
Experiment 20.91580.91534.42%
Experiment 30.91240.91214.48%
Experiment 40.91470.91434.45%
Experiment 50.91150.91124.52%
Average0.91360.91324.47%
Table 6. Comparison of experimental performance between different splitting ratios.
Experiment NumberSplit
Ratio
Train Set Size after AugmentationTest Set
Size
mAP (Detection)mAP (Segmentation) A e r
Experiment 1
(Original)
8:219202000.91360.91324.47%
Experiment 67:316802000.91030.91014.65%
Experiment 76:414402000.90270.90225.17%
Experiment 85:512002000.89520.89505.68%
Bold indicates the best value of each index.
Table 7. Segmentation performance at different growth stages.
StagemAP A e r
Seeding stage0.92212.85%
Growth stage0.91623.48%
Mature stage0.90134.47%
Bold indicates the best value of each index.
Table 8. Comparison of methods’ characteristics.
ModelKey FeaturesAdvantageLimitation
PolarMaskModeling Contours Based on a Polar Coordinate SystemHigh Efficiency,
Simplified Process
Challenges with Extreme Cases
BlendMaskBlended Attention Mechanism,
Flexible Area Masks
High Precision,
Good Performance
on Small Objects
Challenges with Extreme Cases
SOLODirect Instance Segmentation, Class-Agnostic SegmentationHigh Efficiency,
Simplified Process
Challenges with Small Objects
Mask R-CNNROI Align layer,
Simultaneous Detection and Segmentation
High Precision Segmentation, Adaptability to Different Objects High Computational Cost
Table 9. Leaf segmentation results of different models.
ModelBackbonemAP
(Segmentation)
A e r Time (s)
PolarMaskResNet 500.82577.28%0.092
BlendMaskResNet 500.86686.76%0.099
SOLOResNet 500.88616.30%0.076
Mask R-CNNResNet 500.90305.15%0.078
Improved Mask R-CNNResNet 500.91324.47%0.079
Bold indicates the best value of each index.
Disclaimer/Publisher’s Note: The statements, opinions and data contained in all publications are solely those of the individual author(s) and contributor(s) and not of MDPI and/or the editor(s). MDPI and/or the editor(s) disclaim responsibility for any injury to people or property resulting from any ideas, methods, instructions or products referred to in the content.

