Article

Improvement of Hot Air Dried Bitter Gourd (Momordica charantia L.) Product Quality: Optimization of Drying and Blanching Process by Experimental Design

1
Department of Horticulture, Faculty of Agriculture, Akdeniz University, 07070 Antalya, Turkey
2
Department of Agricultural Machinery and Technologies Engineering, Faculty of Agriculture, Akdeniz University, 07070 Antalya, Turkey
3
Department of Food Engineering, Faculty of Engineering, Akdeniz University, 07070 Antalya, Turkey
4
Department of Environmental Engineering, Faculty of Engineering, Akdeniz University, 07070 Antalya, Turkey
*
Author to whom correspondence should be addressed.
Agriculture 2023, 13(9), 1849; https://doi.org/10.3390/agriculture13091849
Submission received: 25 August 2023 / Revised: 18 September 2023 / Accepted: 19 September 2023 / Published: 21 September 2023

Abstract

:
Bitter gourd (Momordica charantia L.) is a plant species belonging to the Cucurbitaceae family, growing in tropical regions and containing health-promoting beneficial compounds. In the current study, bitter gourds prepared for drying were sliced in three different thicknesses (6, 8 and 10 mm) and dried in a hot-air dryer at three different temperatures (60, 70 and 80 °C) to preserve their medicinal efficacy. In the experiments, the samples were subjected to blanching at 93.5 °C and 2% salt water for 0, 2.5 and 5 min, and drying processes were conducted. After the drying process, drying time, total color change (∆E), total phenolic content (TPC), total antioxidant activity (TAA), and vitamin C properties were examined. The highest levels of TPC and TAA were found at lower drying air temperatures (DATs), and while these values increased with longer blanching times at lower DATs, they decreased with longer blanching times at higher DATs. According to the different drying temperatures used, it was discovered that the total color change peaked at 70 °C and that vitamin C levels declined as DAT rose. The optimal drying conditions for the 3D response surface methodology include 60 °C DAT, a slice thickness of 10 mm, and without blanching to maximize TPC, TAA and vitamin C content and minimize drying time and ∆E.

1. Introduction

The bitter gourd (Momordica charantia L.) is one of the important members of the Cucurbitaceae family. It is a well-known tropical vegetable grown across the world for both culinary and medicinal purposes due to its health-related benefits [1,2]. Bitter gourd is recognized for its nutritional and therapeutic properties and is a nutrient- and antioxidant-rich vegetable regarding polysaccharides, protein, vitamins, and minerals [3,4]. The mature bitter gourd is also a rich source of iron, phosphorus, vitamin A and vitamin C, as well as β-carotene [5]. The bioactive components of bitter gourd, comprising polysaccharides, saponins, triterpenoids, alkaloids, and flavonoids, are valuable for their diverse pharmacological functions [1,6,7], such as antimicrobial, antioxidant, antidiabetic, neuroprotective, and immune enhancing effects [8]. Bitter gourd is well-known for its effectiveness in the treatment of high blood pressure, diabetes, cancers, malaria, and other gastrointestinal problems [9].
In order to maintain the crops’ accessibility for further use as well as minimize post-harvest losses, agricultural products must be preserved. The drying technique is one of the oldest and most well-known methods of food preservation, and it is still widely utilized currently for the preservation of food products [10,11]. According to Khalloufi et al. [12], different structural and morphological alterations to food components throughout the drying process led to shrinkage of the foods. The reduction in food volume was linked to water loss as the cause of these alterations. Vatsyayan et al. [13] asserted that the dehydration process’ heat and mass flow had a significant influence on the product’s physicochemical characteristics, chemical properties, mechanical characteristics, volume, and porosity. The underlying principle behind drying is to reduce the amount of current moisture until it falls to a certain low limit that stops degradation and the following decay together within a predetermined time frame [10]. The market for additive-free dry food alternatives is constantly growing as a result of customers’ growing resistance to foods processed via the use of preservatives and the rising demand for good-quality quick-dried fruits and vegetables [10,14].
Bitter gourd often has more than 90% moisture and is prone to microbiological deterioration, nutritional loss, and metabolic changes that take place quickly like in other perishable fruits and vegetables [7,15,16]. Bitter gourd slices must be dried quickly for quality assurance and to preserve their medicinal efficacy. Therefore, the proper drying of fresh bitter gourd is necessary to prolong shelf life, preserve quality, minimize nutritional loss, and also to increase the likelihood of off-season accessibility [7,10]. Due to its therapeutic advantages, bitter gourd is recommended to be consumed year-round; therefore, preservation is essential.
The drying process is possible to be used via pretreatment and blanching to produce good-quality foods with an extended shelf life, ensuring the year-round accessibility of this vegetable to many people. Dried foods have an extended shelf life compared to those preserved by other methods [17,18,19]. On the other hand, drying typically causes changes to their physicochemical characteristics and nutritional content. To solve this issue, pretreatment following blanching is commonly performed before the products are dried; thus, the unfavorable changes that happen while drying and then storage are greatly reduced [20,21]. For fruit drying, many pretreatment procedures have been developed [22,23,24].
As a result, diverse food preservation techniques such as standard drying, vacuum, canning, freeze drying, as well as controlled atmosphere storage are utilized to preserve the bitter gourd’s properties [16], and to create dehydrated goods in the numbers needed for commercial manufacturing [7,25]. Although there are several food preservation techniques, all of them, except the hot-air drying technique, are costly [11,26]. Underlying the hot-air drying process, water is transported by diffusing from inside of the fruits and vegetables to the air stream via forced convection, which involves simultaneous mass and heat transfer [27]. Fruit or vegetable quality may be affected by the hot-air drying method, and browning reactions as well as oxidation of chlorophyll may take place [28,29]. A fruit or vegetable’s need for energy to dry relies on a variety of variables, including temperature, duration, and velocity [29,30].
Because of characteristics such as ease of operation, inexpensive investment in equipment, and high process efficiency, hot-air drying is indeed the most often used technique for drying bitter gourd slices. Nevertheless, if miscalculated process parameters are used for hot-air drying, the quality of dried bitter gourd slices may suffer, resulting in a loss of bitterness flavor components and bitter gourd nutrients.
A mathematical and statistical instrument called response surface methodology (RSM) is preferred to optimize complex processes that are influenced by a number of variables [31,32,33,34,35]. The method estimates interactions among several independent variables and their impacts on the dependent variables [33,36]. In comparison to the conventional approach, “one-variable-at-a-time” for the experimental plan, the response surface methodology has some advantages. Its main advantage is that it requires fewer tests to analyze various factors and their interactions and provides an effective model for optimization within a certain design boundary [33,37,38,39]. The response surface methodology has been employed to maximize the antioxidant activity of compounds derived from a diverse range of plant materials, like apples [40], potatoes [41], and garlic [42].
There is not much research on the use of response surface methodology to maximize the TPC, TAA, and vitamin C, as well as minimize the total color change (∆E) and drying time in bitter gourd fruit. Therefore, the current study aimed to determine appropriate drying parameters by studying fruit slice thickness (6–10 mm), DATs (60–80 °C) and blanching time (0–5 min, boiling salt water) on drying kinetics (regarding drying time and ∆E) while evaluating the TPC, TAA, and vitamin C.

2. Materials and Methods

2.1. Sample Preparation, Blanching Methods and Drying Tests

Bitter gourds, 100.58 ± 10.44 mm long and 45.87 ± 7.5 mm in diameter, ripe in color and softness, were kindly harvested from a private garden in Antalya region (36°53′10.1″ N 30°45′23.4″ E). In order to prevent the bitter gourds from being damaged, they were stored in separate boxes and transported to the laboratories of Akdeniz University. During the trials, harvested bitter gourds were rinsed with tap water and dried with towels, then sliced into 6, 8, and 10 mm thicknesses. After the slicing process, the slices that could not achieve a uniform ring form were separated for further processing. The seeds inside the sliced fruits and the red pulp around the seeds were cleaned. In order to improve final product quality and color, the sliced bitter gourd samples were subjected to a blanching process by dipping in a 2% (w/w) salt solution [13] at 93.5 °C temperature for 2.5 and 5 min. Then, the blanched sliced samples were transferred to an ice-distilled water bath (water:ice ratio 4:1) at 4 °C for 5 min to stop the heating stage, and drained for 1 min [43]. Control group samples were not subjected to any blanched process but just air-dried. All sliced bitter gourds, including control, were weighed and placed on drying trays.
The drying process were carried out in a 12-shelf, horizontal airflow, 1000 Watt cabinet convective dryer (Dalle, LT-27, Izmir, Turkey). The convective drier can be adjusted in a range of 30–90 °C DATs in 10 °C increments, and it has a 24-h adjustable timer. The experiments were carried out at 60, 70, and 80 °C DATs, respectively, and at a constant air velocity of 1.5 m/s, by making weight measurements at 15-min intervals. The trials ended when the moisture content had decreased to 10% or below as determined by the measurements. The fresh samples’ moisture content was determined at 105 °C for 24 h [44].

2.2. Experimental Design and Setup

The drying process conditions were optimized by the central composite design (CCD) of RSM. CCD is a useful statistical method for evaluating the relationships between dependent and independent variables as well as figuring out how much effect each variable has [45]. Three levels of three independent variables were applied for CCD using Design-Expert® software 11 (Stat-ease Inc., Minneapolis, MN, USA). The levels of the independent variables were coded as −1, 0, and +1. Three independent variables were changed within the ranges: DATs, 60–80 °C; slice thickness, 6–10 mm; and blanching time, 0–5 min. The blanching process was applied with the 2% salt solution before the drying process. CCD identified a total of 31 runs, including duplicates of each run and three runs at the design center. Table 1 lists the coded levels and ranges for each independent variable used in CCD.
Results of studies combining blanching with 2% salt solution and drying were modeled, and the resulting regression models were evaluated using analysis of variance (ANOVA), regression coefficients, and p- and F-values. Using the coefficient of determination (R2) and adjusted coefficient of determination (Adj-R2), the quality of the models was achieved.
By utilizing maximization and minimization criteria for dependent and independent variables, optimizations of the drying process in conjunction with blanching with 2% salt solution were carried out with the aid of the derived model equations [34,46]. The plus (+) symbols in the optimization module of a Design-Expert® 11 software package for process optimization were used to change the objective settings for the variables. For all software variables, the importance of the goals was set at (+++++), which is the greatest. To obtain the desirability function, Design-Expert® 11 software solved all objectives for all variables. The optimization module examined the merging of independent variable values that met the requirements imposed on each dependent variable.

2.3. Measurements of Dependent Variables

The effectiveness of the drying process combined with blanching in 2% salt solution was evaluated based on color measurement, TAA, TPC, and ascorbic acid content as dependent variables of the bitter gourd.

2.3.1. Color Measurement

Color measurements were made with a color measuring device (PCE-CSM3, Istanbul, Turkey). CIE L*, a*, b* values were read. The L* value represents brightness and ranges from 0 to 100. Positive a* represents red, negative a* green, positive b* yellow, and negative b* blue, respectively [47].
Color measurements of the samples were performed after drying and while they were fresh, and the ∆E was calculated with Equation (1). Here, Lref, aref, and bref represent fresh sample values, while others (L, a and b) represent dried sample values [48].
E = L L r e f 2 + a a r e f 2 + b b r e f 2

2.3.2. Total Antioxidant Activity (TAA)

In compliance with the method described by Fernández-León et al. [49], the samples’ TAA was assessed using the 2.2 Diphenyl-1-picrylhydrazyl (DPPH) radical discoloration test. A 950 mL volume of DPPH was mixed with 50 µL extract (in 6 × 10⁻⁵ M methanol). Samples of the mixture were agitated and left at room temperature under the dark condition for 30 min. Afterward, absorbance values were measured at 516 nm by a spectrophotometer (Shimadzu LC-20, UV-Vis 160A, Kyoto, Japan). The samples’ antioxidant activity levels were ascertained using the calibration curve of the Trolox standard. Results are presented in Trolox equivalent (g) per 100 g of dry matter (DM).

2.3.3. Total Phenolic Content (TPC)

The TPC was calculated using the Folin–Ciocalteu method [50]. To achieve this, 0.2 N Folin–Ciocalteu reagent (2.5 mL) and 0.5 mL of the extract were mixed, 2 mL of Na2CO3 solution (75.0 g L−1) was added, and the mixture was kept at 50 °C for 5 min. After waiting under the darkness for 10 min, it was immediately cooled, and absorbance of the samples was measured at 760 nm by spectrophotometer (Shimadzu LC-20, UV-Vis 160A, Japan). Gallic acid equivalents (GAE) in g/100 g of dry matter (DM) were used to indicate the overall phenolic content of the samples.

2.3.4. Ascorbic Acid Content

Using Ultraturrax, 1.0 g of sample was homogenized with 20 mL of metaphosphoric acid (4.5%) to ascertain the ascorbic acid concentration. The sample was centrifuged at 10,000 rpm for 10 min at 4 °C. Before being injected into the HPLC (Shimadzu, SPD-M20A, Japan), the samples were added to vials by passing through a 0.45 µm filter membrane [51]. A reversed-phase column (Nucleosil 5 C18) was used for the chromatographic separation. Using a solvent distribution system, an isocratic flow of ultrapure water (regulated with sulfuric acid to pH 2.2) was eluted at a rate of 0.8 mL/min using a diode array detector (SPD-20M20A); the detection was performed at 245 nm. Selected samples were separated by chromatography at a temperature of 32 °C using an injection volume of 20 µL. The ascorbic acid content was determined using the calibration curve graph of the ascorbic acid standard solution at various concentrations.

3. Results and Discussion

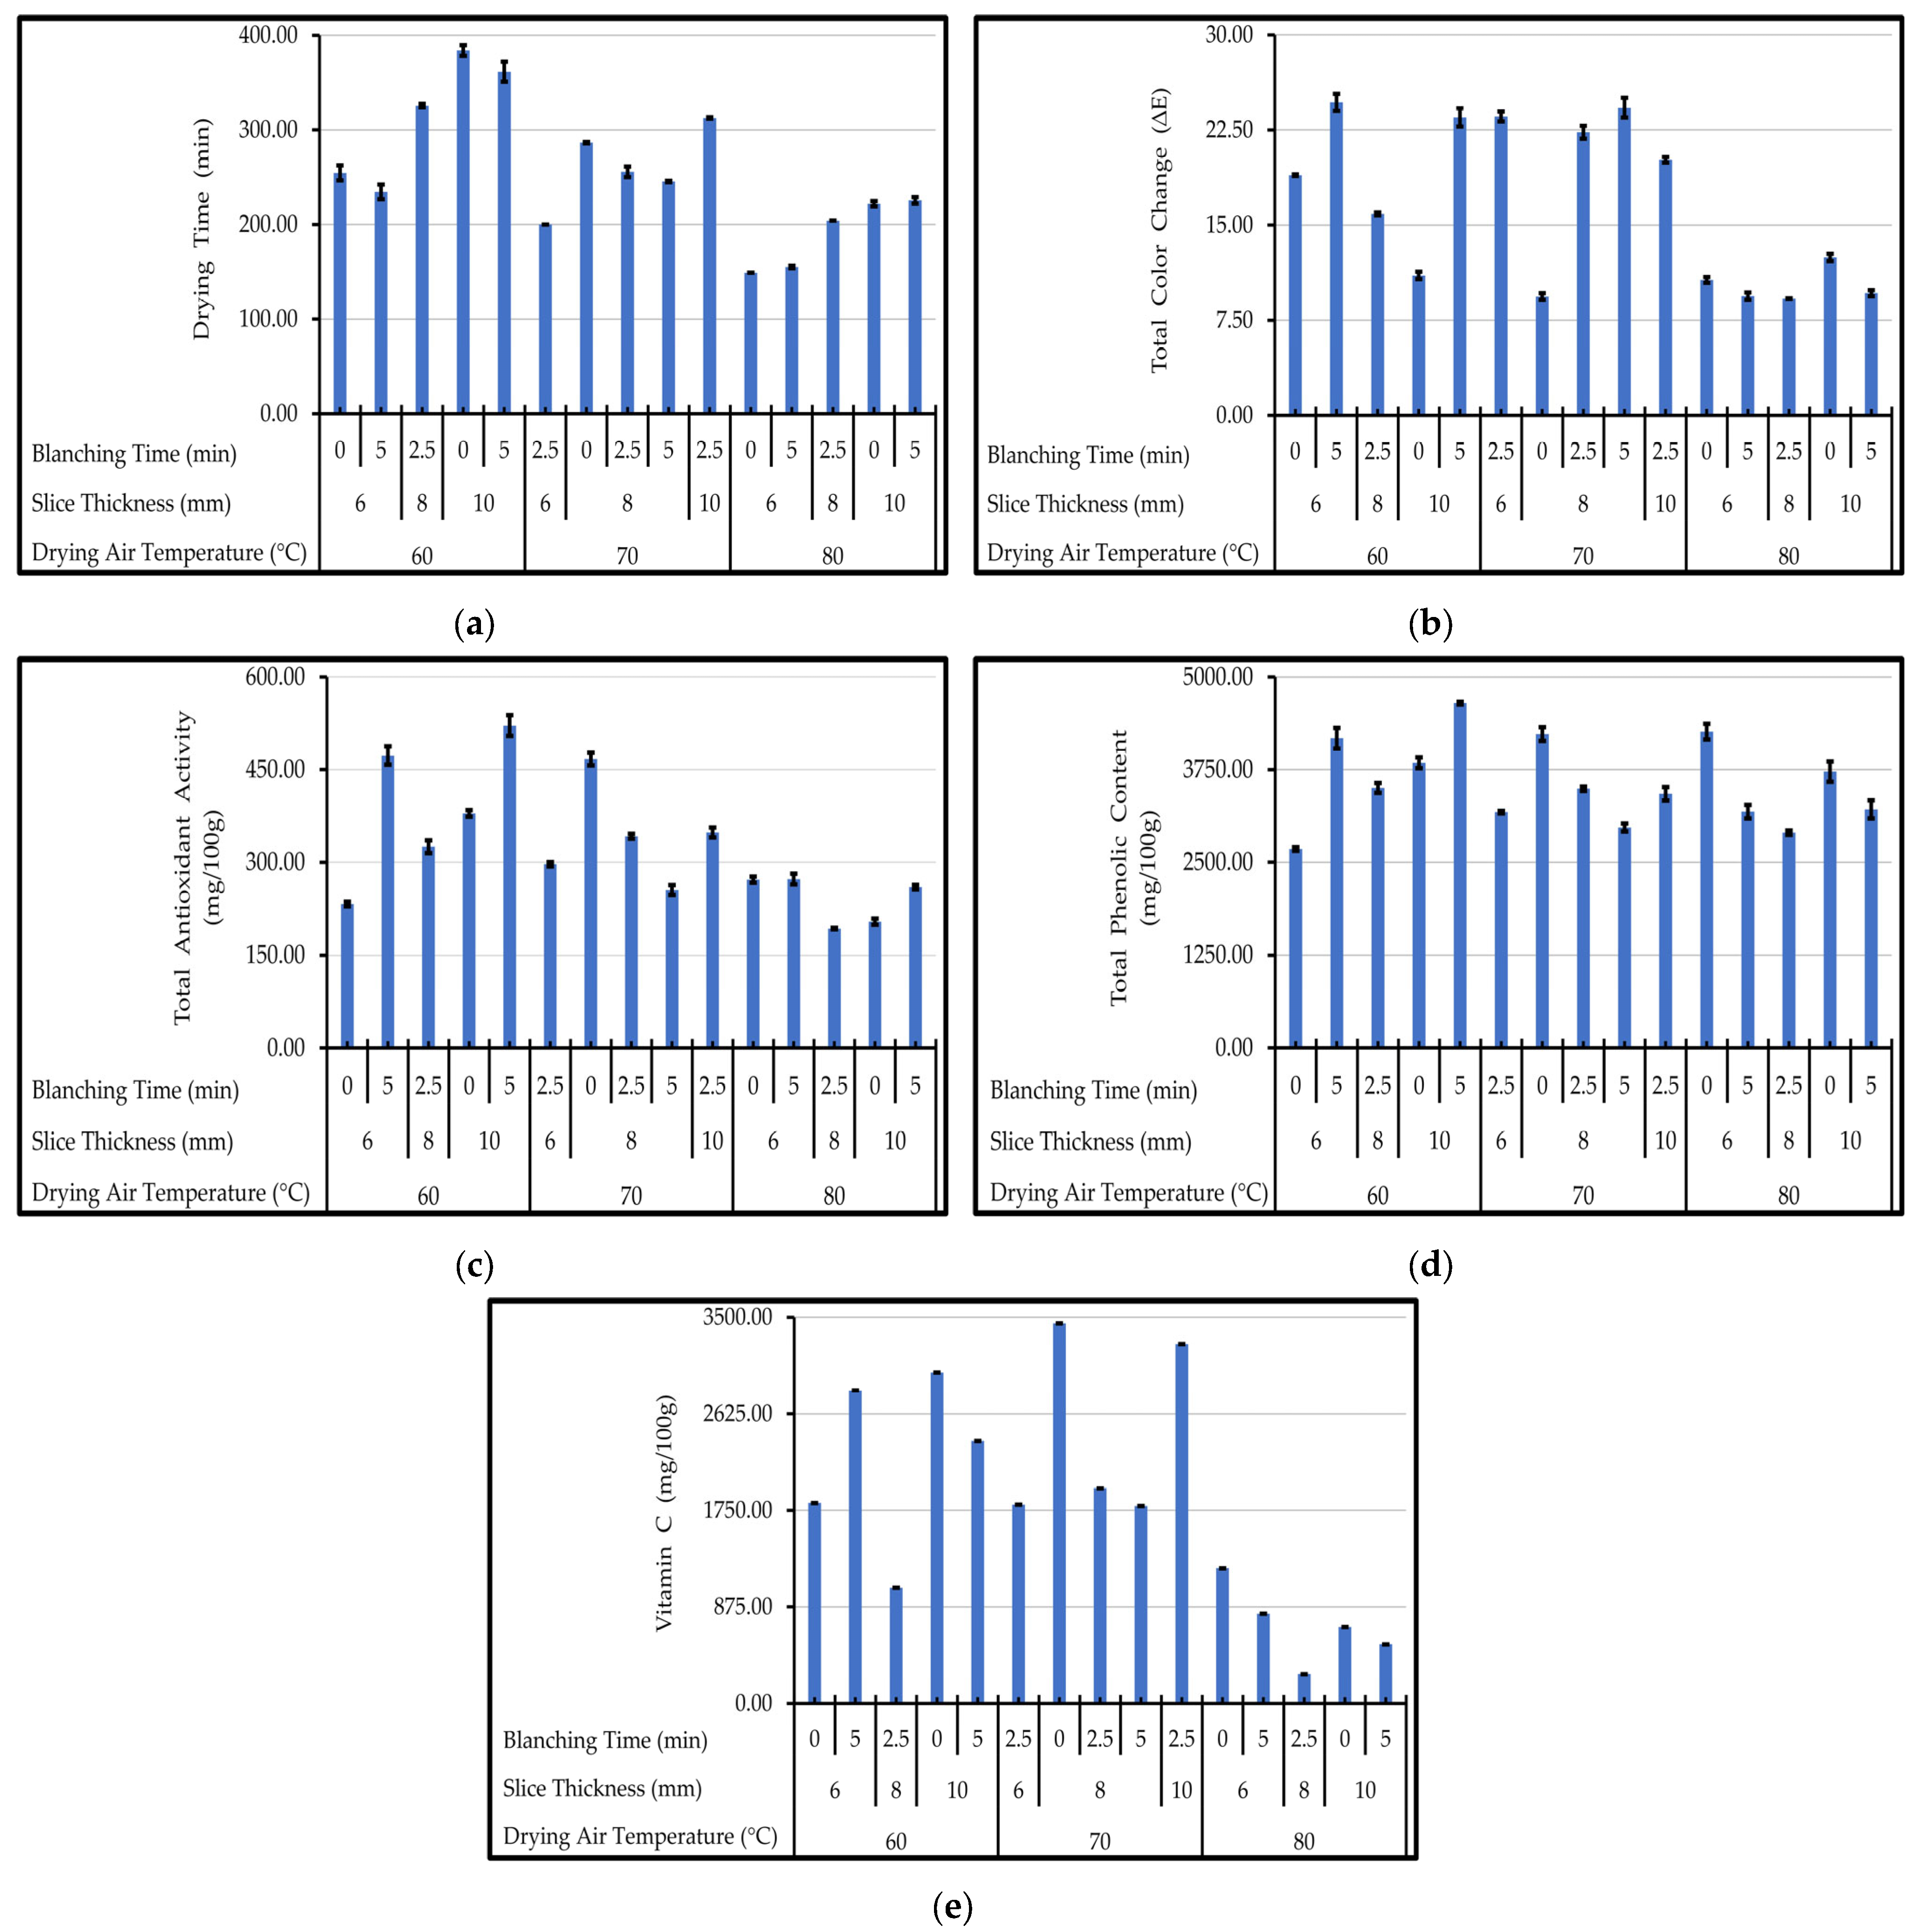
3.1. Effects of Drying Process on Drying Time, Color, TAA, TPC, and Vitamin C of Bitter Gourd

The effects of the drying process combined with blanching with 2% salt solution on drying time (a), total color change (∆E) (b), TAA (c), TPC (d), and vitamin C (e) are presented in Figure 1. Figure 1a shows that the drying time decreased as expected owing to the DAT increment from 60 °C to 80 °C. The shortest drying process was performed in 149 min at 80 °C DAT with unblanched bitter gourd samples with 6 mm slice thickness. The longest drying experiment was performed at 60 °C DAT on unblanched bitter gourd samples with 10 mm slice thickness and terminated at 384 min. In this study, the drying time of the bitter gourd slices was unaffected by the blanching procedure, contrary to previous studies on various products subjected to different blanched processes [4,52,53]. Drying is a manner of removing the water contained in a product while maintaining regulated airflow, temperature, and humidity levels, lowering the moisture content of the food to a point that prevents microbial development that would cause the food to rot and deteriorate. Drying time is shortened when the temperature rises because the moisture from the plant material is removed more quickly [54,55]. The findings of the current investigation also demonstrated that the slice thickness had a direct impact on the drying time at all temperatures. The drying experiments performed at all temperatures with a slice thickness of 6 mm were shorter than those with a slice thickness of 10 mm. The increase in slice thickness affected drying times by requiring more time to remove moisture. The findings of this study are in accordance with findings of previous research [4,53,56]. Previous studies conducted on various crops have demonstrated that the thinner sliced products dry more quickly [4,30,57]. At 60 °C and 70 °C DATs, regardless of slice thickness, the drying time decreased, while the blanching time was increased. On the other hand, at 80 °C DAT, while blanching time was increased, minor increases in drying time were recorded.
Due to the possibility of pigment components decomposing or oxidizing, color is a key indication for assessing fruit quality and also evolves into an indicator of processing quality. In the present study, degradation of color pigment components and, therefore, color changes were observed at various levels after the hot-air drying process [58,59,60]. The lowest (9.20) and highest (24.68) ∆E values were measured from the samples with 8 mm slice thickness at 80 °C DAT and 2.5 min blanching time and those with 6 mm slice thickness at 60 °C DAT and 5 min blanching time, respectively (Figure 1b). It was observed that the ∆E was lower in the drying process at 80 °C DAT compared to other DATs. Similar results were stated in previous studies [58,60]. The color changes of the dried products are thought to be the result of both enzymatic and nonenzymatic browning. The enzymes are destroyed at reasonably high temperature as the moisture in the fruits dries quickly. Because of the amino acids and sugars present in products at high temperatures, nonenzymatic browning, such as caramelization and the Maillard process, are likely to occur [58,60]. In other words, determining the optimum drying temperature for specific products is crucial for maintaining the products’ color quality. In the current study, it was observed that slice thicknesses did not significantly affect the ∆E. In the experiments carried out at 60 °C and 70 °C DATs, the increase in blanching time to 5 min negatively affected the total color change, and an increment in color change was observed. However, in the trials performed at 80 °C DAT, 2.5 min blanching with 2% salt solution reduced the ∆E and gave positive results. Similar trends were recorded in previous studies [61,62]. Blanching provides several benefits, including a shorter drying time, inactivation of enzymes that cause unfavorable changes in vegetables and fruits, expulsion of air from the tissue, and improved mineral and acid retention [63]. In one previous study, it was demonstrated that blanching in hot water could stop the enzymatic activity that causes discoloration and serve as a color-fixing agent [4]. Therefore, the findings of the present study clearly reveal that vegetable exposure to blanching as well as blanching time are also important factors that determine color changes.
The findings of the current study also demonstrated that bitter gourd slices subjected to the lowest DAT showed the highest TAA. The lowest (192.59 mg/100 g) and highest (521.18 mg/100 g) TAAs were determined in samples of 8 mm slice thickness at 80 °C DAT with 2.5 min blanching time and samples of 10 mm slice thickness at 60 °C DAT with 5 min blanching time, respectively. As easily observed from Figure 1c, the TAA decreased when the temperature reached 80 °C DAT. The findings of the present study were in accordance with previous research showing that antioxidants in plant materials were sensitive to hot-air drying processes [64,65]. Blanching increased the TAA of the samples dried at 60 °C DAT. On the other hand, the blanching process decreased antioxidant capacity at 70 °C DAT. Especially in the blanching process for samples of 8 mm slice thickness dried at 70 °C DAT, the TAA decreased due to the increased blanching time. In the drying process at 80 °C DAT for samples of 6 mm slice thickness, it was observed that blanching time did not create any difference in the antioxidant activity of the bitter gourd samples. On the other hand, as slice thickness and blanching time increased, TAA also increased at the 60 °C temperature. Phenolic compounds contribute significantly to plants’ antioxidant activity [66]. The findings of previous studies conducted in various plants [64,65] clearly revealed a strong relationship between TPC and TAA, which is in accordance with the findings of the present study. One of the remarkable results of the present study was the protection of the antioxidant activity of bitter gourd slices with hot-air drying at 60 °C, thus demonstrating that milder air drying temperatures have the potential to retain the antioxidants in bitter gourd. Along with the mild air-drying temperature, it was also clearly revealed that as the slice thickness and blanching time increased, the TAA of bitter gourd slices was increased, too.
The lowest TPC value of 2678.45 mg/100 g was determined from the sample of 6 mm slice thickness processed at 60 °C DAT with 0 min blanching time. The highest TPC value, 4648.28 mg/100 g, was obtained from the sample of 10 mm slice thickness at 60 °C DAT with 5 min blanching time (Figure 1d). Increasing DATs to 70 °C and 80 °C did not significantly affect TPC. Increasing the slice thickness from 6 mm to 10 mm increased the TPC at 60 °C DAT. On the other hand, increased slice thickness did not affect phenolic content at 70 °C and 80 °C DATs. Furthermore, for the samples with 6 mm and 10 mm slice thicknesses, increasing the blanching time to 5 min at 60 °C DAT increased the TPC. In contrast, TPC values decreased at 70 °C and 80 °C DATs with the increasing slice thickness. Conclusively, processing the bitter gourd at 60 °C DAT increased TPCs. The retention of phenolic contents is influenced by temperature. The duration of the drying process, various pretreatment processes such as blanching, and characteristics of vegetables and fruits such as chemical composition, moisture content, product surface area and thickness also have an impact on TPC [65,67]. Polyphenols are often found in the structure of cell walls and are linked by esters and glycosides. Therefore, polyphenols are released as a result of any treatment that damages cells. According to researchers, food processing techniques such as heat treatment can cause polyphenols to break down from cell structures and increase the amount of phenolic components [60]. Although increasing drying temperature may cause oxidative and hydrolytic enzymes to become active and consequently destroy polyphenol or alters their chemical structure or protein interactions with other molecules, as reported by Chandra et al. [68] and Kumar et al. [69], the bound polyphenols on the cell walls were released, and polyphenol contents increased at high drying temperatures (especially 70 °C) in bell peppers [70]. On the other hand, Horax et al. [71] reported an increment in phenolic compounds in M. charantia L. after 60 °C heat treatment. Similar findings were obtained in this investigation, as the results clearly demonstrated the effects of the blanching process, blanching time, and slice thickness on total phenolic content. The findings of this investigation indicated that the TPC of bitter gourd slices increased in accordance with the increase in blanching time. Our study also clearly revealed the effect of slice thickness on total phenolic contents. The highest TPC was recorded with the thickest bitter gourd slice sample after 5 min blanching. A similar trend was reported for quinces in a previous study [44].
The human body needs vitamin C, and it is considered to be an essential vitamin. Due to the heat and light sensitivity of vitamin C, ascorbic acid serves as a quality indicator for dried products. The main determinants of ascorbic acid degradation in diverse food processes are processing time and temperature [10]. While the lowest vitamin C (ascorbic acid) value of 266.31 mg/100 g was measured at 80 °C DAT in a sample with 8 mm slice thickness and 2.5 min blanching time, the highest vitamin C value was quantified as 3444.66 mg/100 g at 70 °C DAT in a sample with 8 mm slice thickness and 0 min blanching time. The lowest Vitamin C levels were recorded at 80 °C DAT (Figure 1e), since high temperature causes the decomposition and oxidation of ascorbic acid. The decomposition and oxidation of Vitamin C are accelerated at high temperatures due to its characteristic of being thermally sensitive. Regardless of temperature, the vitamin C concentration is also affected by increases in thickness of the slice sample and the pretreatment process. The findings of this investigation demonstrated that, under the dual effect of high temperature and blanching, the vitamin C content decreased. When the blanching time was increased from 0 to 5 min at 70 °C and 80 °C DATs, except for the conditions at 60 °C DAT and 6 mm slice thickness, vitamin C content was decreased. Furthermore, increasing the sample slice thickness from 6 mm to 10 mm at 60 °C and 70 °C DATs resulted in increased vitamin C content. Yang et al. [72] showed that slice thickness and DAT had an impact on vitamin C content. Zahoor and Khan [10] revealed that drying at low temperatures, e.g., 40 °C, caused more vitamin C losses than higher temperatures (60 °C), since vitamin C oxidation was facilitated by the longer drying times. Similar trends of ascorbic acid degradation affected by DAT were reported for various vegetables and fruits in previous studies [65,73,74,75].

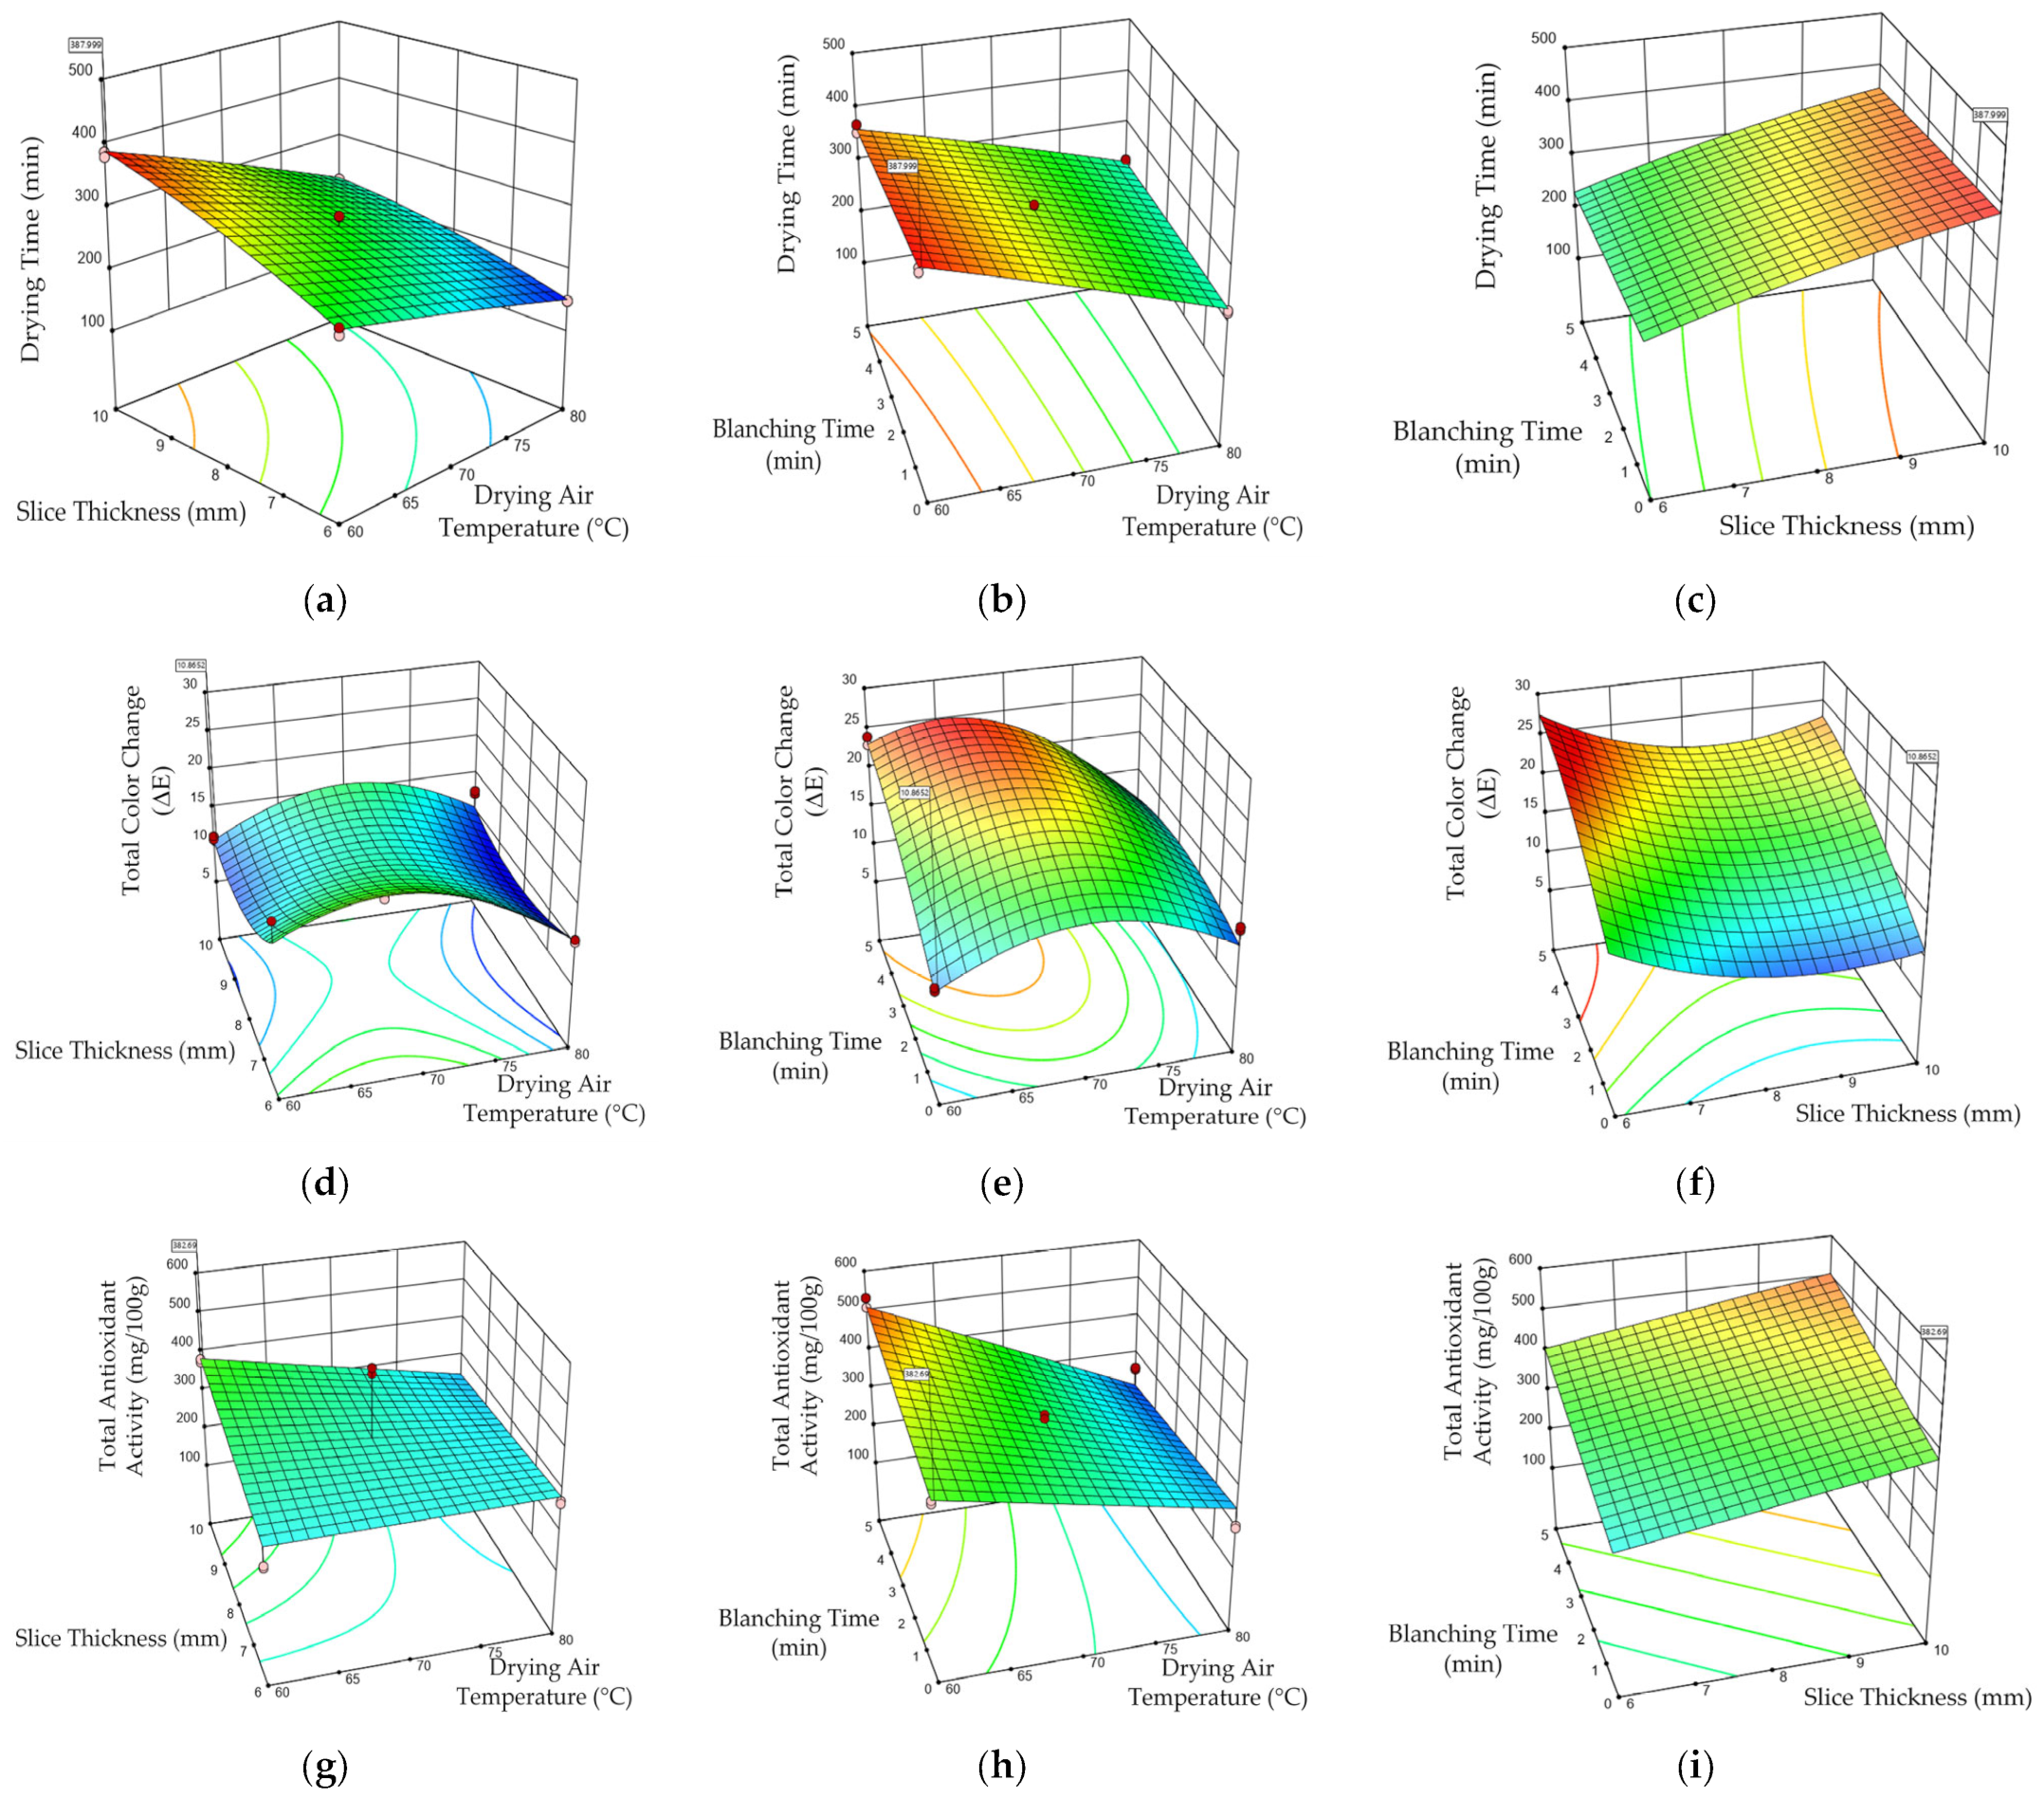
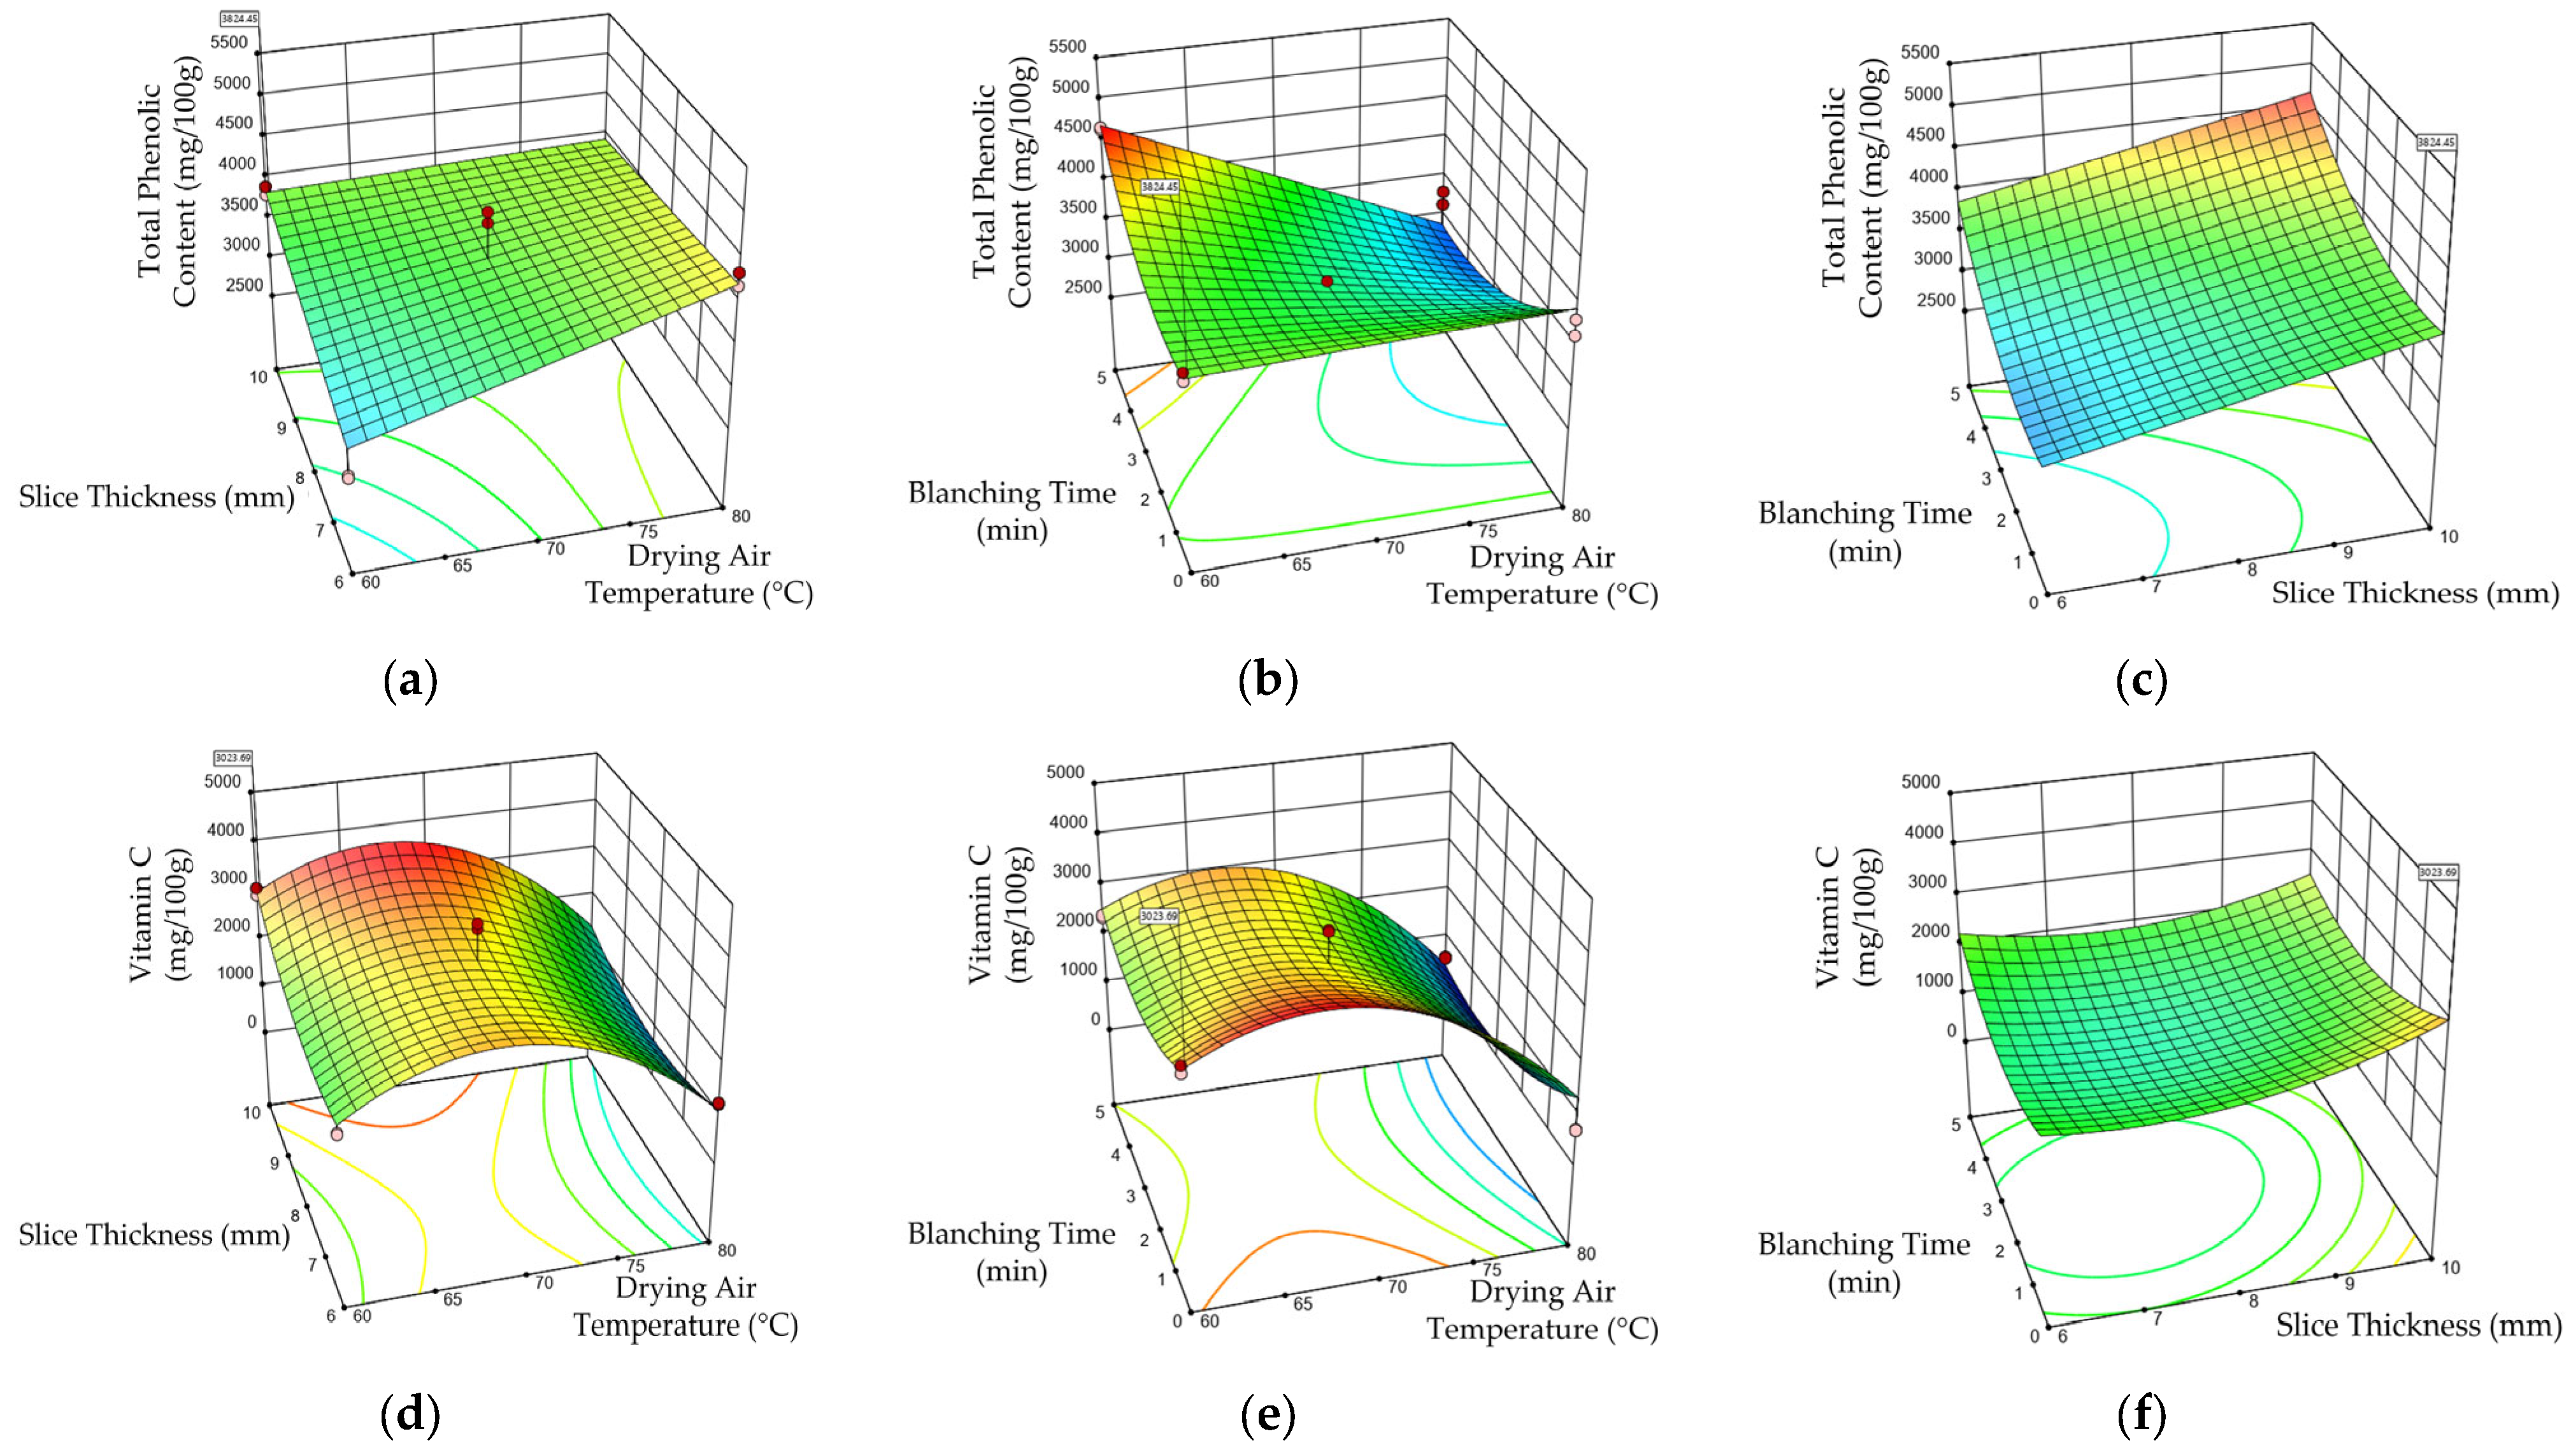
3.2. Modeling and Statistical Evaluation of Drying Process by Response Surface Methodology

On the basis of the experimental findings, RSM utilizing CCD was adopted to determine the optimum process conditions of the three chosen variables (DAT, slice thickness, and blanching time) that strongly influenced the drying process for bitter gourd in terms of the drying time, color change, and total antioxidant, phenolic and vitamin C contents. A total of 31 runs, including three runs at the design center and with duplicates of each run of experimental design, were performed, and the results of the corresponding responses were used in the modeling and optimization of he process. Model equations were obtained by applying multiple regression analysis to the experimental data. ANOVA was conducted to test the significance of the fit of the model equations for drying time, total color change, and total antioxidant, phenolic and vitamin C contents, as shown in Table 2 and Table 3.
Analysis of variance must be performed to determine a model’s significance and suitability. The Fisher variance ratio, often known as the F-value, is a statistically reliable indicator of how well the variables capture the variance in the data’s mean. A higher F-value shows that the estimated variable effects are valid and that the variables properly account for the variance in the data regarding their mean [76]. Models were highly significant, as evident from the Fisher’s F-test with very low probability value (P model > F = 0.0001 for drying time, total color change, phenolic and vitamin C contents, and P model > F = 0.0002 for antioxidant activity). The R2 and Adj-R2, which are measures of how well the model fits the data, were used to describe the model’s fit quality. Coefficients of determination, R2, were found as 0.9874, 0.8514, 0.7365 and 0.8156, whereas Adj-R2, were determined as 0.9819, 0.7878, 0.6706 and 0.7366 for drying time, total color change, total phenolic and vitamin C contents, respectively, indicating good fits. R2 and Adj-R2 values for total antioxidant content were calculated as 0.5942 and 0.5130, respectively. Even if calculated R2 and Adj-R2 for total antioxidant capacity were lower than those for the other models, the values were at an acceptable level.
The signal-to-noise ratio is a measure of adequate accuracy, and a ratio greater than 4 is preferred [76]. Therefore, the rates of 46.77, 10.54, 9.95, 11.98 and 10.76 for the models of drying time, total color change, and total antioxidant, phenolic and vitamin C contents, respectively, showed that it is possible to navigate the design space using signals that are suitable for the models. A lower coefficient of variation (CV) means a higher reliability of the experiments [76]. Calculated CV values for drying time, total color change, and total phenolic content were at reasonable levels.
Values of Prob > F less than 0.05 indicated that model terms were significant. The linear effect of DAT (A), slice thickness (B), and blanching time (C), interactive terms of (AB) and (AC) and square terms of slice thickness (B2) were significant at the level of p < 0.0001 for the model of drying time. On the other hand, it was observed that the interactive terms of (BC) and square terms of DAT (A2) and blanching time (C2) were insignificant. Linear effect of DAT (A) and blanching time (C), interactive term (AC) and square term of DAT (A2) and blanching time (C2) were found to be significant for the ∆E model for the bitter gourd drying process. DAT (A) and interactive terms of (AC) were found to be major model terms for TAA. Furthermore, DAT (A), interactive terms of (AB) and (AC), along with the square term of blanching time (C2), were significant, whereas slice thickness (B) and blanching time (C) shown in ANOVA analysis were not significant (p > 0.05) for the TPC model of the bitter gourd drying process. And finally, the linear effect of DAT (A), and square terms of DAT (A2), blanching time (C2) and slice thickness (B2) were found to be respectable model terms.
Under optimal conditions, the impacts of independent variables were expressed using 3D response surface plots. The 3D response surface plots for the effects of independent variables (DAT, slice thickness, and blanching time) on drying time (Figure 2a–c), on ∆E (Figure 2d–f), and on TAA (Figure 2g–i) are presented.
The drying time model correctly predicted the actual data points, which are displayed as red dots on the graphs in Figure 2a–c. In the interaction of slice thickness and DAT given in Figure 2a, the highest drying time was predicted for the 10 mm slice thickness and 60 °C air drying temperature conditions. In Figure 2b, on the other hand, the DAT and blanching time for maximum drying time were found to be 60 °C DAT and 0 min blanching time. Figure 2c also revealed that, within this experimental design, the 10 mm slice thickness and 0 min blanching time were the conditions for the highest drying time. The lower air-drying temperatures and increased slice thicknesses took more time to dry. The findings of Yasmin et al. [4] showed that a 4 mm slice thickness and 80 °C drying temperature took the shortest drying time. A similar trend was demonstrated in previous studies for different vegetables and fruits such as eggplants (Ertekin and Yaldiz [30]), carrots (Wu et al. [57]), mango (El-Amin et al. [77]), and Cape gooseberry (Vega-Gálvez et al. [56]). As a result, the amount of evaporated moisture per unit of time increased, and the rate of moisture content change decreased with increasing slice thickness. Minimum color change is an important parameter from the perspective of consumer preferences. As seen in Figure 2d,e,g, minimum color change was obtained with the 10 mm slice thickness, 60 °C air drying temperature, and 0 min blanching time. Increasing blanching time from 0 to 5 min at 60 °C (Figure 2e) with a 6 mm slice thickness (Figure 2f) resulted in higher color changes. Total antioxidant capacity is another essential parameter that should be as high as possible. Total antioxidant capacity values were found to be higher at 60 °C DAT with a 5 min blanching time (Figure 2h) and with a 10 mm slice thickness and 5 min blanching time (Figure 2i). The results of this experiment show that the TPC and TAA of the dried products were not degraded owing to the reduction in drying time by the conventional hot-air drying process.
Plots of the 3D response surface for the influence of independent variables (DAT, slice thickness, and blanching time) on TPC (Figure 3a–c) and on vitamin C (Figure 3d–f) are presented.
In the interaction of slice thickness/air drying temperature given in Figure 3a, the highest TPC was predicted for 80 °C air-drying temperature conditions and a 10 mm slice thickness. In Figure 3b, on the other hand, the DAT and blanching time for maximum phenolic content were found at 60 °C with a 5 min blanching time. Figure 3c also shows that a 10 mm slice thickness and 5 min blanching time were the favorable process conditions for the highest TPC of dried bitter gourd. Kheto et al. [70] demonstrated that elevating the drying temperatures induced an increase in the polyphenol contents of bell pepper. Previous research findings found that the TPC of vegetables and fruits were affected by the blanching process, blanching time, and slice thickness [65,67]. Vitamin C increased with an increase in slice thickness to 10 mm, but decreased due to increasing DAT (from 60 °C to 80 °C). Maximum vitamin C enhancement to 3000–3500 mg/100 g was observed at 65–70 °C DATs with the 10 mm slice thickness (Figure 3d).
Process optimization is a valuable guiding approach for the commercialization of industrial processes. Since the main purpose in this study was the optimization of the hot-air drying and blanching processes for the acceptable product quality of bitter gourd, the experimental outcomes were optimized by Design-Expert® 11 software using the model equations of drying time, ∆E, TAA, TPC, and vitamin C contents presented in Table 2 and Table 3. Maximum yield was preferred for the optimization based on total antioxidant, phenolic and vitamin C contents. TAA, TPC, and vitamin C contents were maximized, whereas total color change was minimized to reduce color change from the perspective of consumer demand. DAT, slice thickness, blanching time and drying time were set within ranges during the optimization. The optimal conditions determined for the most desirable outcome of 0.702 were 60 °C DAT, 10 mm slice thickness, and 0 min blanching time. Under these conditions, 388 min drying time, 382.68 mg/100 g antioxidant content, 3823.44 mg/100 g phenolic matter and 3023.69 mg/100 g vitamin C were predicted.

4. Conclusions

According to the results for drying time, influenced by DAT, increasing DAT decreased the drying time. It was observed that the drying time increased as expected with increases in the thickness of the bitter gourd slices, which were produced and dried in different thicknesses. From the different drying temperatures used, it was observed that the ∆E reached its highest value at 70 °C. The highest TAA and TPC were obtained at lower DATs. While TAA and TPC were increased with longer blanching times at lower DATs, they were decreased with longer blanching times at higher DATs. At higher DATs, vitamin C values were decreased. According to the results of modeling of the bitter gourd drying process, the fitness of the individual models for drying time, ∆E, TPC, and vitamin C had higher R2 and Adj-R2; the statistical values were lower for TAA, but all were in an acceptable range. The 3D response surface method yielded the best drying conditions of 60 °C DAT and 10 mm slice thickness without any blanching for the best drying time, TAA, TPC, and vitamin C content.

Author Contributions

Conceptualization, T.O.K., I.B., C.E. and A.N.O.; methodology, T.O.K., I.B., N.A.P. and C.E.; software, T.O.K., I.B. and K.K.G.; investigation, M.T., N.A.P., C.E. and A.N.O.; resources, C.E. and A.N.O.; writing—original draft preparation, T.O.K., I.B. and N.A.P.; writing—review and editing, T.O.K., I.B., N.A.P., C.E. and A.N.O.; visualization, C.E.; supervision, C.E. All authors have read and agreed to the published version of the manuscript.

Funding

This research received no external funding.

Institutional Review Board Statement

Not applicable.

Data Availability Statement

If requested it can be supplied.

Conflicts of Interest

The authors declare no conflict of interest.

References

  1. Grover, J.; Yadav, S. Pharmacological actions and potential uses of Momordica charantia: A review. J. Ethnopharm. 2004, 93, 123–132. [Google Scholar] [CrossRef] [PubMed]
  2. Braca, A.; Siciliano, T.; D’Arrigo, M.; Germanòb, M.P. Chemical composition and antimicrobial activity of Momordica charantia seed essential oil. Fitoterapia 2008, 79, 123–125. [Google Scholar] [CrossRef]
  3. Aziz, M.G.; Roy, J.; Sarker, M.S.H.; Yusof, Y.A. Isolation and use of bitter gourd polysaccharide in formulating dietetic soft drinks. Afr. J. Agric. Res. 2011, 6, 5313–5319. [Google Scholar]
  4. Yasmin, S.; Hasan, M.; Sohany, M.; Sarker, M.S.H. Drying kinetics and quality aspects of bitter gourd (Momordica charantia) dried in a novel cabinet dryer. Food Res. 2022, 6, 180–188. [Google Scholar] [CrossRef] [PubMed]
  5. Namdeo, K.; Bodakhe, S.; Dwedi, J.; Saifi, A. A review on antidiabetic potential of M. charantia linn. Int. J. Pharm. Res. Bio. Sci. 2013, 2, 475–485. [Google Scholar]
  6. Jia, S.; Shen, M.; Zhang, F.; Xie, J. Recent advances in Momordica charantia: Functional components and biological activities. Int. J. Mol. Sci. 2017, 18, 2555. [Google Scholar] [CrossRef] [PubMed]
  7. Yan, J.-K.; Wu, L.-X.; Qiao, Z.-R.; Cai, W.-D.; Ma, H. Effect of different drying methods on the product quality and bioactive polysaccharides of bitter gourd (Momordica charantia L.) slices. Food Chem. 2019, 271, 588–596. [Google Scholar] [CrossRef] [PubMed]
  8. Zhang, F.; Lin, L.; Xie, J. A mini-review of chemical and biological properties of polysaccharides from Momordica charantia. Int. J. Bio. Macromol. 2016, 92, 246–253. [Google Scholar] [CrossRef]
  9. Budrat, P.; Shotipruk, A. Extraction of phenolic compounds from fruits of bitter melon (Momordica charantia) with subcritical water extraction and antioxidant activities of these extracts. Chiang Mai J. Sci. 2008, 35, 123–130. [Google Scholar]
  10. Zahoor, I.; Khan, M.A. Microwave assisted convective drying of bitter gourd: Drying kinetics and effect on ascorbic acid, total phenolics and antioxidant activity. J. Food Meas. Charac. 2019, 13, 2481–2490. [Google Scholar] [CrossRef]
  11. Vijayan, S.; Arjunan, T.V.; Kumar, A. Exergo-environmental analysis of an indirect forced convection solar dryer for drying bitter gourd slices. Renew. Energy 2020, 146, 2210–2223. [Google Scholar] [CrossRef]
  12. Khalloufi, S.; Almeida-Rivera, C.; Bongers, P. A theoretical model and its experimental validation to predict the porosity as a function of shrinkage and collapse phenomena during drying. Food Res. Int. 2009, 42, 1122–1130. [Google Scholar] [CrossRef]
  13. Vatsyayan, S.; Raina, R.; Kumar, M. Influence of blanching and guar gum pretreatments on total phenolic content and antioxidant activity of cabinet-dried white bitter gourd Momordica charantia L. J. Appl. Nat. Sci. 2022, 14, 326–331. [Google Scholar] [CrossRef]
  14. Ekezie, F.-G.C.; Sun, D.-W.; Han, Z.; Cheng, J.-H. Microwave-assisted food processing technologies for enhancing product quality and process efficiency: A review of recent developments. Trends Food Sci. Technol. 2017, 67, 58–69. [Google Scholar] [CrossRef]
  15. Chauhan, P.S.; Kumar, A.; Nuntadusit, C.; Banout, J. Thermal modeling and drying kinetics of bitter gourd flakes drying in modified greenhouse dryer. Renew. Energy 2018, 118, 799–813. [Google Scholar] [CrossRef]
  16. Ahmad, A.; Prakash, O.; Kumar, A. Drying kinetics and economic analysis of bitter gourd flakes drying inside hybrid greenhouse dryer. Environ. Sci. Poll. Res. 2021, 30, 72026–72040. [Google Scholar] [CrossRef]
  17. Wakjira, M. Solar drying of fruits and windows of opportunities in Ethiopia. Afr. J. Food Sci. 2010, 4, 790–802. [Google Scholar]
  18. Mohamed, G.F.; Abdelmaguid, N.M.; Ibrahim, W.A.; Helmy, I.M.F.; Nadir, A.S. Effect of different drying methods and pre-treatments on quality characteristics of mango slices. Middle East J. App. Sci. 2017, 7, 519–531. [Google Scholar]
  19. Wang, Q.; Li, S.; Han, X.; Ni, Y.; Zhao, D.; Hao, J. Quality evaluation and drying kinetics of shitake mushrooms dried by hot air, infrared and intermittent microwave-assisted drying methods. LWT-Food Sci. Technol. 2019, 107, 236–242. [Google Scholar] [CrossRef]
  20. Adepoju, L.A.; Osunde, Z.D. Effect of pretreatments and drying methods on some qualities of dried mango (Mangifera indica) fruit. Agric. Eng. Int. CIGR 2017, 19, 187–194. [Google Scholar]
  21. Delfiya, A.; Mohapatra, D.; Mishra, A.K. Effect of microwave blanching and brine solution pretreatment on the quality of carrots dried in solar-biomass hybrid dryer. J. Food Proc. Preserv. 2017, 42, e13510. [Google Scholar] [CrossRef]
  22. Pott, I.; Neidhart, S.; Mu, W.; Carle, R. Quality improvement of non-sulphited mango slices by drying at high temperatures. Innov. Food Sci. Emerg. Technol. 2005, 6, 412–419. [Google Scholar] [CrossRef]
  23. Karim, O.R.; Awonorin, S.O.; Sanni, L.O. Effect of pretreatments on quality attributes of air-dehydrated pineapple slices. J. Food Technol. 2008, 6, 158–165. [Google Scholar]
  24. Abano, E.E.; Owusu, J.; Engmann, F.N. Effects of ascorbic acid, salt, lemon juice, and honey on drying kinetics and sensory characteristic of dried mango. Croat. J. Food Sci. Technol. 2013, 5, 1–10. [Google Scholar]
  25. Femenia, A. High-value co-products from plants: Cosmetics and pharmaceuticals. In Waste Management and Co-Product Recovery in Food Processing; Waldron, K.W., Ed.; Woodhead Publishing Limited: Cambridge, UK, 2007; Volume 1, pp. 470–491. [Google Scholar]
  26. Kalra, C.L.; Pruthi, J.S.; Tiotia, M.S.; Raina, B.L. Influence of variety on the quality of processed bitter gourd. Indian Food Pucker 1983, 37, 71–77. [Google Scholar]
  27. Kumar, N.; Sarkar, B.C.; Sharma, H.K. Effect of air velocity on kinetics of thin layer carrot pomace drying. Food Sci. Technol. Int. 2011, 17, 459–469. [Google Scholar] [CrossRef]
  28. Lewicki, P.P. Design of hot air drying for better foods. Trends Food Sci. Technol. 2006, 17, 153–163. [Google Scholar] [CrossRef]
  29. Chen, J.; Zhou, Y.; Fang, S.; Meng, Y.; Kang, X.; Xu, X.; Zuo, X. Mathematical modeling of hot air drying kinetics of Momordica charantia slices and its color change. Adv. J. Food Sci. Technol. 2013, 5, 1214–1219. [Google Scholar] [CrossRef]
  30. Ertekin, C.; Yaldiz, O. Drying of eggplant and selection of a suitable thin layer drying model. J. Food Eng. 2004, 63, 349–359. [Google Scholar] [CrossRef]
  31. Baş, D.; Boyacı, İ.H. Modeling and optimization I: Usability of response surface methodology. J. Food Eng. 2007, 78, 836–845. [Google Scholar] [CrossRef]
  32. Miao, Y.; Hongzhi, L.; Ying, Y.; Aimin, S.; Li, L.; Hui, H.; Qiang, W.; Hongwei, Y.; Xiaohe, W. Optimising germinated conditions to enhance yield of resveratrol content in peanut sprout using response surface methodology. Int. J. Food Sci. Technol. 2016, 51, 1754–1761. [Google Scholar] [CrossRef]
  33. Hani, N.M.; Torkamani, A.E.; Abidin, S.Z.; Mahmood, W.A.K.; Juliano, P. The effects of ultrasound assisted extraction on antioxidative activity of polyphenolics obtained from Momordica charantia fruit using response surface approach. Food Biosci. 2017, 17, 7–16. [Google Scholar] [CrossRef]
  34. Yılmaz, F.; Kökdemir Ünşar, E.; Perendeci, N.A. Enhancement of methane production from banana harvesting residues: Optimization of thermal—Alkaline hydrogen peroxide pretreatment process by experimental design. Waste Bio. Valor. 2019, 10, 3071–3087. [Google Scholar] [CrossRef]
  35. Başar, İ.B.; Çoban, Ö.; Göksungur, M.Y.; Eskicioğlu, Ç.; Perendeci, N.A. Enhancement of lignocellulosic biomass anaerobic digestion by optimized mild alkaline hydrogen peroxide pretreatment for biorefinery applications. J. Environ. Manag. 2021, 298, 113539. [Google Scholar] [CrossRef] [PubMed]
  36. Prakash Maran, J.; Manikandan, S.; Thirugnanasambandham, K.; Vigna Nivetha, C.; Dinesh, R. Box–Behnken design based statistical modeling for ultrasoundassisted extraction of corn silk polysaccharide. Carbohydr. Polym. 2013, 92, 604–611. [Google Scholar] [CrossRef] [PubMed]
  37. Bezerra, M.A.; Santelli, R.E.; Oliveira, E.P.; Villar, L.S.; Escaleira, L.A. Response surface methodology (RSM) as a tool for optimization in analytical chemistry. Talanta 2008, 76, 965–977. [Google Scholar] [CrossRef] [PubMed]
  38. Zhong, K.; Wang, Q. Optimization of ultrasonic extraction of polysaccharides from dried longan pulp using response surface methodology. Carbohydr. Polym. 2010, 80, 19–25. [Google Scholar] [CrossRef]
  39. Günerhan, U.; Dumlu, L.; Us, E.; Yılmaz, V.; Carrère, H.; Perendeci, N.A. Impacts of chemical assisted thermal pretreatments on methane production from fruit and vegetable harvesting wastes: Process optimization. Molecules 2020, 25, 500. [Google Scholar] [CrossRef]
  40. Alberti, A.; Zielinski, A.A.F.; Zardo, D.M.; Demiate, I.M.; Nogueira, A.; Mafra, L.I. Optimisation of the extraction of phenolic compounds from apples using response surface methodology. Food Chem. 2014, 149, 151–158. [Google Scholar] [CrossRef]
  41. Heybeli, N.; Ertekin, C.; Karayel, D. Optimization of an industrial type prototype shelf dryer by response surface methodology “A case study for potato”. Agric. Mech. Asia Afr. Lat. Am. 2015, 46, 53–60. [Google Scholar]
  42. Ciric, A.; Krajnc, B.; Heath, D.; Ogrinc, N. Response surface methodology and artificial neural network approach for the optimization of ultrasound-assisted extraction of polyphenols from garlic. Food Chem. Toxi. 2020, 135, 110976. [Google Scholar] [CrossRef] [PubMed]
  43. Mehta, D.; Prasad, P.; Bansal, V.; Siddiqui, M.W.; Sharma, A. Effect of drying techniques and treatment with blanching on the physicochemical analysis of bitter-gourd and capsicum. Int. J. Food Sci. Technol. 2017, 84, 479–488. [Google Scholar] [CrossRef]
  44. Akman, H.E.; Boyar, I.; Gozlekci, S.; Saracoglu, O.; Ertekin, C. Effects of convective drying of quince fruit (Cydonia oblonga) on color, antioxidant activity and phenolic compounds under various fruit juice dipping pre-treatments. Agriculture 2022, 12, 1224. [Google Scholar] [CrossRef]
  45. Montgomery, D.C. Design and analysis of experiments. In Design-Expertfi Software Version 6 User’s Guide; Wiley: New York, NY, USA, 2001. [Google Scholar]
  46. Başar, İ.A.; Perendeci, N.A. Optimization of zero-waste hydrogen peroxide-Acetic acid pretreatment for sequential ethanol and methane production. Energy 2021, 225, 120324. [Google Scholar] [CrossRef]
  47. Hazar, D.; Boyar, I.; Dincer, C.; Ertekin, C. Investigation of color and bioactive compounds of different colors from pansy (Viola × wittrockiana Gams.) dried in hot air dryer. Horticulturae 2023, 9, 186. [Google Scholar] [CrossRef]
  48. Menges, H.O.; Ünver, A.; Özcan, M.M.; Ertekin, C.; Sonmete, M.H. The effects of drying parameters on drying characteristics, colorimetric differences, antioxidant capacity and total phenols of sliced kiwifruit. Erwerbs-Obstbau 2019, 61, 195–207. [Google Scholar] [CrossRef]
  49. Fernández-León, M.F.; Fernández-León, A.M.; Lozano, M.; Ayuso, M.C.; González-Gómez, D. Altered commercial controlled atmosphere storage conditions for ‘Parhenon’broccoli plants (Brassica oleracea L. var. italica). Influence on the outer quality parameters and on the health-promoting compounds. LWT-Food Sci. Technol. 2013, 50, 665–672. [Google Scholar] [CrossRef]
  50. Škerget, M.; Kotnik, P.; Hadolin, M.; Hraš, A.R.; Simonič, M.; Knez, Ž. Phenols, proanthocyanidins, flavones and flavonols in some plant materials and their antioxidant activities. Food Chem. 2005, 89, 191–198. [Google Scholar] [CrossRef]
  51. Asami, D.K.; Hong, Y.J.; Barrett, D.M.; Mitchell, A.E. Comparison of the total phenolic and ascorbic acid content of freeze-dried and air-dried marionberry, strawberry, and corn grown using conventional, organic, and sustainable agricultural practices. J. Agri. Food Chem. 2003, 51, 1237–1241. [Google Scholar] [CrossRef]
  52. Bi, J.; Yang, A.; Liu, X.; Wu, X.; Chen, Q.; Wang, Q.; Lv, J.; Wang, X. Effects of pretreatments on explosion puffing drying kinetics of apple chips. LWT Food Sci. Technol. 2015, 60, 1136–1142. [Google Scholar] [CrossRef]
  53. Doymaz, I. Kinetics, rehydration and colour characteristics of convective hot-air drying of carrot slices. Heat Mass Transf. 2017, 53, 25–35. [Google Scholar] [CrossRef]
  54. Kayisoglu, S.; Ertekin, C. Vacuum drying kinetics of barbunya bean (Phaseolus vulgaris L. elipticus Mart.). Philipp. Agric. Sci. 2011, 94, 285–291. [Google Scholar]
  55. Bhattacharjee, D.; Das, S.; Dhua, R.S. Dehydration for better quality value added product of bitter gourd (Momordica charantia L.). Indian J. Pharm. Biol. Res. 2016, 4, 39–45. [Google Scholar] [CrossRef]
  56. Vega-Gálvez, A.; Zura-Bravo, L.; Lemus-Mondaca, R.; Martinez Monzó, J.; Quispe-Fuentes, I.; Puente, L.; Di Scala, K. Influence of drying temperature on dietary fibre, rehydration properties, texture and microstructure of Cape gooseberry (Physalis peruviana L.). J. Food Sci. Technol. 2015, 52, 2304–2311. [Google Scholar] [CrossRef] [PubMed]
  57. Wu, B.; Ma, H.; Qu, W.; Wang, B.; Zhang, X.; Wang, P.; Wang, J.; Atungulu, G.G.; Pan, Z. Catalytic infrared and hot air dehydration of carrot slices. J. Food Process Eng. 2014, 37, 111–121. [Google Scholar] [CrossRef]
  58. Lim, Y.J.; Eom, S.H. The different contributors to antioxidant activity in thermally dried flesh and peel of astringent persimmon fruit. Antioxidants 2022, 11, 597. [Google Scholar] [CrossRef] [PubMed]
  59. Kulapichitr, F.; Borompichaichartkul, C.; Fang, M.; Suppavorasatit, I.; Cadwallader, K.R. Effect of post-harvest drying process on chlorogenic acids, antioxidant activities and CIE-Lab color of Thai Arabica green coffee beans. Food Chem. 2022, 366, 130504. [Google Scholar] [CrossRef] [PubMed]
  60. Kim, J.H.; Lim, Y.J.; Duan, S.; Park, T.J.; Eom, S.H. Accumulation of antioxidative phenolics and carotenoids using thermal processing in different stages of Momordica charantia fruit. Molecules 2023, 28, 1500. [Google Scholar] [CrossRef]
  61. Vishwanathan, K.H.; Hebbar, H.U.; Raghavarao, K.S.M.S. Hot air assisted infrared drying of vegetables and its quality. Food Sci. Technol. Res. 2010, 16, 381–388. [Google Scholar] [CrossRef]
  62. Nalawade, S.A.; Sinha, A.; Umesh Hebbar, H. Infrared based dry blanching and hybrid drying of bitter gourd slices: Process efficiency evaluation. J. Food Process Eng. 2018, 41, 12672. [Google Scholar] [CrossRef]
  63. Kumar, C.; Joardder, M.U.H.; Farrell, T.W.; Millar, G.J.; Karim, M.A. Mathematical model for intermittent microwave convective drying of food materials. Dry. Technol. 2016, 34, 962–973. [Google Scholar] [CrossRef]
  64. Sirichai, P.; Kittibunchakul, S.; Thangsiri, S.; On-Nom, N.; Chupeerach, C.; Temviriyanukul, P.; Inthachat, W.; Nuchuchua, O.; Aursalung, A.; Sahasakul, Y.; et al. Impact of drying processes on phenolics and in vitro health-related activities of indigenous plants in Thailand. Plants 2022, 11, 294. [Google Scholar] [CrossRef] [PubMed]
  65. Kittibunchakul, S.; Temviriyanukul, P.; Chaikham, P.; Kemsawasd, V. Effects of freeze drying and convective hot-air drying on predominant bioactive compounds, antioxidant potential and safe consumption of maoberry fruits. LWT-Food Sci. Technol. 2023, 184, 114992. [Google Scholar] [CrossRef]
  66. Oancea, S. A review of the current knowledge of thermal stability of anthocyanins and approaches to their stabilization to heat. Antioxidants 2021, 10, 1337. [Google Scholar] [CrossRef]
  67. Mbondo, N.N.; Owino, W.O.; Ambuko, J.; Sila, D.N. Effect of drying methods on the retention of bioactive compounds in African eggplant. Food Sci. Nutr. 2018, 6, 814–823. [Google Scholar] [CrossRef] [PubMed]
  68. Chandra, A.; Kumar, S.; Tarafdar, A.; Nema, P.K. Ultrasonic and osmotic pre-treatments followed by convective and vacuum drying of papaya slices. J. Sci. Food Agri. 2021, 101, 2264–2272. [Google Scholar] [CrossRef] [PubMed]
  69. Kumar, Y.; Kheto, A.; Singh, L.; Sharanagat, V.S. Ultrasound pretreated hot air drying of spine gourd (Momordica dioica Roxb. Ex Willd): The effect on quality attributes. Food Chem. Adv. 2023, 2, 100167. [Google Scholar] [CrossRef]
  70. Kheto, A.; Dhua, S.; Nema, P.K.; Sharanagat, V.S. Influence of drying temperature on quality attributes of bell pepper (Capsicum annuum L.): Drying kinetics and modeling, rehydration, color, and antioxidant analysis. J. Food Proc. Eng. 2021, 44, e13880. [Google Scholar] [CrossRef]
  71. Horax, R.; Hettiarachchy, N.; Chen, P. Extraction, quantification, and antioxidant activities of phenolics from pericarp and seeds of bitter melons (Momordica charantia) harvested at three maturity stages (immature, mature, and ripe). J. Agric. Food Chem. 2010, 58, 4428–4433. [Google Scholar] [CrossRef]
  72. Yang, L.; Hu, Z.; Yang, L.; Xie, S.; Yang, M. Hot-air drying characteristics and quality evaluation of bitter melon slice. Inmateh-Agri. Eng. 2018, 55, 53–62. [Google Scholar]
  73. Kaya, A.; Aydin, O.; Kolayli, S. Effect of different drying conditions on the vitamin C (ascorbic acid) content of Hayward kiwifruits (Actinidia deliciosa Planch). Food Bioprod. Proces. 2010, 88, 165–173. [Google Scholar] [CrossRef]
  74. Demiray, E.; Tulek, Y.; Yilmaz, Y. Degradation kinetics of lycopene, β-carotene and ascorbic acid in tomatoes during hot air drying. LWT-Food Sci. Technol. 2013, 50, 172–176. [Google Scholar] [CrossRef]
  75. Mohammadi, X.; Deng, Y.; Matinfar, G.; Singh, A.; Mandal, R.; Pratap-Singh, A. Impact of three different dehydration methods on nutritional values and sensory quality of dried broccoli, oranges, and carrots. Foods 2020, 9, 1464. [Google Scholar] [CrossRef]
  76. Us, E.; Perendeci, N.A. Improvement of methane production from greenhouse residues: Optimization of thermal and H2SO4 pretreatment process by experimental design. Chem. Eng. J. 2012, 181, 120–131. [Google Scholar] [CrossRef]
  77. El-Amin, O.M.A.; Dieter, V.H.; Wolfgang, L. Drying kinetics and colour change of mango slices as affected by drying temperature and time. In Proceedings of the Tropentag International Conference, Hohenheim, Germany, 7–9 October 2008. [Google Scholar]
Figure 1. Effect of drying process combined with blanching with 2% salt solution on drying time (a), ∆E (b), TAA (c), TPC (d), and vitamin C (e).
Agriculture 13 01849 g001
Figure 2. The 3D response surface plots for the effects of independent variables (DAT, slice thickness, and blanching time) on drying time (ac), on total color change (df), and on total antioxidant capacity (gi).
Agriculture 13 01849 g002
Figure 3. The 3D response surface plots for the effects of independent variables (DAT, slice thickness, and blanching time) on TPC (ac) and on vitamin C (df).
Agriculture 13 01849 g003
Table 1. Independent variable ranges and coded levels in the CCD of the RSM.
Independent Variable Abbreviations in ModelsIndependent VariablesIndependent Variable Ranges and Coded Levels
−10+1
ADrying Air Temperature (°C) (DAT)607080
BSlice Thickness (mm) (ST)6810
CBlanching Time (min.) (BT)02.55
Table 2. Model statistics and equations for the drying time and total color change.
Drying Time (Quadratic Model)
SourceSum of SquaresDegree of FreedomMean SquareF-Valuep-Value
Model1.318 × 105914,647.23182.17<0.0001
A-Drying Air Temp.73,084.05173,084.05908.97<0.0001
B-Slice Thickness52,531.25152,531.25653.35<0.0001
C-Blanching Time1095.2011095.2013.620.0014
AB3192.2513192.2539.70<0.0001
AC676.001676.008.410.0086
BC6.2516.250.07770.7831
A236.04136.040.44820.5105
B2645.881645.888.030.0099
C29.9119.910.12330.7290
Fit Statistics
Standard deviation8.97R20.9874
Mean254.42Adjusted R20.9819
Coefficient of variation3.52Predicted R20.9741
Adequate precision46.7721
Model Equation in Terms of Actual Factors
Drying Time = −171.00583 + 2.63510 × A + 119.88956 × B − 19.05709 × C − 0.706250 × A × B + 0.260000 × A × C − 0.125000 × B × C − 0.026286 × A2 − 2.78216 × B2 − 0.220583 × C2
Total Color Change (Quadratic Model)
SourceSum of squaresDegree of freedomMean SquareF-valuep-value
Model15.5291.7213.37<0.0001
A-Drying Air Temp5.9915.9946.44<0.0001
B-Slice Thickness0.295710.29572.290.1448
C-Blanching Time2.2912.2917.730.0004
AB0.526710.52674.090.0562
AC1.9111.9114.850.0009
BC0.117810.11780.91390.3500
A22.9512.9522.92<0.0001
B20.871710.87176.760.0167
C20.378410.37842.940.1014
Fit Statistics
Standard deviation0.3590R20.8514
Mean3.99Adjusted R20.7878
Coefficient of variation8.99Predicted R20.6968
Adequate precision10.5381
Model Equation in Terms of Actual Factors
Sqrt (Total Color Change) = −19.23690 + 0.960941 × A − 2.37403 × B + 1.18195 × C + 0.009071 × A × B − 0.013836 × A × C + 0.017161B × C − 0.007526 × A2 + 0.102208 × B2 − 0.043096 × C2
Table 3. Model statistics and equations for TAA, TPC, and vitamin C.
Total Antioxidant Activity (Reduced 2FI Model)
SourceSum of SquaresDegree of FreedomMean SquareF-Valuep-Value
Model1.678 × 105533,554.417.320.0002
A-Drying Air Temp.1.063 × 10511.063 × 10523.20<0.0001
B-Slice Thickness5498.2315498.231.200.2838
C-Blanching Time10,332.95110,332.952.250.1458
AB19,104.32119,104.324.170.0519
AC26,499.72126,499.725.780.0239
Fit Statistics
Standard deviation67.70R20.5942
Mean323.3Adjusted R20.5130
Coefficient of variation20.94Predicted R20.4427
Adequate precision9.9493
Model Equation in Terms of Actual Factors
Total Antioxidant Activity = +323.30 − 72.92 × A + 16.58 × B + 22.73 × C − 34.55 × A × B − 40.70 × A × C
Total Phenolic Content (Reduced Quadratic Model)
SourceSum of squaresDegree of freedomMean SquareF-valuep-value
Model6.873 × 10661.145 × 10611.18<0.0001
A-Drying Air Temp4.901 × 10514.901 × 1054.780.0387
B-Slice Thickness3.801 × 10513.801 × 1053.710.0660
C-Blanching Time60,247.39160,247.390.58810.4506
AB1.151 × 10611.151 × 10611.240.0027
AC3.786 × 10613.786 × 10636.95<0.0001
C21.005 × 10611.005 × 1069.810.0045
Fit Statistics
Standard deviation320.08R20.7365
Mean3558.69Adjusted R20.6706
Coefficient of variation8.99Predicted R20.5866
Adequate precision11.9818
Model Equation in Terms of Actual Factors
Total Phenolic Content = +3315.86 − 156.54 × A + 137.86 × B − 54.89 × C − 268.23 × A × B − 486.44 × A × C + 376.38 × C2
Vitamin C (Quadratic Model)
SourceSum of squaresDegree of freedomMean SquareF-valuep-value
Model2.409 × 10792.677 × 10610.32<0.0001
A-Drying Air Temp.1.139 × 10711.139 × 10743.90<0.0001
B-Slice Thickness3.753 × 10513.753 × 1051.450.2424
C-Blanching Time6.672 × 10516.672 × 1052.570.1237
AB5.891 × 10515.891 × 1052.270.1467
AC2.334 × 10512.334 × 1050.89980.3536
BC4.775 × 10514.775 × 1051.840.1893
A21.016 × 10711.016 × 10739.16<0.0001
B21.185 × 10611.185 × 1064.570.0445
C21.659 × 10611.659 × 1066.400.0195
Fit Statistics
Standard deviation509.32R20.8156
Mean1795.82Adjusted R20.7366
Coefficient of variation28.36Predicted R20.5999
Adequate precision10.7624
Model Equation in Terms of Actual Factors
Vitamin C = +2024.82 − 754.56 × A + 136.99 × B − 182.65 × C − 191.88 × A × B − 120.78 × A × C − 172.75 × B × C − 1395.62 × A2 + 476.62 × B2 + 564.06 × C2
Disclaimer/Publisher’s Note: The statements, opinions and data contained in all publications are solely those of the individual author(s) and contributor(s) and not of MDPI and/or the editor(s). MDPI and/or the editor(s) disclaim responsibility for any injury to people or property resulting from any ideas, methods, instructions or products referred to in the content.

