Article

Study on Vibration Characteristics of Paddy Power Chassis under Different Driving Conditions

1
Key Laboratory of Key Technology on Agricultural Machine and Equipment, Ministry of Education, South China Agricultural University, Guangzhou 510642, China
2
College of Engineering, South China Agricultural University, Guangzhou 510642, China
*
Author to whom correspondence should be addressed.
Agriculture 2023, 13(9), 1842; https://doi.org/10.3390/agriculture13091842
Submission received: 3 September 2023 / Revised: 14 September 2023 / Accepted: 18 September 2023 / Published: 20 September 2023
(This article belongs to the Special Issue Agricultural Automation in Smart Farming)

Abstract

:
To elucidate the vibrational characteristics of power chassis in paddy fields, we examined the Yanmar VPG6G rice transplanter across diverse terrains, including paddy fields, dry land, and concrete roads. Vibrational acceleration measurements, taken in longitudinal, transverse, and vertical orientations at key chassis locations, revealed noteworthy findings. The Mizuta power chassis exhibited its lowest root-mean-square (RMS) vibrational acceleration on concrete, while the highest was observed on paddy fields. The acceleration power spectra predominantly peaked between 1~14 Hz, with peak values amplifying as speed increased. Additionally, pendant orientation frequencies exceeded those of longitudinal and lateral directions. Both front and rear wheels mirrored the vibrational accelerations of the rear axle, but dynamic load coefficients for the front wheels consistently surpassed the rear, particularly at elevated speeds. This research not only enhances our understanding of terrain-induced vibrations and the intricate dynamics between terrain and tires but also lays the groundwork for designing optimized vibration-damping solutions tailored to prevalent road conditions.

1. Introduction

In recent advancements within agricultural mechanization, the paddy power chassis has become fundamental to the modernization of rice farming. Most current designs predominantly employ rigid connections between components. Such designs not only reduce operational efficiency and transportation convenience but also pose tangible threats to the operator’s health, both physically and psychologically. Scarlett et al. [1] highlighted that these configurations lead to significant whole-body vibrations in tractors, corroborated by Torén et al. [2] who found a relationship between tractor driving hours and the reporting of lower back and hip symptoms. Langer et al. [3] and Zhu et al. [4] further assessed the impact of these vibrations in different tractor operations, emphasizing the risks associated with varied terrains and the influence of equipment. In terms of soil health, Soane and Ouwerkerk [5] discussed the detrimental effects of soil compaction in crop production, with findings by Abu-Hamdeh et al. [6] indicating how tire dynamics and inflation pressures can adversely impact soil physical properties. Collectively, these studies underscore the necessity for innovations in chassis design to ensure operator safety and soil health [7,8,9,10]. Enhancing the vibration performance of the chassis can significantly boost the effectiveness of agricultural mechanization. Minimizing chassis vibrations is critical for safeguarding the operator’s health, conserving soil structure, and optimizing crop growth and yield. Consequently, the exploration of vibration reduction technologies for the paddy power chassis is of paramount significance.
The primary role of the paddy power chassis is to interface with rice seeding apparatuses during sowing operations. Its vibration characteristics exhibit unique patterns, governed by its structural configuration, operational environment, and working conditions. A profound understanding of these dynamics can provide a robust basis for the design of vibration dampeners for the paddy power chassis. Domestic paddy-powered chassis are confronted with significant technical challenges, encompassing issues related to low transmission efficiency, elevated machine energy consumption, and suboptimal field passability. These challenges have assumed a prominent role in constraining the progress of rice direct seeding technology. A comprehensive grasp of the underlying vibration principles in this context holds the potential to furnish a robust foundation for the design of vibration mitigation strategies in paddy power chassis. Furthermore, it offers essential empirical data to underpin the exploration of the intricate dynamics governing the interactions between rice seeding machinery and diverse road surfaces. This understanding is pivotal for advancing the field of rice direct seeding technology. Servadio et al. [11] investigated the vibration patterns of the paddy power chassis at elevated speeds, facilitated by the integration of front axle, cab, and seat suspensions in a four-wheel drive configuration. Hildebrand et al. [12] explored the vibrations experienced by vehicles traversing uneven dry and soft terrains. Their work included an analysis of vehicle vibration characteristics and the development of a model to assess vibration-induced soil compaction in the vehicle–soil interplay. Chengjian et al. [13] delved into the vibration attributes of a tractor fitted with an electro-hydraulic suspension during transit, combining theoretical and empirical methods to assess active vibration damping controls. Kumar et al. [14] conducted empirical evaluations on rice terrains to gauge the vibration responses of the paddy power chassis across diverse soil conditions, providing invaluable insights for chassis design and operation. Zhu Sihong et al. [10] employed simulation and empirical methods to dissect the vibration attributes of a paddy-powered chassis under typical paddy field conditions. In summary, the pivotal investigations mentioned have markedly enhanced our comprehension of vehicle vibrations within agricultural settings. Nevertheless, it is imperative to acknowledge that a majority of these studies have predominantly adopted a theoretical or simulation-based experimental approach, necessitating the imperative validation of their findings via practical tests. Acknowledging these constraints becomes indispensable in the endeavor to fortify and perpetuate the advancement of efficacious strategies aimed at ameliorating vehicle-induced vibrations in agricultural contexts.
Current scholarship, both nationally and internationally, on the vibration dynamics of agricultural machinery is heavily skewed towards tractors. Notably, there exists a research void concerning the vibration dynamics of the paddy power chassis on authentic agricultural terrains. This paper zeroes in on the power chassis of the Yanmar VPG6G rice transplanter and employs the self-engineered 2BDXZ-10CP (20) rice hole direct seeding machine from South China Agricultural University. Our investigation traverses the vibration characteristics of the paddy power chassis across diverse terrains, encompassing paddy fields, dry land, and paved roads. The overarching aim is to establish a robust foundation for subsequent paddy power chassis designs. By probing the vibration dynamics of the paddy power chassis across varied terrains, we aim to offer a theoretical scaffold for crafting a vibration damper tailored to the genuine operational conditions of the paddy power chassis.
In the current study, our research methodology is centered on signal processing techniques, with a primary emphasis on Fourier analysis. The acquired signals undergo Fourier transformation, transitioning from the time domain to the frequency domain. This transformation facilitates the extraction of critical information regarding acceleration signals. Consequently, we obtain the acceleration power spectral density across various directional components, providing comprehensive insights into the dynamics under examination [15].

2. Materials and Methods

2.1. Test Equipment

In this experiment, the VPG6G power chassis from the Japanese company Yanmar (Osaka, Japan) was used for rice transplanting, alongside a 2BDXZ-10CP (20) direct seeder for rice holes developed by South China Agricultural University (Guangzhou, China). The associated parameters were obtained through measurements, experiments, and calculations [16,17,18,19,20,21,22], as indicated in Table 1.
The vibration testing system utilizes the MCC DAQ data acquisition system, with the hardware being the USB-1608G multifunctional data acquisition instrument. A vibration test was conducted on the dynamic chassis of Yanmar VPG6G rice transplanter using CT1010LC piezoelectric single-axis acceleration sensor and CT1010SLFP piezoelectric tri-axial acceleration sensor from Shanghai CHENGTEC (Shanghai, China), which is attached to the 2BDXZ-10CP (20) rice precision hole seeder. The key performance parameters of the testing equipment are displayed in Table 2.

2.2. Test Conditions and Methods

The vibration characteristic test took place in July 2023 at Qilinbei Teaching and Research Base of South China Agricultural University in Guangzhou City, Guangdong Province. Three typical working pavements were selected for the vibration test, with different properties including paddy fields, dry land, and field concrete paving roads. The test field’s soil type is clay loam and the vibration test site is depicted in Figure 1, while Table 3 shows the parameters related to the field’s characteristics.
In this study, we meticulously analyzed the vibration characteristics of a power chassis equipped with a rice precision hole seeding machine under varied road conditions and driving speeds. Our primary objective was to juxtapose the vibrational fluctuations of the power chassis across three distinct road conditions at a consistent speed, as well as to discern the vibrational alterations under uniform road conditions at divergent speeds [23,24,25]. Our analysis encompasses the vibration dynamics of the power chassis associated with a rice precision hole seeder, subjected to multiple operational speeds and terrain conditions. Prior to executing the vibration analysis, the hydraulic system of the power chassis was calibrated to establish the lifting height of the attached rice precision hole seeder at 410 mm. Additionally, the power chassis was configured to an interpolated gear setting in the forward position. Driving speed was modulated using a hand throttle, with test speeds delineated as follows: 0 m·s−1 (unloaded), 0.31 m·s−1, 0.61 m·s−1, 0.83 m·s−1, 1.13 m·s−1, and 1.27 m·s−1. A detailed outline of the testing protocol is provided in Table 4.
Prior to the experimental phase, the power chassis was configured to the interpolated gear position. An acceleration sensor was affixed to the support of the driver’s seat within the power chassis. This sensor’s X, Y, and Z channels aligned with the longitudinal, vertical, and transverse orientations of the joint broadcasting machine, respectively. Furthermore, three single-axis acceleration sensors were vertically oriented on the engine base of the power chassis. It should be noted that all technical abbreviations will be elucidated upon their initial usage. These single-axis accelerometers were strategically placed at the engine base, front wheel, and rear wheel sections of the powertrain; their precise locations are illustrated in Figure 2. Throughout the testing process, the MCC DAQ data acquisition system was set to enable continuous sampling at a frequency of 2 kHz (equating to a sampling time interval of 0.5 ms). For each testing category, three vibration signals were recorded, from which the most representative dataset was chosen for further analysis.

2.3. Methods of Analysis

The ride smoothness of the paddy power chassis was assessed through the analysis of the root-mean-square (RMS) value of acceleration, the acceleration power spectral density, and the dynamic load coefficients of both the front and rear wheels during each phase of the chassis vibration [26,27,28,29,30]. To gauge the vibration intensity in every direction, Equation (1) was employed to compute the RMS value of acceleration:
a ω = 1 T 0 T a ω 2 t d t 1 2
where a ω t is the real-time acceleration value, m·s−2; a ω is the RMS value of acceleration, m·s−2; T is the time of the test, s.
There exists a correlation between the vibration acceleration in the three axial directions at the seat position of the paddy power chassis. To assess the overall impact of the vibration, the weighted acceleration root-mean-square (RMS) value was computed at the seat position of the paddy power chassis through Equation (2).
a = γ a x w 2 + γ a y w 2 + γ a z w 2 1 2
where a x w is the RMS value of the longitudinal vibration acceleration; a y w is the RMS value of transverse vibration acceleration; a z w is the RMS value of the vertical vibration acceleration; γ is the acceleration weighting factor.
The coefficient, denoted as ‘ γ ’, represents the ratio of the vertical vibration curve to the horizontal vibration curve within the most sensitive frequency range for the human body. This relationship underscores that the human body exhibits greater sensitivity and reduced tolerance to horizontal vibrations in comparison to vertical vibrations. For the purpose of computing the root-mean-square (RMS) value of acceleration, distinct coefficients were attributed to respective axes. Specifically, the coefficients for the X-axis (longitudinal) and Y-axis (lateral) were designated as γ = 1.4. Conversely, the Z-axis (vertical) was characterized by a coefficient of γ = 1. When evaluating all three axes in unison—X (longitudinal), Y (lateral), and Z (vertical)—a consistent coefficient of γ = 1 was employed for each. To analyze this, the vibration acceleration signals gathered from various sections of the paddy power chassis were subjected to a Fourier transform. This procedure transforms the acceleration signals from the time domain into the frequency domain, facilitating the acquisition of the power spectral density of accelerations across different orientations.
This method is based on Newton’s second law and the equilibrium of the transverse force system, shown in Figure 3b.
The method employed to determine the horizontal projection of the center of mass for the paddy power chassis is demonstrated in Figure 3a. According to Figure 3 and Equation (3), the dynamic load coefficient and the RMS value of the dynamic load can be computed for the rear and front wheels of the paddy-powered chassis, respectively:
σ Ff = i = 1 N j b φ ¨ b m z ¨ b l b r 2 l 2 N 1 σ Fr = i = 1 N j b φ ¨ b m z ¨ b l b f 2 l 2 N 1 D f = i = 1 N j b φ ¨ b m z ¨ b l b r 2 l 2 N 1 t i l m g l b r D r = i = 1 N j b φ ¨ b m z ¨ b l b f 2 l 2 N 1 t i l m g l b f
where σ Ff is the RMS value of the dynamic load on the front wheels; σ Fr is the RMS value of the dynamic load on the rear wheels; D f is the front wheel dynamic load factor; D r is the rear wheel dynamic load factor; m is the mass of the power chassis after mounting the live machine, kg; Ox is the lateral distance from the center of mass of the fuselage, mm; lbf is the horizontal distance from the center of mass of the fuselage to the axis of the front wheels, m; lbr is the horizontal distance from the center of mass of the fuselage to the axis of the rear wheels, m; l is the wheelbase of the rear wheels, m; L is the wheelbase between the front and rear wheels, m; jb is the fuselage pitching moment of inertia, kg·m2; φ b is the body center of mass pitch angle displacement, m; Zb is the vertical displacement of the body center of mass, m; ti is the instantaneous time; N is the total number of sampling points; g is the acceleration of gravity, take 9.8 m·s−2.

3. Test Results and Analysis

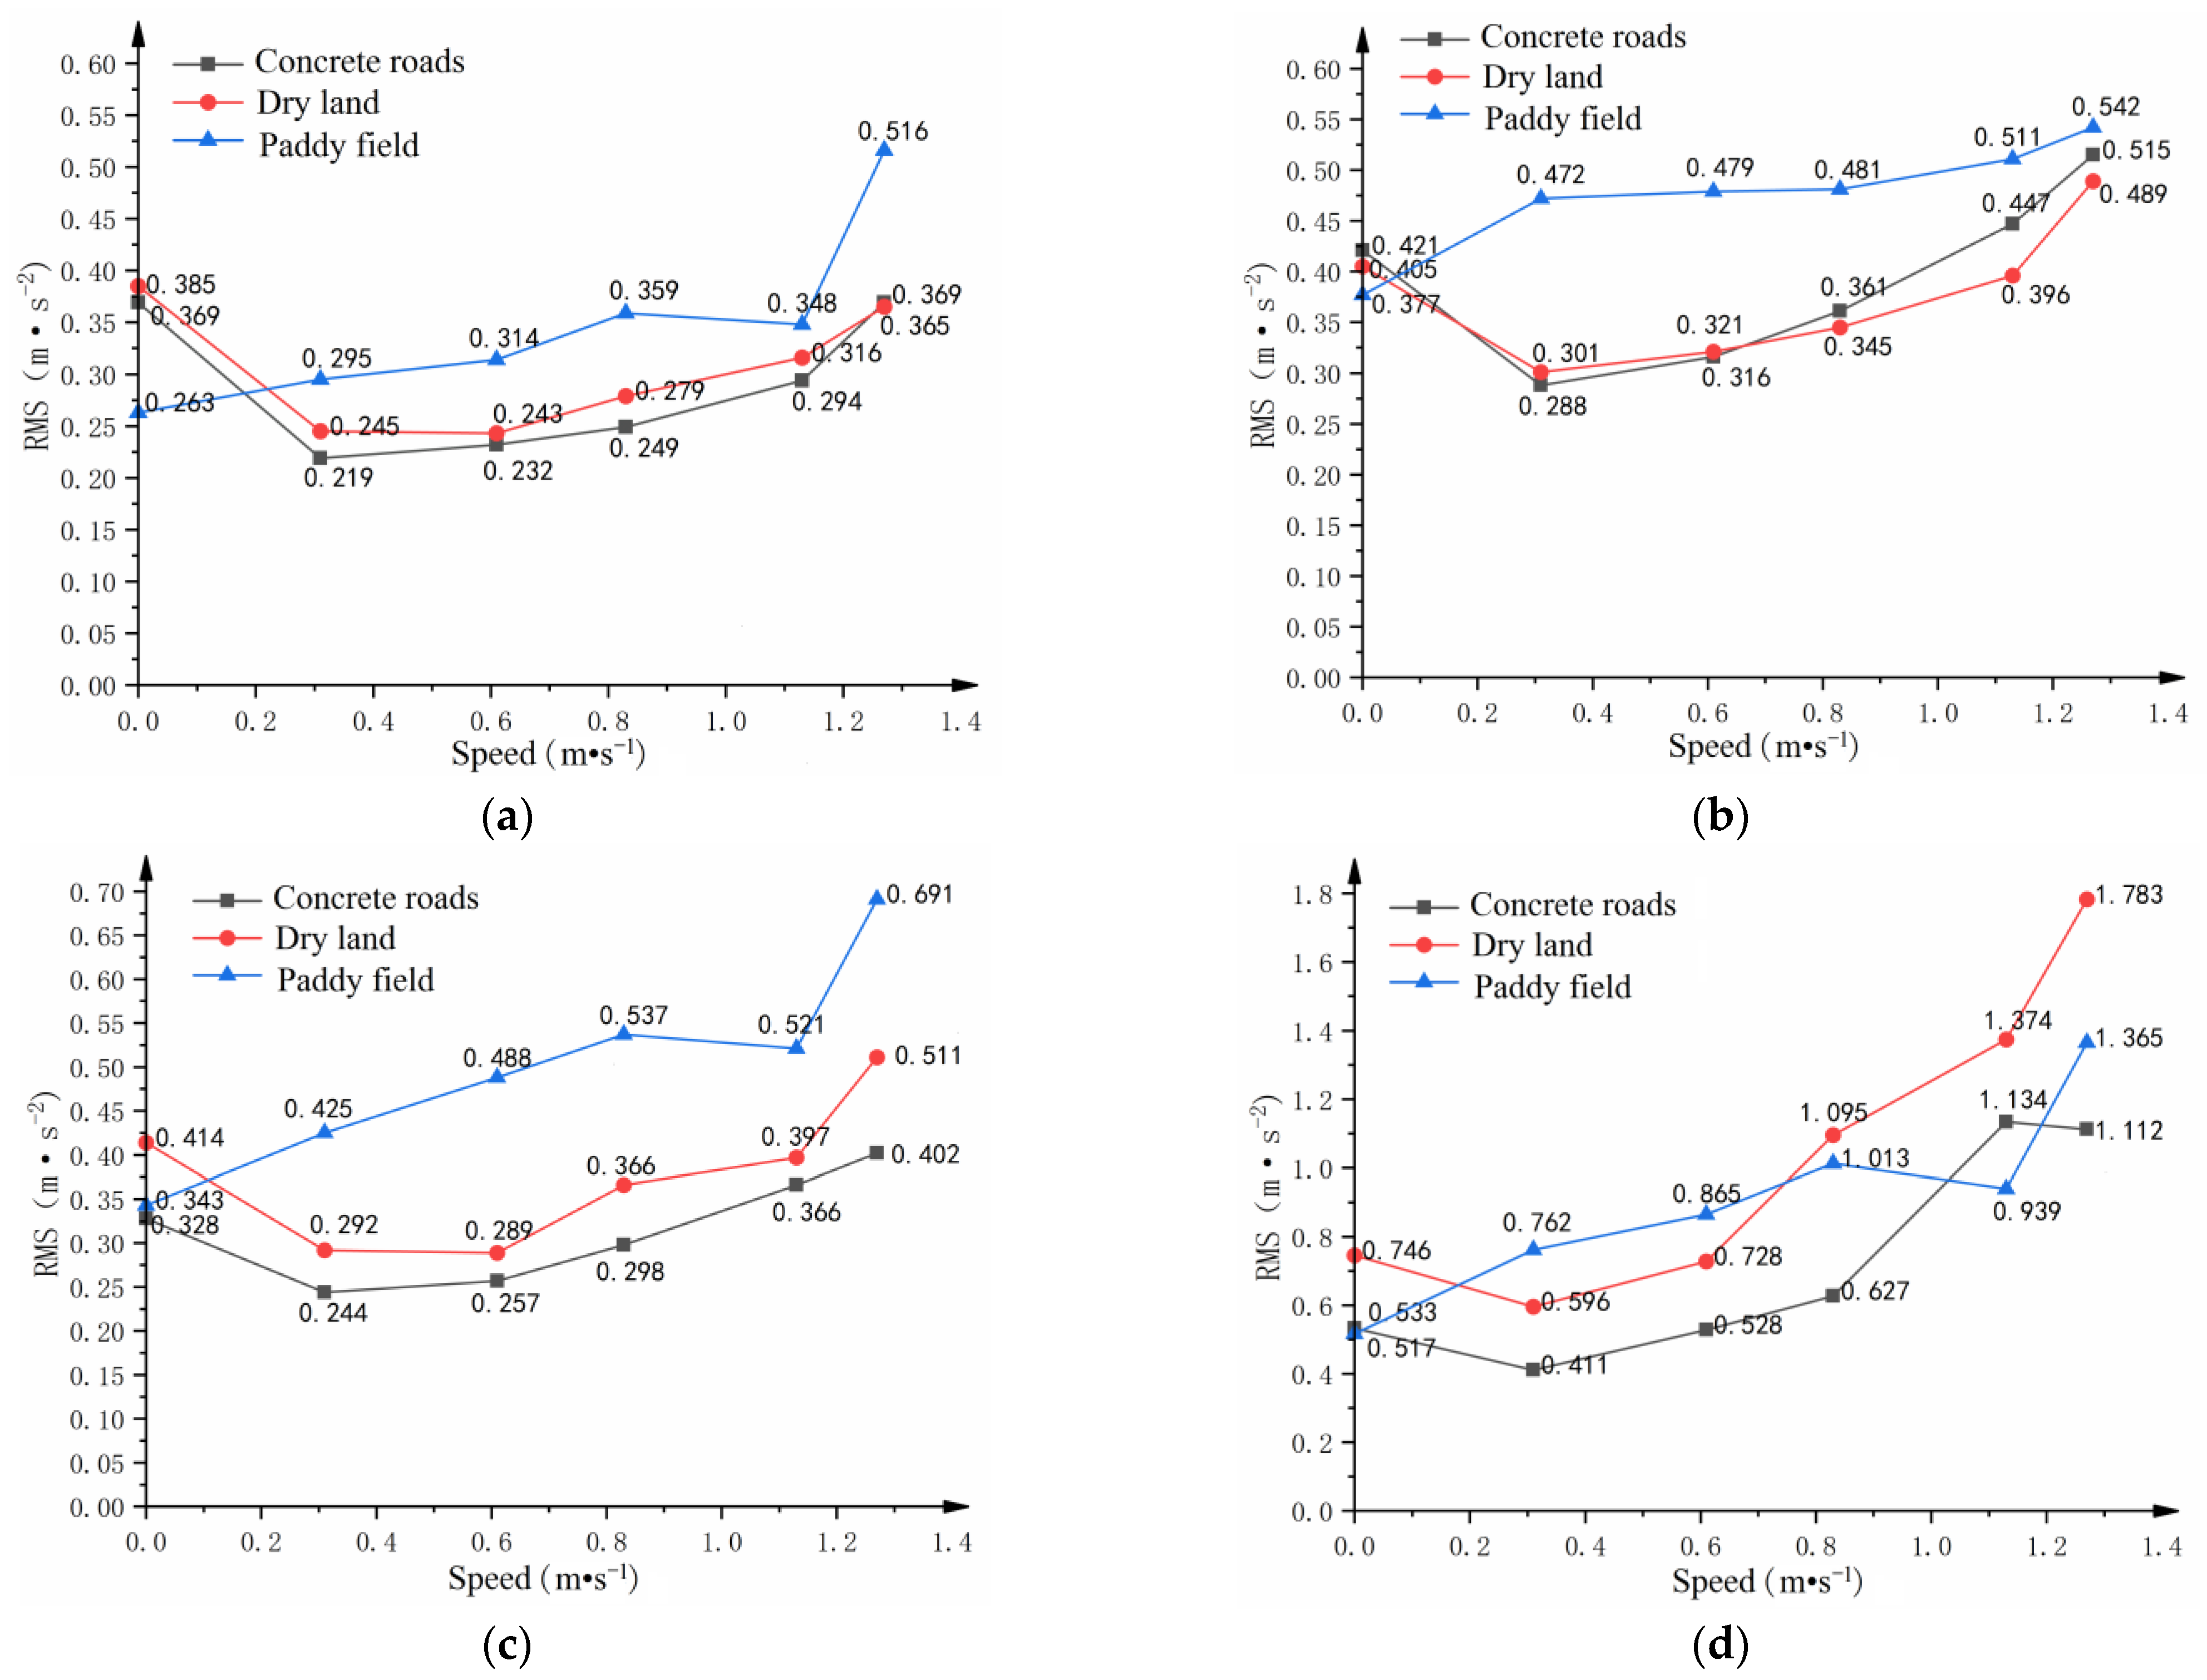
3.1. Vibration Acceleration

The vibration test results for the chassis powered for paddy operations and equipped with a rice precision hole seeder, operating at varied speeds across paddy fields, dry land, and concrete roads, are illustrated in Figure 4 and Figure 5, respectively.
For the front axle of the paddy chassis, the root-mean-square (RMS) value of vibration acceleration exhibits an almost linear trend when the chassis moves on a concrete road. Conversely, on a paddy field or dry land, the RMS value escalates sharply with increasing speed, with the most pronounced surge being 69.2%. It is pertinent to clarify technical abbreviations like “RMS” upon their initial mention. The vibration acceleration RMS value at the rear axle of the paddy-powered chassis shows a near-linear relationship with speed, progressively intensifying with greater velocity. For instance, at a speed of 0.83 m·s−1, the RMS value at the rear axle is roughly twice that observed at 0.31 m·s−1. Under the specified conditions, the RMS value on the front axle can surge to a magnitude 2.5 times greater than that of the rear axle. This disparity between the front and rear axles might be attributed to load distribution differences; the front axle of the Mizutaki chassis endures a load nearly double that of the rear. Elevated vibration acceleration in the front axle can negatively impact component longevity, steering efficacy, and soil integrity. As a potential solution, repositioning the engine of the current paddy-powered chassis from the front to a central location might be considered to mitigate the vibration acceleration experienced by the front axle.
The root-mean-square (RMS) values pertaining to vertical, longitudinal, and lateral accelerations at the seat position of the paddy power chassis showed a distinct linear relationship with increasing travel speed. Specifically, the vertical acceleration RMS value experienced the most pronounced rise, at 25.1%. In paddy fields, the maximum RMS value for vertical acceleration was 1.6 times higher than in dry lands. In contrast, the RMS values for longitudinal acceleration remained fairly consistent across various speeds and were notably lower than those of vertical acceleration. On both dry land and concrete paved roads, the RMS values for lateral acceleration displayed a subtle change, surging by 28.7% when the driving speed ranged from 1.13 m·s−1 to 1.27 m·s−1 on dry land. Interestingly, lateral acceleration RMS values were more variable in paddy fields than on concrete roads, with the peak RMS value in paddy fields being 1.8 times that on roads. Moreover, in paddy fields, the lateral acceleration RMS value rose by 32.6% when the speed increased from 1.13 m·s−1 to 1.27 m·s−1. At idle speed, the RMS values for all three types of acceleration at the seat position remained relatively elevated. The greatest weighted acceleration RMS values, when the speed ranged from 0.31 m·s−1 to 0.61 m·s−1, were observed on paddy fields, followed by dry land, with the lowest on concrete roads. The RMS value of the weighted acceleration for the paddy power chassis was about 1.8 times higher in paddy field conditions compared to concrete roads. The change in the weighted acceleration RMS was more marked when the speed increased from 0.83 m·s−1 to 1.27 m·s−1 than from 0.31 m·s−1 to 0.61 m·s−1, reaching a peak growth of 45.3%. According to the international standard ISO-2631-1:1997, there is a threshold of acceleration beyond which humans may feel discomfort. This standard specifies that a weighted acceleration RMS value over 0.5 m·s−2 may induce a “relatively uncomfortable” experience, whereas exceeding 0.8 m·s−2 can cause distinct discomfort. During testing, the RMS values of weighted acceleration at the seating position exceeded the discomfort threshold while the chassis idled. Furthermore, at a speed of 0.83 m·s−1, the weighted acceleration RMS values in both dry and paddy field conditions surpassed the value associated with human discomfort, potentially jeopardizing the driver’s physical and psychological well-being.
From the experimental data, it is evident that under identical conditions, the engine of the paddy chassis exhibits the most significant cylinder combustion work on paddy field road conditions, followed by dry land, with the least on concretepaved roads. This suggests varying resistances encountered by the paddy chassis across different terrains. Notably, the weighted acceleration RMS value at the seat position, in certain instances, surpasses that at the engine position. This indicates that vibrations originating from the engine do not undergo sufficient damping before reaching the seat, highlighting a potential area for optimization in the suspension damping of the paddy chassis. Furthermore, the vibration intensity of the paddy chassis is highest in paddy field conditions, intermediate on dry land, and least pronounced on concrete roads. This variation can be attributed to the differing mechanical properties of the soil and its interaction with the chassis tires. Such insights can serve as foundational data for future studies examining road unevenness and the mechanical characteristics of various farmlands.

3.2. Frequency Domain Analysis

Utilizing the Fourier transform to analyze the acceleration signal, the peaks of the acceleration power spectrum and their associated vibration frequencies were determined for each test segment of the paddy power chassis, as detailed in Table 5. The acceleration power spectral density delineates the correlation between the acceleration power and the frequency domain, with the peak signifying the maximum value within this domain. Multiple factors influence the acceleration power spectrum, including road surface irregularities and travel speed. Table 5 indicates that the Mizuta power chassis engine possesses the highest peak frequency, consistently registering around 130 Hz and 260 Hz across the three road conditions with varied speeds. During idling across these conditions, vibration frequencies were consistent at approximately 13 Hz. The front and rear axles exhibited moderate peak frequencies, averaging 10.1 Hz and 6.54 Hz, respectively. Notably, the front axle’s vibration frequency was markedly higher in the paddy field condition compared to other terrains. Conversely, the rear axle vibrated more on dry land. As the chassis traveled at 0.61 m·s−1 and 1.27 m·s−1 on concrete roads, front axle vibration frequency peaks diminished, whereas the rear axle displayed a more pronounced relationship with wave peaks. Seat vibrations, both longitudinally and transversely, averaged around 4.79 Hz and 4.73 Hz, respectively. However, the droop direction of the seat recorded a higher average of 5.87 Hz. This suggests the intrinsic frequency in the droop direction surpasses that in other directions. When engineering the hydrodynamic chassis suspension, these frequency ranges should be judiciously considered to circumvent resonance scenarios.
Upon closer examination of Table 5, it is evident that, excluding the engine, the vibration frequencies of the paddy-powered chassis components under various farmland road conditions consistently fall below 14 Hz. Specifically, peak frequencies for concrete paved roads predominantly lie between 2 Hz and 8.5 Hz, dry land road conditions range from 2.5 Hz to 9.8 Hz, and paddy field conditions span from 2.3 Hz to 8.5 Hz. Interestingly, the peak acceleration of the paddy-powered chassis across these terrains exhibits an initial decline followed by an increase. The decreasing trend is observed at speeds from 0 m·s−1 (idling) to 0.31 m·s−1, while the increasing phase is noted between 0.61 m·s−1 and 1.27 m·s−1.
Three-dimensional spectrograms depicting the paddy chassis components under diverse farmland road conditions are illustrated in Figure 6, Figure 7 and Figure 8. These figures highlight the dominance of the power spectral distribution density stemming from the engine’s mixture combustion excitation frequency. The second most pronounced density arises from the excitation frequency due to road conditions. Notably, the vibrational data distribution for concrete paved roads, dry lands, and paddy fields differ considerably in terms of frequency and peak distribution at various speeds. For instance, the seat exhibits a notably higher peak distribution at speeds of 0 m·s−1 (idle) and 1.27 m·s−1 compared to other speed scenarios. Power spectral density peaks at the front axle and seat positions exhibit marked variations across different operational conditions. Conversely, the frequency distribution at the rear axle position diverges distinctly in the paddy field condition compared to concrete paved roads and dry lands. An analysis of the primary vibrational frequency distribution at different speeds indicates that the peak value of the acceleration power spectrum tends to augment with increasing driving speed. Additionally, the principal factors influencing frequency distribution appear to be the engine speed of the paddy power chassis and the road-induced excitation on the front axle.
The characteristics of the specific distribution of peaks at each measurement point of the Suita Power chassis under different road conditions and vehicle speeds are shown in Figure 9. Under the three road conditions, the peak distribution of the engine is relatively narrow, with the peaks mainly concentrated near 0.35 m·s−2 and the median of the peaks is close to 0.35 m·s−2; the distribution of the peaks of the seat longitudinal and seat vertical is relatively concentrated, with the median close to 0.2 m·s−2, while the distribution of the seat transverse is relatively wide, with the median close to 0.2 m·s−2. 0.2 m·s−2, while the distribution of the seat transverse peaks is relatively broad, with a median slightly higher than 0.2 m·s−2. Under the concrete paved road conditions, the distribution of the front and rear axle peaks shows several peaks, with the median of the peaks all slightly higher than 0.2 m·s−2. Under dry road conditions, the wave distributions of the front and rear axles show two large peaks. This means that there are two different levels of peaks in this operating environment, with the median of the peaks slightly above 0.2 m·s−2. In the paddy field road condition, the wave distributions of both the front and rear axles show a wider range with several peaks, with the median of the wave peaks on the front axle slightly below 0.2 m·s−2 and the median of the wave peaks on the rear axle slightly above 0.2 m·s−2.

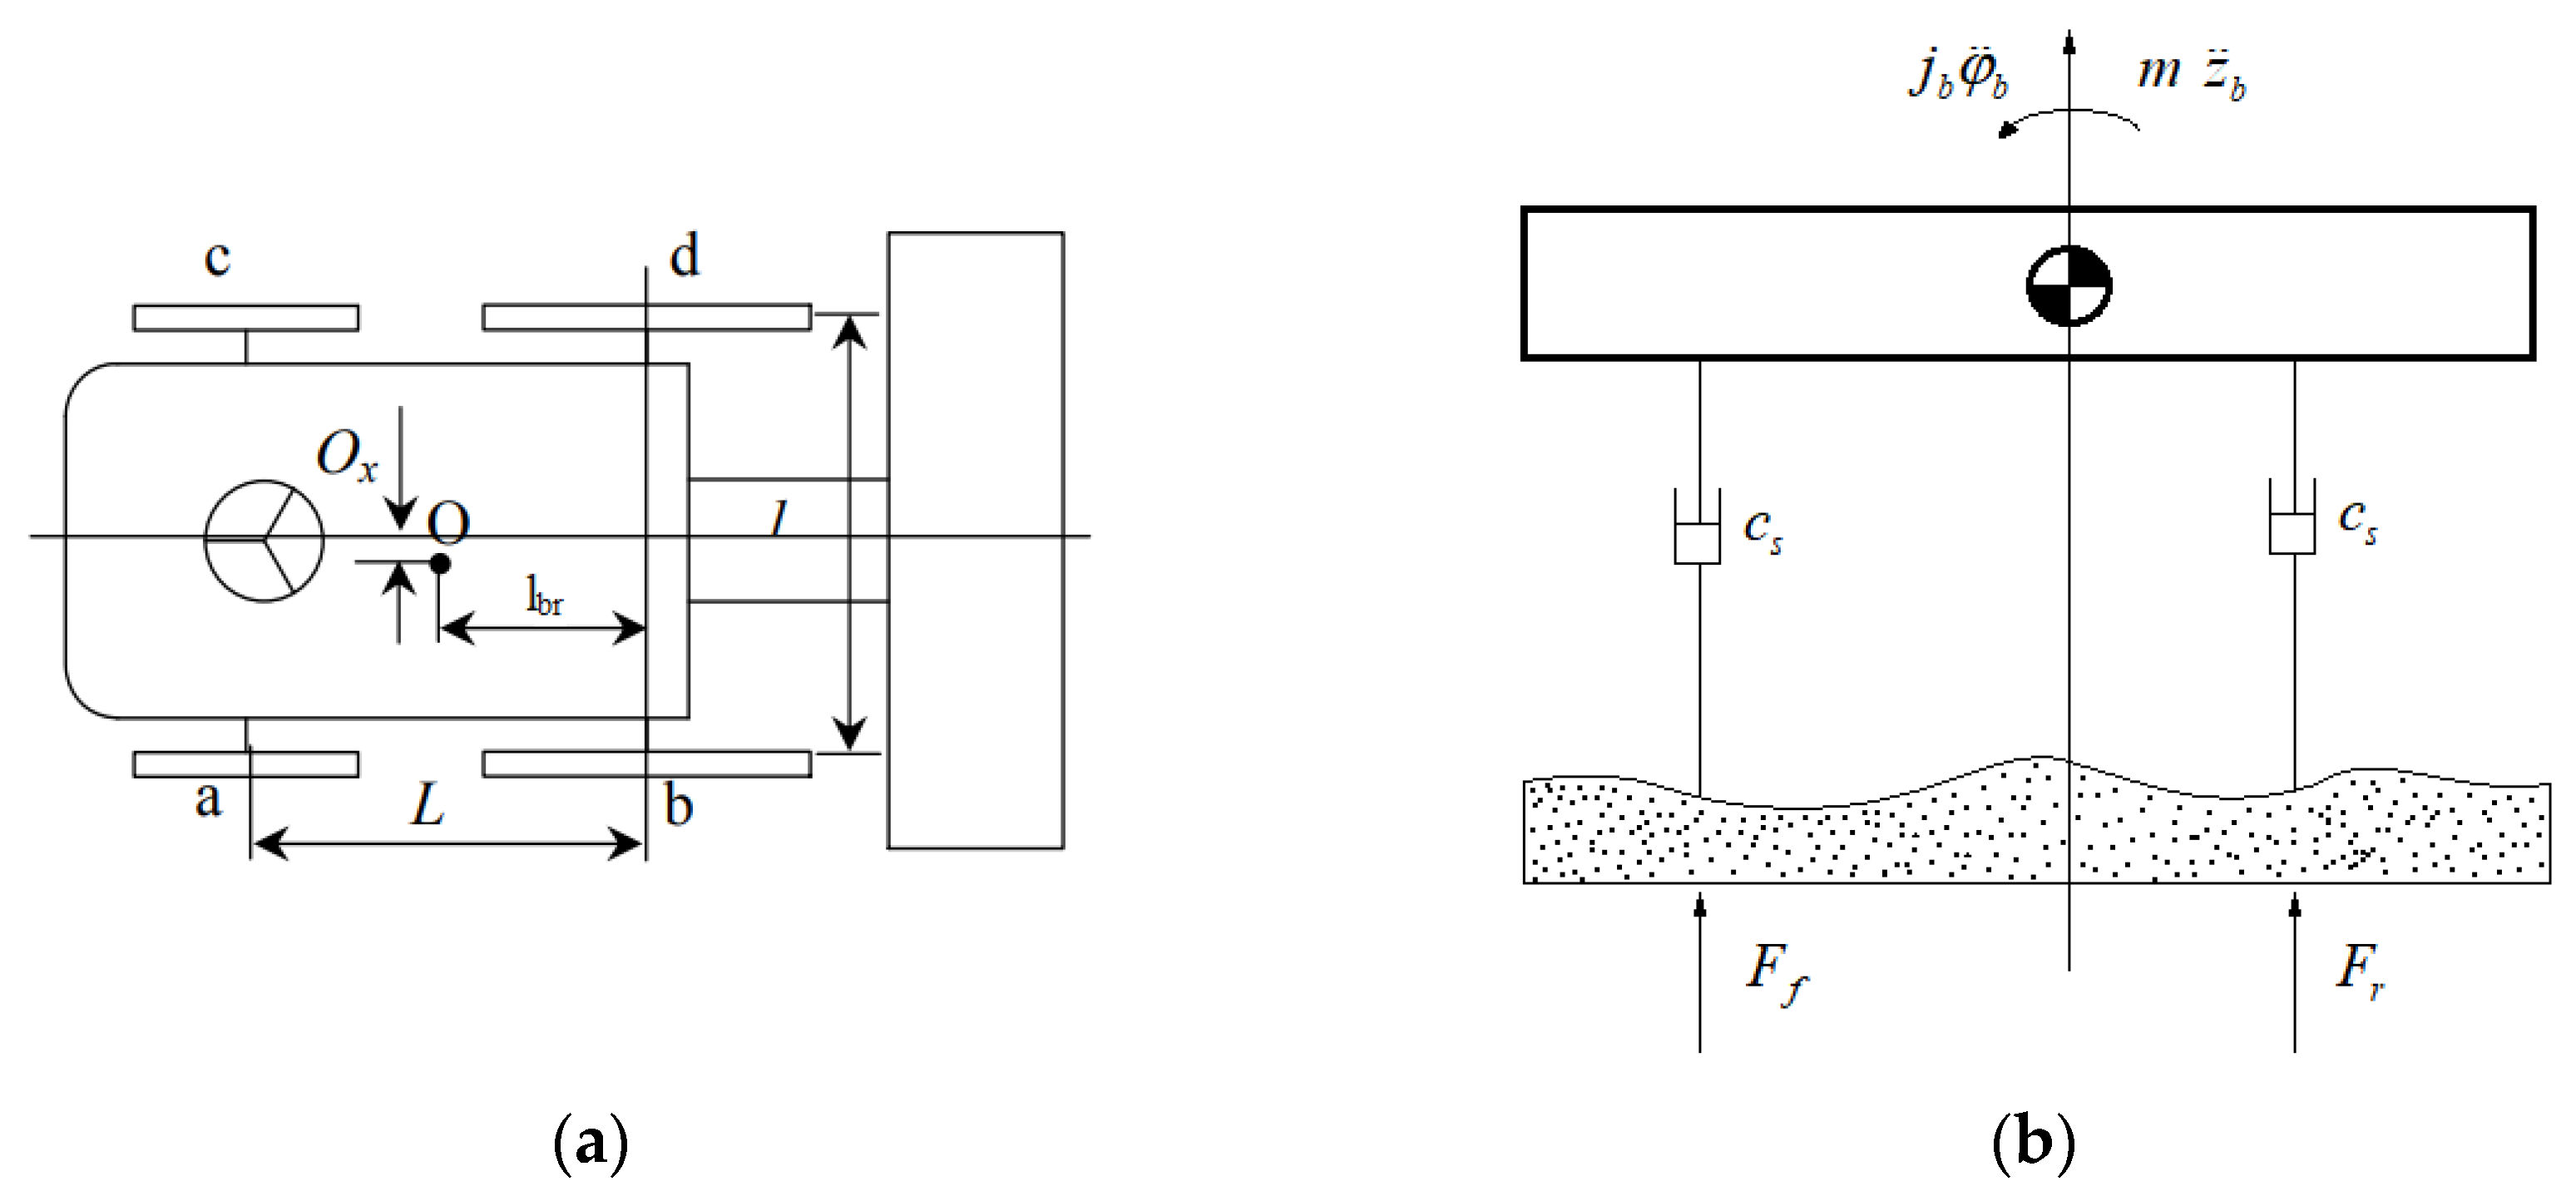
3.3. Front and Rear Dynamic Load Analysis

Figure 10 depicts the dynamic load coefficient distribution for the front and rear wheels of the Mizuta power chassis under various road conditions. Analysis of this figure indicates that, within the speed range of 0.31 m·s−1 to 0.83 m·s−1 for the paddy-powered chassis, the growth rate for the front wheels surpasses that of the rear wheels. However, when the speed extends from 1.13 m·s−1 to 1.27 m·s−1, the rear wheels’ growth rate either parallels or exceeds that of the front wheels. Under paddy field road conditions, the front wheels’ dynamic load factor consistently rises as the chassis speed varies from 0.31 m·s−1 to 1.27 m·s−1, with a noticeable deceleration in this ascent between 0.61 m·s−1 and 0.83 m·s−1. Meanwhile, the rear wheels’ dynamic load factor amplifies from 0.31 m·s−1 to 0.61 m·s−1, experiences a minor decline between 0.61 m·s−1 and 0.83 m·s−1, and then resumes its increment. These observations underscore the differential impact of road conditions on the dynamic load coefficients of paddy-powered chassis tires. Specifically, roads in dry land or paddy fields may intensify the vehicle’s shock and vibration, thereby elevating the dynamic load factor. In contrast, smoother concrete paved roads tend to mitigate this factor. On concrete roads, both wheel sets exhibit an ascending dynamic load factor trend with speed, with the front wheels consistently registering higher values than the rear. Under dry road conditions, the dynamic load factors for both wheel sets ascend with speed, albeit at disparate rates.

4. Conclusions

(1)
As the traveling speed of the paddy power chassis escalates, the RMS acceleration value across its components also rises. Notably, the RMS acceleration of the front axle exceeds that of the rear, and among the three directional accelerations at the seating position, the vertical acceleration’s RMS value is predominant. Most acceleration RMS values demonstrate a linear correlation with traveling speed, although some display abrupt increases. Comprehensive analysis indicates the highest vibrational acceleration in paddy fields, succeeded by dry land, with the least on concrete paved roads. A noticeable absence of damping in the weighted acceleration at the seat position suggests design deficiencies in the engine suspension damping of the paddy chassis and in the overall vehicle’s front and rear suspensions.
(2)
The acceleration power spectrum’s peak frequency predominantly lies within the 1~14 Hz range. Front and rear axles exhibit elevated peak frequencies, while the seating position has generally subdued longitudinal and transverse peak frequencies but heightened in the vertical direction. The power spectrum’s peak value tends to amplify with speed increments.
(3)
Road conditions distinctly influence the dynamic load factor of paddock chassis tires. Specifically, dry or paddy pavements can amplify the vehicle’s shock and vibration, thereby increasing the dynamic load factor. In contrast, smoother concrete surfaces might diminish it. Nevertheless, both the paddy chassis’ front and rear wheels manifest a rising trend in dynamic load factor with speed increments, with the front wheels consistently registering superior values.
The findings of this study furnish preliminary insights into predicting farmland road unevenness and the ground–tire coupling relationship. Additionally, they offer valuable reference points for future design enhancements in the damping mechanisms of paddy-powered chassis. However, the study is specific to a single chassis design and does not encompass all environmental variables, potentially affecting its generalizability. Additionally, the sensitivity of instruments used and the variability within road categories might have influenced the results. For comprehensive understanding and applicability, future research should explore varied chassis designs, use state-of-the-art measurement techniques, and delve deeper into road condition nuances. Emphasizing the significance of these findings, this study highlights the critical need for innovations in vehicle design, operational efficiency, and safety in agricultural settings.

Author Contributions

Conceptualization, D.Y., J.H., F.P., C.Q., Y.Z., Z.W., M.Z., W.Y., G.Z., J.C. and W.Q.; methodology, D.Y. and J.H.; software, D.Y. and J.H.; validation, F.P., C.Q. and G.Z.; investigation, D.Y. and Z.W.; writing—original draft preparation, D.Y. and J.H.; writing—review and editing, D.Y., Y.Z., M.Z. and W.Y.; formal analysis, D.Y. and F.P.; investigation, J.C.; supervision, Y.Z., M.Z. and W.Q.; project administration, Z.W. and J.H.; funding acquisition, Z.W. All authors have read and agreed to the published version of the manuscript.

Funding

The Guangdong Basic and Applied Basic Research Foundation (Grant No. 2020B1515020034) and the National Natural Science Foundation of China (Grant No. 32171903), supported by the earmarked fund for CARS (Grant No. CARS-01).

Institutional Review Board Statement

Not applicable.

Data Availability Statement

The data reported in this study are contained within the article.

Conflicts of Interest

The authors declare no conflict of interest.

References

  1. Scarlett, A.J.; Price, J.S.; Stayner, R.M. Whole-body vibration: Evaluation of emission and exposure levels arising from agricultural tractors. J. Terramech. 2007, 44, 65–73. [Google Scholar] [CrossRef]
  2. Torén, A.; Öberg, K.; Lembke, B.; Enlund, K.; Rask-Andersen, A. Tractor-driving hours and their relation to self-reported low-back and hip symptoms. Appl. Ergon. 2002, 33, 139–146. [Google Scholar] [CrossRef] [PubMed]
  3. Langer, T.H.; Ebbesen, M.K.; Kordestani, A. Experimental analysis of occupational whole-body vibration exposure of agricultural tractor with large square baler. Int. J. Ind. Ergon. 2015, 47, 79–83. [Google Scholar] [CrossRef]
  4. Zhu, S.; Zhu, Y. Effects of tyre inflation pressure and forward speed on vibration of an unsuspended tractor. J. Terramech. 2013, 50, 185–198. [Google Scholar]
  5. Soane, B.D.; Ouwerkerk, C.V. Soil Compaction in Crop Production; Elsevier: Amsterdam, The Netherlands, 2013; pp. 198–234. [Google Scholar]
  6. Abu-Hamdeh, N.H.; Abu-Ashour, J.S.; Al-Jalil, H.F. Soil physical properties and infiltration rate as affected by tire dynamic load and inflation pressure. Trans. ASAE 2000, 34, 785–792. [Google Scholar] [CrossRef]
  7. Lou, S.; Xu, C. Measurement system for ride comfort of tractor seats. Trans. Chin. Soc. Agric. Mach. 2004, 35, 35–36. [Google Scholar]
  8. Radonjic, R.; Jankovic, A.; Aleksandrovic, B. Effect of Terrain Characteristics on the Tractor Vibration. Poljopr. Teh. 2012, 3, 11–23. [Google Scholar]
  9. Gomez, M.I.; Hwang, S.; Stark, A.D.; May, J.J.; Hallman, E.M.; Pantea, C.I. An analysis of self-reported joint pain among New York farmers. J. Agric. Saf. Health 2003, 9, 143–157. [Google Scholar] [CrossRef]
  10. Zhu, S.; Xu, G.; Yuan, J.; Ma, J.; Yi, L.; Li, K. Influence of implements mass on vibration characteristics of tractor-implement system. Trans. Chin. Soc. Agric. Eng. 2015, 30, 30–37, (In Chinese with English abstract). [Google Scholar]
  11. Servadio, P.; Marsili, A.; Belfiore, N.P. Analysis of driving seat vibrations in high forward speed tractors. Biosyst. Eng. 2007, 97, 171–180. [Google Scholar] [CrossRef]
  12. Hildebrand, R.; Keskinen, E.; Romero, J.N. Vehicle vibrating on a soft compacting soil half-space: Ground vibrations, terrain damage, and vehicle vibrations. J. Terramech. 2008, 45, 121–136. [Google Scholar] [CrossRef]
  13. Cheng, J. Research on Vibration Characteristics and Active Vibration Control of High Power Wheeled Tractor Based on Electro-Hydraulic Hitch System; China Agricultural University: Beijing, China, 2016. [Google Scholar]
  14. Kumar, R.; Verma, A. Impact of soil characteristics on the vibrational efficiency of power chassis in paddy fields. Int. J. Agric. Eng. 2019, 12, 102–110. [Google Scholar]
  15. Karpenko, M.; Skačkauskas, P.; Prentkovskis, O. Methodology for the Composite Tire Numerical Simulation Based on the Frequency Response Analysis. Eksploat. Niezawodn. 2023, 25, 1–11. [Google Scholar] [CrossRef]
  16. Chen, H.; Wu, W.W.; Liu, X.T.; Li, H. Effect of wheel traffic on working resistance of agricultural machinery in field operation. Trans. Chin. Soc. Agric. Mach. 2010, 41, 52–57. [Google Scholar]
  17. Li, Z.; Shi, Y.X.; Jiang, P.; Wu, H.; Lin, W. Design and experimental research of high clearance universal operation chassis. Food Mach. 2018, 34, 100–105. [Google Scholar]
  18. Wang, W.; Zhao, J.; Shen, C. Design and Experiment of Integrated Test System for Terramechanics Parameters. J. Chin. Agric. Mech. 2017, 48, 72–78. [Google Scholar] [CrossRef]
  19. Cai, Q.; Ye, Q. Design and test of new self-propelled mountain orchard transport plane. J. Chin. Agric. Mech. 2019, 40, 119–124. [Google Scholar]
  20. Wang, D.Y.; Qin, D.C. Research on forecast of tractor wheels’ fatigue life based on Elasto-plastic FEM analysis. J. Chin. Agric. Mech. 2017, 38, 97–101. [Google Scholar]
  21. Zhang, M.H.; Luo, X.W.; Wang, Z.M.; Wang, B.; Xue, Z. Optimization design and experiment of profiling and slide board mechanism of precision rice hill-drop drilling machine. Trans. Chin. Soc. Agric. Eng. 2017, 33, 18–26. [Google Scholar]
  22. Zhang, M.H.; Xiao, M.; Ouyang, L.; Jiang, E.; Qiao, J.; Wang, M.; Liu, S.; Xu, P.; Luo, X. Optimization design and test of seed protecting structure of combined type-hole metering device. J. South China Agric. Univ. 2021, 42, 99–105. [Google Scholar]
  23. Liao, Y.T.; Qi, T.X.; Liao, Q.X.; Zeng, R.; Li, C.L.; Gao, L.P. Vibration characteristics of pneumatic combined precision rapeseed seeder and its effect on seeding performance. J. Jilin Univ. (Eng. Technol. Ed.) 2022, 52, 1184–1196. [Google Scholar]
  24. Xu, L.Z.; Cai, X.Y.; Gao, Z.P.; Li, Y.; Wang, Y. Experimental study on driver seat vibration characteristics of crawler-type combine harvester. Int. J. Agric. Biol. Eng. 2019, 12, 90–97. [Google Scholar] [CrossRef]
  25. Marsili, A.; Ragni, L.; Santoro, G.; Servadio, P.; Vassalini, G. Vassalini. Innovative systems to reduce vibrations on agricultural tractors: Comparative analysis of acceleration transmitted through the driving seat. Biosyst. Eng. 2002, 81, 35–47. [Google Scholar] [CrossRef]
  26. Han, Y.; Xiao, H.R.; Song, Z.H.; Ding, W.Q.; Xia, Z.F. Frequency response analysis of bionic tillage. J. Chin. Agric. Mech. 2018, 39, 32–35. [Google Scholar]
  27. Zhang, H.; Yan, K.; Zhao, X.D. Measuring reverberation time of tractor cab under the influence of noise. J. Chin. Agric. Mech. 2019, 40, 125–128. [Google Scholar]
  28. Zhang, Z.; Xu, Z.; He, Y. Objective evaluation methods of automobile riding comfort. J. Chongqing Univ. 2010, 33, 14–20. [Google Scholar]
  29. Do Minh, C.; Zhu, S.; Ngoc, N.T. Study on the variation characteristics of vertical equivalent damping ratio of tire–soil system using semi-empirical model. J. Terramech. 2014, 51, 67–80. [Google Scholar]
  30. Yiliyasi, Y. The Influence of Front Axle Suspension on Tractor Vibration Characteristics. Ph.D. Thesis, Nanjing Agricultural University, Nanjing, China, 2015. [Google Scholar]
Figure 1. Mizutaki chassis vibration test under different road conditions: (a) concrete roads, (b) dry land, (c) paddy field.
Agriculture 13 01842 g001
Figure 2. Acceleration sensor test point location. 1. Seat. 2. Rear axle. 3. Front axle. 4. Engine.
Agriculture 13 01842 g002
Figure 3. Mizutaki chassis vibration test under different road conditions: (a) center of gravity analysis; (b) power chassis rigid tire–field soil system model. O is the center of mass; a, b, c, and d are left front, left rear, right front, and right rear wheels; Ox is the lateral distance from the center of mass of the fuselage; lbr is the horizontal distance from the center of mass of the body to the axis of the rear wheels; l is the wheelbase of the rear wheels; L is the wheelbase between the front and rear wheels; m is the mass of the power chassis after mounting the live machine; cs is the soil damping coefficient; jb is the inertia of the fuselage pitching; φ b is the angular displacement of the center of mass of the body pitching; Zb is the vertical displacement of the center of mass of the body; Ff is the dynamic loading force of the front wheels of the power chassis on the paddy field; Fr is the dynamic load on the rear wheel of the Paddy Power chassis.
Agriculture 13 01842 g003
Figure 4. Root-mean-square (RMS) values of vibration acceleration for engine and front and rear axles: (a) root-mean-square value of acceleration at engine; (b) root-mean-square value of acceleration at the front axle; (c) root-mean-square value of acceleration at the rear axle.
Agriculture 13 01842 g004
Figure 5. Root-mean-square (RMS) value of seat vibration acceleration: (a) RMS value of acceleration in the X-direction (longitudinal); (b) RMS value of acceleration in the Y-direction (lateral); (c) RMS value of acceleration in the Z-direction (vertical); (d) RMS value of weighted acceleration.
Agriculture 13 01842 g005
Figure 6. Three-dimensional spectrograms of the accelerations in different parts of the paddy power chassis with rice hole seeder attached, while walking on concrete paved roads: (a) engine position; (b) seat position; (c) front axle position; (d) rear axle position.
Agriculture 13 01842 g006
Figure 7. Three-dimensional acceleration spectra of each part of the paddy-powered, chassis-mounted, rice hole directing machine when traveling on dry roads: (a) engine position; (b) seat position; (c) front axle position; (d) rear axle position.
Agriculture 13 01842 g007
Figure 8. Three-dimensional spectrograms of the acceleration of each part of a rice hole seeder mounted on a paddy-powered chassis while traveling on a paddy field road: (a) engine position; (b) seat position; (c) front axle position; (d) rear axle position.
Agriculture 13 01842 g008aAgriculture 13 01842 g008b
Figure 9. Distribution of peaks at different points on the paddy power chassis: (a) front axle position; (b) rear axle position; (c)engine position; (d)seat position in the X-direction (longitudinal); (e) seat position in the Y-direction (lateral); (f) seat position in the Z-direction (vertical).
Agriculture 13 01842 g009aAgriculture 13 01842 g009b
Figure 10. Distribution of front and rear dynamic load coefficients of Mizuta power chassis.
Agriculture 13 01842 g010
Table 1. Parameters related to vibration test work equipment.
Device NameItemsParameter Value
Yanmar VPG6G rice transplanter power chassisPower Chassis Weight (ma, kg)720
Operating speed (v, km·h−1)0~5.3
Rated engine power (P, kW)7.7
Wheelbases (L, mm)1050
Front wheelbase (lr, mm)1220
Rear wheelbase (lf, mm)1200
Pitch inertia (jb, kg·m2)936
Center-of-mass lateral distance (Ox, mm)15
Horizontal distance from the center of mass to the rear axis (lbr, mm)360
Horizontal distance from the center of mass to the front axis (lbf, mm)690
Soil damping factor (Cs, (N·s)−m)849
2BDXZ-10CP (20) rice precision hole seederSeeder size (L × W × H, mm)1050 × 2080 × 500
Seeder weight (mb, kg)185
Working width (mm)2000
Number of rows sown10
Row spacing (cm)20
Distance between holes (cm)10~20 adjustable
Seeding rate (kg·hm−2)22.5~75 (3~10 grain/cavity adjustable)
Table 2. Main performance parameters of the test instrument.
Device NameItemsParameter Value
CT1010LC Piezoelectric Single-Axis AccelerometerRange (g)±50
Frequency response (Hz)0.5~12,000
Degree of sensitivity (mV·g−1)100
Lateral sensitivity (%)<5
CT1010SLFP Piezoelectric Triaxial Acceleration SensorRange (g)±50
Frequency response (Hz)0.5~8000
Degree of sensitivity (mV·g−1)100
Lateral sensitivity (%)<5
USB-1608G Multi-function Data Acquisition InstrumentChannel number16
Maximum sampling rate (kS·s−1)500
Distortion (%)<0.5
Table 3. Parameters related to field characteristics.
Field TypeItemsParameter Value
Dry landSoil moisture content of the subsoil (%)37.6
Soil cohesion (kPa)2.83
Permissible soil weight (g·cm−3)1.81
Paddy fieldAverage soil moisture content (%)25.3
Average soil firmness (kPa)737.2
Permissible soil weight (g·cm−3)1.22
Table 4. Vibration test program.
Test NumberRoad ConditionForward Distance (m)Lifting Height of Mounted
Implements (mm)
Forward Speed (m·s−1)
1Concrete roads354100
20.31
30.61
40.83
51.13
61.27
1Dry land354100
20.31
30.61
40.83
51.13
61.27
1Paddy field354100
20.31
30.61
40.83
51.13
61.27
Table 5. Vibration frequency and peak amplitude of each measurement point under different working conditions.
Front AxleRear AxleEnginesSeat X-DirectionSeat Y-DirectionSeat Z-Direction
Frequency
(Hz)
Peak Value
(m·s−2)
Frequency
(Hz)
Peak Value
(m·s−2)
Frequency
(Hz)
Peak Value
(m·s−2)
Frequency
(Hz)
Peak Value
(m·s−2)
Frequency
(Hz)
Peak Value
(m·s−2)
Frequency
(Hz)
Peak Value
(m·s−2)
Concrete roads0 m·s−113.450.7813.351.33262.80.9913.572.7913.572.9213.71.68
0.31 m·s−114.510.317.250.14130.50.513.090.213.020.294.720.28
0.61 m·s−14.430.155.580.22130.90.482.580.222.180.313.480.19
0.83 m·s−16.530.116.510.17129.70.793.380.213.210.164.370.17
1.13 m·s−18.620.1312.630.15131.40.363.990.133.550.185.450.27
1.27 m·s−111.560.2311.560.48134.20.364.890.284.230.215.980.29
Dry land0 m·s−113.271.1313.271.41267.30.3513.211.1313.90.8713.210.85
0.31 m·s−115.20.096.40.13236.80.213.670.233.560.354.670.14
0.61 m·s−15.80.162.610.14263.70.412.330.162.720.313.930.18
0.83 m·s−17.480.163.280.09255.11.353.720.263.530.364.570.35
1.13 m·s−19.770.374.270.15262.60.844.150.234.110.185.620.19
1.27 m·s−112.40.635.580.17265.81.094.940.214.870.266.380.18
Paddy field0 m·s−113.180.5513.180.28266.30.4413.110.5313.20.8913.060.84
0.31 m·s−115.80.124.20.08234.60.363.510.113.480.214.330.15
0.61 m·s−15.60.222.330.16259.40.592.460.142.590.283.740.24
0.83 m·s−17.30.213.210.11262.20.713.480.133.460.184.460.14
1.13 m·s−18.50.184.130.14264.40.634.120.214.070.215.580.19
1.27 m·s−111.70.345.180.14255.80.964.750.354.690.186.270.37
Disclaimer/Publisher’s Note: The statements, opinions and data contained in all publications are solely those of the individual author(s) and contributor(s) and not of MDPI and/or the editor(s). MDPI and/or the editor(s) disclaim responsibility for any injury to people or property resulting from any ideas, methods, instructions or products referred to in the content.

