Article

Effect of Planting Density on the Nutritional Quality of Grain in Representative High-Yielding Maize Varieties from Different Eras

1
College of Agriculture, Inner Mongolia Agricultural University, Hohhot 010019, China
2
Vocational and Technical College, Inner Mongolia Agricultural University, Baotou 014109, China
3
Key Laboratory of Crop Cultivation and Genetic Improvement in Inner Mongolia Autonomous Region, Hohhot 010019, China
4
Agricultural Technology Extension Centre, Tumert Right Banner, Baotou 014400, China
*
Authors to whom correspondence should be addressed.
These authors contributed equally to this work.
Agriculture 2023, 13(9), 1835; https://doi.org/10.3390/agriculture13091835
Submission received: 3 July 2023 / Revised: 13 September 2023 / Accepted: 14 September 2023 / Published: 19 September 2023
(This article belongs to the Topic Crop Ecophysiology: From Lab to Field)

Abstract

:
Maize is essential in ensuring food security in China as a primary food and feed crop. One of the main ways to increase yield in maize production systems is to increase planting density as appropriate. Clarifying the relationship between planting density and grain nutritional quality can provide theoretical guidance for high-yielding high-quality maize cultivation and management practices. To this end, five representative high-yielding maize varieties from the 1970s to the 2010s in China were used as experimental material, and two planting densities of 45,000 plants hm−2 and 105,000 plants hm−2 were set to analyze the changing patterns of yield traits and grain nutrient quality of maize varieties in different eras, as well as their responses to densification conditions. The results showed that, under low-density conditions, the grain nutrient quality components of the 2010s’ variety (DH618) were all different 75 days after anthesis compared with the 1970s’–2000s’ varieties and yields also significantly increased by 11.15% to 19.18% (p < 0.05). The increase in planting density led to a rise in total grain starch and soluble sugar content 75 days post-anthesis in all varieties from the 1970s to the 2010s, with increases of 0.65–1.65% and 39.44–69.01%, and a decrease in crude grain protein and crude fat content, with reductions of 4.15–8.50% and 3.00–11.18%. The increase in total grain starch content 75 days post-anthesis was mainly due to the rise in grain starch accumulation between 23 and 47 days post-anthesis in the 1970s’–2010s’ varieties, with an increase of 7.72–9.19% in all varieties. The higher accumulation of crude fat and soluble sugar in the 0–23 days post-anthesis period also contributed to the increase in total starch accumulation in the 23–47 days post-anthesis period. Ultimately, densification conditions also contributed to a significant increase in yield across all eras of the varieties based on changes in grain nutritional quality, with a more significant increase in yield due to densification and a smaller decrease in grain crude fat content due to densification 75 days after anthesis in the 2010s’ variety (DH618). Therefore, in cultivation and production processes that do not have specific requirements for the nutritional quality components of maize grain, we suggest that the use of a representative high-yielding maize variety (DH618) from the 2010s, together with appropriate planting at close planting distances, can significantly increase maize yields based on an increase in the total starch content of the grain at physiological maturity.

1. Introduction

Maize (Zea mays L.) grain yield contributes to global food security [1,2]. In recent years, with continuous improvement in residents’ living standards and changes in dietary consumption structure, maize is no longer used as the primary food crop. Still, it is used more as feedstuff and raw material for deeply processed products [3,4]. This requires researchers to continuously improve the yield of maize to ensure food security in China on the one hand and to improve the nutritional quality of maize grains in different ways for other uses on the other hand. Therefore, improving the grain–feed conversion rate of maize and the utilization efficiency of the deep processing of kernels has become a vital issue for the benign development of the maize industry that has increasingly caught people’s attention [5].
With social development advances in China, adjustment of the agricultural structure is off to a good start. For example, the structural adjustment of the planting industry focusing on maize is advancing steadily, and the planting area of maize in non-advantageous regions such as “Sickle Bend” continues to decrease [6]. Due to the decrease in the planting area, the change in planting mode and the increase in planting density have become necessary measures to promote the development of the maize industry, and both domestic and foreign scholars believe that the effective measure to improve yield is to increase planting density [7,8]. In a specific range, maize yield per unit area is positively correlated with planting density, and, when the density is too high, maize yield will decrease [9]. Increasing planting density can make the maize population intercept and utilize solar radiation more effectively [10,11]. Previous studies on the effect of planting density on the photosynthetic characteristics of maize showed that maize dry matter production characteristics result from plant photosynthetic product accumulation and allocation among different organs [12]. The increase in planting density will also harm yield formation, such as mutual shading among plants, resource competition within the population, intensified leaf senescence, and decreased photosynthesis [13,14,15]. Testa et al. [16] found that high-density planting reduced cob length, ear weight, 1000-grain weight, and leaf area of maize by 10.8%, 18%, 6%, and 20%, respectively. Therefore, appropriate planting density is needed to optimize maize population structure and increase yield per unit area.
Increasing the photosynthetic area of the population through appropriate dense planting can improve the yield of maize but can also significantly affect the nutritional quality of maize grains [17,18]. Similar to most cereal crops, the nutritional quality of maize grains is mainly determined by starch, crude protein, and crude fat. At physiological maturity, the storage component content of maize grains includes 60–72% starch, 8–11% crude protein, and 4–6% crude fat [19]. It is the source of nutrients (micro- and macronutrients) and phytochemical compounds such as phenolic compounds that protect humans from chronic diseases [20]. The kernel is the edible and nutritional part for human consumption that contains fats, carbohydrates, proteins, and minerals. At the same time, the composition is dependent upon plant variety, environmental factors, geographic distribution, and genetic background variety [21]. Duvick [22] compared 36 American commercial hybrids widely planted in different periods and found, that under adverse conditions, the percentage of starch content of new varieties was higher than that of old varieties. In comparison, the portion of grain protein content was lower. Chen et al. [23] found that 1000-grain weight and bulk density were relatively fast-improving traits of Chinese maize varieties in the process of variety replacement, and the increase in 1000-grain weight and bulk density mainly depended on the rapid expansion of crude starch content.
The relationship between planting density and nutrient components such as crude protein, starch, and fat is still complicated. Tian et al. [24] reported that with the increase in planting density, the crude protein content of grains decreased significantly, while the increasing and decreasing trend in fat and starch contents was not evident. Amanullah et al. [25] found in their study that the crude protein content of maize grains increased with the increase in nitrogen application rates and the decrease in planting density, but, sometimes, the planting density had no significant influence on the crude protein content of maize grains. Rafiq et al. [26] also found that the increase in density led to the extension of days from anthesis to the silking stage of maize, which increased grain yield but reduced grain protein content. Center et al. [27] showed that the protein content of grains was significantly affected by population size, geographical location, and nitrogen application level, and the variation of the crude fat content of grains was more affected by factors of a hybrid than by cultivation factors. Lang et al. [28] reported that protein and fat contents in maize grains decreased with the increase in density and the decrease in nitrogen application levels, and the performances of different hybrids were inconsistent. The above-limited research results are sufficient to indicate that planting density has a significant effect on grain nutritional quality. However, there still needs to be a consensus on this aspect of research in China and abroad.
Previous studies on the effect of planting density on the nutritional quality of maize grain have mainly focused on the physiological maturity stage. At the same time, less attention has been paid to the changes in various grain nutrient quality components during the filling stage of maize grain. The foremost objectives of this study are (1) to clarify the pattern of change in grain nutrient quality components in maize varieties from different eras at physiological maturity; (2) to analyze the effect of planting density on grain nutrient quality components of maize varieties from different eras at physiological maturity; (3) to clarify the effect of planting density on the nutrient quality components of kernels of maize varieties from different eras during the kernel filling period and the mechanism of its action.

2. Materials and Methods

2.1. Description of Research Location

Field experiments were conducted at the Tumoteyou Qi Experimental Station of the Inner Mongolia Agricultural University (40°33′ N, 110°31′ E) between 2018 and 2019. The soil properties in the 0–30 cm soil layer were as follows: pH 7.23 (suspension of 1 g of soil in 5 cm3 of water), organic matter 22.27 g kg−1, available nitrogen 103.75 mg kg−1, available phosphorus 15.76 mg kg−1, and available potassium 219.60 mg kg
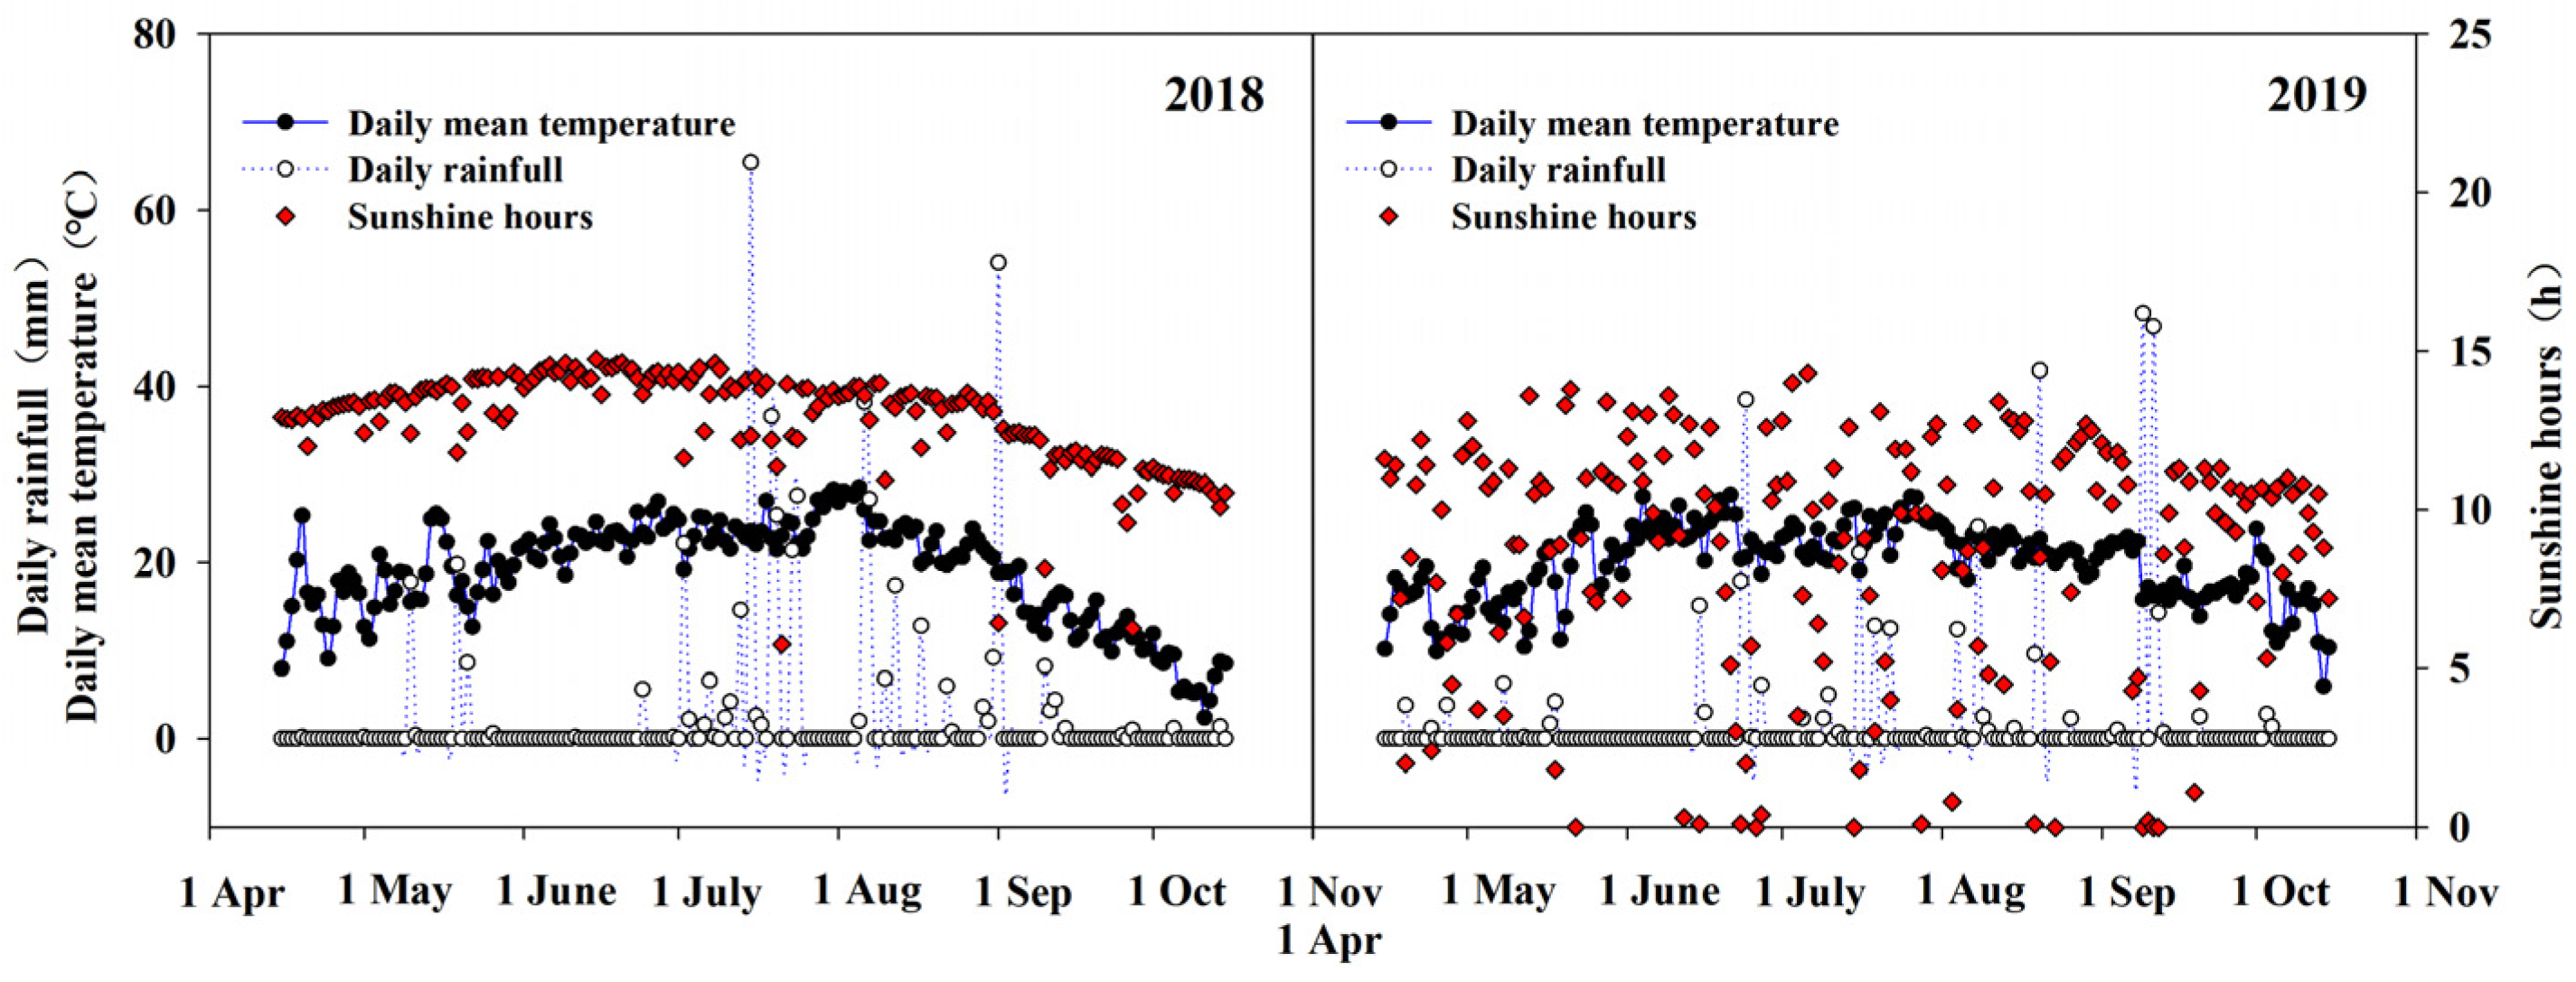
−1. The main meteorological factors during the maize growth period are given in Figure 1.

2.2. Experiment Design

A two-factor randomized block design (planting density and variety) was used. The planting density was 45,000 plants hm−2 (D1, low density) and 105,000 plants hm−2 (D2, high density), and varieties were divided into 5 treatments: ZD2 (1970s), DY13 (1980s), YD13 (1990s), XY335 (2000s), and DH618 (2010s), with 10 combinations and 3 replicates for each combination. These varieties are sold in Chinese markets and were bought as test materials. The plot area was 6 × 6 m. The dosages of pure N (ammonium phosphate dibasic, 18%; urea, 46%), P (ammonium phosphate dibasic, 46%), and K (potassium sulfate, 50%) were 225 kg ha−1, 210 kg ha−1, and 202.5 kg ha−1. Ammonium phosphate dibasic and potassium sulfate were applied as basal fertilizer before sowing. The proportion of nitrogen (urea, 46%) top-dressing was 30% at V6 (sixth leaf), 60% at V12 (twelfth leaf), and 10% at R2 (blister), respectively. The trial area was irrigated with drip irrigation four times during the growing period at V6, V12, R1 (silking), and R2. Each irrigation was 750 m3 ha−1. Other general management took place in the field.

2.3. Measurement

Grain nutritional quality: 23 days after anthesis, 47 days after anthesis, and 75 days after anthesis (physiological maturity), the central grains of the representative cobs were selected and dried in the oven (Plant drying equipment., Model 3, Shandong, China) for 30 min at 105 °C, dried at 60 °C to constant weight, and then weighed. The dried grains were crushed and used to determine the nutritional quality of the grains. The total nitrogen content of the grains was determined by the semi-micro Kjeldahl nitrogen determination method (crude protein content = total nitrogen content of the grains × 6.25). The crude fat content was determined by Soxhlet extraction and the residual method. The total starch and soluble sugar content was determined by anthrone-sulfuric acid colorimetry [29].
Yield: The measured yield area was 6 m2 in each district, and the number of effective panicles in each measured producing area was counted. After manual threshing, fresh grain weight and water content were measured (Electronic balance, EXBZ-900YA/22002, Guangdong, China and Grain moisture meter, DRCS-AE, Wuhan, China), and the grain yield with a water content of 14% was converted.

2.4. Statistical Analysis

All the data were collected using Microsoft Excel, version 2019, (Microsoft, Inc., Redmond, WA, USA). Data were analyzed for variance analysis, path analysis, stepwise regression, and correlation using the SAS, version 9.4, (SAS Institute Inc., Raleigh, CA, USA). LSD (least significant difference) and Duncan’s method were used for the significance test. The V was used for comparative analysis between different planting densities. All data from the two years were applied to the various data analysis methods. Sigmaplot, version 12.5, (Systat Software Inc., San Jose, CA, USA) was used for mapping.

3. Results

3.1. Effects of Planting Density on Yield of Maize Varieties in Different Eras

The results of variance analysis showed (Table 1) that there was no significant difference in yield between year or density. However, there were highly significant differences between variety, year × variety, variety × density, and year × variety × density (p < 0.01).
Figure 2 shows that the 2010s’ variety (DH618) yielded more than other varieties (p < 0.05). There were differences in the response of varieties to densification in different eras. The yield from the 1970–1980s’ varieties (ZD2 and DY13) decreased pointedly by 17.70% and 7.71%, the yield from the 1990s’ variety (YD13) decreased by 3.21%, and the yield from the 2000–2010s’ varieties (XY335 and DH618) increased significantly by 9.38% and 17.26% (p < 0.05). Variety differences under different densities were also seen. Compared with the 1970–2000s’ varieties (ZD2, DY13, YD13, and XY335), the yield from the 2010s’ variety (DH618) increased by 19.18, 18.92%, 16.82%, and 11.15% in D1 density. After densification, the yield of all varieties from the 1970–2010s (ZD2, DY13, YD13, XY335, and DH618) changed in varying degrees, with changes of −17.70%, −7.71%, −3.21%, 9.38%, and 17.26%, respectively. These results showed that the 2010s’ variety (DH618) was better at densifying and yielding.

3.2. Effects of Planting Density on Grain Nutritional Quality of Maize Varieties at Physiological Maturity in Different Eras

The variance analysis (Table 2) showed that there were very significant differences in grain crude protein content between year, variety, density, and variety × density (p < 0.01) and there were significant differences between year × density (p < 0.05) [30,31]. There were significant differences in total starch content between year, variety, density, and year × density (p < 0.01). The crude fat content in grains significantly differed between years, varieties, densities, year × varieties, and densities × years (p < 0.01). The total soluble sugar content in grains was significantly different between years, varieties, densities, years × varieties, varieties × densities, and years × varieties × densities (p < 0.01).
Figure 3 shows that the grain crude protein content of the 2000–2010s’ varieties (XY335 and DH618) was significantly lower than that of previous varieties. However, the grain total starch content was much larger than earlier varieties. The grain crude fat content of the 1990s’ variety (YD13) was significantly higher than that of varieties in other eras, and the grain total soluble sugar content of the 1980–1990s’ varieties at D1 density was considerably lower than that of varieties in other eras. At D2 density, the 2000–2010 variety was substantially lower than other eras (p < 0.05). Under D1 density conditions, compared with 1970–1990s’ varieties (ZD2, DY13, and YD13), the grain crude protein content of 2000–2010s’ varieties (XY335 and DH618) decreased by 4.39%, 6.90%, and 2.99% and 5.75%, 8.22%, and 4.37%, grain total starch content increased by 0.68%, 0.85%, and 2.01% and 0.70%, 0.87%, and 2.04%, while soluble sugar content changed by 0.37%, 7.61%, and 7.81% and −0.35%, 6.84%, and 7.04%. The two-year mean values of the crude fat content of the grains of the 1990s’ variety (YD13) increased by 13.33%, 16.84%, 20.48%, and 16.44%, respectively, compared with other varieties from other eras. After densification, the grains’ crude protein and fat contents decreased and the grains’ total starch and soluble sugar contents increased. Moreover, the total starch contents in grains increased by 0.65%, 1.65%, 1.64%, 1.32%, and 1.39% for each variety from the 1970s to the 2010s, respectively. Grain crude fat contents decreased by 6.33%, 6.53%, 11.18%, 5.55%, and 3.08% for each variety from the 1970s to the 2010s, respectively. Furthermore, the grains’ total soluble sugar contents increased by 54.68%, 69.01%, 84.17%, 47.66%, and 39.44% for each variety from the 1970s to the 2010s, respectively. In conclusion, after densification, grain crude fat content and grain total soluble sugar content declined less in the 2000–2010s’ varieties (XY335 and DH618) and were insensitive to density, but grain total starch content increased more than in the 1970s’ varieties (ZD2).

3.3. Correlation Analysis between Yield and Grain Nutrient Quality

Figure 4 shows that yield had a significant negative correlation with grain crude protein content (0.47, p < 0.01), a significant positive correlation with grain total starch content (0.32, p < 0.05), and no significant correlation with grain crude fat and total soluble sugar content. Higher crude protein levels did not improve maize production, although higher total starch content did.

3.4. Effects of Planting Density on Grain Crude Protein Content of Maize Varieties at Different Growth Stages in Different Eras

Table 3 indicates that the variation amplitude of crude protein content in grains significantly differed between year, variety, density, and year × variety from 0 to 23 days after anthesis; 23–47 days after anthesis, there were highly significant differences between year, variety, density, year × variety, year × density, variety × density, and year × variety × density; 47–75 days after anthesis, there were highly significant differences between year, variety, density, year × variety, year × density, variety × density, and year × variety × density (p < 0.01).
A dynamic study of grain crude protein content (Figure 5) showed that it increased significantly 0–23 days after anthesis, progressively dropped 23–75 days after anthesis, and fell further 23–47 days after anthesis than 47–75 days after anthesis. At D1 density, compared with other varieties (ZD2, DY13, YD13, and XY335), the increment in crude protein content in grains of the 2010s’ variety (DH618) significantly decreased by 6.44%, 4.76%, 6.24%, and 2.51% 0–23 days after anthesis, respectively. From 23 to 47 days after anthesis, the decreasing amplitude of crude protein content in grains of the 2010s’ variety (DH618) decreased by 15.91%, 16.77%, 43.08%, and 32.72% compared with other varieties (ZD2, DY13, YD13, and XY335), respectively; 47–75 days after anthesis, it changed by −6.88%, 34.60%, 73.17%, and 83.54% compared with other varieties (ZD2, DY13, YD13, and XY335), respectively. After densification, the incremental crude protein content in grain varieties from the 1970–2010s (ZD2, DY13, YD13, XY335, and DH618) decreased by 4.38%, 3.89%, 6.89%, 5.61%, and 3.43% 0–23 days after anthesis, respectively. The decreasing amplitude of crude protein content in grain varieties from the 1970–2010s (ZD2, DY13, YD13, XY335, and DH618) changed by 52.59%, 38.16%, −10.53%, −4.62%, and 51.56% 23–47 days after anthesis. In contrast, 47–75 days after anthesis, the decreasing amplitude of crude protein content in grain varieties from the 1970–2010s (ZD2, DY13, YD13, XY335, and DH618) changed by −77.49%, −54.23%, −7.06%, 20.95%, and −51.80%, respectively.

3.5. Effects of Planting Density on Grain Total Starch Content of Maize Varieties at Different Growth Stages in Different Eras

Variance analysis showed (Table 4) that total starch content in grains varied significantly or extremely between varieties, density, and variety × density from 0 to 23 days after anthesis. From 23 to 47 days after anthesis, there were extremely noteworthy differences between density and year × variety. Significant or extremely significant differences were in the year, variety, density, and year × variety (p < 0.05 or p < 0.01) 47–75 days after anthesis.
Analysis of the variation in the total starch content of grains at different stages revealed (Figure 6) that the total starch content of maize grains increased gradually throughout the grouting and fruiting period, reaching a maximum 75 days after anthesis, with the most pronounced increase in the total starch content of grains 23–47 days after anthesis. At D1 density, the incremental total starch content in the grain variety from the 2010s (DH618) increased by 7.91%, 7.64%, 6.70%, and 0.24% compared with other varieties (ZD2, DY13, YD13, and DH618) 0–23 days after anthesis. Total grain starch content of the variety from the 2010s (DH618) increased by 1.45%, −1.11%, 1.00%, and 2.13% compared with the other varieties (ZD2, DY13, YD13, and DH618) 23–47 days after anthesis. From 47 to 75 days after anthesis, the increase in total starch content in the grain variety from the 2010s (DH618) decreased by 2.37%, 1.23%, 0.15%, and 2.62% compared with the other varieties (ZD2, DY13, YD13, and DH618). After densification, the incremental increase in the total starch content of grains in the 1970s’–2010s’ varieties (ZD2, DY13, YD13, XY335, and DH618) 23–47 d after anthesis was 8.29%, 7.72%, 7.95%, 9.19%, and 15.09%. The increment of grain total starch content in the 1970s’–2010s’ varieties (ZD2, DY13, YD13, XY335, and DH618) decreased by 10.21%, 10.91%, 10.16%, 11.36%, and 15.09% 47–75 days after anthesis, respectively. In conclusion, after densification, grains’ total starch content significantly increased 23–47 days after anthesis and significantly dropped 47–75 days after anthesis (p < 0.05), and the response of the 2000–2010s’ varieties (XY335 and DH618) to densification was more significant.

3.6. Effects of Planting Density on Grain Crude Fat Content of Maize Varieties at Different Growth Stages in Different Eras

Variance analysis showed (Table 5) that the variation amplitude of crude fat content in grains was extremely significant between year, varieties, density, year × variety, and year × variety × density from 0 to 23 days after anthesis. From 23 to 47 days after anthesis, there were extremely significant differences between year, varieties, density, year × variety, year × density, variety × density, and year × variety × density. There were extremely significant differences in the year, variety, density, year × variety, year × density, variety × density, and year × variety × density (p < 0.01) 47–75 days after anthesis.
A dynamic study of the crude fat content in grains showed (Figure 7) that it climbed steadily 0–75 days after anthesis, reached the maximum at 75 days, and increased most visibly from 0 to 23 days. At D1 density, the difference between varieties in grain crude fat content reached the maximum 47–75 days after anthesis, and, at D2 density, the difference between varieties was the largest 0–23 days after anthesis. At D1 density, the 2010s’ variety (DH618) had 14.92%, 1.54%, 11.87%, and 0.03% less increment in crude fat than other varieties (ZD2, DY13, YD13, and XY335) 0–23 days after anthesis. From 23 to 47 days after anthesis, the increment in crude fat content in grains of the 2010s’ variety (DH618) reduced by 45.63%, 73.95%, 65.78%, and 75.27% compared with other varieties (ZD2, DY13, YD13, and XY335), respectively. At 47–75 days after anthesis, the increment in grains’ crude fat content of the 2010s’ variety (DH618) increased by 236.98%, 217.96%, 117.82%, and 390.25% compared with other varieties (ZD2, DY13, YD13, and XY335), respectively. After densification, the incremental crude fat content in grains of 1970–2010s’ varieties (ZD2, DY13, YD13, XY335, and DH618) increased by 2.55%, 9.16%, 13.73%, 7.79%, and 5.52% 0–23 days after anthesis, respectively. From 23 to 47 days after anthesis, grains’ incremental crude fat content of the 1970–2010s’ varieties (ZD2, DY13, YD13, XY335, and DH618) changed by −1.92%, 23.46%, 75.18%, −2.23%, and 143.07%, respectively. In contrast, 47–75 days after anthesis, the grains’ incremental crude fat content of the 1970–2010s’ varieties (ZD2, DY13, YD13, XY335, and DH618) changed by 25.66%, −23.00%, −43.28%, −23.40%, and −36.52%, respectively. After densification, grain crude fat content increased 0–23 days after anthesis in the 1980–2010s’ varieties more than the 1970s varieties’ (ZD2).

3.7. Effects of Planting Density on Grain Total Soluble Sugar Content of Maize Varieties at Different Growth Stages in Different Eras

Variance analysis showed (Table 6) that the variation amplitude of grain total soluble sugar content was extremely significant between varieties, density, year × variety, year × density, and variety × density 0–23 days after anthesis. From 23 to 47 days after anthesis, there were extremely significant differences between year, varieties, density, year × variety, year × density, variety × density, and year × variety × density. From 47 to 75 days after anthesis, there were remarkable differences in the year, variety, density, year × variety, and variety × density (p < 0.01 or p < 0.01).
Dynamic analysis of grains’ total soluble sugar content showed (Figure 8) that total soluble sugar content in grains increased rapidly 0–23 days after anthesis and gradually decreased 23–75 days after anthesis. Moreover, the decreased amplitude of grains’ total soluble sugar content 23–47 days after anthesis was greater than 47–75 days after anthesis. At D1 density, the grains’ total soluble sugar content differed the most 0–23 days after anthesis, while, at D2 density, it was most significant 47–75 days after anthesis. At D1 density, the incremental increase in total soluble sugar content of grains in the 2010s’ variety (DH618) was 26.87%, 23.17%, 23.12%, and 8.72% more than the other varieties (ZD2, DY13, YD13, and XY335) 0–23 days after anthesis. From 23 to 47 days after anthesis, the decreasing amplitude of grains’ total soluble sugar content of the 2010s’ variety notably increased by 55.68%, 48.41%, 49.34%, and 22.37% compared with other varieties (ZD2, DY13, YD13, and XY335), respectively; 47–75 days after anthesis, it changed by 3.44%, −11.24%, −12.96%, and −14.01% compared with other varieties (ZD2, DY13, YD13, and XY335), respectively. After densification, the incremental total soluble sugar content in grains of the 1970–2010s’ varieties (ZD2, DY13, YD13, XY335, and DH618) increased by 11.44%, 6.96%, 12.23%, 9.07%, and 4.30% 0–23 days following anthesis, respectively. From 23 to 47 days after anthesis, the decreasing amplitude of grains’ total soluble sugar content in the 1970–2010s’ varieties (ZD2, DY13, YD13, XY335, and DH618) decreased by 22.09%, 32.06%, 22.02%, 13.40%, and 18.33%, respectively. In contrast, 47–75 days after anthesis, the decreasing amplitude of total soluble sugar content in grains of the 1970–2010s’ varieties (ZD2, DY13, YD13, XY335, and DH618) changed by 16.72%, 4.18%, −16.52%, 9.87%, and 28.86%, respectively. In conclusion, after densification, grains’ total soluble sugar content in all era varieties increased notably 0–23 days following anthesis. Furthermore, the declining amplitude of soluble sugar content decreased significantly 23–47 days after anthesis, and the response range of total soluble sugar content in the 2010s’ variety (DH618) was smaller.

3.8. Path Analysis of Grain Nutrient Quality Components

Path analysis was performed on the changing amplitude of crude protein, crude fat, and total soluble sugar in grains at different growth stages and the total starch accumulation in grains 0–23 days and 47–75 days following anthesis. Through stepwise regression analysis, the total starch accumulation 0–23 days and 47–75 days after anthesis, crude fat accumulation 0–23 days and 47–75 days after anthesis, and total soluble sugar accumulation 0–23 days after anthesis were included in the regression equation; the parameters of the regression equation are shown in Table 7.
Path analysis revealed (Table 8) a negative correlation between the total starch accumulation in grains 0–23 days and 47–75 days after anthesis and the crude fat accumulation in grains 47–75 days after anthesis. There was a positive correlation between the accumulation of crude fat and total soluble sugar 0–23 days after anthesis and total starch 23–47 days after anthesis. The negative correlation between total starch accumulation in grains 0–23 days after anthesis and total starch accumulation in grains 23–47 days after anthesis was mainly through direct correlation (−0.448), and the indirect correlation was small (0.003). The negative correlation between grains’ total starch accumulation 47–75 days after anthesis and grains’ total starch accumulation 23–47 days following anthesis was mainly through direct correlation (−0.819), and the indirect correlation was small (−0.047). The indirect correlation (0.557) between crude fat accumulation in grains 0–23 days after anthesis and total starch accumulation in grains 23–47 days after anthesis was positive, but the direct correlation was negative (−0.281). The indirect correlation was mainly correlated with the total starch accumulation in grains 47–75 days after anthesis (0.413). The positive correlation between total soluble sugar accumulation 0–23 days after anthesis and total starch accumulation 23–47 days after anthesis was mainly provided by direct correlation (0.366), and indirect correlation was also small (0.063).

4. Discussion

Maize yield per unit area depends on planting density and grain yield per plant [32]. The number of panicle rows and 100-kernel weight rose significantly with the number of release years, and 100-kernel weight contributed to the genetic risk of maize production in China’s three main maize-producing areas [33]. The increase in maize grain yield is mainly attributed to the increase in tolerance to density [34,35]. Planting density can boost grain yield per unit area by increasing dry matter buildup [
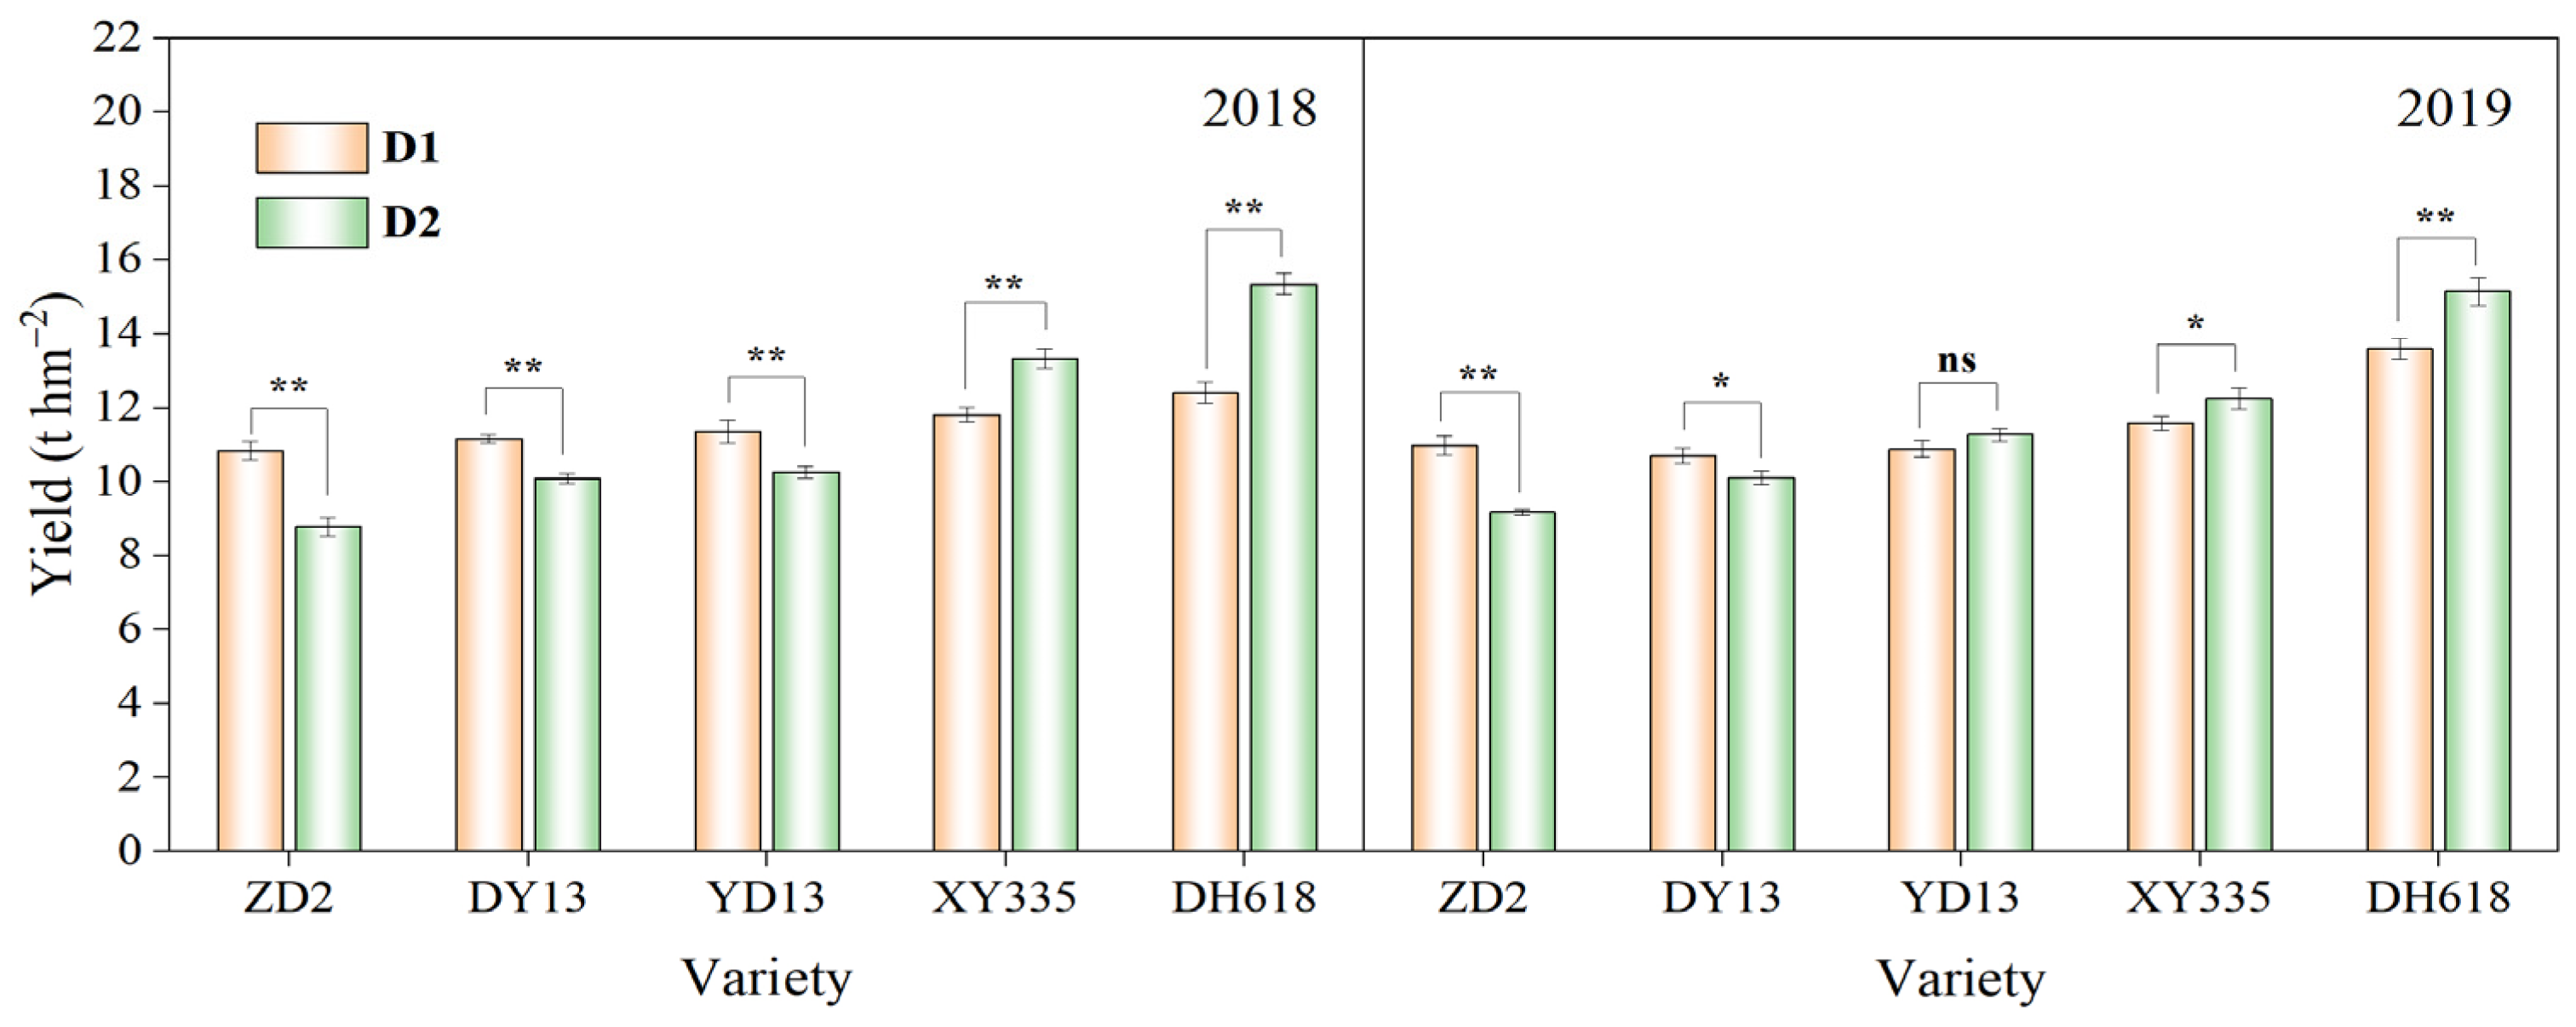
36]. The results showed that the yield of the 2010s’ variety (DH618) was significantly higher than other varieties (ZD2, DY13, YD13, and XY335) (p < 0.05). After densification, the yield of various varieties from the 1970–2010s (ZD2, DY13, YD13, and XY335) changed by different degrees, respectively, by −17.70%, −7.71%, −3.21%, 9.38%, and 17.26%, among which the 2010s’ variety was more favorable to maximizing the benefits of densification and yield growth.
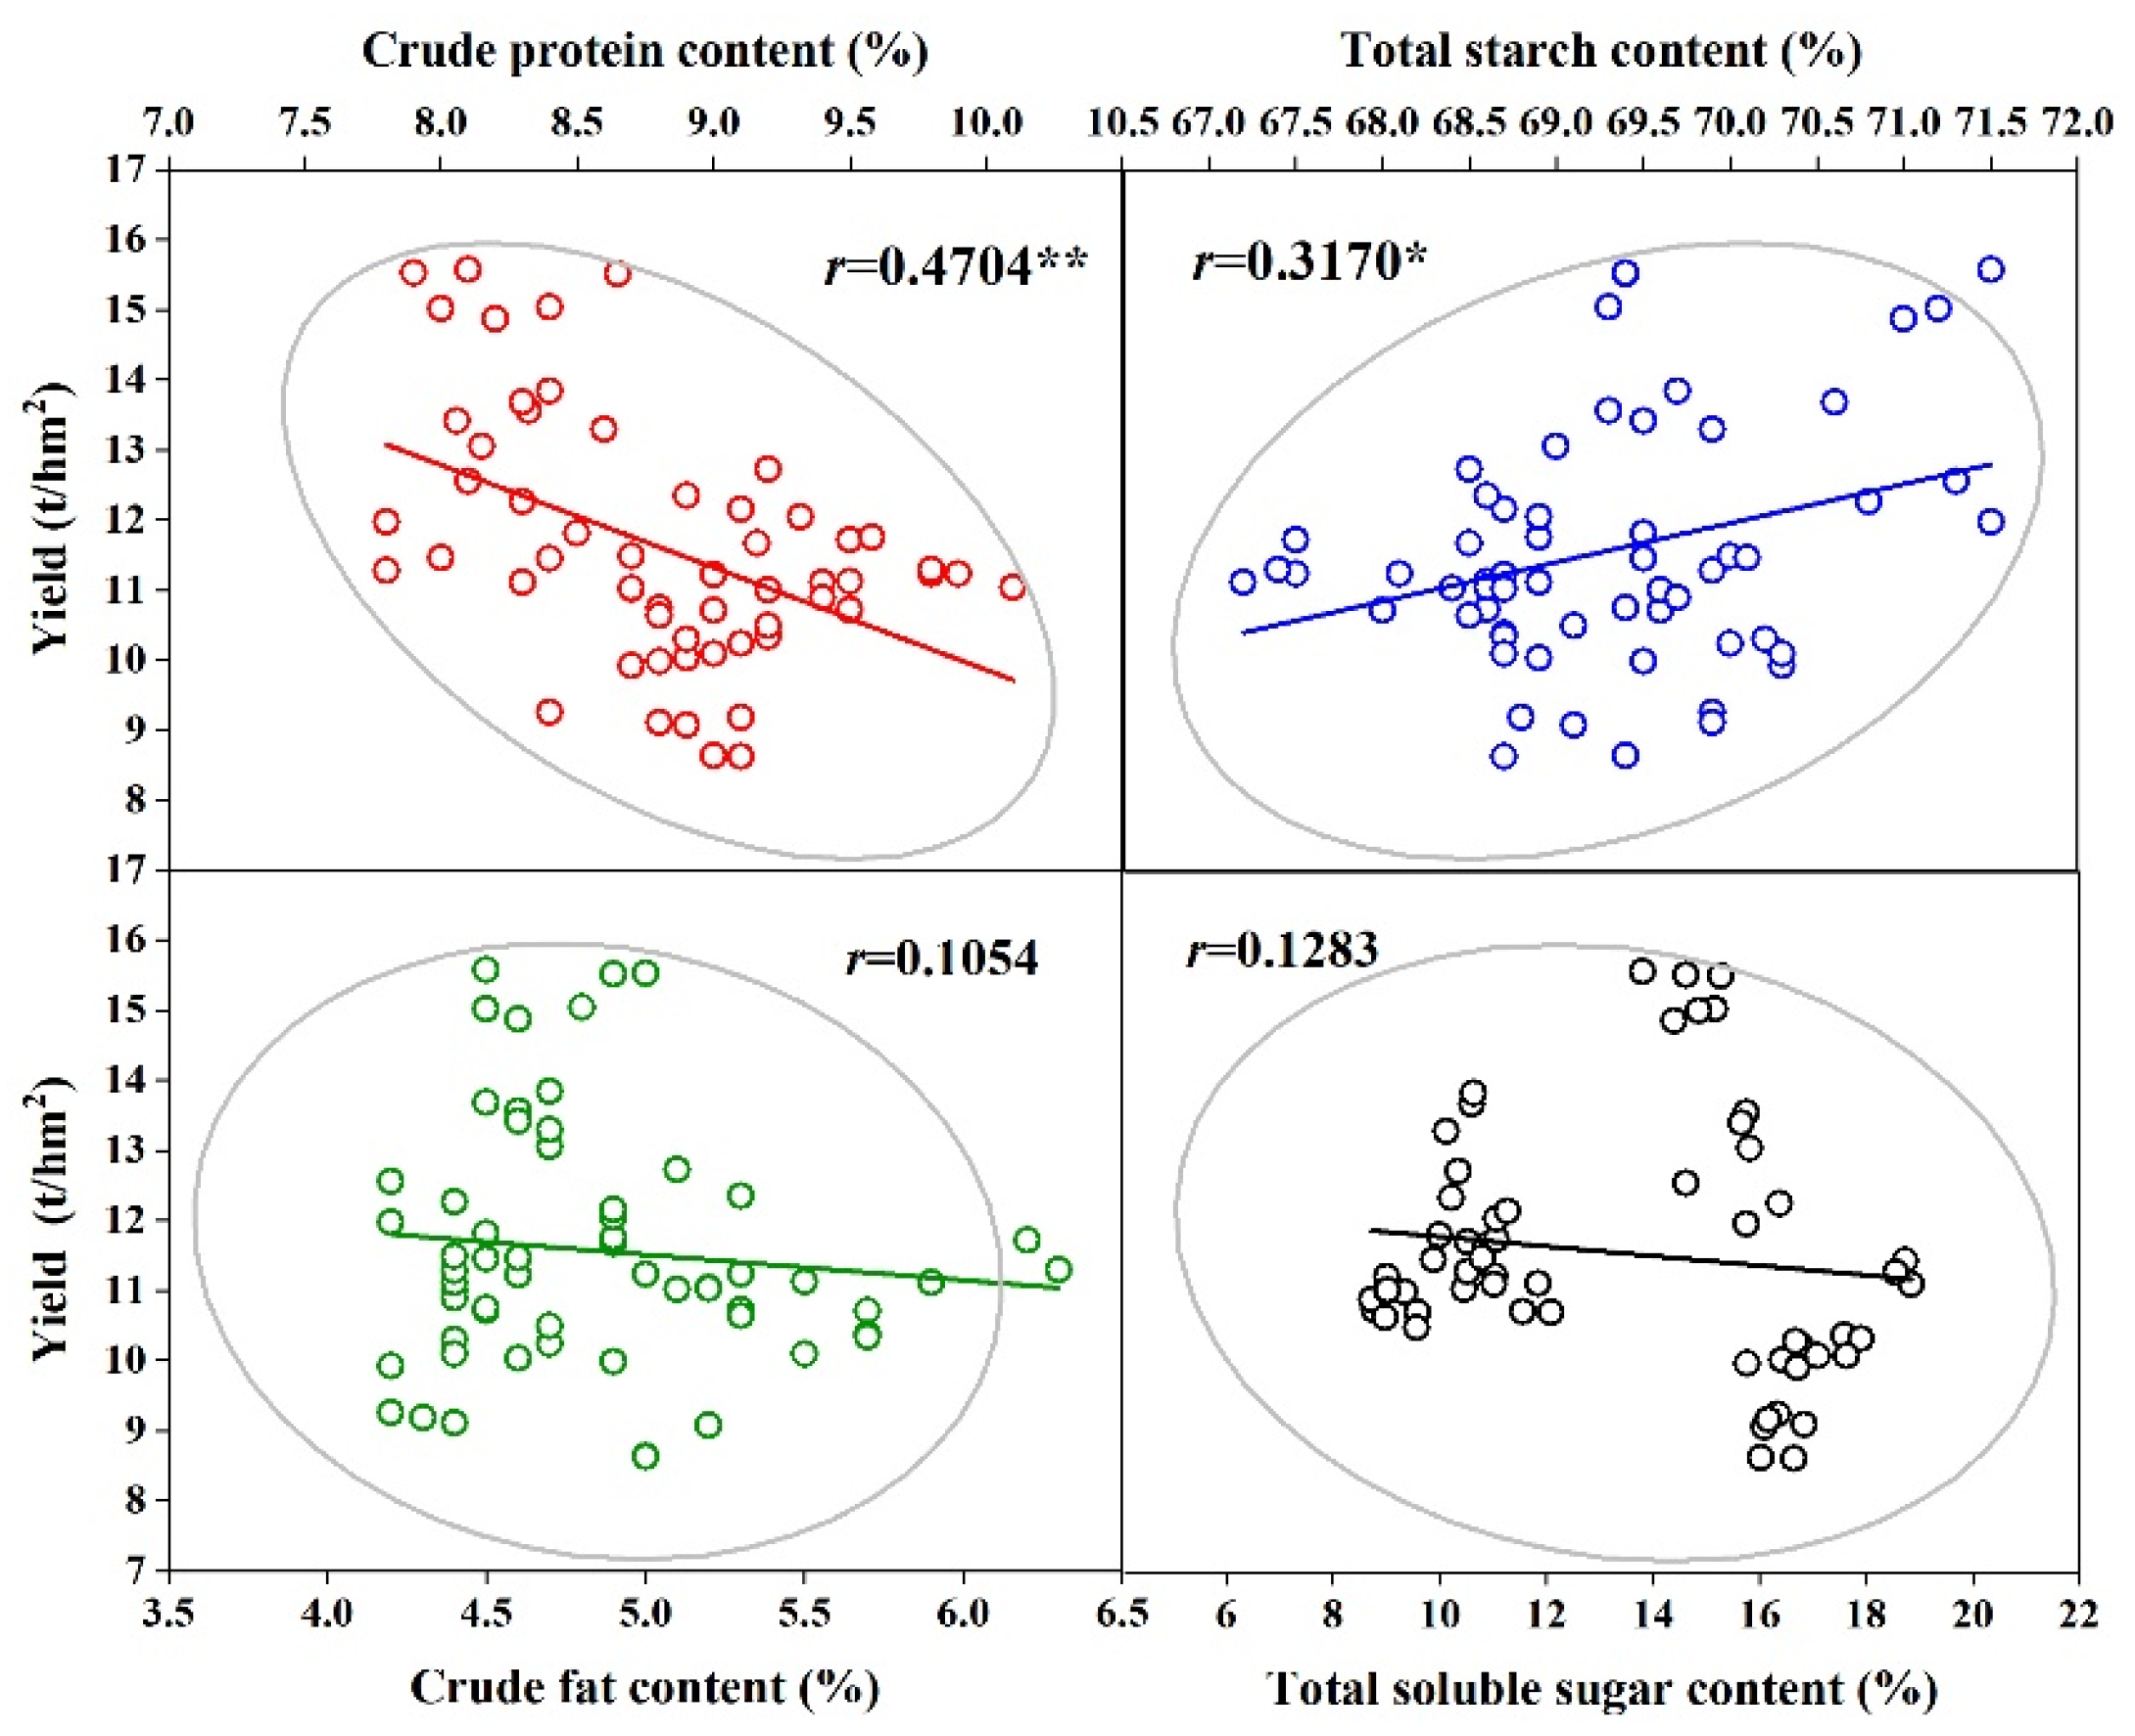
The accumulation and distribution of photosynthetic products and the conversion of assimilates into various material forms determine maize’s yield and nutritional quality. Sun et al. [37] analyzed the grain quality traits of the main maize varieties in China after 1950. They found a very significant negative correlation between grain protein content and yield. Eugene et al. [38] found that increasing grain output decreased the protein-to-starch ratio and grain oil content. For example, with the increase in yield potential of maize varieties approved after 1967, grain protein content decreased while grain starch content increased [39]. Grain yield was significantly negatively correlated with crude protein content (p < 0.01), significantly positively correlated with total starch content (p < 0.05), and uncorrelated with crude fat and soluble sugar content. As for the negative correlation between grain protein content and grain yield, Wang et al. [40] speculated that protein synthesis required more glucose than carbohydrates. However, Ertiro et al. [41] did not observe a strong correlation between yield and grain quality traits in their research results. Zhang et al. [
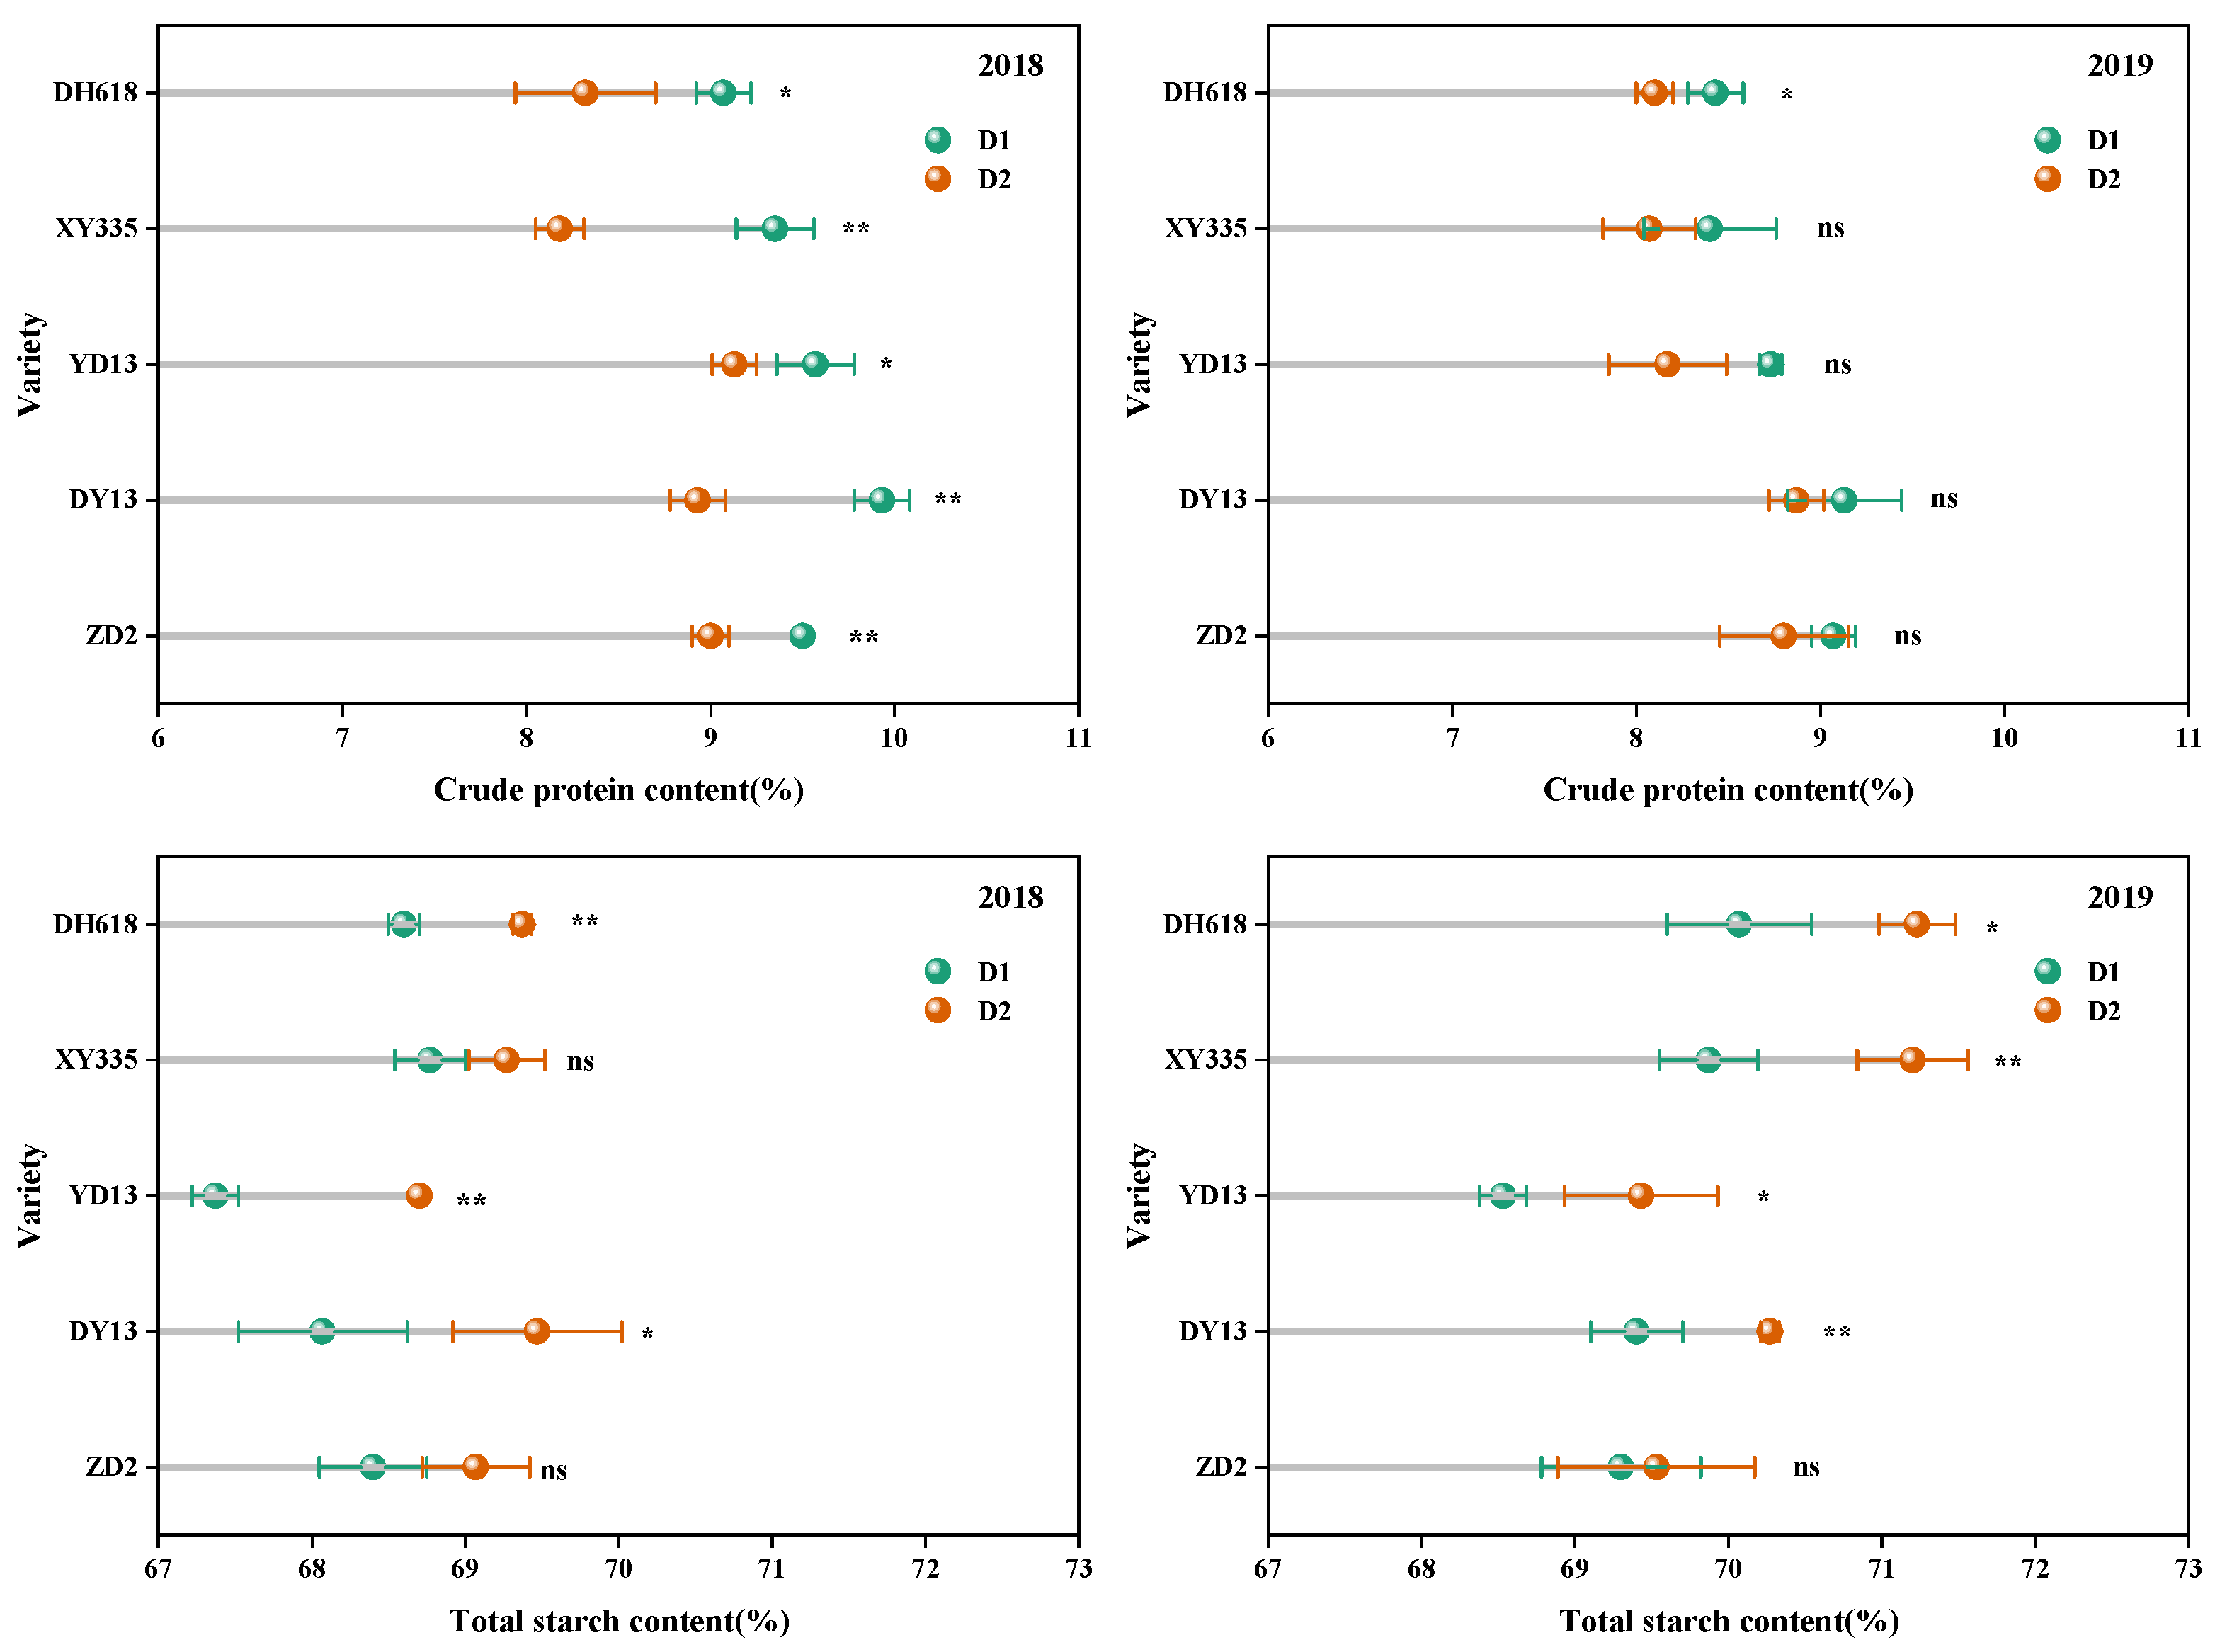
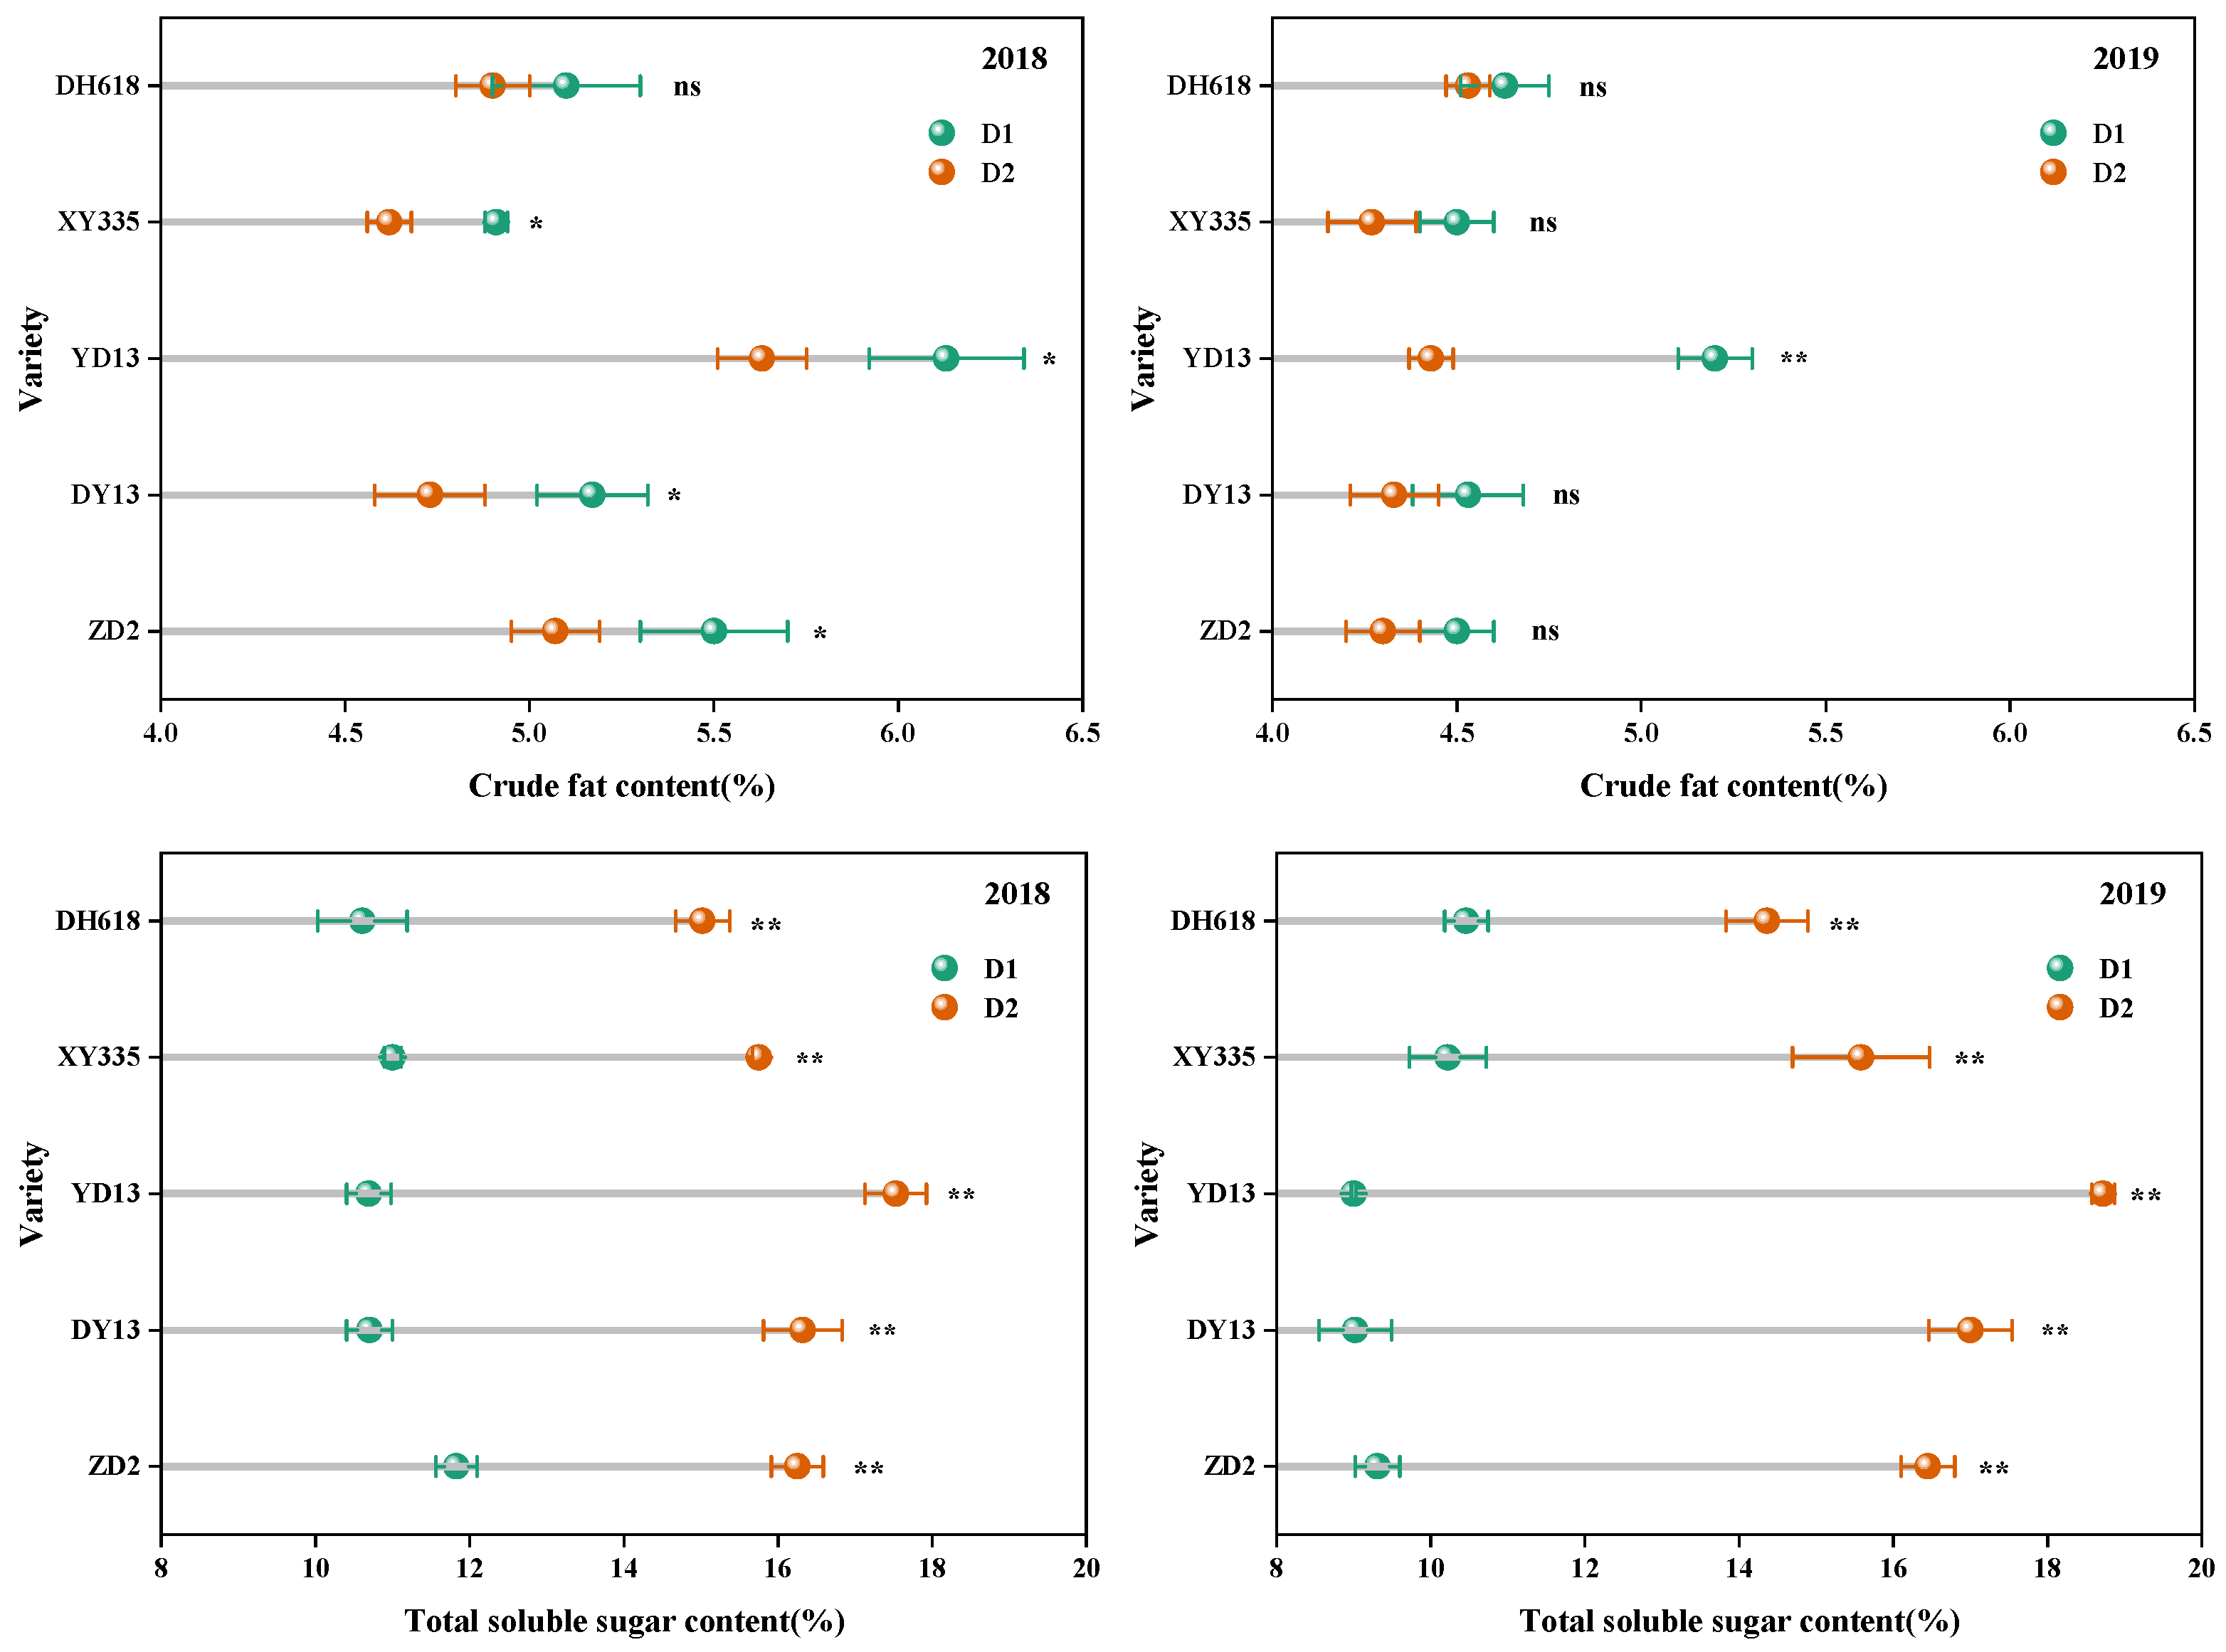
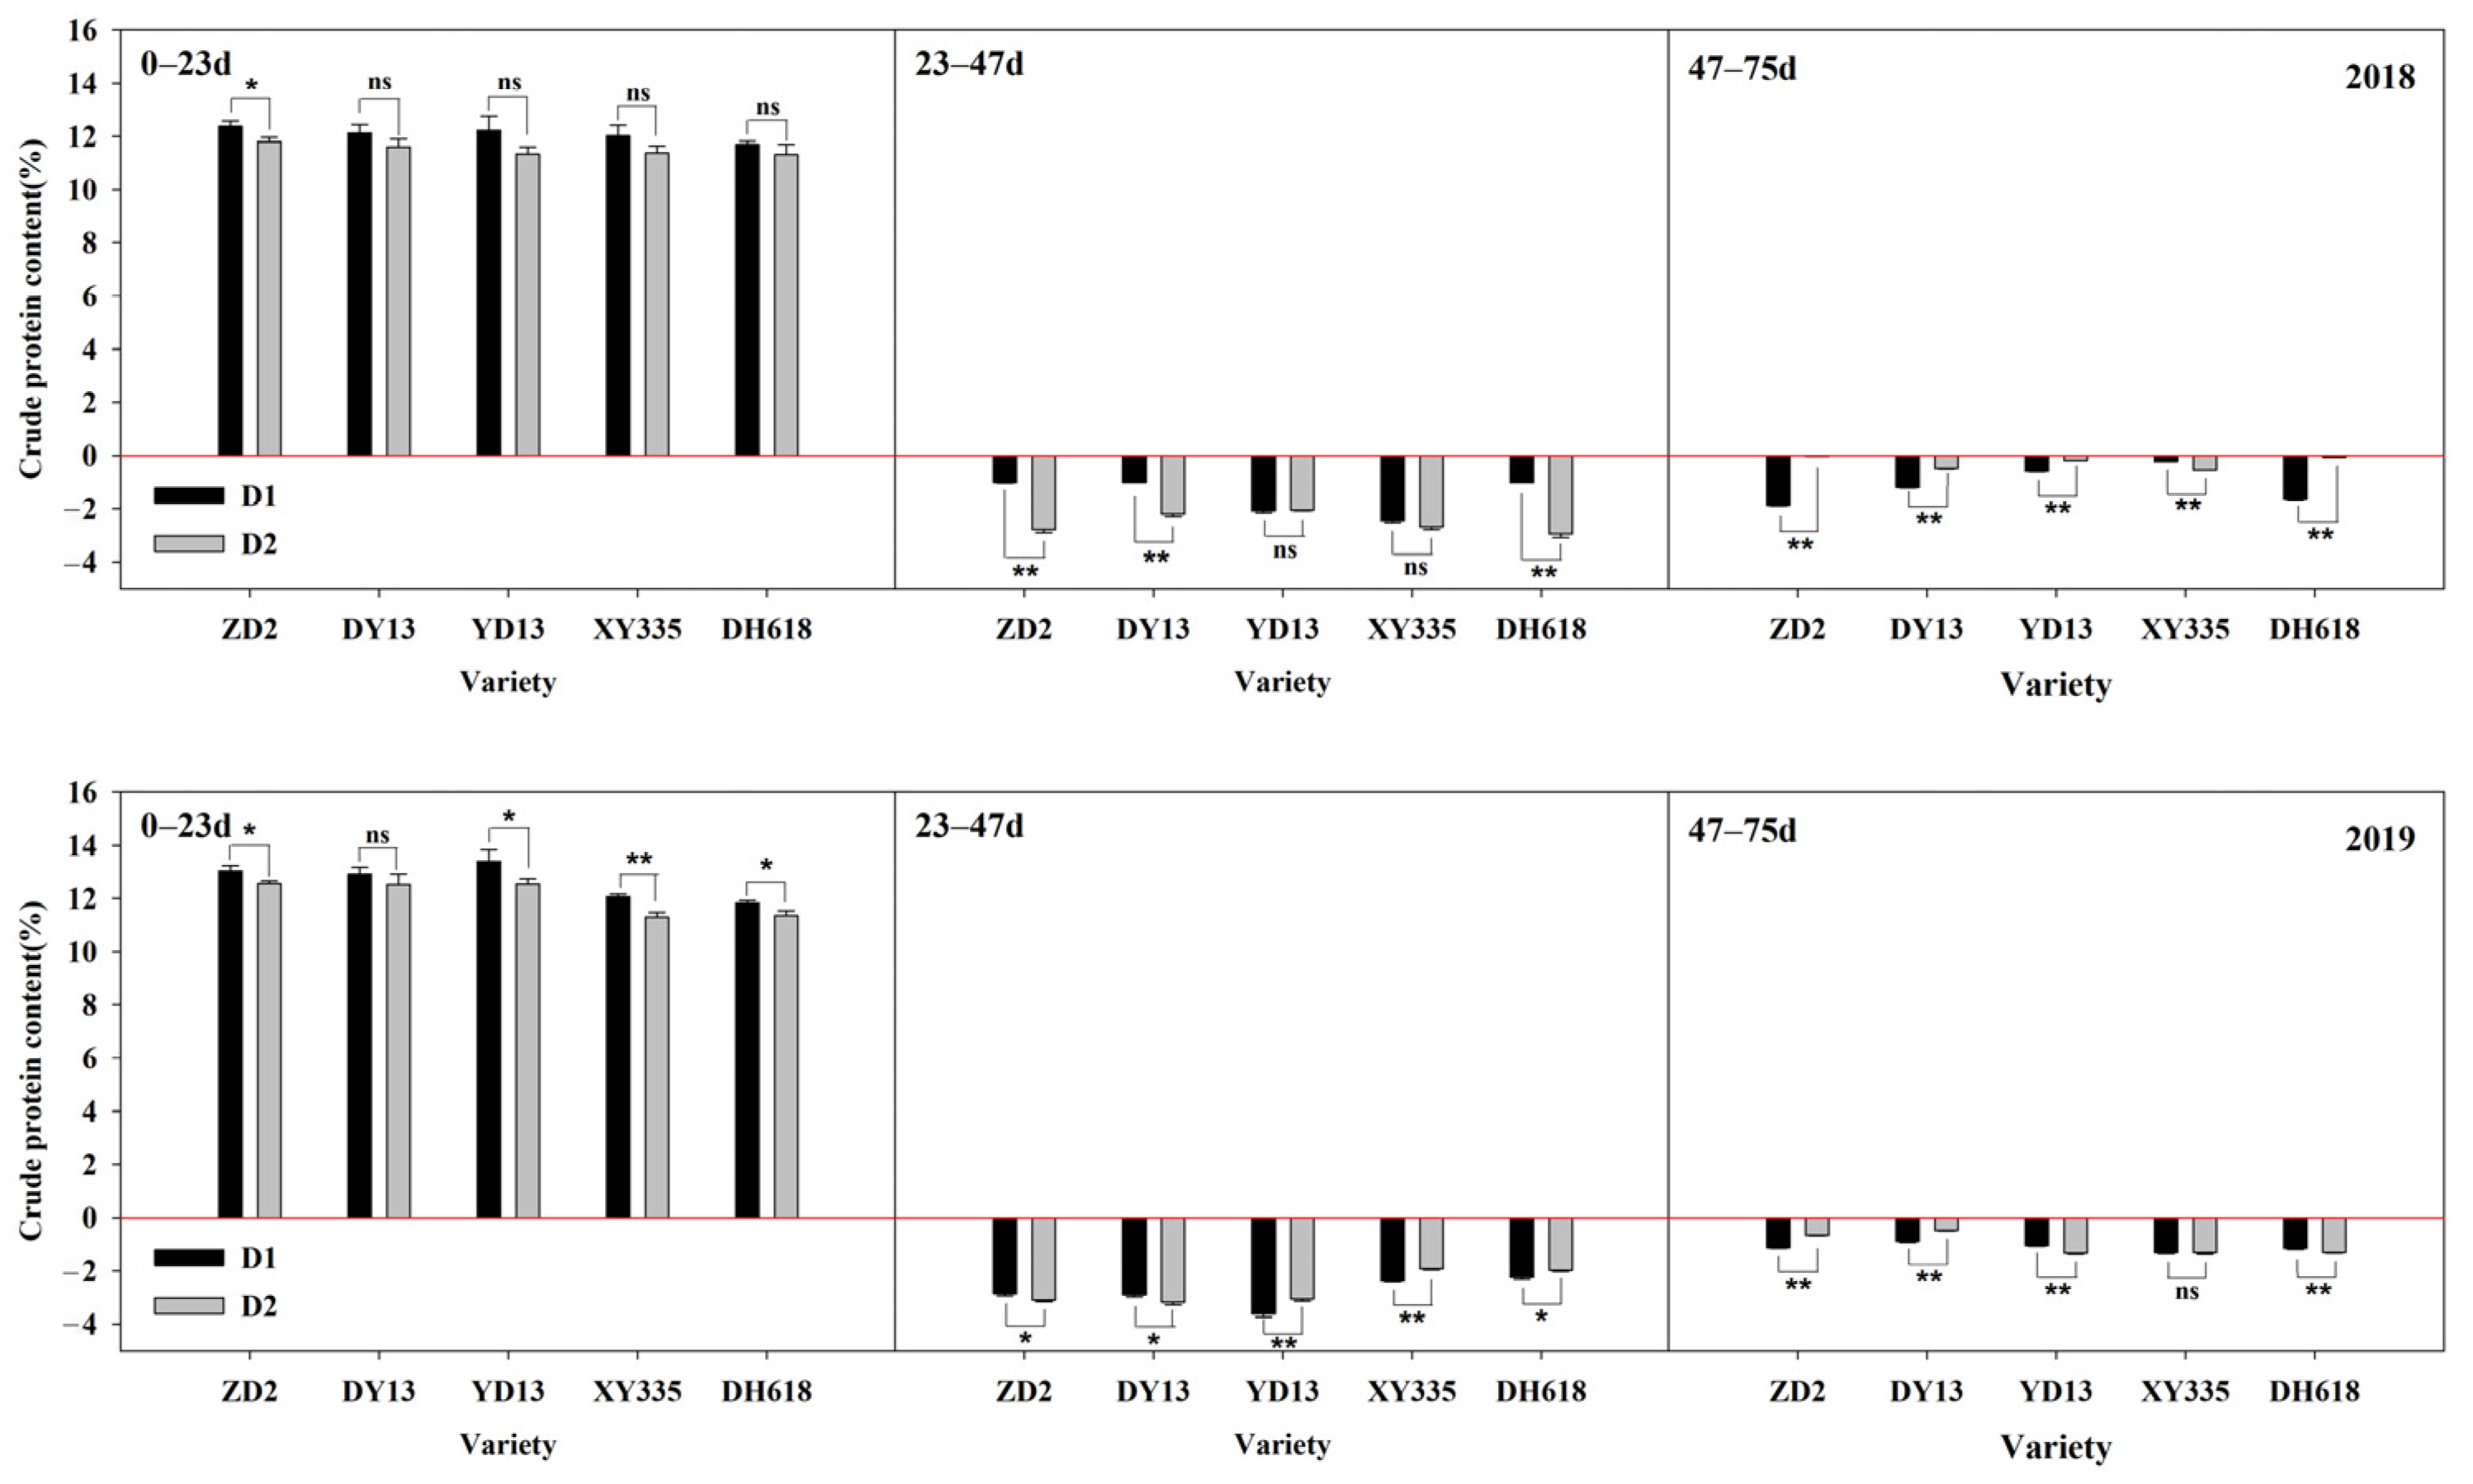
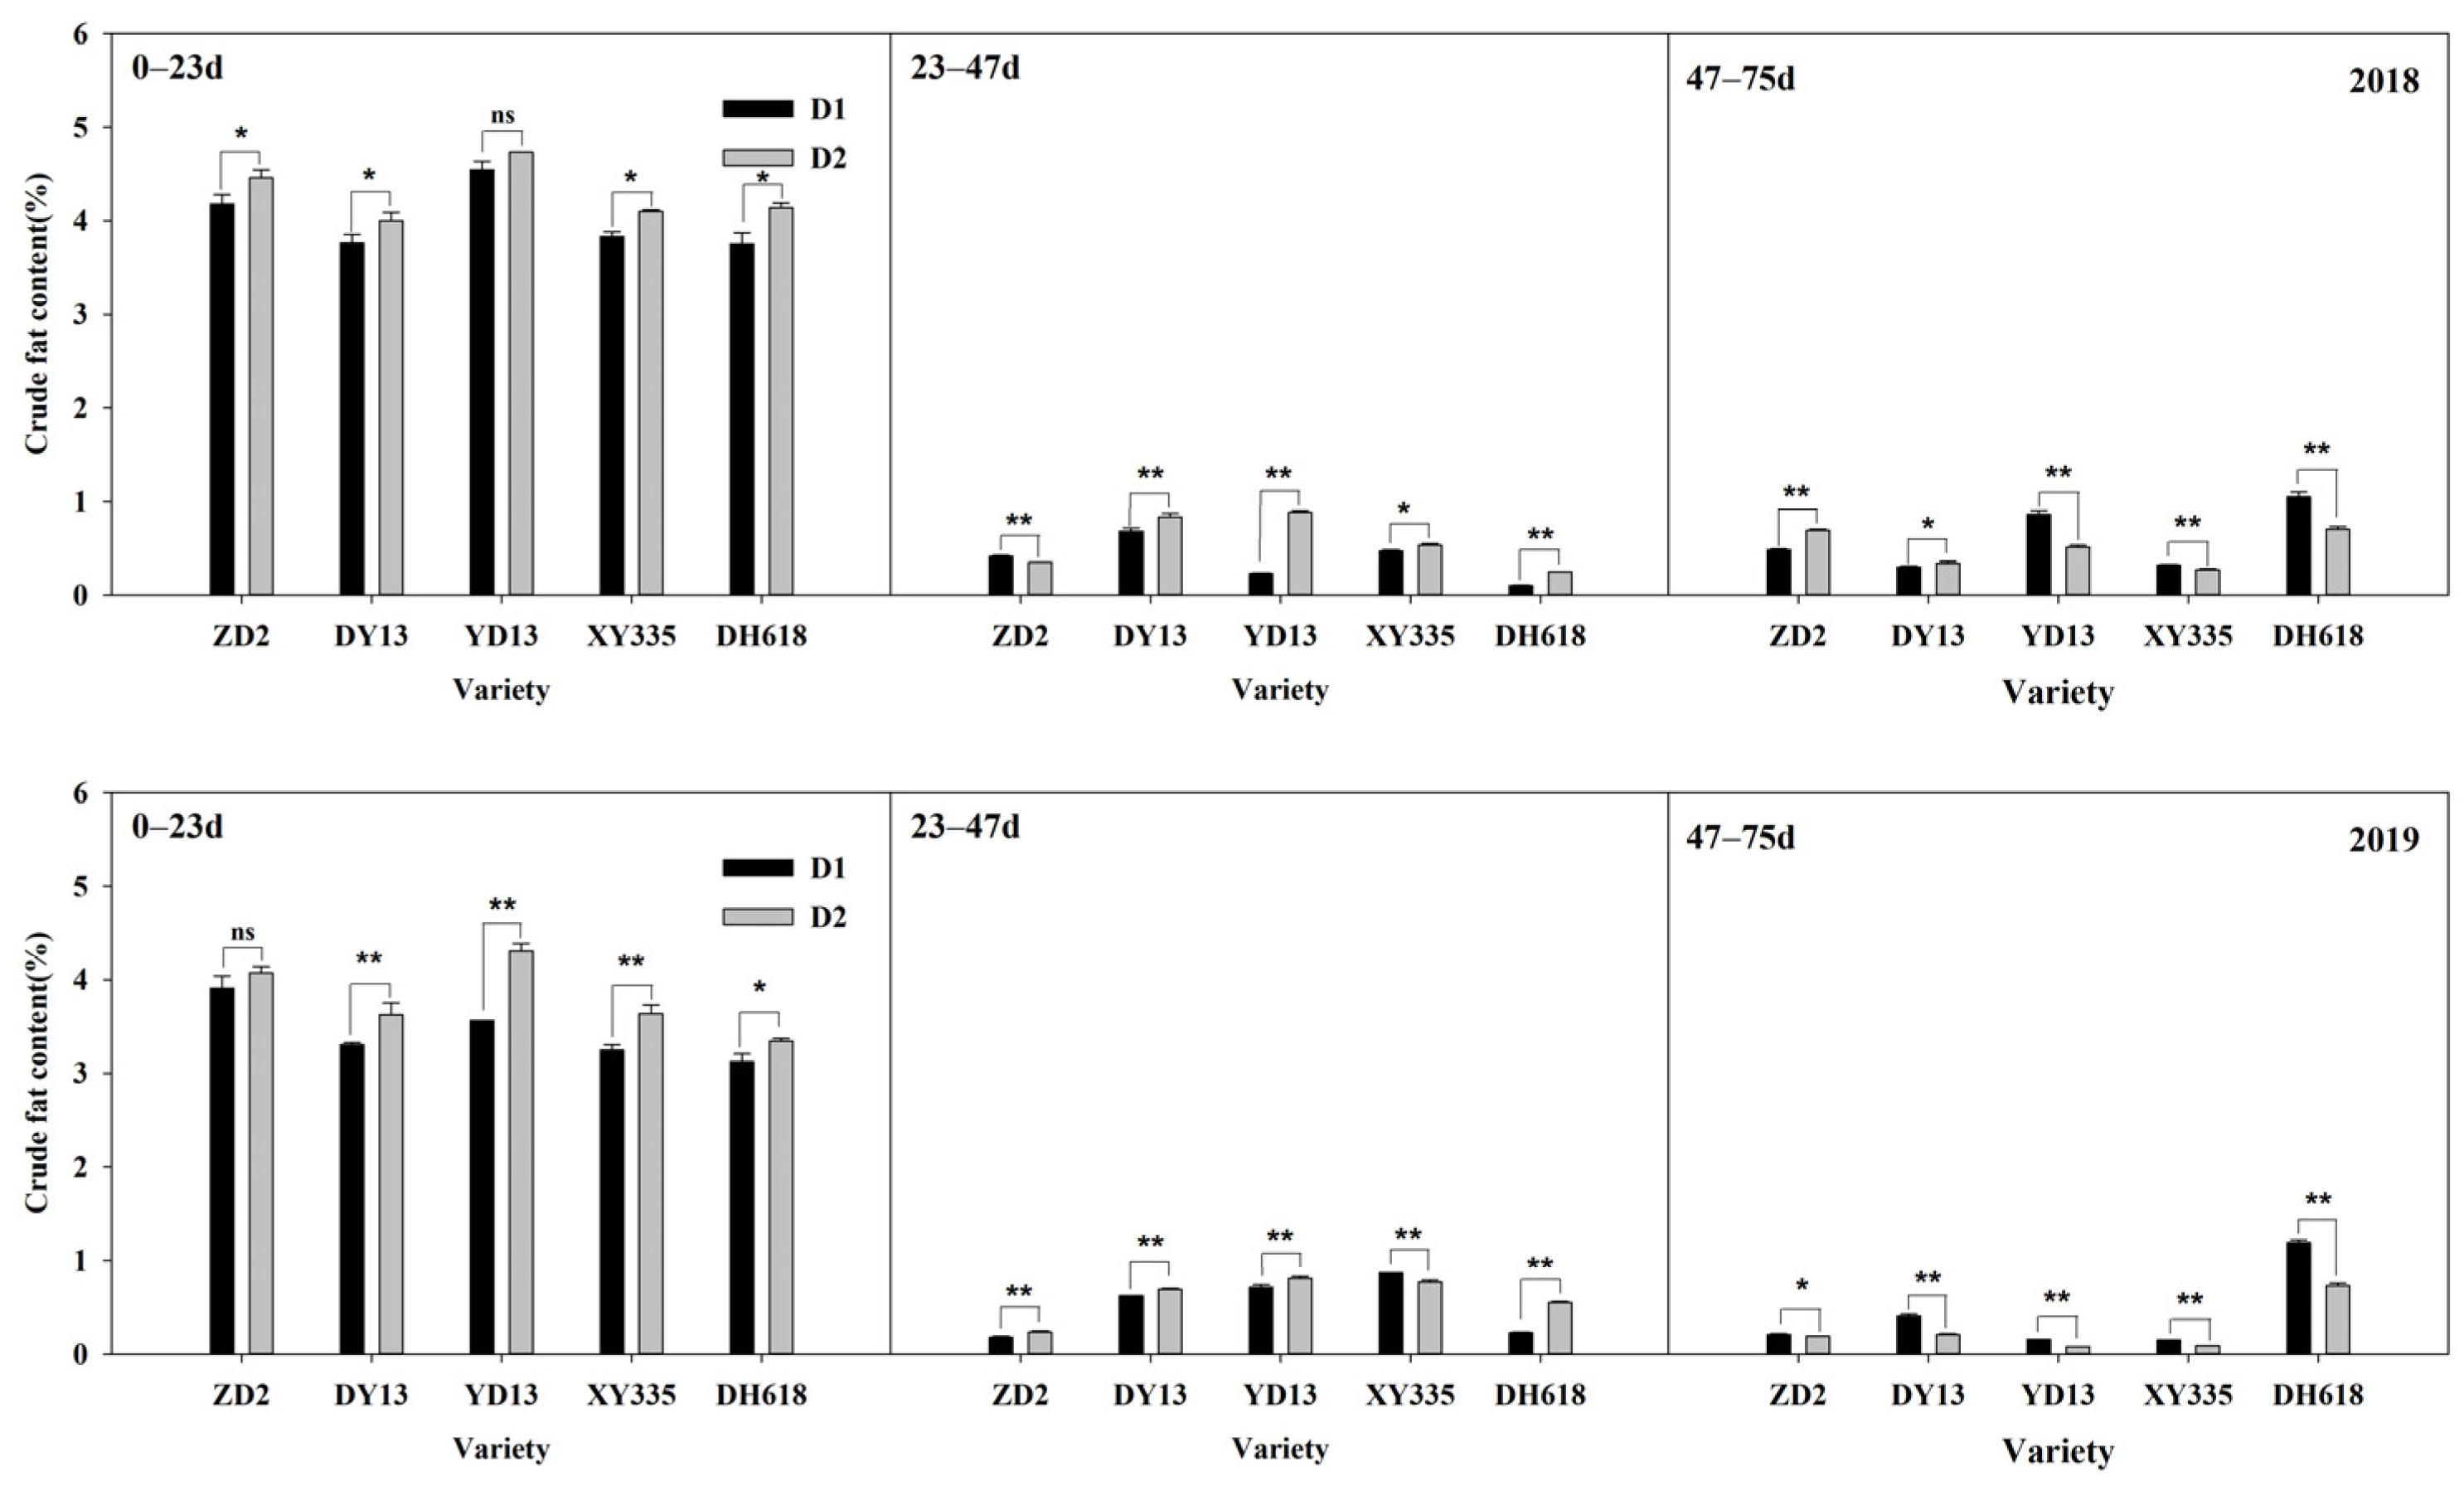
42] also believed that ordinary maize could achieve high quality and yield by selecting breeding materials and appropriate cultivation measures. At the same time, we also found that, compared with the 1970–2000s’ variety, at D1 density, the grain crude protein content of the 2010s’ variety (DH618) at physiological maturity decreased by 1.42–8.22%, the total starch content increased by 0.02–2.04%, the crude fat content changed by −14.12–3.47%, and the total soluble sugar content changed by −0.71–7.04%. These studies differed slightly from Chen et al. [23]’s, which may have been caused by the inconsistent selection of years and varieties studied.
The relationship between planting density and grain nutritional content is intricate, involving how planting density impacts individual plant nutrient absorption, photosynthetic product synthesis, transport, and distribution. Thus, it is susceptible to the effects of production levels and cultivation measures. Due to differences in experimental materials and settings, local and foreign researchers’ conclusions on maize grain nutritional quality (a complex quantitative feature regulated by micro-influences and numerous genes) must be more consistent. Cusicanqui et al. [43] pointed out in their study that the crude protein content of grains decreased with the increase in density. Lang et al. [28] reported that maize protein and fat content declined with density and nitrogen application levels and hybrid performance varied. Ahmadi et al. [
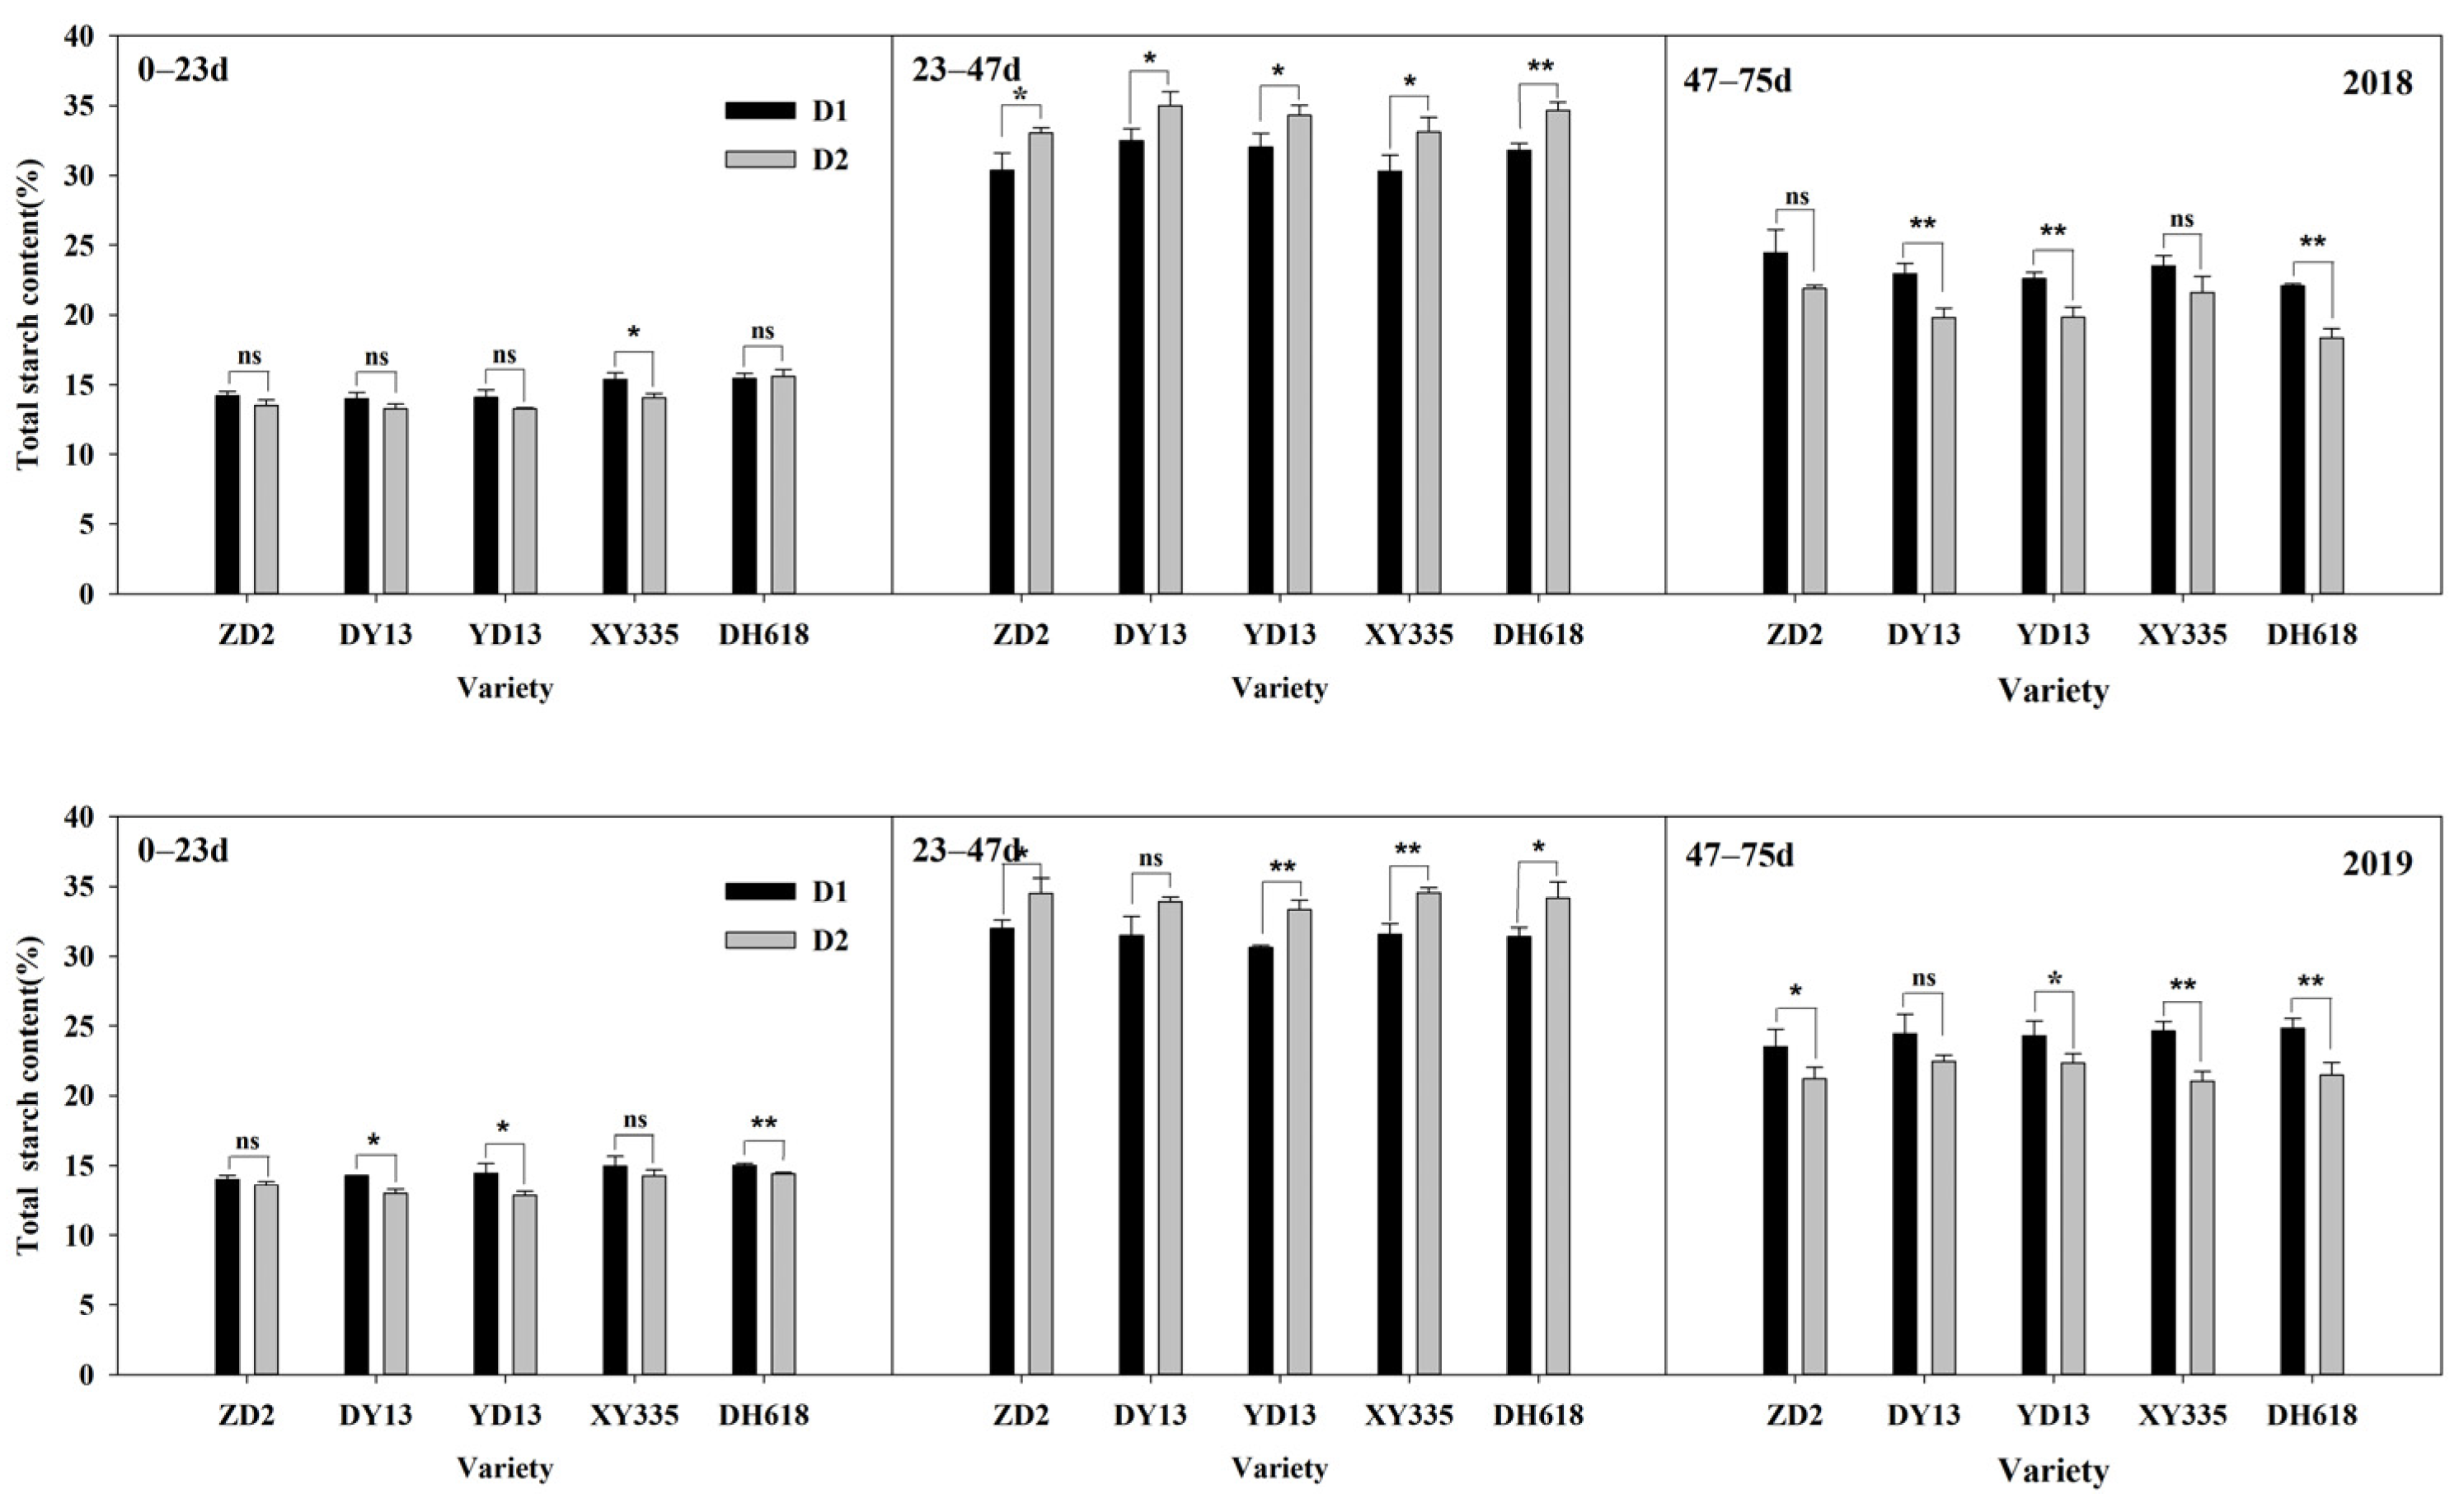
44] showed that grains’ crude protein content increased linearly with the increase in planting density. After densification, the contents of crude protein and crude fat in grains of various varieties from the 1970–2010s during physiological maturity were reduced by 4.15–8.50% and 3.0–11.18%; the contents of total starch and total soluble sugar increased by 0.65–1.65% and 39.44–69.01%, respectively.
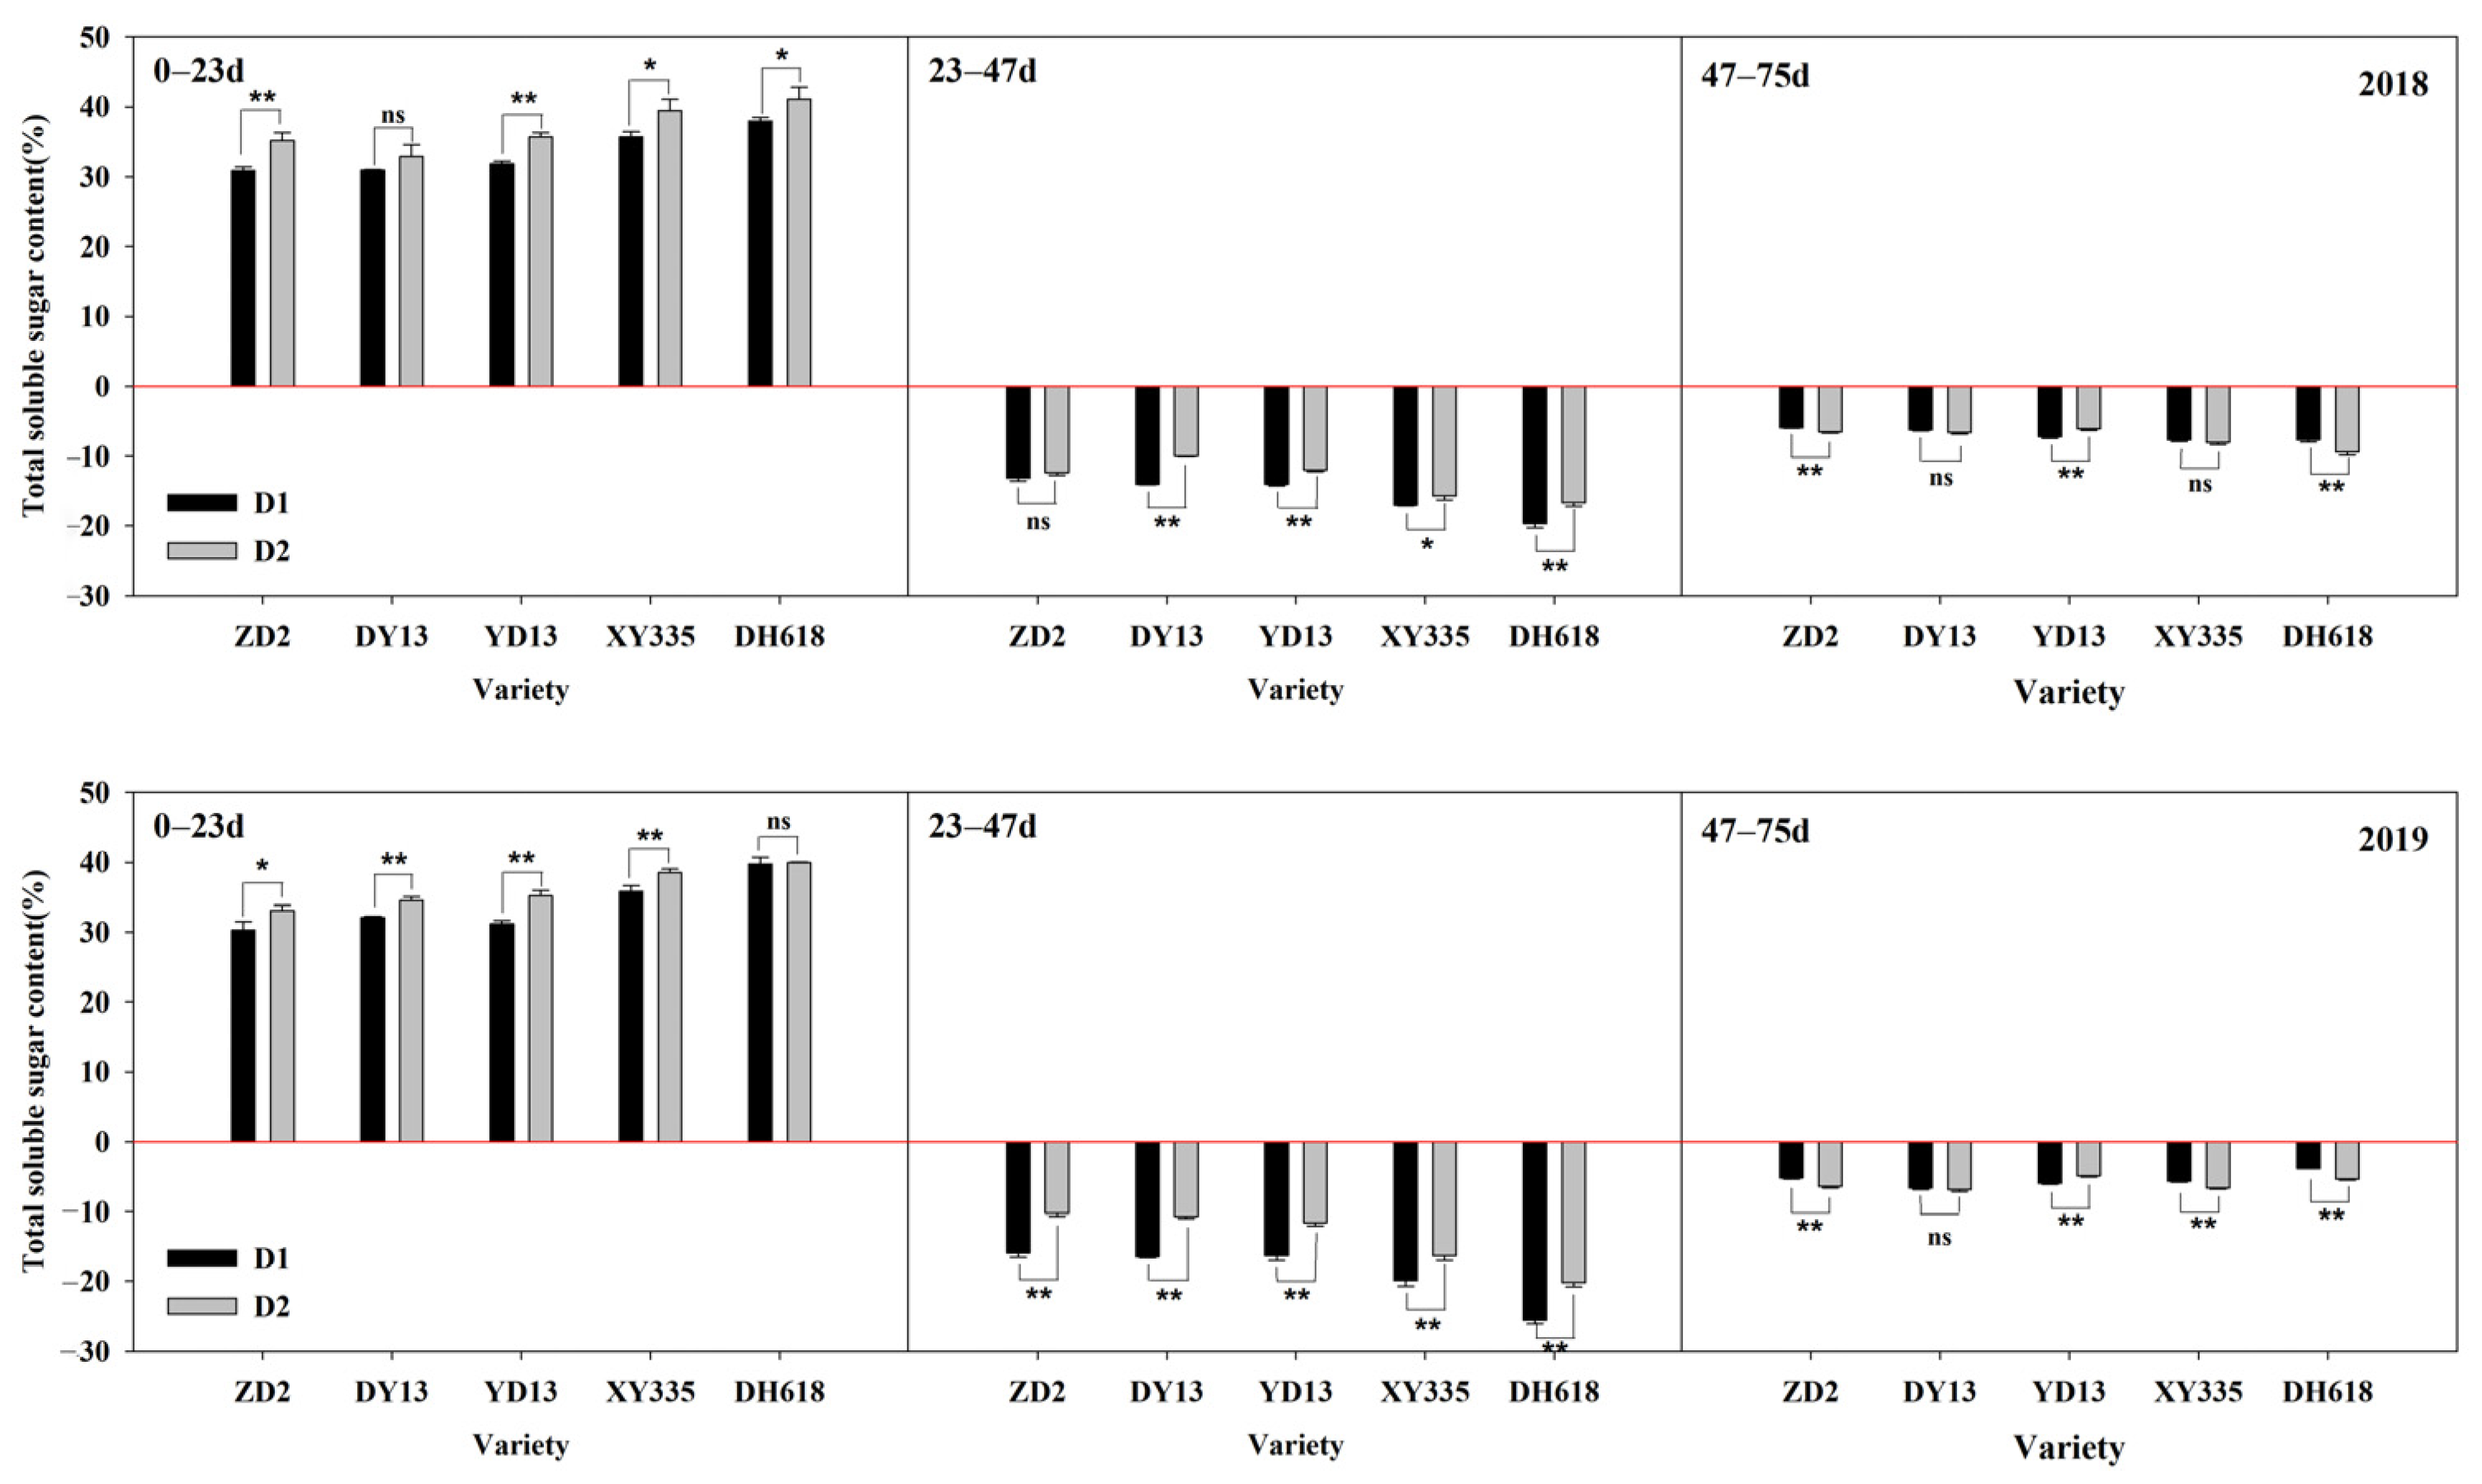
Further investigation showed that, after increasing density, the rise in total starch content in grains of all varieties from the 1970–2010s was mainly related to a 7.72–9.19% increase in starch accumulation in grains 23–47 days after anthesis. The higher crude fat and soluble sugar accumulation 0–23 days after anthesis were beneficial to the increase in total starch accumulation 23–47 days after anthesis, but the effects of these two nutrient quality components on total starch accumulation 23–47 days after anthesis were different, among which soluble sugar played a more direct role. However, crude fat positively connected with total starch accumulation in grains 23–47 days after anthesis, primarily due to an indirect influence.

5. Conclusions

Under low-density conditions, there was a significant increase in yield of the 2010s’ variety (DH618) compared with the 1970s’–2000s’ varieties, as well as a different degree of alteration in grain nutrient quality components 75 days after anthesis. After densification, the total starch content of the grains 75 days after anthesis increased to different degrees in all varieties from the 1970s to 2010s, and the increase in the total starch content of the grains was mainly due to a more substantial increase in the accumulation of starch in the grains 23–47 days after anthesis, with an increase of 7.72% to 9.19%. Higher grain crude fat and total soluble sugar accumulation 0–23 days after anthesis favored increased grain total starch accumulation 23–47 days after anthesis. In particular, the accumulation of grain crude fat 0–23 days after anthesis was positively correlated with the accumulation of total starch in the grain 23–47 days after anthesis mainly through indirect effects, and the accumulation of total soluble sugar in the grain 0–23 days after anthesis was through direct effects. Ultimately, densification conditions also contributed to a significant increase in yield across all eras of the varieties based on changes in grain nutrient quality, with a more significant increase in yield due to densification and a smaller decrease in grain crude fat content due to densification 75 days after anthesis in the 2010s’ variety (DH618). Therefore, in cultivation and production processes that do not require special requirements for the nutritional quality components of maize grains, we suggest that the use of a representative high-yielding maize variety from the 2010s (DH618), together with appropriate planting at close planting levels, can significantly increase maize yields based on an increase in the total starch content of the grains at physiological maturity.

Author Contributions

F.W., L.W. and J.G. performed the experiments. F.W., L.W., D.M. and X.Y. analyzed the data. X.Y., J.G. and D.M. revised the manuscript critically for important intellectual content. F.W., L.W., H.G., H.Z. and X.Y. wrote the paper. All authors have read and agreed to the published version of the manuscript.

Funding

This study was supported by the National Maize Industrial Technology Systems (Grant No. CARS-02-50), Key Program of Action Plan to Revitalize Inner Mongolia through Science and Technology (KJXM2020001-06), Science and Technology Innovation Projects for High Yield and Efficiency of Grain (Grant No. 2017YFD0300804), Key Laboratory of Crop Cultivation and Genetic Improvement of Inner Mongolia Autonomous Region (None), Inner Mongolia Science and Technology Major Special Project (2021ZD0003-1), Program for Improving the Scientific Research Ability of Youth Teachers of Inner Mongolia Agricultural University (Grant No. BR220151, BR221048), Natural Science Foundation of Inner Mongolia (Grant No. 2023QN03042) and the Crop Science Observation and Experiment Station in Loess Plateau of North China, Ministry of Agriculture, P.R. of China (Grant No. 25204120).

Institutional Review Board Statement

Not applicable.

Data Availability Statement

Not applicable.

Conflicts of Interest

The authors declare no conflict of interest.

References

  1. Grassinia, P.; Thorburnb, J.; Burrc, C.; Cassmana, K.G. High-yield irrigated maize in the Western U.S. Corn Belt: I. On-farm yield, yield potential, and impact of agronomic practices. Field Crops Res. 2011, 120, 142–150. [Google Scholar] [CrossRef]
  2. Gandhi, V.P.; Zhou, Z.Y. Food demand and the food security challenge with rapid economic growth in the emerging economies of India and China. Food Res. Int. 2014, 63, 108–124. [Google Scholar] [CrossRef]
  3. Caroline, B.; Douglas, J.S.; Subbu, K.; Steve, C.; Cathy, H.; Douglas, D. Organic Corn Production Practices and Profitability in the Eastern U.S. Corn Belt. Sustainability 2021, 13, 8682. [Google Scholar]
  4. Gbadebo, A.O.; Keith, L.K.; Langeveld, J.W.A. Structural Break and Causal Analyses of U.S. Corn Use for Ethanol and Other Corn Market Variables. Agriculture 2021, 11, 267–282. [Google Scholar]
  5. MacLaren, C.; Storkey, J.; Menegat, A.; Helen, M.; Katharina, D.S. An ecological future for weed science to sustain crop production and the environment. A review. Agron. Sustain. Dev. 2020, 40, 24. [Google Scholar] [CrossRef]
  6. Liu, Y.; Hou, T.R.; Guo, X.P.; Liu, J.G.; Bai, X.H.; Dong, G.H.; Dong, S.T.; Kong, X.M.; Jia, C.L.; Wu, M.Q.; et al. Analysis on development status and countermeasures of shandong corn industry. J. Shandong Agric. Univ. 2017, 19, 24–30. [Google Scholar]
  7. Ma, D.L.; Li, S.K.; Zhai, L.C.; Yu, X.F.; Xie, R.Z.; Gao, J.L. Response of maize barrenness to density and nitrogen increases in Chinese cultivars released from the 1950s to 2010s. Field Crops Res. 2020, 250, 107766–107775. [Google Scholar] [CrossRef]
  8. Tollenaar, M.; Lee, E.A. Yield potential, yield stability and stress tolerance in maize. Field Crops Res. 2002, 75, 161–169. [Google Scholar] [CrossRef]
  9. Guo, Q.; Huang, G.M.; Guo, Y.L.; Zhang, M.C.; Zhou, Y.Y.; Duan, L.S. Optimizing irrigation and planting density of spring maize under mulch drip irrigation system in the arid region of Northwest China. Field Crops Res. 2021, 266, 108141–108154. [Google Scholar] [CrossRef]
  10. Meng, Q.F.; Hou, P.; Wu, L.; Chen, X.P.; Cui, Z.L.; Zhang, F.S. Understanding production potentials and yield gaps in intensive maize production in China. Field Crops Res. 2013, 143, 91–97. [Google Scholar] [CrossRef]
  11. Liu, G.Z.; Hou, P.; Xie, R.Z.; Ming, B.; Wang, K.R.; Xu, W.J.; Liu, W.M.; Yang, Y.S.; Li, S.K. Canopy characteristics of high-yield maize with yield potential of 22.5 Mg ha−1. Field Crops Res. 2017, 213, 221–230. [Google Scholar] [CrossRef]
  12. Wang, X.K.; Wang, G.; Turner, N.C.; Xing, Y.Y.; Li, M.T.; Guo, T. Determining optimal mulching, planting density, and nitrogen application to increase maize grain yield and nitrogen translocation efficiency in Northwest China. BMC Plant Biol. 2020, 20, 282. [Google Scholar] [CrossRef] [PubMed]
  13. Antonietta, M.; Fanello, D.D.; Acciaresi, H.A.; Guiamet, J.J. Senescence and yield responses to plant density in stay green and earlier-senescing maize hybrids from Argentina. Field Crops Res. 2014, 155, 111–119. [Google Scholar] [CrossRef]
  14. Li, H.B.; Wang, X.; Brooker, R.W.; Rengel, Z.; Zhang, F.S.; Davies, W.J.; Shen, J.B. Root competition resulting from spatial variation in nutrient distribution elicits decreasing maize yield at high planting density. Plant Soil 2019, 439, 219–232. [Google Scholar] [CrossRef]
  15. Liu, D.H.; Jia, Q.M.; Li, J.; Zhang, P.; Ren, X.L.; Jia, Z.K. Increased photosynthesis and grain yields in maize grown with less irrigation water combined with density adjustment in semiarid regions. PeerJ 2020, 8, 9959–9987. [Google Scholar] [CrossRef]
  16. Testa, G.L.; Reyneri, A.; Blandino, M. Maize grain yield enhancement through high plant density cultivation with different inter-row and intra-row spacings. Eur. J. Agron. 2016, 72, 28–37. [Google Scholar] [CrossRef]
  17. Yang, H.W.; Chai, Q.; Yin, W.; Hu, F.L.; Qin, A.Z.; Fan, Z.L.; Yu, A.Z.; Zhao, C.; Fan, H. Yield photosynthesis and leaf anatomy of maize in inter- andmono-cropping systems at varying plant densities. Crop J. 2021, 9, 893–903. [Google Scholar]
  18. Wang, L.Q.; Yu, X.F.; Gao, J.L.; Ma, D.L.; Hu, S.P.; Guo, H.H.; Liu, A.Y. Response of grain yield formation to planting density of maize varieties in different eras. Acta Agron. Sin. 2022, 48, 2617–2629. [Google Scholar]
  19. Parvejmd, R.; Hurburgh, C.R.; Hanna, H.M.; Licht, M.A. Dynamics of corn dry matter content and grain quality after physiological maturity. Agron. J. 2019, 112, 998–1011. [Google Scholar] [CrossRef]
  20. Demeke, K.H. Nutritional quality evaluation of seven maize varieties grown in Ethiopia. Biochem. Mol. Biol. 2018, 3, 45–48. [Google Scholar]
  21. Galani, Y.; Orfila, C.; Gong, Y. A review of micronutrient deficiencies and analysis of maize contribution to nutrient requirements of women and children in Eastern and Southern Africa. Crit. Rev. Food Sci. Nutr. 2022, 62, 1568–1591. [Google Scholar] [CrossRef]
  22. Duvick, D.N. What Is Yield? In Developing Drought-and Low N-T Olerant Maize; Edmeades, G.O., Banziger, M., Mickelson, H.R., Pena-Valdivia, C.B., Eds.; CIMMYT: Mexico City, Mexico, 1996; pp. 332–335. [Google Scholar]
  23. Chen, X.M.; Liang, X.G.; Zhao, X.; Gao, Z.; Wu, G.; Shen, S.; Lin, S.; Zhou, L.L.; Zhou, S.L. Analysis on the trends of yield and quality related traits for maize hybrids released in china over the past years. Sci. Agric. Sin. 2018, 51, 4020–4029. [Google Scholar]
  24. Tian, L.; Wang, C.; Li, H.L.; Sun, H.T. Comparative analysis of nutritional components of maize with different planting densities from the perspective of ecological environment. Arab. J. Geosci. 2021, 14, 1205–1215. [Google Scholar] [CrossRef]
  25. Amanullah, S.P. Timing and rate of nitrogen application influence grain quality and yield in maize planted at high and low densities. J. Sci. Food Agric. 2010, 90, 21–29. [Google Scholar] [CrossRef] [PubMed]
  26. Rafiq, M.A.; Ali, A.; Malik, M.A.; Hussain, M. Effect of fertilizer levels and plant densities on yield and protein contents of autumn planted maize. Pak. J. Agric. Sci. 2010, 47, 201–208. [Google Scholar]
  27. Center, C.F.; Eheart, J.F.; Linkous, W.N. Effects of Location, Hybrid, Fertilizer, and Rate of Planting on the Oil and Protein Contents of Corn Grain. Agron. J. 1956, 48, 63–67. [Google Scholar]
  28. Lang, A.L.; Pendleton, J.W.; Dungan, G.H. Influence of Population and Nitrogen Levels on Yield and Protein and Oil Contents of Nine Corn Hybrids. Agron. J. 1956, 48, 683–692. [Google Scholar] [CrossRef]
  29. Yu, N.N.; Ren, B.C.; Zhao, B.; Liu, P.; Zhang, J.W. Effects of nitrogen application rate on grain filling characteristics and nutritional quality of summer maize. Chin. J. Appl. Ecol. 2019, 30, 3771–3776. [Google Scholar]
  30. Rehman, Z.U.; Ijaz, N.; Ye, W.; Ijaz, Z. Design optimization and statistical modeling of recycled waste-based additive for a variety of construction scenarios on heaving ground. Environ. Sci. Pollut. Res. 2023, 30, 39783–39802. [Google Scholar] [CrossRef]
  31. Rehman, Z.U.; Khalid, U. Optimization of COVID-19 face mask waste fibers and silica fume as a balanced mechanical ameliorator of fat clay using response surface methodology. Environ. Sci. Pollut. Res. 2022, 29, 17001–17016. [Google Scholar] [CrossRef]
  32. Shah, A.N.; Tanveer, M.; Abbas, A.; Yildirim, M.; Shah, A.A.; Ahmad, M.I.; Wang, Z.W.; Sun, W.W.; Song, Y.H. Combating Dual Challenges in Maize Under High Planting Density: Stem Lodging and Kernel Abortion. Front. Plant Sci. 2021, 12, 699085. [Google Scholar] [CrossRef] [PubMed]
  33. Qin, X.L.; Feng, F.; Li, Y.J.; Xu, S.T.; Siddique, K.H.; Liao, Y.C. Maize yield improvements in China: Past trends and future directions. Plant Breed. 2016, 135, 166–176. [Google Scholar] [CrossRef]
  34. Han, K.; Yin, F.W.; Liu, P. Planting density and N application rate balance maize agronomic and environmental effect. Nutr. Cycl. Agroecosystems 2020, 117, 337–349. [Google Scholar] [CrossRef]
  35. Ma, D.L.; Xie, R.Z.; Liu, X.; Niu, X.K.; Hou, P.; Wang, K.R.; Lu, Y.L.; Li, S.K. Lodging-Related Stalk Characteristics of Maize Varieties in China since the 1950s. Crop Sci. 2015, 54, 2805–2814. [Google Scholar] [CrossRef]
  36. Shi, D.Y.; Li, Y.H.; Zhang, J.W.; Liu, P.; Zhao, B.; Dong, S.T. Increased plant density and reduced N rate lead to more grain yield and higher resource utilization in summer maize. J. Integr. Agric. 2016, 15, 2515–2528. [Google Scholar] [CrossRef]
  37. Sun, Q.; Zhang, S.H.; Li, X.H.; Meng, Z.D.; Ci, X.K.; Zhang, D.G.; Hao, Z.F.; Weng, J.F.; Bai, L.; Li, M.S. The trend of quality of maize varieties released extensively in different eras in china. Sci. Agric. Sin. 2014, 47, 2723–2730. [Google Scholar]
  38. Triboi, E.; Triboi, B.A. Productivity and grain or seed composition: A new approach to an old problem—Invited paper. Eur. J. Agron. 2002, 16, 163–186. [Google Scholar] [CrossRef]
  39. Duvick, D.N.; Cassman, K.G. Post–Green Revolution Trends in Yield Potential of Temperate Maize in the North-Central United States. Crop Sci. 1999, 39, 1622–1630. [Google Scholar] [CrossRef]
  40. Wang, Z.H.; Li, S.X.; Malhi, S. Effects of fertilization and other agronomic measures on nutritional quality of crops. J. Sci. Food Agric. 2008, 8, 7–23. [Google Scholar] [CrossRef]
  41. Ertiro, B.T.; Das, B.; Kosgei, T.; Tesfaye, A.T.; Labuschagne, M.T.; Worku, M.; Olsen, M.S.; Chaikam, V.; Gowda, M. Relationship between Grain Yield and Quality Traits under Optimum and Low-Nitrogen Stress Environments in Tropical Maize. Agronomy 2022, 12, 438–452. [Google Scholar] [CrossRef]
  42. Zhang, L.; Liang, Z.Y.; He, X.M.; Meng, Q.F.; Hu, Y.C.; Schmidhalter, U.; Zhang, W.; Zou, C.Q.; Chen, X.P. Improving grain yield and protein concentration of maize (Zea mays L.) simultaneously by appropriate hybrid selection and nitrogen management. Field Crops Res. 2020, 249, 107754–107765. [Google Scholar] [CrossRef]
  43. Cusicanqui, J.A.; Lauer, J.G. Plant Density and Hybrid Influence on Corn Forage Yield and Quality. Agron. J. 1999, 91, 911–915. [Google Scholar] [CrossRef]
  44. Ahmadi, M.; Wiebold, W.J.; Beuerlein, J.E. Grain yield and mineral composition of corn as influenced by endosperm type and nitrogen. Commun. Soil Sci. Plant 1993, 24, 2409–2426. [Google Scholar] [CrossRef]
Figure 1. Main meteorological factors during the growth period in the experimental area.
Agriculture 13 01835 g001
Figure 2. Effects of density on the yield of maize varieties from different eras. Note: “*” significant at p < 0.05, “**” significant at p < 0.01, “ns” significant at p > 0.05, the same below.
Agriculture 13 01835 g002
Figure 3. Effects of density on the nutritional quality of grains of maize varieties from different eras. Note: “*” significant at p < 0.05, “**” significant at p < 0.01, “ns” significant at p > 0.05.
Agriculture 13 01835 g003aAgriculture 13 01835 g003b
Figure 4. Correlation analysis between grain nutritional quality and yield. Note: the gray ellipse in the figure has a 95% confidence interval. Note: “*” significant at p < 0.05, “**” significant at p < 0.01.
Agriculture 13 01835 g004
Figure 5. Effects of density on the crude protein content of grains of maize varieties from different eras. Note: “*” significant at p < 0.05, “**” significant at p < 0.01, “ns” significant at p > 0.05.
Agriculture 13 01835 g005
Figure 6. Effects of density on the total starch content of grains of maize varieties from different eras. Note: “*” significant at p < 0.05, “**” significant at p < 0.01, “ns” significant at p > 0.05.
Agriculture 13 01835 g006
Figure 7. Effects of density on the crude fat content of grains of maize varieties from different eras. Note: “*” significant at p < 0.05, “**” significant at p < 0.01, “ns” significant at p > 0.05.
Agriculture 13 01835 g007
Figure 8. Effects of density on the total soluble sugar content of grains of maize varieties from different eras. Note: “*” significant at p < 0.05, “**” significant at p < 0.01, “ns” significant at p > 0.05.
Agriculture 13 01835 g008
Table 1. Variance analysis of the effect of density and variety on the grain yield of maize (F-value).
Sources of VariationYield
Years (Y)0.22
Varieties (V)600.54 **
Density (D)0.47
Y × V11.58 **
Y × D0.00
V × D145.69 **
Y × V × D17.42 **
Error MS0.056
Note: “**” significant at p < 0.01.
Table 2. Variance analysis of the effect of density and variety on the nutritional quality of maize grains (F-value).
Sources of VariationCrude Protein ContentTotal Starch ContentCrude Fat ContentTotal Soluble Sugar Content
Years (Y)29.05 **27.35 **66.41 **17.58 **
Varieties (V)103.17 **98.21 **104.17 **3196.62 **
Density (D)88.65 **161.83 **400.17 **27.62 **
Y × V1.171.806.15 **45.11 **
Y × D3.15 *3.87 **17.41 **2.17
V × D13.67 **0.031.0457.55 **
Y × V × D2.542.211.989.78 **
Error MS0.0470.1280.0160.170
Note: “*” significant at p < 0.05, “**” significant at p < 0.01, the same below.
Table 3. Variance analysis of the effect of density and variety on the crude protein content of maize (F-value).
Sources of VariationDf0–23 Days after Anthesis23–47 Days after Anthesis47–75 Days after Anthesis
Years (Y)160.29 **1090.63 **3104.23 **
Varieties (V)425.76 **100.05 **216.39 **
Density (D)164.60 **424.97 **4568.77 **
Y × V410.09 **289.55 **1021.47 **
Y × D10.00770.88 **3008.15 **
V × D41.17160.08 **1159.73 **
Y × V × D40.1155.14 **697.73 **
Error MS400.0810.0070.001
Note: “**” significant at p < 0.01.
Table 4. Variance analysis of the effect of density and variety on the total starch content of maize (F-value).
Sources of VariationDf0–23 Days after Anthesis23–47 Days after Anthesis47–75 Days after Anthesis
Years (Y)13.590.0435.69 **
Varieties (V)434.94 **2.193.19 *
Density (D)166.70 **144.80 **153.30 **
Y × V42.1237.32 **9.71 **
Y × D11.090.0230.21
V × D43.30 *0.140.89
Y × V × D41.990.051.25
Error MS400.1560.7240.735
Note: “*” significant at p < 0.05, “**” significant at p < 0.01.
Table 5. Variance analysis of the effect of density and variety on the crude fat content of maize (F-value).
Sources of VariationDf0–23 Days after Anthesis23–47 Days after Anthesis47–75 Days after Anthesis
Years (Y)1707.79 **462.94 **1575.10 **
Varieties (V)4200.17 **1863.64 **2128.06 **
Density (D)1222.74 **1044.08 **597.19 **
Y × V411.01 **473.23 **493.22 **
Y × D13.79135.31 **35.25 **
V × D42.28286.88 **244.87 **
Y × V × D410.17 **220.17 **75.65 **
Error MS400.0060.0000.000
Note: “**” significant at p < 0.01.
Table 6. Variance analysis of the effect of density and variety on the total soluble sugar content of maize (F-value).
Sources of VariationDf0–23 Days after Anthesis23–47 Days after Anthesis47–75 Days after Anthesis
Years (Y)10.27219.57 **625.93 **
Varieties (V)4158.59 **592.15 **43.66 **
Density (D)1157.29 **831.21 **73.61 **
Y × V43.77 *36.30 **163.88 **
Y × D14.47 *121.15 **2.19
V × D43.19 *10.94 **64.76 **
Y × V × D41.794.43 **2.48
Error MS400.7990.2350.048
Note: “*” significant at p < 0.05, “**” significant at p < 0.01.
Table 7. Stepwise regression analysis of nutritional quality components of grains.
IndexBStandard ErrorF-ValueSig
Intercept60.103.18357.470.00
X1−0.840.1437.200.00
X2−0.720.07122.950.00
X6−0.960.2514.760.00
X8−0.550.313.180.10
X90.140.0317.610.00
Note: X1 represents the increment in total starch in grains 0–23 days after anthesis, X2 represents the increment in total starch in grains 47–75 days after anthesis, X6 represents the increment in crude fat in grains 0–23 days after anthesis, X8 represents the increment in crude fat in grains 47–75 days after anthesis, X9 represents the increment in soluble sugar in grains 0–23 days after anthesis, same below.
Table 8. Path analysis of grain nutritional quality components.
IndexCorrelation CoefficientDirect Path CoefficientCoupling Diameter Factor
X1-YX2-YX6-YX8-YX9-YSum
X1−0.445−0.448 −0.1960.124−0.0500.1250.003
X2−0.866−0.819−0.107 0.1420.008−0.089−0.047
X60.276−0.2810.1980.413 0.002−0.0560.557
X8−0.130−0.116−0.1940.0570.004 0.119−0.014
X90.3660.303−0.1850.2420.052−0.045 0.063
Note: Y represents the grains’ total starch increment from 23 to 47 days after anthesis.
Disclaimer/Publisher’s Note: The statements, opinions and data contained in all publications are solely those of the individual author(s) and contributor(s) and not of MDPI and/or the editor(s). MDPI and/or the editor(s) disclaim responsibility for any injury to people or property resulting from any ideas, methods, instructions or products referred to in the content.

