Article

Estimation of Irrigation Water Use by Using Irrigation Signals from SMAP Soil Moisture Data

1
College of Hydraulic Science and Engineering, Yangzhou University, Yangzhou 225009, China
2
Foundation of Anhui Province Key Laboratory of Physical Geographic Environment, Chuzhou 239099, China
3
Henan Key Laboratory of Agrometeorological Ensuring and Applied Technique, China Meteorological Administration (CMA), Zhengzhou 450003, China
4
Key Laboratory of Virtual Geographic Environment, Nanjing Normal University, Ministry of Education, Nanjing 210046, China
5
State Key Laboratory Cultivation Base of Geographical Environment Evolution, Nanjing 210046, China
6
Jiangsu Center for Collaborative Innovation in Geographical Information Resource Development and Application, Nanjing 210046, China
7
Department of Geography, University of Wisconsin-Madison, Madison, WI 53706, USA
*
Author to whom correspondence should be addressed.
Agriculture 2023, 13(9), 1709; https://doi.org/10.3390/agriculture13091709
Submission received: 8 August 2023 / Revised: 26 August 2023 / Accepted: 28 August 2023 / Published: 29 August 2023
(This article belongs to the Special Issue Remote Sensing Technologies in Agricultural Crop and Soil Monitoring)

Abstract

:
Accurate irrigation water-use data are essential to agricultural water resources management and optimal allocation. The obscuration presented by ground cover in farmland and the subjectivity of irrigation-related decision-making processes mean that effectively identifying regional irrigation water use remains a critical problem to be solved. In view of the advantages of satellite microwave remote sensing in monitoring soil moisture, previous studies have proposed a method for estimating irrigation water use using the satellite microwave remote sensing of soil moisture. However, the method is affected by false irrigation signals from soil moisture increases caused by non-irrigation factors, causing irrigation water use to be overestimated. Therefore, the purpose of this study is to improve the estimation of irrigation water use in drylands by using irrigation signals from SMAP soil moisture data. In this paper, the irrigation water use in Henan Province is estimated by using the irrigation signals from SMAP (soil moisture active and passive) soil moisture data. Firstly, a method for recognizing irrigation signals in soil moisture data obtained by microwave satellite remote sensing was used. Then, an estimation model of the amount of irrigation water (SM2Rainfall model) was built on each data pixel of the satellite microwave remote sensing of soil moisture. Finally, the amount of irrigation water utilized in Henan Province was estimated by combining the irrigation signals and irrigation water-use estimation model, and the results were evaluated. According to the findings, this study improved the estimation accuracy of irrigation water use by using the irrigation signals in Henan Province. The result of this study is of great importance to accurately obtain irrigation water use in the region.

1. Introduction

Agricultural irrigation consumes large quantities of fresh water resources [1]. Long-term and large-scale agricultural irrigation drawing water from reservoirs, rivers and underground aquifers not only disturbs surface runoff and groundwater levels [2], but also significantly changes the process of surface water and heat cycles [3]. This disruption has also been associated with a series of ecological and environmental problems, such as river flow interruption, surface subsidence, soil salinization and desertification [4,5,6,7]. As the main parameter for quantifying farmland irrigation, irrigation water is a key foundation for discussing human irrigation activities and their impact on the Earth system [8,9]. However, methods for accurately measuring the use of regional irrigation water use are still in the exploratory stage. Furthermore, most countries lack effective means to obtain irrigation water in the region [10]. Therefore, developing an effective access to regional irrigation water has posed critical challenges to agriculture, water conservancy, geography and other disciplines.
Among the existing methods employed to determine regional irrigation water use, the statistical method, which was the earliest developed technique, is still the most commonly used for this purpose [11,12]. This method entails determining the total irrigation water use in each district through statistical methods, such as questionnaires and sampling surveys, followed by distributing the calculated total irrigation water use to the region level by level. Therefore, it obtains the spatial and temporal distribution of irrigation water use [13]. Statistical methods require long times and high costs to obtain irrigation water calculations, and they are difficult to rapidly implement in a large area. These drawbacks can result in poor timeliness of the obtained data concerning irrigation water. In addition, partition statistics can also yield an uneven distribution of data quality in terms of space.
As the development of hydrological and land surface process models progresses, some scholars have proposed numerical models to simulate irrigation process and calculate regional irrigation water use [14,15,16,17]. Specifically, this type of model sets the conditions of irrigation initiation and termination according to the soil moisture state in the field, keeping the soil moisture above a fixed threshold value. Afterwards, the model can be used for the calculation of irrigation water use throughout the entire irrigation process. For example, in CLM 4.5 (Community Land Model 4.5), when the field irrigation management mode of the crop module was turned on, the model checked the soil moisture content of the field at 0600 LST (local solar time) per day [15]. Irrigation started when the simulated crop leaf area was >0 and βt < 1 (βt = 1 indicated that the soil was wet, while βt = 0 indicated that the soil was dry). The condition for the termination of irrigation was reached when the soil moisture content met the target value (such as the field water capacity), and then the irrigation function stopped immediately [18]. The deficiency of the numerical model simulation method for calculating irrigation water use is also very obvious. Evidently, it was difficult to keep the simulated irrigation consistent with the real irrigation in terms of both time and frequency, potentially resulting in a large difference between the simulated value and the measured value.
In recent years, researchers have developed irrigation signals captured by the microwave satellite remote sensing of soil moisture to estimate regional irrigation water use [19,20]. The data product for the microwave satellite remote sensing of soil moisture used in this paper is SMAP, which has a relatively high accuracy and can provide soil moisture data at a depth of about 5 cm from the surface. This method assumes that an increase in farmland soil moisture is caused by irrigation and precipitation. By establishing a quantitative relationship model between surface soil moisture and surface water input, regional irrigation water use can be estimated by using the microwave satellite remote-sensing data of soil moisture. Researchers have demonstrated that this method can quickly and effectively capture the temporal and spatial distribution characteristics of regional irrigation-related water amounts. However, the current method is known for overestimating the amount of water used for irrigation [10]. One explanation for this phenomenon is that, in addition to containing irrigation signals caused by increases in soil moisture, satellite soil moisture data also contain false irrigation signals. Both false irrigation signals and irrigation signals are involved in estimating irrigation water use. Therefore, the irrigation water use is also calculated in the period without irrigation. As a result, the current satellite-based estimation method has been recognized as overestimating regional irrigation water use [19,21,22].
In general, compared with statistical methods and numerical simulation methods for estimating regional irrigation water use, microwave satellite remote sensing can make all-weather observations of the surface, and the obtained remote-sensing data can accurately reflect dynamic changes on the surface. Thus, the distribution of regional irrigation water use can be obtained in time. In view of this, this paper extracts irrigation signals from microwave satellite remote-sensing data of soil moisture by using an irrigation signal extraction method and constructed an irrigation water-use estimation model (SM2Rainfall Model) based on the satellite remote-sensing data of soil moisture. The purpose of this study is to improve the estimation of irrigation water use in dryland by using irrigation signals in SMAP soil moisture data.

2. Study Area and Datasets
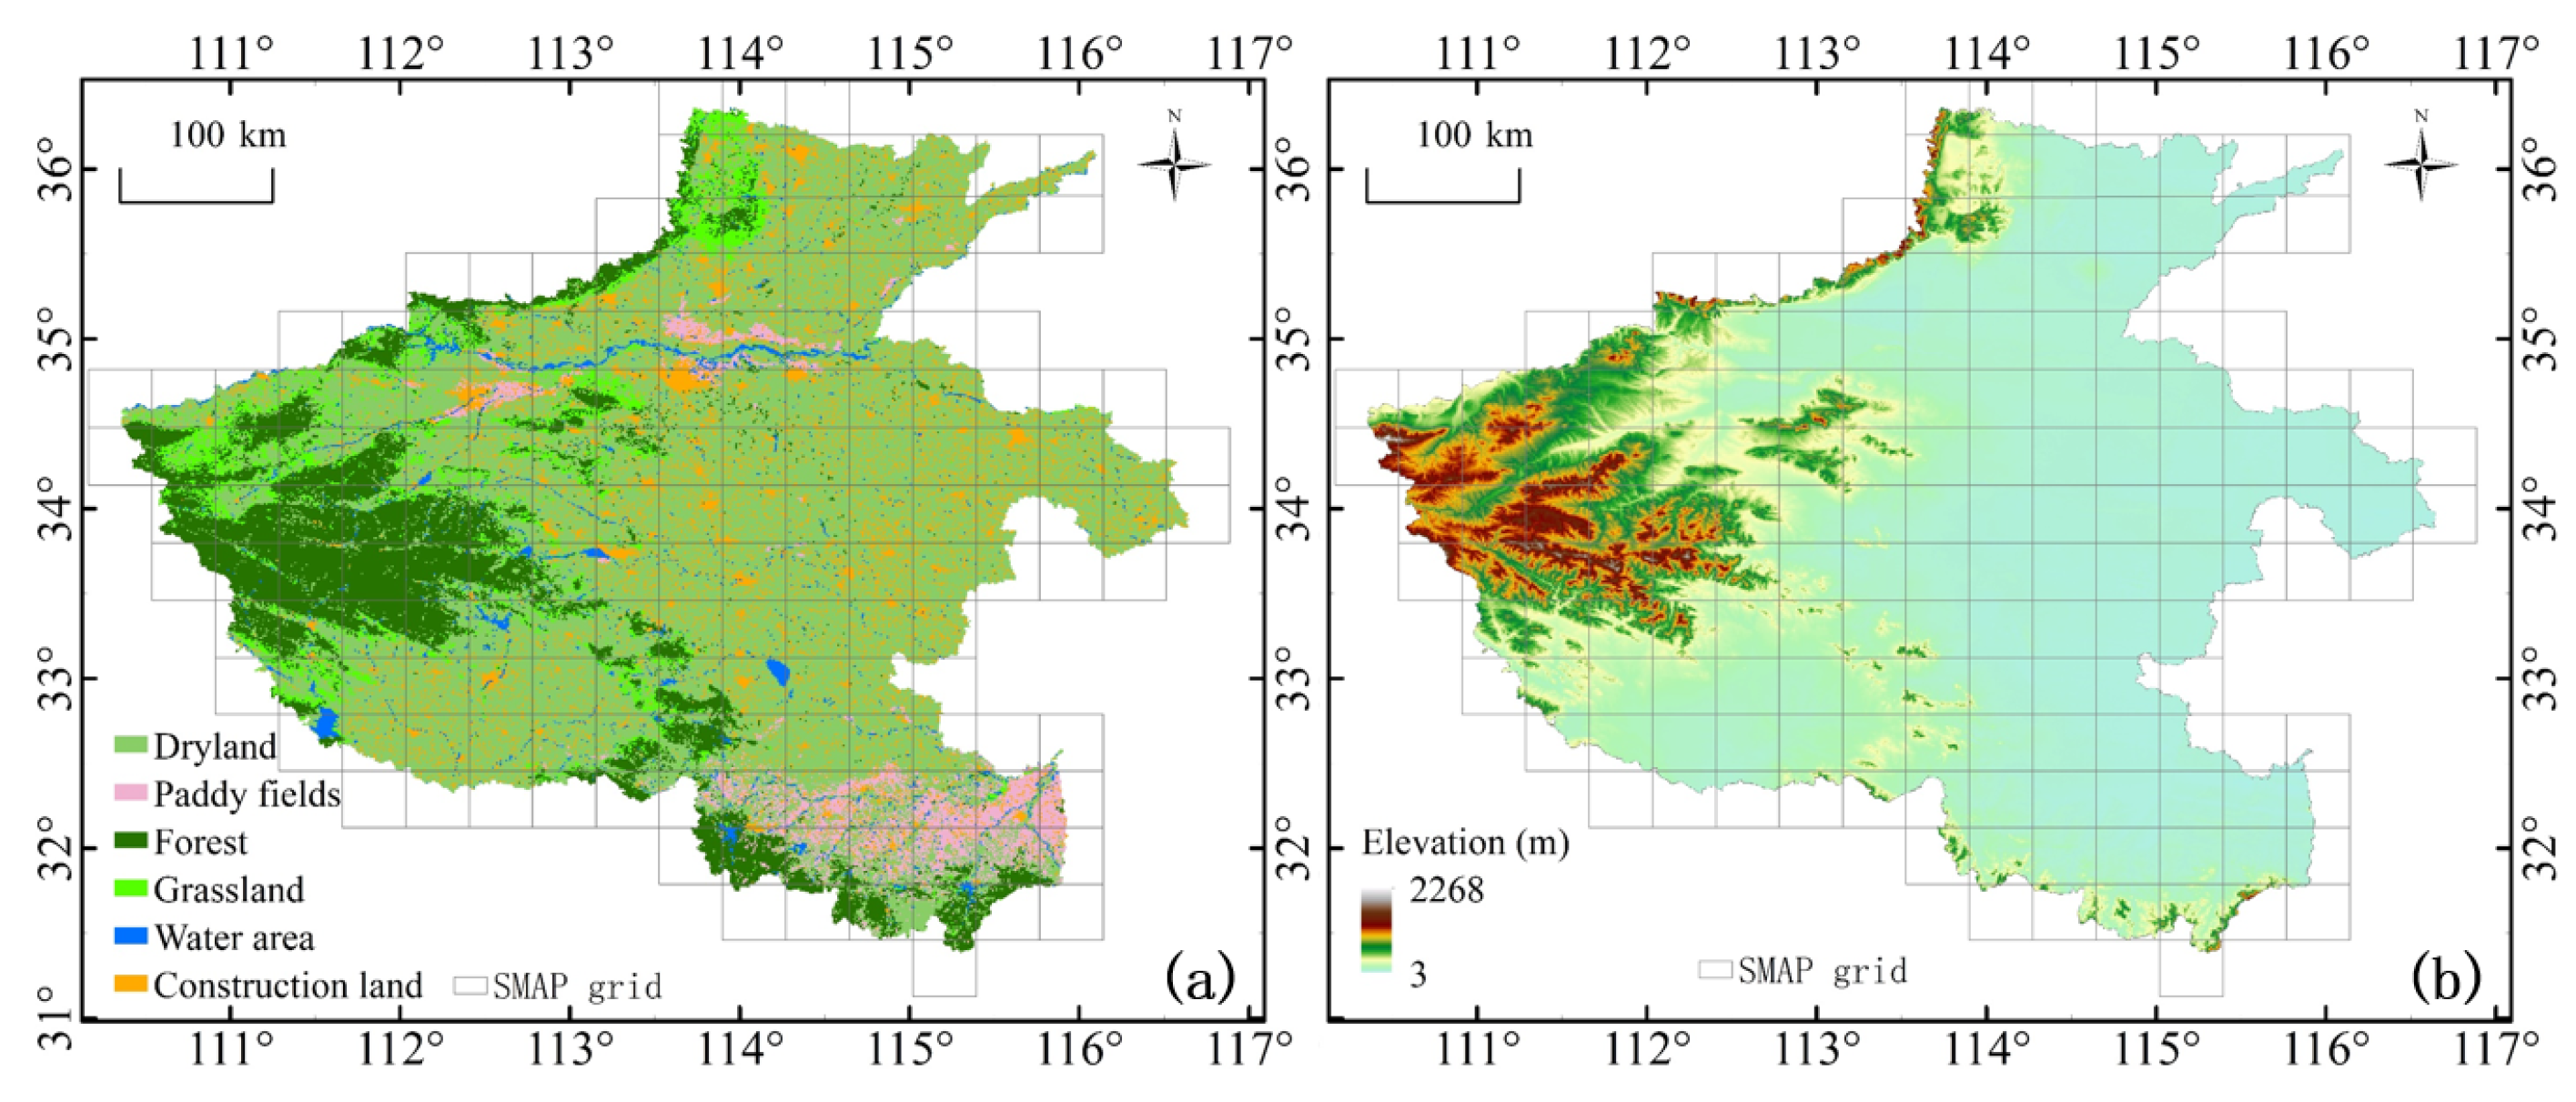
2.1. Study Area

Henan Province is located in the middle and lower reaches of the Yellow River in the southwest of the North China Plain, in the Central Plains, between 31–36.5° North latitude and 110–117° East longitude. Most of the study area is plain terrain, but a small part of the western area is mountainous terrain. In terms of climate, most of Henan Province is located in the warm temperate zone. The southern part spans the subtropical zone, belonging to the continental monsoon climate transition from the north subtropical zone to the warm temperate zone. It also has four distinct seasons, including rain and heat at the same time. The average precipitation in the region for many years has been in the range of 400–1200 mm, and the temporal and spatial distribution of precipitation has been uneven. More mountainous areas are found in the south and west, while less precipitation occurs in the central and northern regions. Moreover, 50–80% of the region’s precipitation is concentrated in summer, and the climate is dry and less rain occurs during the winter-crop-growing period. Drought is also a major factor affecting the yield of winter-grown crops. In the north-central part of the province, most winter crops must be irrigated repeatedly to alleviate the drought conditions.
According to recent statistics, the effective irrigated area of Henan Province reached 52,440 km2 by the end of 2016, accounting for approximately 70.5% of the total arable land area. About half of the cultivated land in the province needs irrigation (ORNL DAAC, Global Map of Irrigation Areas Version 4.0.1). Figure 1a illustrates the distribution of land use types in Henan Province. The grid in the figure shows the location of soil moisture data from the SMAP satellite. As can be seen from the figure, the main type of agricultural land in Henan Province is dry farmland. However, a small portion characterized by paddy fields and forests is distributed in the southern and western parts of the Henan Province. Figure 1b presents the topography of Henan Province. As the figure reveals, the topography of most areas in Henan Province is flat, with a small amount of mountainous landscape to the west.

2.2. Datasets

2.2.1. SMAP L3 Passive Soil Moisture Product

SMAP, developed by NASA, is a satellite designed to detect soil moisture on land. Launched on 31 January 2015, the satellite is in a polar sun-synchronous orbit satellite that can observe the same spot at 6 AM and 6 PM [23]. The SMAP satellite was originally designed to carry both L-band radar (1.26 GHz and 1.29 GHz) and L-band radiometer (1.41 GHz), enabling both active and passive observations of surface soil moisture. Unfortunately, due to the lack of a power supply and other reasons, the radar equipment stopped working shortly after its launch. At present, the microwave radiometer equipment carried on the satellite platform still works normally. It can cover the surface of the Earth within 2–3 days to provide radiation signal data [24]. On ground that is not frozen or covered with water, SMAP measures moisture in the top layer of soil and uses this information to create a global map of soil moisture.
This study used SMAP L3-grade soil moisture products. The L3 band refers to the data product of global soil moisture and vegetation moisture generated by processing, interpolation, denoising and other steps provided by the L-band microwave radiometer. The time resolution of the product is usually once a day and it has a global coverage capability. The data download address is: https://search.earthdata.nasa.gov/search or https://nsidc.org/data/smap/smap-data.html (access on 1 January 2018). The microwave radiometer uses a new technique called “dual Angle” observation, which allows for microwave signals to be measured simultaneously on the surface and in the soil beneath the vegetation layer. The spatial resolution of the product is 36 km. While the SMAP satellite can observe the same point twice daily, previous studies have pointed out that the soil moisture inversion from morning observation data is more accurate [24,25]. Therefore, this investigation used soil moisture products from SMAP acquired in the morning to screen the data with the quality markers in the data products [25].
The term soil moisture data used in this paper indicates the relative soil moisture content (%), meanwhile data from SMAP refers to the soil volumetric water content (m3/m3). Before using SMAP data, the method proposed by Zhu et al. [26] was adopted to convert SMAP soil volumetric water content data into relative water content. The specific calculation is as follows:
R e l a t i v e S M i j k = V S M k max V S M 1 , V S M 2 ,   V S M 3 ,   ,       k = 1 ,   2 ,   3 ,  
In Equation (1), R e l a t i v e S M i j k is the soil relative water content of the pixel in row i and column j at day k, and V S M k denotes the soil volumetric water content of the pixel at day k.

2.2.2. Daily Precipitation Dataset

The precipitation data used were hourly grid data of 0.1 ° × 0.1 ° covering China. The process of making these data entailed integrating the data of 30,000 automatic precipitation monitoring stations in China and precipitation data from the CMORPH (Climate Prediction Center Morphing Technique) satellite [27]. Pan Yang et al. [27] fused precipitation data from over 30,000 stations to eliminate or reduce systematic errors in the CMORPH data. Shen et al. [28] verified the accuracy of the dataset and claimed that it can effectively capture the spatiotemporal characteristics of hourly precipitation. Zhu et al. [29] agreed that this dataset could capture the characteristics of hourly precipitation with high accuracy. Thus, this set of data has been widely used by many scholars [29,30,31]. The hourly grid precipitation dataset may be downloaded from the website of the China Meteorological Data Sharing Centre.
The time resolution of the original precipitation data is hourly, while the time scale of the extraction of irrigation water is daily. Thus, it was necessary to match the precipitation data with the satellite soil moisture data according to the time scale. Firstly, by accumulating hourly grid precipitation data, the daily scale precipitation data were obtained. The next step involved matching the soil moisture and precipitation data according to the spatial resolution, which required 0.1 ° × 0.1 ° resolution precipitation data resampling in space. The resampling method was used to create a lattice-network SMAP satellite data grid (as shown in Figure 1a,b of the grid), and the average was calculated. Finally, the daily precipitation value of the grid was obtained.

2.2.3. Statistical Data for Irrigation Water Use

Statistical data concerning water amounts in agricultural applications were obtained from the water resources bulletin issued by various water resources departments. Since 1999, the Henan Provincial Department of Water Resources has released information about the annual water amount of each city and county based on statistical methods. In addition, the Henan Provincial Water Resources Department has also released the amount of agricultural water used by each county (Table 1). In the absence of statistical data for the region’s irrigation water use, this paper used statistics related to agricultural water amount to replace the approximation of irrigation water use in Henan Province. Due to the lack of statistical data for irrigation water use, this study only estimated the irrigation water use of 2016 and 2017 in dryland fields in Henan Province.

2.2.4. Auxiliary Datasets

In order to calculate the potential evapotranspiration, meteorological data were obtained from 184 meteorological stations in and around the study area, including daily solar radiation duration, relative moisture, maximum temperature, minimum temperature, average temperature and wind speed (the data download address is: http://data.cma.cn/user/toLogin.html, accessed on 1 January 2018). The adopted calculation equation for potential evapotranspiration was the Penman–Monteith equation revised by Allen [32] to calculate the potential surface evapotranspiration of each meteorological station. The Penman–Monteith equation is as follows:
E T 0 = 0.408 × C e × R n G + γ × 900 × μ 2 × ( e s e a ) / ( T + 273 ) C e +   γ × ( 1 + 0.34 × μ 2 )
In Equation (2), E T 0 represents the potential evapotranspiration on the surface (mm day−1), R n denotes net radiation (MJ m−2 day−1), and G refers to the heat flux of the soil (MJ m−2 day−1), which can be ignored on the daily scale. T indicates the daily average temperature at 2 m (°C), μ 2 is the wind speed at 2 m (m s−1), e s stands for the saturated vapor pressure (kPa), e a is the actual vapor pressure (kPa), C e represents the slope of the vapor pressure curve (kPa °C−1), and γ is the calculated constant of moisture (kPa °C−1). In the following discussion, each parameter is described separately.
This paper proposes that this calculation method for irrigation water is suitable for dry land. Figure 1a shows the land use distribution map of Henan Province. The grid was not extracted for a paddy area of more than 10% in the grid (the southern region of the Henan area) or when the dry field area was less than 10% (the western region of Henan Province). For the former, paddy field irrigation is more obvious in satellite data since the irrigation pattern of paddy fields differs completely from that of dry land. Paddy fields are usually enough to soak the surface of the field after each irrigation [33,34]. These characteristics will increase the error of calculating irrigation water use on dry land. However, for grids with a small proportion of dry fields, the proportion of the actual irrigated area will be smaller because irrigation is completed within a specified period of time (usually 7–10 days) [35,36]. Thus, the small irrigated area has little impact on soil moisture changes in the entire grid.
The land use data used in this study were produced and published by the Data Center of the Institute of Geographic Sciences and Natural Resources. The data were created in 2015 with a spatial resolution of 1 km. In order to keep the resolution of land use data consistent with that of satellite soil moisture data, the scale conversion of land use data was initially conducted using statistics concerning the proportional area of various land use types in the SMAP grid. It included the proportion of dry land and paddy fields. Then, the land-use characteristics revealed in each grid were taken into consideration when deciding whether to calculate the irrigation water use in a particular grid. When the dryland area in the grid was deemed too small, an increase in soil moisture was usually not caused by irrigation; thus, the grid was no longer included in the calculation. In addition, if the area of paddy fields in the grid was too large, the grid was not calculated.
Digital Elevation Model data are produced and published by the Institute of Geographic Sciences and Natural Resources Research, with a spatial resolution of 1 km. This study used elevation data as auxiliary data for the analysis, mainly for visual analysis, and these data were not used in our calculations. Therefore, no resampling of digital elevation model data was conducted, and the original resolution was maintained.

3. Methods

This paper extracted irrigation signals from microwave satellite remote-sensing data of soil moisture by using an irrigation signal extraction method and built the SM2Rainfall Model based on the satellite remote sensing of soil moisture. The basic flowchart of the methodology is shown in Figure 2.

3.1. Identification of Irrigation Signals

The method used to identify irrigation signals in this paper is described in detail in [26]. This paper focused on the estimation of irrigation water use by using irrigation signals extracted from soil moisture data resulting from microwave satellite remote sensing. Therefore, the applied identification method of irrigation signals is briefly introduced here. For a more detailed description of this method, please refer to [26].
The contribution of irrigation and precipitation to the increase in soil moisture in farmland can be divided into the following situations: (1) No precipitation occurs during the increase in soil moisture. In this case, it can be deemed that irrigation caused the increase in soil moisture. (2) Not much precipitation occurs during the increase in soil moisture. If the initial soil moisture is low and the precipitation is not enough to ease the drought, then irrigation is still necessary. In this case, the increase in soil moisture can be deemed to be caused by both irrigation and precipitation.
Therefore, the reason for the increase in soil moisture in farmland cannot be arbitrarily attributed to irrigation (precipitation) or not (irrigation). The increase in soil moisture in farmland may be caused by both irrigation and precipitation in different degrees. The gradual relationship between the increase in soil moisture and impact factors (irrigation and precipitation) can be described by fuzzy logic [37,38,39].
In this study, a set of fuzzy membership functions was used to represent the non-linear relationship between irrigation necessity and environmental factors. Then, based on fuzzy set operations, an inference model for the correlation between soil moisture increase and irrigation was established.

3.2. Estimation of Irrigation Water Use
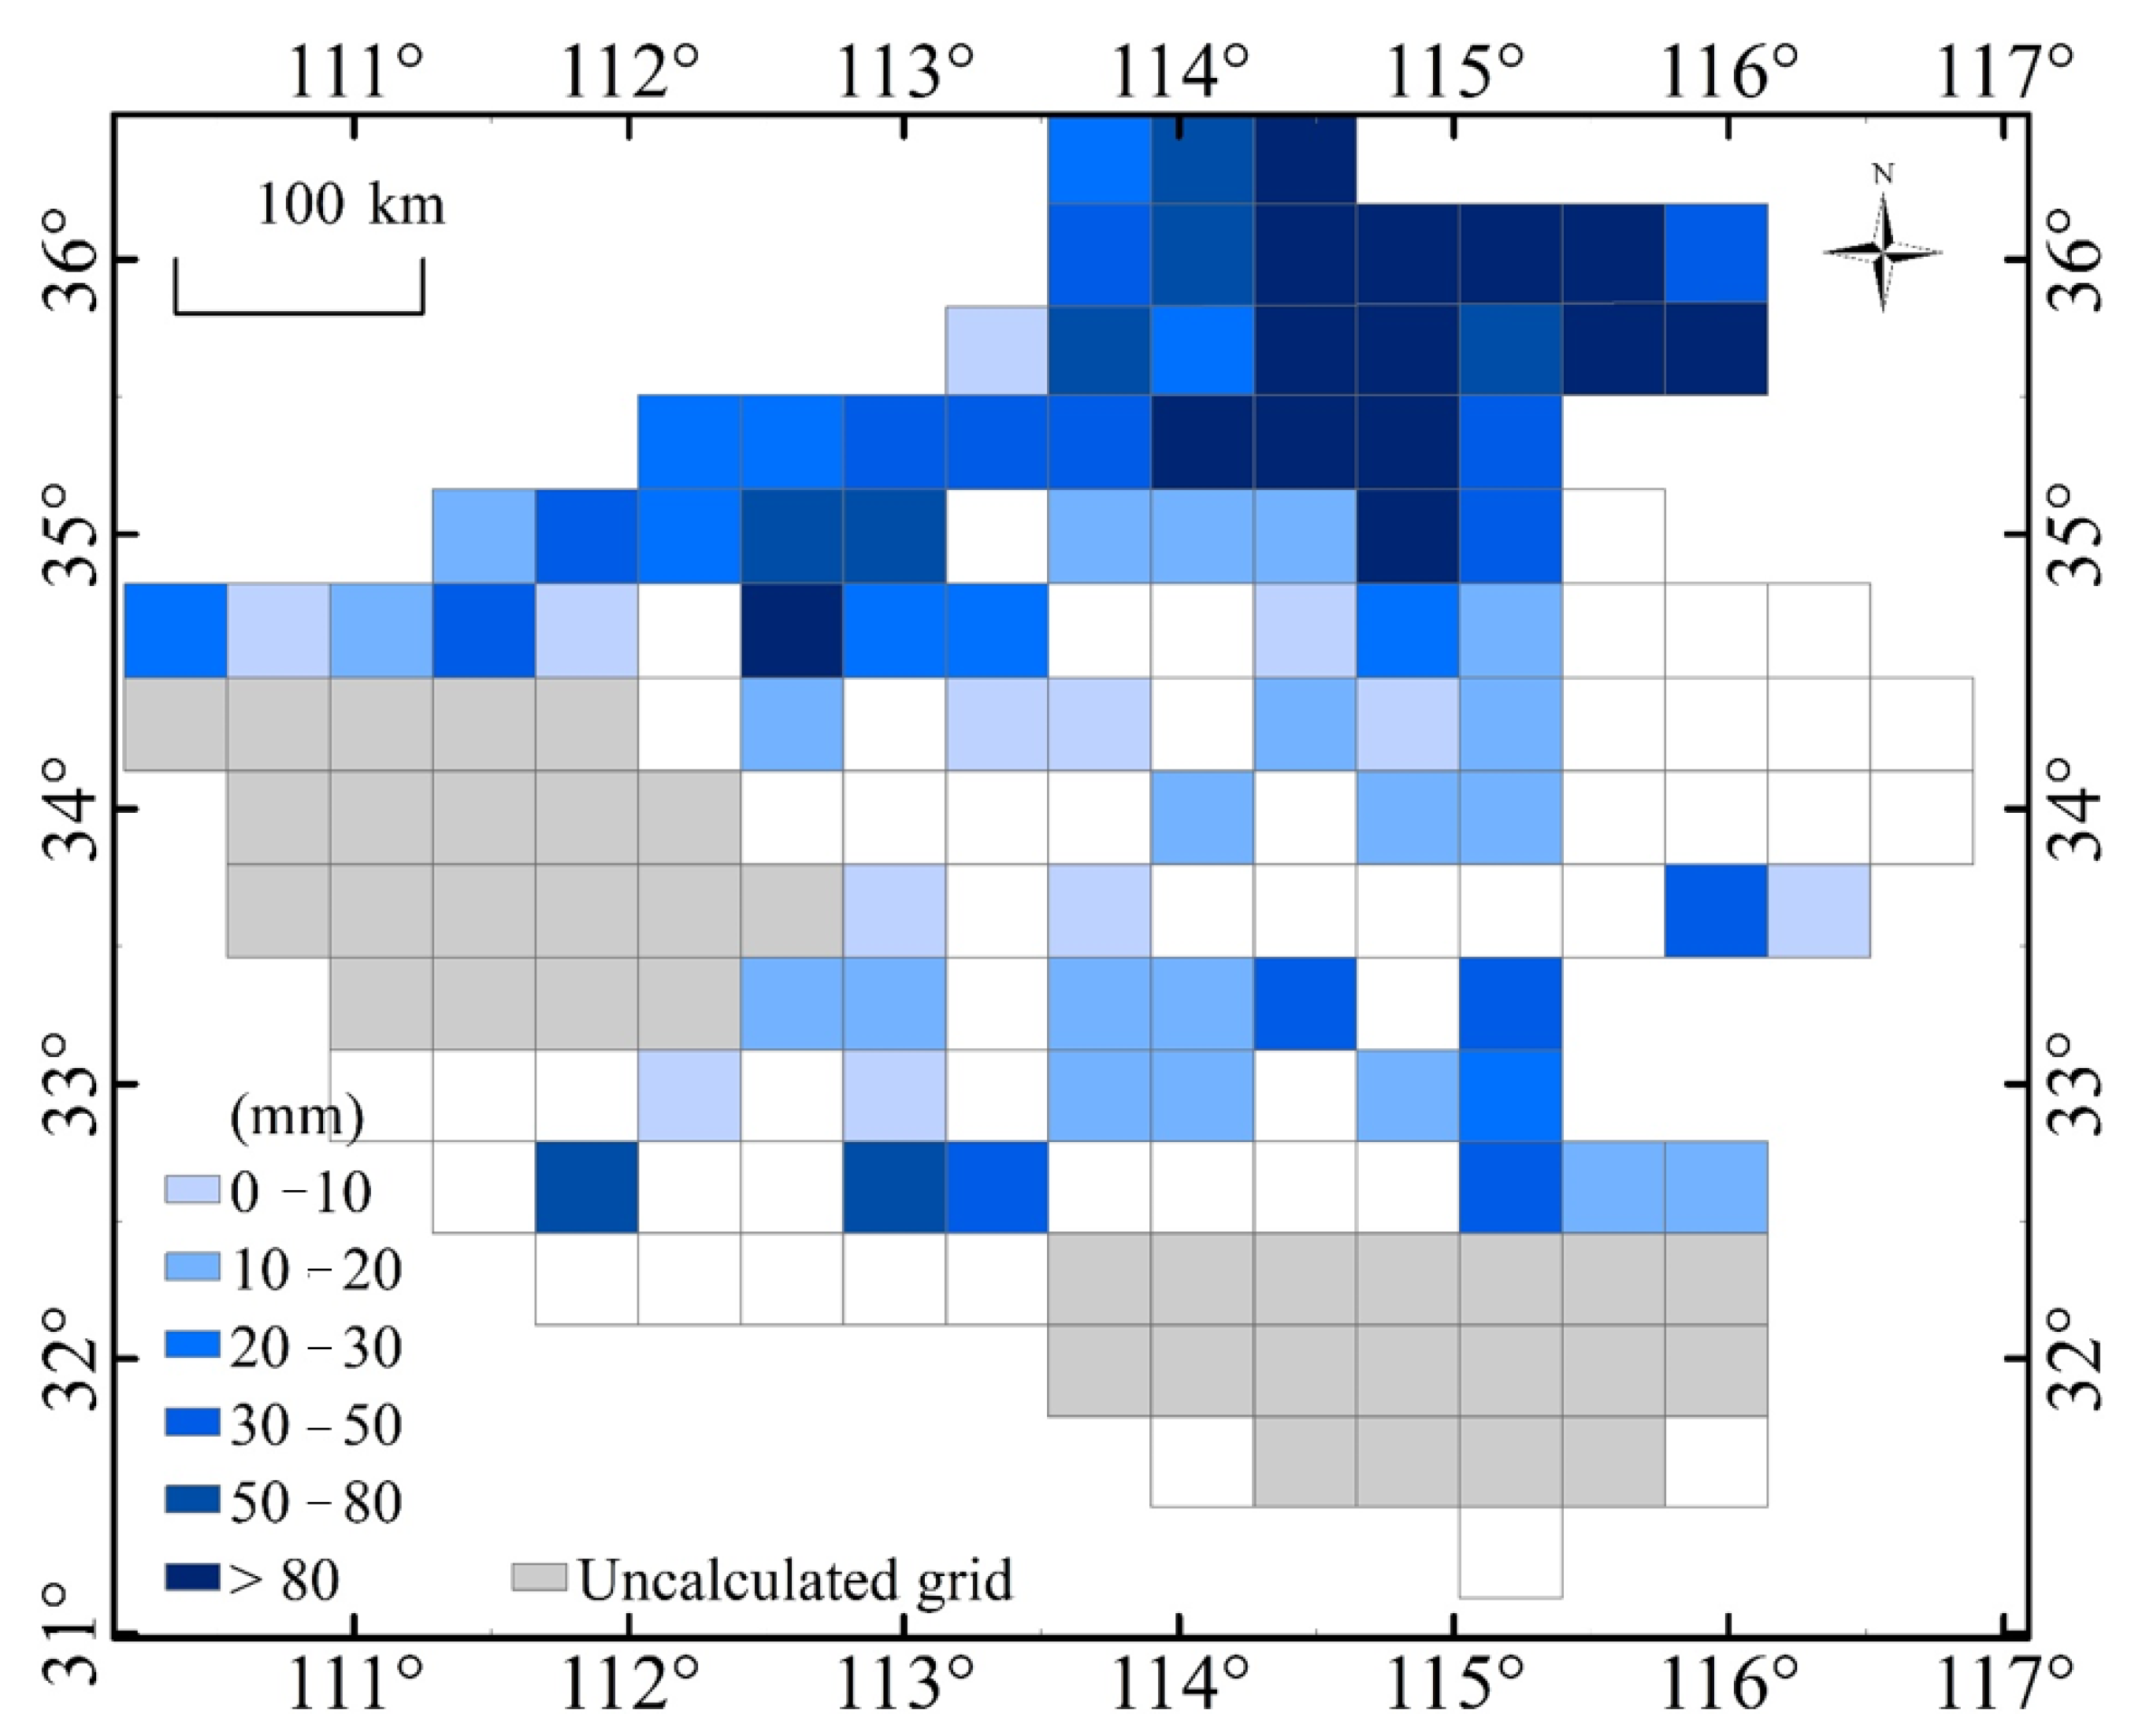
The method used to estimate irrigation water use was proposed by Brocca et al. [19]. Studies have revealed a non-linear positive correlation between surface soil moisture changes and the water amount in the input soil [40,41]. Considering the relationship between farmland irrigation and changes in soil moisture levels, the farmland soil moisture balance after irrigation can be expressed by the following equation:
I r r i ( t ) = Z n d S ( t ) d t + G ( t ) + E T ( t ) + R ( t ) P ( t )
In Equation (3), Irri(t) represents the irrigation water input into the soil (mm day−1), while Z denotes the thickness of the soil layer (mm), n is the soil porosity (--), S(t) indicates the relative saturation of soil moisture (--), P(t) stands for precipitation (mm day−1), G(t) measures soil moisture leakage (mm day−1), ET(t) is surface evapotranspiration (mm day−1), R(t) represents the surface runoff (mm day−1) and t(T) is time (day). Assuming that irrigation in dryland areas does not produce runoff flowing to the outside of the farmland, R(t) in Equation (6) can be considered to be 0. Leakage G(t) refers to the non-linear relationship established by Famiglietti and Wood [42], and the equation is as follows:
G ( t ) = a × S ( t ) b
The calculation method of surface evapotranspiration was proposed by Brocca et al. [19] and Dari et al. [43], and the equation is as follows:
E T ( t ) = E T 0 × S ( t )
By integrating Equations (3), (4) and (5), the theoretical model for calculating irrigation water use based on soil moisture is established as follows:
I r r i ( t ) = Z n d S ( t ) d t + a × S ( t ) b + E T o × S ( t ) P ( t )
In Equation (6), the model for the estimation of irrigation water use includes the relative saturation S(t) of the soil moisture, surface evapotranspiration E(t), precipitation P(t) and three parameters, Z, a and b, related to soil properties. The relative saturation of the soil moisture can be calculated by satellite soil moisture data. The evapotranspiration can be calculated according to meteorological data, the Penman–Monteith equation and soil moisture data, and the precipitation data can be also observed.
In the study of Brocca [19], to illustrate the random error in the SM2RAIN algorithm, they masked irrigation estimates below a specific threshold. In this paper, we calculated the irrigation water use by using irrigation signals in SMAP soil moisture data. In addition, the unknown parameters Z, a and b in the model were determined by the model parameter calibration method, according to the following process: “no irrigation during precipitation” data and microwave remote-sensing-recorded soil moisture were selected. Precipitation data were considered to be the known surface input water. We used the open source package “SPOTPY” written in the Python programming language to calibrate the unknown parameters Z, a and b.

4. Results

It can be seen from the land-use distribution map (Figure 1b) that there are a large number of paddy fields in Xinyang City of Henan Province (the southern part of the study area). The method in this paper is not applicable to the calculation of irrigation water use of paddy fields. Therefore, the Xinyang area was not included in the selected area for our calculation of irrigation water use.
Figure 3 provides the distribution of irrigation water in dry land in Henan Province in 2016 calculated by this method. As can be seen from Figure 3, the irrigation water use in the study area gradually decreased from north to south in space. In the northern part of the study area, the maximum irrigation water use was 205.5 mm. The irrigation amount in the western and southern parts of the study area is significantly less than that in the northern part. Combined with the digital elevation map, it can be found that the western part of Henan Province is mainly mountainous terrain. The relatively small proportion of farmland area in that part of the province can be logically associated with less use of irrigation water, explaining the low amount of irrigation water consumed in this area. Meanwhile, the southern part of the study area receives more precipitation, which serves as the main reason for the small amount of irrigation in that area.
Figure 4 displays the distribution of farmland irrigation water use in Henan Province in 2017. From the perspective of the spatial distribution of irrigation water, the spatial distribution pattern of irrigation water in 2017 is similar to that in 2016 and shows a trend of gradual decrease from north to south. The maximum irrigation water use is 208.7 mm in the northern region. By comparison, the amount of irrigation in the western and southern regions is significantly lower than that in the northern region.
By contrast, this paper calculated the irrigation water use in the study area by using both irrigation signals and false irrigation signals in SMAP soil moisture data. The process is that the irrigation water use calculated are all positive parts after subtracting the precipitation from the surface input water, but there is no threshold value for screening the irrigation water.
Figure 5a represents the irrigation water use in 2016, while Figure 5b shows the irrigation water use in 2017. As can be seen from the irrigation water distribution diagram in Figure 5, there is little difference between the irrigation water use in the northern and southern parts of Henan Province calculated by this method. The difference in the spatial distribution of the irrigation water use diagram is small. Compared with the irrigation water distribution map obtained by the method in this paper, the map presented in Figure 5 shows a smaller north–south difference.
Table 2 shows the irrigation water use calculated in 2016 and 2017 in Henan Province. The left shows the irrigation water use calculated by the method proposed in this paper and the relative deviation from the statistical value of irrigation water use, and the right shows the irrigation water use calculated by the comparison method and the relative deviation from the statistical value of irrigation water use.
According to the statistical data of the 2016 Water Conservancy Bulletin of Henan Province, the irrigation water use in Henan Province was 11.08 billion m3 in 2016, excluding the agricultural water amount of 1.07 billion m3 in Xinyang City. The remaining irrigation water use in the research area was about 10.01 billion m3. According to the statistics published in the Water Conservancy Bulletin of Henan Province in 2017, 10.85 billion m3 of irrigation water was used in Henan Province in 2017, excluding the agricultural water amount of Xinyang City, totaling 1.005 billion m3. The remaining irrigation water use in Henan Province was about 9.845 billion m3.
The irrigation water use in the study area was 5.18 billion m3 in 2016 and 6.35 billion m3 in 2017. Compared with the statistics regarding irrigation water use, the calculated amount of irrigation water was 48% less in 2016 and 35% less in 2017 than the statistical data indicated. The amount of irrigation water consumed in the study area in 2016 and 2017 obtained by the comparison method was 17.204 billion m3 and 18.261 billion m3, respectively. In addition, the values obtained by the method proposed in this study are lower than the statistical data regarding irrigation water use. This is because small-scale irrigation (membership value: low irrigation events) is excluded during the recognition of irrigation signals. This phenomenon can result in a calculation of irrigation water use that is lower than the statistics. However, the comparison method used in this study does not removed the noise in the satellite soil moisture data, resulting in a significantly higher result for irrigation water use calculated by this method in the study area compared to the statistical value. On the whole, the current study’s proposed method yielded a smaller deviation in the calculation results for irrigation water compared to the results obtained with the comparison method relative to the statistical value of irrigation water.

5. Discussion

In this paper, by identifying the irrigation signals in the satellite microwave remote-sensing data of soil moisture, and constructing the model of estimating irrigation water use, the irrigation water use of Henan Province was estimated by using the irrigation signals in SMAP soil moisture data. In order to facilitate the comparison between the statistical value of irrigation water use and the irrigation water use calculated by this method proposed in this paper, we will convert the statistical value of irrigation water use into unit area irrigation water use. Figure 6a provides the amount of irrigation water consumed and its distribution in Henan Province in 2016 calculated by the method proposed in this paper. Meanwhile, Figure 6b shows the 2016 irrigation water use for each city calculated by the Water Resources Department of Henan Province (substituting the agricultural water amount).
Figure 7a shows the irrigation water use and its distribution in 2017 obtained by the method proposed in this paper in Henan Province, while Figure 7b shows the corresponding amount in 2017 obtained from the Henan Provincial Water Resources Department. The calculation process is consistent with the data process in 2016. As can be seen from Figure 6b and Figure 7b, the irrigation water use per unit area in the northern part of Henan Province is much larger than that in the southern part. In addition, more irrigation water was used in 2017 than in 2016, which can also be seen from the calculation of irrigation water distribution in Figure 6a and Figure 7a. The irrigation water use calculated by the method proposed in this paper accurately reflects the spatial distribution pattern of irrigation water in Henan Province.
We then selected part of the grid in the northern part of the Henan Province to further analyze the relationship between irrigation water use and the difference between the potential evapotranspiration and precipitation. Figure 8 displays a scatter diagram between irrigation water use and the difference between the potential evapotranspiration and precipitation in 2016 and 2017 in the grid in the northern part of Henan Province. Figure 8a represents the data in 2016, while Figure 8b displays the data in 2017. The vertical axis represents the irrigation water use, and the horizontal axis represents the difference between the potential evapotranspiration and precipitation. As can be seen from Figure 8, a linear relationship emerged between the annual irrigation water use, the potential evapotranspiration and precipitation. The decisive coefficients of the linear fitting were 0.54 and 0.55. It can also be seen from the figure that the difference between the potential evapotranspiration and precipitation in 2016 was smaller than that in 2017. Similarly, the irrigation water use in 2016 was lower than that in 2017 on the whole.
In the above relationship, the irrigation amount is lower than the difference between the accumulated potential evapotranspiration and precipitation. This phenomenon can be explained in terms of the two following factors: First, this paper adopted the annual cumulative potential evapotranspiration as calculated by the Penman–Monteith equation. This paper assumed that the water supply is not restricted after irrigation. Thus, the maximum evapotranspiration can be achieved under certain meteorological conditions. Although the Penman–Monteith equation is currently recognized as an accurate method to calculate evapotranspiration, it can be seen by definition that the calculated potential evapotranspiration is greater than the actual evapotranspiration since real farmland will never feature an unrestricted water supply, especially in drier areas where an unrestricted water supply would be even harder to satisfy. Assuming that precipitation is a high precision value, due to the overestimation of the potential evapotranspiration on the surface, the value of the potential evapotranspiration minus the precipitation will also be overestimated and will be greater than the calculated irrigation water use. In addition, the area of farmland in the grid does not account for 100% of the area. Usually, farmland accounts for about 70% of the area of the grid, and the calculated potential evapotranspiration refers to the evapotranspiration of the whole grid. Taken together, these two factors may be the main reason why the difference between the potential evapotranspiration and precipitation was much larger than the irrigation amount.
Figure 9 illustrates the distribution of irrigation areas in Henan Province and the proportion of irrigation area in pixels. As can be seen from the figure in the northern part of Henan Province, the maximum proportion of irrigation area in the grid area was greater than 90%, especially in the northernmost part of Henan Province. The average value of the irrigation area was 85%. Combined with the calculated irrigation water distribution (Figure 3 and Figure 4), it can be found that the spatial distribution of irrigation water use is similar to that of the irrigation area. This means that the spatial distribution of irrigation water use and the irrigation areas are consistent.
Similarly, the data concerning the irrigation water use in some grids in the northern part of the study area in 2016 and 2017 were consistent with the grids selected to analyze the relationship between irrigation water use and the potential evapotranspiration and precipitation. Therefore, we also analyzed the correlation between irrigation water use and irrigation areas in the grids. Figure 10 shows the relationship between irrigation water use and irrigated areas in 21 grids selected in 2016 and 2017. As can be seen from the scatter diagram, a linear relationship was found between irrigation water use and irrigation areas. The correlation coefficients between irrigation water use and irrigation areas in 2016 and 2017 are 0.64 and 0.68, respectively. For a linear fitting of irrigation water use and irrigation areas, the deterministic coefficients of the fitting models in 2016 and 2017 can reach 0.68. There was a good linear relationship between the calculated irrigation water use and the existing irrigation area data. Therefore, the larger the irrigation area, the greater the irrigation water use. This outcome reflects the rationality of the calculated irrigation water use in terms of spatial distribution.
By comparing with the statistical data, the relative error between the calculated irrigation water use and the statistical data was found to be about 40%. According to our analysis, the results calculated by the method proposed in this paper pertain to the irrigation water that actually entered the surface of the Earth, also referred to as effective irrigation water. However, the statistical data represent the amount of water resulting from the whole process of irrigation, and the sources for efficient irrigation water use are considerably different. A significant amount of water is lost before it reaches the fields. Different irrigation methods have different effective utilization conditions that affect the amount of irrigation water. For instance, a significant amount of evaporation will also occur during flood irrigation and spray irrigation, potentially leading to the failure of irrigation-supplied water to reach the soil layer. In addition, the method in this paper tends to omit small-scale irrigation, which is also a notable reason that the calculated irrigation water use is lower than the statistical value.
At present, researchers have extracted time series of soil moisture from Synthetic Aperture Radar (SAR) data and further developed and evaluated three time-series constraints [44,45]. In addition, Zhu et al. [46] previously proposed a new method for estimating irrigation water use via soil moisture. In order to further improve the estimation of irrigation water use, high-spatial-resolution satellite remote-sensing soil moisture data products and the new method for estimating irrigation water use via soil moisture can be used to estimate regional irrigation water use in future studies.

6. Conclusions

This study aimed to improve the estimation of irrigation water use in drylands by using irrigation signals from SMAP soil moisture data. The results of this study revealed that the irrigation water use calculated with irrigation signals in SMAP soil moisture data was smaller than the statistical value of irrigation water use. The calculated amount of irrigation water was 48% lower in 2016 and 35% lower in 2017 than the statistical data. This is because small-scale irrigation (membership value: low irrigation events) is excluded during the recognition of irrigation signals. By contrast, the comparison method used in this study did not remove the noise in the satellite soil moisture data, resulting in a significantly higher result for irrigation water use compared to the statistical value. On the whole, the irrigation water use calculated with irrigation signals deviated less from the statistical data than those calculated by the comparison method.

Author Contributions

Conceptualization, L.Z. and A.-X.Z.; methodology, L.Z. and H.W.; software, L.Z., M.L. and C.D.; validation, L.Z.; formal analysis, L.Z.; investigation, L.Z.; resources, L.Z.; data curation, L.Z.; writing—original draft preparation, L.Z.; writing—review and editing, L.Z. and A.-X.Z.; visualization, L.Z.; supervision, A.-X.Z.; project administration, L.Z.; funding acquisition, L.Z. All authors have read and agreed to the published version of the manuscript.

Funding

This study was funded by the Foundation of Anhui Province Key Laboratory of Physical Geographic Environment (2022PGE002), the National Natural Science Foundation Youth Science Fund Project (51609208), the Jiangsu Province Postdoctoral Research Support Project (Grant No. 2020Z223), the Green Yang and Golden Phoenix Project and the National Natural Science Foundation Project (Grant No. 41771478).

Data Availability Statement

The authors confirm that the article provides data supporting the results of this study.

Conflicts of Interest

The authors declare that there are no conflicts of interest.

References

  1. FAO. AQUASTAT Online Database. Food and Agriculture Organization of the United Nations (FAO). 2006. Available online: http://www.fao.org/ag/agl/aglw/aquastat/main/index.stm (accessed on 1 January 2018).
  2. Tang, Q.; Rosenberg, E.A.; Lettenmaier, D.P. Use of satellite data to assess the impacts of irrigation withdrawals on Upper Klamath Lake, Oregon. Hydrol. Earth Syst. Sci. 2009, 13, 617–627. [Google Scholar] [CrossRef]
  3. Douglas, E.M.; Niyogi, D.; Frolking, S.; Yeluripati, J.B.; Pielke, R.A., Sr.; Niyogi, N.; Vörösmarty, C.J.; Mohanty, U.C. Changes in moisture and energy fluxes due to agricultural land use and irrigation in the Indian Monsoon Belt. Geophys. Res. Lett. 2006, 33. [Google Scholar] [CrossRef]
  4. Zhao, X.Y.; Zhang, C.M.; Zuo, X.A.; Huang, Y.X.; Luo, Y.Y.; Wang, S.K.; Qu, H. Challenges to the restoration of desertified land in Horqin Sandy land. Chin. J. Appl. Ecol. 2009, 20, 1559–1564. (In Chinese) [Google Scholar]
  5. Wen, B.P.; Yu, Z.S.; Li, Z.H.; Yang, H.L.; He, L.; Jiang, S.; Zhang, J.L. Analysis of subsidence trend of Heifang Platform under irrigation in Yongjing, Gansu Province. J. Geol. Hazard. Control. Chin. 2013, 24, 108–114. (In Chinese) [Google Scholar]
  6. Han, W.H.; Wang, Z.L. Effects of different irrigation modes on soil moisture and salt distribution and cotton yield. Chin. Rural Water Hydropower. 2018, 11, 26–29, 34. (In Chinese) [Google Scholar]
  7. Zhang, Y.; Lei, G.P.; Zhang, H.Q.; Lin, J. Microscale analysis of spatial-temporal dynamics of land use and water resources matching in Naoli River Basin. Trans. CSAE 2019, 35, 185–194. (In Chinese) [Google Scholar]
  8. Lobell, D.; Bala, G.; Mirin, A.; Phillips, T.; Maxwell, R.; Rotman, D. Regional Differences in the Influence of Irrigation on Climate. J. Clim. 2009, 22, 2248–2255. [Google Scholar] [CrossRef]
  9. Kang, S.; Eltahir, A.B. North China Plain threatened by deadly heatwaves due to climate change and irrigation. Nat. Commun. 2018, 9, 2894. [Google Scholar] [CrossRef]
  10. Jalilvand, E.; Tajrishy, M.; Hashemi, S.; Brocca, L. Quantification of irrigation water using remote sensing of soil moisture in a semi-arid region. Remote Sens. Environ. 2019, 231, 111226. [Google Scholar] [CrossRef]
  11. Doll, P.; Siebert, S. A digital global map of irrigated areas. ICID J. 2000, 49, 55–66. [Google Scholar]
  12. Siebert, S.; Doll, P.; Hoogeveen, J.; Faures, J.M.; Frenken, K.; Feick, S. Development and validation of the global map of irrigation areas. Hydrol. Earth Syst. Sci. 2005, 9, 535–547. [Google Scholar] [CrossRef]
  13. Sacks, W.J.; Cook, B.I.; Buenning, N.; Levis, S.; Helkowski, J.H. Effects of global irrigation on the near-surface climate. Clim. Dyn. 2009, 33, 159–175. [Google Scholar] [CrossRef]
  14. Wisser, D.; Frolking, S.; Douglas, E.M.; Fekete, B.M.; Vörösmarty, C.J.; Schumann, A.H. Global irrigation water demand: Variability and uncertainties arising from agricultural and climate data sets. Geophys. Res. Lett. 2008, 35, L24408. [Google Scholar] [CrossRef]
  15. Ozdogan, M.; Rodell, M.; Beaudoing, H.K. Simulating the Effects of Irrigation over the United States in a Land Surface Model Based on Satellite-Derived Agricultural Data. J. Hydrometeorol. 2010, 11, 171–184. [Google Scholar] [CrossRef]
  16. Hu, X.; Shi, L.; Zeng, J.; Yang, J.; Zha, Y.; Yao, Y.; Cao, G. Estimation of actual irrigation amount and its impact on groundwater depletion: A case study in the Hebei Plain, China. J. Hydrol. 2016, 543, 433–449. [Google Scholar] [CrossRef]
  17. Zou, M.; Kang, S.; Niu, J.; Lu, H. A new technique to estimate regional irrigation water demand and driving factor effects using an improved SWAT model with LMDI factor decomposition in an arid basin. J. Clean. Prod. 2018, 185, 814–828. [Google Scholar] [CrossRef]
  18. Wen, S.X. Overview of methods for extracting farmland irrigation area based on remote sensing technology. South Agric. Mech. 2022, 53, 27–30. (In Chinese) [Google Scholar]
  19. Brocca, L.; Tarpanelli, A.; Filippucci, P.; Dorigo, W.; Zaussinger, F.; Gruber, A.; Fernández, P.D. How much water is used for irrigation? A new approach exploiting coarse resolution satellite soil moisture products. Int. J. Appl. Earth. Obs. Geoinf. 2018, 73, 752–766. [Google Scholar]
  20. Zohaib, M.; Choi, M. Satellite-based global-scale irrigation water use and its contemporary trends. Sci. Total Environ. 2020, 714, 136719. [Google Scholar] [CrossRef]
  21. Zaussinger, F.; Dorigo, W.; Gruber, A.; Tarpanelli, A.; Filippucci, P.; Brocca, L. Estimating irrigation water use over the contiguous United States by combining satellite and reanalysis soil moisture data. Hydrol. Earth Syst. Sci. 2019, 23, 897–923. [Google Scholar] [CrossRef]
  22. Foster, T.; Mieno, T.; Brozovic, N. Satellite-Based Monitoring of Irrigation Water Use: Assessing Measurement Errors and Their Implications for Agricultural Water Management Policy. Water Resour. Res. 2020, 55, e2020WR028378. [Google Scholar] [CrossRef]
  23. O’Neill, P.; Chan, S.; Colliander, A.; Dunbar, S.; Njoku, E.; Bindlish, R.; Chen, F.; Jackson, T.; Burgin, M.; Piepmeier, J.; et al. Evaluation of the validated Soil Moisture product from the SMAP radiometer. In Proceedings of the 2016 IEEE International Geoscience and Remote Sensing Symposium(IGARSS), Beijing, China, 10–15 July 2016; pp. 125–128. [Google Scholar]
  24. O’Neill, P.; Chan, S.; Njoku, E.; Jackson, T.; Bindlish, R. Soil Moisture Active Passive (SMAP) Algorithm Theoretical Basis Document Level 2&3 Soil Moisture (Passive) Data Products; Jet Propulsion Laboratory, California Institute of Technology: Pasadena, CA, USA, 2014. [Google Scholar]
  25. Cui, H.; Jiang, L.; Du, J.; Zhao, S.; Wang, G.; Lu, Z.; Wang, J. Evaluation and analysis of AMSR-2, SMOS, and SMAP soil moisture products in the Genhe area of China. J. Geophys. Res. Atmos. 2017, 122, 8650–8666. [Google Scholar] [CrossRef]
  26. Zhu, L.; Zhu, A.X. Extraction of Irrigation Signals by Using SMAP Soil Moisture Data. Remote Sens. 2021, 13, 2142–2150. [Google Scholar] [CrossRef]
  27. Pan, Y.; Shen, Y.; Yu, J.J.; Zhao, P. Fusion experiment of hourly precipitation between ground observation and satellite inversion in China based on optimal interpolation method. Acta Meteorol. Sin. 2012, 70, 1381–1389. (In Chinese) [Google Scholar]
  28. Shen, Y.; Zhao, P.; Pan, Y.; Yu, J. A high spatiotemporal gauge-satellite merged precipitation analysis over China. J. Geophys. Res. Atmos. 2014, 119, 3063–3075. [Google Scholar] [CrossRef]
  29. Zhu, L.; Liu, J.; Zhu, A.X.; Sheng, M.; Duan, Z. Spatial Distribution of Diurnal Rainfall Variation in Summer over China. J. Hydrometeorol. 2018, 19, 667–678. [Google Scholar] [CrossRef]
  30. Jin, X.; Wu, T.; Li, L. The quasi-stationary feature of nocturnal precipitation in the Sichuan Basin and the role of the Tibetan Plateau. Clim. Dyn. 2013, 41, 977–994. [Google Scholar] [CrossRef]
  31. Jiang, Z.; Zhang, D.L.; Xia, R.; Qian, T. Diurnal Variations of Presummer Rainfall over Southern China. J. Clim. 2017, 30, 755–773. [Google Scholar] [CrossRef]
  32. Allen, R.G.; Pereira, L.S.; Raes, D.; Smith, M. Crop Evapotranspiration-Guidelines for Computing Crop Water Requirements-FAO IRRIGATION and Drainage Paper 56; FAO: Rome, Italy, 1998; Volume 300, p. D05109. [Google Scholar]
  33. Xiao, X.; He, L.; Salas, W.; Li, C.; Moore, B.; Zhao, R.; Frolking, S.; Boles, S. Quantitative relationships between field-measured leaf area index and vegetation index derived from VEGETATION images for paddy rice fields. Int. J. Remote Sens. 2002, 23, 3595–3604. [Google Scholar] [CrossRef]
  34. Dong, J.; Xiao, X.; Menarguez, M.A.; Zhang, G.; Qin, Y.; Thau, D.; Biradar, C.; Moore, B. Mapping paddy rice planting area in northeastern Asia with Landsat 8 images, phenology-based algorithm and Google Earth Engine. Remote Sens. Environ. 2016, 185, 142–154. [Google Scholar] [CrossRef]
  35. Martínez-Fernández, J.; González-Zamora, A.; Sánchez, N.; Gumuzzio, A.; Herrero-Jiménez, C.M. Satellite soil moisture for agricultural drought monitoring: Assessment of the SMOS derived soil moisture Deficit Index. Remote Sens. Environ. 2016, 177, 277–286. [Google Scholar] [CrossRef]
  36. Brocca, L.; Pellarin, T.; Crow, W.T.; Ciabatta, L.; Massari, C.; Ryu, D.; Su, C.H.; Rüdiger, C.; Kerr, Y. Rainfall estimation by inverting SMOS soil moisture estimates: A comparison of different methods over Australia. J. Geophys. Res. Atmos. 2016, 121, 12062–12079. [Google Scholar] [CrossRef]
  37. Zadeh, L.A. Fuzzy sets. Inf. Control. 1965, 8, 338–353. [Google Scholar] [CrossRef]
  38. Zhu, A.X. A personal construct-based knowledge acquisition process for natural resource mapping. Int. J. Geogr. Inf. Syst. 1999, 13, 119–141. [Google Scholar] [CrossRef]
  39. Zhu, A.X.; Hudson, B.; Burt, J.; Lubich, K.; Simonson, D. Soil mapping using GIS, expert knowledge, and fuzzy logic. Soil Sci. Soc. Am. J. 2001, 65, 1463–1472. [Google Scholar] [CrossRef]
  40. Porporato, A.; Daly, E.; Rodriguez-Iturbe, I. Soil moisture balance and ecosystem response to climate change. Am. Nat. 2004, 164, 625–632. [Google Scholar] [CrossRef] [PubMed]
  41. Brocca, L.; Ciabatta, L.; Massari, C.; Moramarco, T.; Hahn, S.; Hasenauer, S.; Kidd, R.; Dorigo, W.; Wagner, W.; Levizzani, V. Soil as a natural rain gauge: Estimating global rainfall from satellite soil moisture data. J. Geophys. Res. Atmos. 2014, 119, 5128–5141. [Google Scholar] [CrossRef]
  42. Famiglietti, J.S.; Wood, E.F. Multiscale modeling of spatially variable water and energy balance processes. Water. Resour. Res. 1994, 30, 3061–3078. [Google Scholar] [CrossRef]
  43. Dari, J.; Brocca, L.; Quintana-Segui, P.; Escorihuela, M.J.; Stefan, V.; Morbidelli, R. Exploiting High-Resolution Remote Sensing Soil Moisture to Estimate Irrigation Water Amounts over a Mediterranean Region. Remote Sens. 2020, 12, 2593. [Google Scholar] [CrossRef]
  44. Zhu, L.; Si, R.; Shen, X.; Walker, J.P. An advanced change detection method for time-series soil moisture retrieval from Sentinel-1. Remote Sens. Environ. 2022, 279, 113137. [Google Scholar] [CrossRef]
  45. Zhu, L.; Yuan, S.; Liu, Y.; Chen, C.; Walker, J.P. Time series soil moisture retrieval from SAR data: Multi-temporal constraints and a global validation. Remote Sens. Environ. 2023, 287, 113466. [Google Scholar] [CrossRef]
  46. Zhu, L.; Gu, Z.; Tian, G.; Zhang, J. A New Method for Estimating Irrigation Water Use via Soil Moisture. Agriculture 2023, 13, 757. [Google Scholar] [CrossRef]
Figure 1. (a) Land use distribution map of Henan Province and the location of satellite soil moisture data grids. (b) Elevation map of Henan Province.
Agriculture 13 01709 g001
Figure 2. The flowchart of the methodology used in this study.
Agriculture 13 01709 g002
Figure 3. Distribution of irrigation water use in Henan Province in 2016 calculated by this method.
Agriculture 13 01709 g003
Figure 4. Distribution of irrigation water use in Henan Province in 2017 calculated by this method.
Agriculture 13 01709 g004
Figure 5. Distribution map of irrigation water use in Henan Province obtained by using both irrigation signals and false irrigation signals: (a) irrigation water use in 2016 and (b) irrigation water use in 2017.
Agriculture 13 01709 g005
Figure 6. Irrigation water use in Henan Province in 2016: (a) the irrigation water use obtained by the method proposed in this paper and its distribution; and (b) statistics of irrigation water use in various cities obtained from the Henan Provincial Water Resources Department.
Agriculture 13 01709 g006
Figure 7. Irrigation water use in Henan Province in 2017: (a) the irrigation water use obtained by the method proposed in this paper and its distribution; and (b) statistics of irrigation water use in various cities obtained from the Henan Provincial Water Resources Department.
Agriculture 13 01709 g007
Figure 8. The relationship between the calculated irrigation water use and the difference in the potential evapotranspiration and precipitation: (a) 2016 irrigation data and (b) 2017 irrigation data. The blue triangle is the value of sampling point, and the bold dashed line is the linear fitting line.
Agriculture 13 01709 g008
Figure 9. Irrigation areas in Henan Province (ORNL DAAC, Global Map of Irrigation Areas Version 4.0.1).
Agriculture 13 01709 g009
Figure 10. The relationship between the calculated irrigation amount and the areas of the irrigated region: (a) irrigation water use in 2016 and (b) irrigation water use in 2017. The blue triangle is the value of sampling point, and the bold dashed line is the linear fitting line.
Agriculture 13 01709 g010
Table 1. Statistical agricultural water amounts of Henan Province in 2016 and 2017.
RegionArea
(Ten Thousand km2)
2016
(A Hundred Million m3)
2017
(A Hundred Million m3)
Sanmenxia1.031.5471.444
Xinyang1.8910.710.05
Nanyang2.6613.10613.15
Zhoukou1.2013.02111.34
Shangqiu1.0710.4269.16
Anyang0.567.9058.79
Pingdingshan0.793.4443.07
Kaifeng0.639.089.12
Xinxiang0.8212.05214.52
Iuoyang1.524.9254.92
Iuohe0.261.6431.49
Puyang0.429.669.84
Jiaozuo0.418.5888.59
Xuchang0.504.0233.56
Zhengzhou0.745.4985.44
Zhumadian1.516.0414.59
Hebi0.233.0432.81
Table 2. Statistical value of the irrigation water use in Henan Province in 2016 and 2017. Irrigation water use calculated by the method proposed in this paper and its deviation from statistics, and irrigation water use calculated by the comparison method and its deviation from statistics.
YearStatistical Value
(Billion m3)
This Method
(Billion m3)
Relative Deviation
(%)
Comparison Method (Billion m3)Relative Deviation
(%)
201610.015.18−48%17.272%
20179.856.35−35%18.2585%
Disclaimer/Publisher’s Note: The statements, opinions and data contained in all publications are solely those of the individual author(s) and contributor(s) and not of MDPI and/or the editor(s). MDPI and/or the editor(s) disclaim responsibility for any injury to people or property resulting from any ideas, methods, instructions or products referred to in the content.

