

AI in Sustainable Pig Farming: IoT Insights into Stress and Gait


Department of Animal Science and Aquaculture, Faculty of Agriculture & Computer Science, Dalhousie University, 6050 University Ave, Halifax, NS B3H 1W5, Canada
Agriculture 2023, 13(9), 1706; https://doi.org/10.3390/agriculture13091706
Submission received: 15 July 2023
/
Revised: 10 August 2023
/
Accepted: 28 August 2023
/
Published: 29 August 2023
(This article belongs to the Special Issue Neural Networks and Image Analysis in Intelligent Agricultural Engineering)
Abstract
:This paper pioneers a novel exploration of environmental impacts in livestock farming, focusing on pig farming’s intersection with climate change and sustainability. It emphasizes the transformative potential of data-driven Artificial Intelligence (AI) methodologies, specifically the Internet of Things (IoT) and multimodal data analysis, in promoting equitable and sustainable food systems. The study observes five pigs aged 86 to 108 days using a tripartite sensor that records heart rate, respiration rate, and accelerometer data. The unique experimental design alternates between periods of isolation during feeding and subsequent pairing, enabling the investigation of stress-induced changes. Key inquiries include discerning patterns in heart rate data during isolation versus paired settings, fluctuations in respiration rates, and behavioral shifts induced by isolation or pairing. The study also explores the potential detection of gait abnormalities, correlations between pigs’ age and their gait or activity patterns, and the evolution of pigs’ walking abilities with age. The paper scrutinizes accelerometer data to detect activity changes when pigs are paired, potentially indicating increased stress or aggression. It also examines the adaptation of pigs to alternating isolation and pairing over time and how their heart rate, respiration rate, and activity data reflect this process. The study considers other significant variables, such as time of day and isolation duration, affecting the pigs’ physiological parameters. Sensor data are further utilized to identify behavioral patterns during periods of feeding, isolation, or pairing. In conclusion, this study harnesses IoT and multimodal data analysis in a groundbreaking approach to pig welfare research. It underscores the compelling potential of technology to inform about overall pig welfare, particularly stress levels and gait quality, and the power of data-driven insights in fostering equitable, healthy, and environmentally conscious livestock production systems.
1. Introduction
In an era defined by exponential growth in global demand for animal-based products, innovatively bolstering livestock production while concurrently preserving animal welfare and promoting sustainable practices has emerged as a pivotal challenge. This challenge, however, simultaneously presents a compelling opportunity. It invites the integration of cutting-edge technologies, such as the Internet of Things (IoT) and Artificial Intelligence (AI), into the realms of livestock management [1,2], thus reshaping traditional farming paradigms.
IoT, epitomizing the integration of physical entities with digital ecosystems, catalyzes transformative change across diverse sectors, including agriculture. Within the domain of precision livestock farming (PLF), the amalgamation of IoT with AI offers a potent means to automate, continually monitor, and intelligently analyze animal health [3]. This convergence enhances productivity and animal welfare while mitigating risks through the leveraging of machine learning and data analytics.
One of the most impactful applications of IoT and AI within PLF lies in their capacity to deploy sensors to gather multimodal data and subsequently employ AI algorithms for insightful analysis [4,5]. Such an approach furnishes a wealth of insights into an extensive array of physiological and behavioral parameters of livestock. Consequently, this data-driven strategy, enriched by AI, enables farmers and veterinarians to proactively respond to emerging health issues, signs of stress, or alterations in behavior, thus engendering a proactive, as opposed to reactive, approach to livestock welfare [6,7].
Our research venture centers on the comprehensive analysis of heart rate, respiration rate, and acceleration data collected from pigs via IoT sensors and further interpreted through AI-driven models. The heart and respiration rates are renowned for their status as pivotal indicators of physiological stress in pigs, as they fluctuate in response to various environmental and physical stimuli [8,9]. In contrast, accelerometer data offers a window into the movements and behaviors of pigs, thereby enabling non-invasive gait analysis through AI-based pattern recognition [10,11].
Decoding pigs’ physiological responses and behaviors is crucial to assess their welfare accurately. AI algorithms play an essential role in interpreting chronically elevated heart rates or respiration rates that may denote the presence of chronic stress, while anomalies in gait might signal musculoskeletal issues or discomfort, which can be detected through machine learning models [12,13]. Therefore, the continual real-time monitoring of these parameters, enabled by IoT sensors and enriched by AI analytics, can offer an early warning system for potential welfare problems, thereby allowing timely and appropriate interventions.
The objective of our research is to harness the multifaceted data derived from IoT sensors, coupled with AI-driven analytics, to scrutinize the physiological and behavioral responses of pigs within varying social contexts. These include periods of isolation during feeding and re-pairing post-feeding. These scenarios, common within numerous farming systems, are known to elicit variable responses in pigs, thus providing an opportunity to explore their adaptability to changing social environments through the lens of AI.
Furthermore, our investigation sought to determine whether correlations exist between pigs’ age and their activity or gait patterns as inferred from accelerometer data. By employing machine learning models, we delve into how age-related changes in activity or gait could influence animal welfare and productivity. Understanding these relationships, made more precise through AI interpretations, is of paramount importance.
Our study engaged pigs aged between 86 and 108 days, a critical developmental phase marked by significant changes and adaptations. We deployed a sophisticated suite of analysis tools, including AI algorithms, to dissect a rich dataset comprising heart rate, respiration rate, and acceleration data. Our approach provides a robust platform for identifying behavioral patterns, assessing stress levels through predictive analytics, and conducting detailed gait analysis using machine learning techniques.
To our knowledge, this represents the first study of its kind to exploit the potential of IoT, enriched with AI capabilities, in capturing and analyzing such a comprehensive array of physiological and behavioral data in pigs across differing age groups and social contexts. We anticipate our findings, supported by the fusion of IoT and AI, will significantly enhance the understanding of pig behavior and welfare, ultimately serving as a guide to improving management practices and steering future research in the burgeoning field of precision livestock farming.
2. Relevant Study
Recognizing and assessing animal behavior, particularly in livestock like pigs, is fundamental to evaluating their welfare, optimizing productivity, and effectively managing farming practices in a sustainable and ethical manner. Pigs, distinguished as sentient beings [14,15] with intricate social structures [16,17], face numerous stressors [18] in contemporary farming procedures. It is, therefore, critical to gain insights into their behavior and stress responses to enhance their welfare and productivity, particularly in a world increasingly attentive to animal rights and ethical farming practices.
Technology has progressively transformed the field of animal behavior studies. Among these advancements, accelerometers have emerged as a promising tool, providing multidimensional motion data. Their application, combined with other wearable devices, has attracted substantial research interest due to their potential to augment animal welfare and productivity. Table 1 provides a comparative analysis of how accelerometers have been utilized in conjunction with machine learning models to monitor and understand livestock behavior and resilience. The data underscores the potential of these technologies to revolutionize the field of animal husbandry, paving the way for more efficient and humane farming practices. Our study capitalized on this innovation, utilizing the Zephyr BioHarness accelerometer, typically deployed in human health and sports studies, to study pig behavior in a minimally intrusive manner.
The introduction of accelerometers into behavioral studies has unlocked new dimensions in pig welfare research. These devices capture nuanced movements and behaviors, providing comprehensive insights into animal welfare. This ability to track diurnal rhythms and activity levels, even in the challenging environment of pig rearing, makes accelerometers an indispensable tool in these studies.
However, while the potential of accelerometers in understanding pig behavior is evident, their application in livestock studies remains nascent. It is essential to interpret accelerometer data in the context of the animal’s environment, physiological state, and overall health to unlock this technology’s full potential.
The simultaneous collection of heart rate, respiration rate, and accelerometer data using the Zephyr BioHarness marks a novel approach to animal physiological data collection. This methodology enhances animal welfare by using a single device to monitor three different variables, minimizing stress. The automatic, real-time collection of this data requires minimal handling of the animals, streamlining data collection.
However, despite the exciting prospects offered by this technology, there are challenges in pig behavior classification using accelerometer sensors. Considerations such as sensor placement, durability, battery life, and maintaining minimal disruption to the pig’s daily activities are paramount to ensuring accurate data collection.
Our research primarily aims to employ sensor data to delve into the comprehensive welfare of pigs, with a particular focus on stress levels and gait quality. Through the analysis of this data, we aim to discern intricate patterns relating to heart rate, respiration rate, and activity, allowing us to identify irregularities or alterations in gait indicative of lameness and isolate behavioral patterns that materialize during distinct periods of feeding, isolation, or pairing. This methodology is projected to fill the knowledge gap between pig behavior and welfare, thereby facilitating more effective, ethical, and sustainable farming practices.
This study raises several pertinent questions:
- Are there discernible patterns in heart rate data when comparing pigs in isolated versus paired settings? Does a specific setting seem to exacerbate stress, as suggested by variations in heart rate?
- How does the respiration rate fluctuate when pigs are paired in contrast to periods of isolation? Can this information serve as a stress level indicator?
- Are there distinct changes in activity, as measured by accelerometer data, when pigs transition between isolation and pairing? Can we identify marked differences in activity levels or patterns suggestive of stress-induced behavioral changes?
- Can we detect anomalies or alterations in gait that might hint at lameness in pigs based on accelerometer data? If so, what specific patterns should we investigate?
- Is there a correlation between pigs’ age and their gait or activity pattern, as suggested by accelerometer data? How does the locomotive ability of the pigs evolve as they age?
- Does accelerometer data signify significant shifts in activity when pigs are paired, potentially indicating escalated aggression or stress?
- Throughout the study duration (from 86 to 108 days of age), do the pigs seem to adapt to the isolation during feeding and the subsequent re-pairing post-feeding? How do their heart rate, respiration rate, and activity data mirror this adaptation process?
- Are there additional factors or variables (time of day, duration of isolation) that notably affect the pigs’ heart rate, respiration rate, or activity level?
- Can we pinpoint any behavioral patterns that emerge during periods of feeding, isolation, or pairing based on the accumulated sensor data?
- How can the compiled sensor data inform us about the overall welfare of the pigs, particularly regarding stress levels and gait quality?
3. Materials and Methods
3.1. Ethical Declaration
The empirical data serving as the foundation of this research was generously furnished by my esteemed colleagues at Wageningen University & Research and is associated with an independent, prior experiment. The utilization of animals in that referenced study was sanctioned by both the Central Committee on Animal Experiments (CCD) and the Animal Experiments Department (IVD) of the Netherlands, thereby ensuring adherence to ethical guidelines and best practices. For the current study, any supplemental, non-invasive handling of animals was meticulously scrutinized and subsequently approved by the Department of Animal Sciences of the Care of Animals Used for Scientific Purposes (CARUS) at Wageningen University & Research. The respective approval number for this study is 20210521ADP. This rigorous approval process underscores our unwavering commitment to the utmost standard of care in animal research.
3.2. Study Design and Animal Housing: A Methodological Approach
The longitudinal study involved 50 male piglets (Tempo × Topigs Norsvin TN70), around nine weeks of age and averaging 25 kg. These piglets were housed in rooms 14 and 15 of the CARUS facility at Wageningen University & Research, The Netherlands. Out of this cohort, six piglets, aged between 86 and 108 days, were singled out for a comprehensive investigation into physiological and behavioral adaptations. The initial week was dedicated to acclimatization, allowing the piglets to adjust to their new environment, diet, and management procedures. Each pen, measuring 2.86 × 1.16 m, comfortably housed two piglets and was well-equipped with essential facilities and play materials. The room temperature was regulated as per the piglets’ needs, and lights were kept on from 7:00 to 19:00. A specific feeding regimen was followed, with water always available.
3.3. Adaptive Monitoring: Implementing Zephyr BioHarness Belts for Precision Tracking
In the following weeks, each pen was partitioned to individually accommodate the piglets for five consecutive days. During this phase, the selected subjects were outfitted with Zephyr BioHarness belts (Medtronic Plc, Minneapolis, MN, USA) (Figure 1) and state-of-the-art wearable sensors. These devices facilitated the precise monitoring of crucial physiological parameters such as respiration and heart rates while also capturing accelerometer data, yielding comprehensive insights into the pigs’ physical exertions. Figure 2 presents the AI Algorithm Flowchart for analyzing animal behavior, a comprehensive visual representation that elucidates the complex interplay within the AI system. This flowchart is segmented into three main components: architecture, agent function, and agent program, each playing a vital role in the process of analyzing and understanding animal behavior. In Figure 3, we showcase the 3-in-1 Wearable Belt employed in the Study, a thoughtfully engineered device designed to gather essential data on heart rate, respiration rate, and accelerometer readings from pigs. This image offers a detailed view of the various components, providing valuable insight into the pigs’ behavioral patterns and well-being, and symbolizes a significant step towards enhancing livestock management through technology.
3.4. Investigating the Physiological Impact of Social Conditions: Pairing vs. Isolation
The study’s structure pivoted around the impact of social interaction and isolation on the tracked physiological parameters. Non-feeding periods promoted social interaction among the pigs as they were kept in pairs. Conversely, feeding times saw the pigs in isolation, offering an unrivaled opportunity to observe their physiological and behavioral responses to solitude. This approach yielded a holistic understanding of the pigs’ adaptability to varying social conditions and feeding schedules, ultimately driving improved welfare and management strategies.
3.5. In-Depth Examination of Accelerometer and Physiological Metrics: A Concise Approach
This research endeavor utilized an in-depth analysis of three-dimensional acceleration data captured along vertical, lateral, and sagittal axes, with a sampling rate of 100 Hz. The collected acceleration signals were refined via a pre-processing stage that utilized a Butterworth bandpass filter, specifically with defined cut-off frequencies of 0.05 and 10 Hz. Subsequently, the total horizontal displacement for each pig was quantified, factoring in the resultant lateral and sagittal displacement based on the prescribed formulas.
The study further incorporated heart rate variability (HRV) analysis. Electrocardiogram (ECG) data, gathered at a sampling rate of 250 Hz, were scrutinized to detect R-peaks and ascertain R-R intervals, leveraging a wavelet method. This led to the computation of key parameters, including cumulative R-R, RMSSD (root mean square of successive differences), HRV, and SDSD (standard deviation of successive differences). These data points were then plotted over time, enabling a visual comparison of different scenarios. Heart rate (bpm) was computed based on the R-peaks and juxtaposed with HRV over time.
The respiration rate (RR), a critical physiological signal, was non-invasively captured using the BioHarness belt. This signal was subjected to pre-processing to eradicate noise and baseline wander. This process made use of a low pass filter (with cut-off frequencies set at 20 Hz for RR) and high pass filters (with cut-off frequencies of 0.1 Hz) for RR and HR, respectively. Following this, the average R-R intervals or the time period of the cardiac cycle in the ECG signal were computed. Subsequently, heart rate, expressed in beats per minute, was calculated using the provided formula.
3.6. Thermal Video Data Acquisition and Analysis
Thermal video data were meticulously obtained utilizing a Flir1020 thermal camera, offering an impressive resolution of 1024 × 768 and a precision accuracy of +/−1 °C with an emissivity set at 0.95. The analytical process was facilitated using the robust FLIR ResearchIR (64 bit) software platform (version 4.40.12.38), ensuring the efficient examination and interpretation of the captured data.
Frame selection was performed judiciously based on the clarity of the Regions of Interest (ROIs) and the overall focus of the frame. ROIs were demarcated on a pair of frames per video—one from the start and another near the end of the video. This method ensured an encompassing understanding of the thermal changes observed throughout the video duration. Furthermore, thermal video data were collected both prior to and subsequent to feeding activities, enabling a comprehensive assessment of potential variations linked to feeding.
3.7. Physiological Data Collection and Processing
At the onset of the fourth week, physiological data, namely rectal temperature and saliva samples, were collected meticulously from the pig subjects. Rectal temperature was measured during isolation periods, both before and after feeding. The temperature was gauged using a highly precise microlife vet-temp VT1831 thermometer, ensuring accurate physiological temperature readings.
Saliva samples were collected by encouraging the piglets to chew on a Q-tip for a brief duration, ranging from a few seconds to a minute, until the cotton was thoroughly saturated with saliva. The saliva-infused Q-tip was then placed in a Salivette®, the cotton swab was removed, and the tip was cut off. To ensure sample integrity, the saliva samples were refrigerated at 4 °C for a maximum of two days. After this, the samples underwent centrifugation at 3000× g for 10 min, followed by pipetting into a 96-Wells plate for preservation at −18 °C Subsequently, Cortisol Saliva ELISA (Tecan) analysis was conducted according to standard instructions, and the optical density was measured using a photometer at 450 nm.
For the initial day of collection, saliva samples were obtained during two different situations, while on the subsequent collection days, saliva was procured during four distinct situations. This methodological approach facilitated a broad-based understanding of physiological changes under various conditions.
3.8. Employing Data Analytics for Unraveling Stress Levels and Adaptation Physiology in Pigs: A Detailed Examination of Techniques, Methodologies, and Consequential Insights
This study has made extensive use of sophisticated data analytics approaches, marrying these techniques with meticulously designed methodologies. This powerful combination provided a gateway to explore and deeply understand the intricate interplay of stress levels, behavior, and physiological adaptations in pigs under diverse conditions. Applying this rigorous, data-driven approach, invaluable insights into the welfare and behavior of these animals were extracted. This enlightening information sets the foundation for substantial enhancements to livestock management practices, contributing to the animal welfare, productivity, and overall sustainability of livestock operations. Table 2 showcases the assortment of analytical methods used to probe the pertinent research questions about pig stress and adaptation physiology. Each associated methodology is detailed, demonstrating how these techniques were skillfully employed to garner significant insights. The findings underscore the immense potential of data analytics in animal behavioral and physiological studies. This powerful, modern approach is instrumental in the development of improved livestock management strategies that promote the welfare of the animals while optimizing productivity.
4. Results and Discussions
Stress in pigs can be evaluated by detecting physiological changes such as those recorded by the 3-in-1 sensor and alterations in behaviors inferred from accelerometer data. Some potential stress indicators include heart rate (HR), heart rate variability (HRV), breathing rate (BR), and changes in activity and posture [25,26,27,28]. Furthermore, parameters such as ECG amplitude, ECG noise, and galvanic skin response (GSR) can also signify increased stress levels. However, it’s important to acknowledge that these changes need to be substantial and sustained to reliably attribute to stress, as short-term fluctuations can occur for various reasons.
4.1. Q1. Unveiling the Complexity of Heart Rate Variations: Solo vs. Paired Pigs
The study embarked on a journey to unravel the intricate dynamics of heart rate (HR) and heart rate variability (HRV) in pigs under varying conditions, specifically in isolation versus paired settings. Stress typically leads to increased heart rate. Therefore, an upward trend in HR data may suggest increased stress. HRV is commonly used as a non-invasive measure of autonomic nervous system activity and can provide insights into the overall health and physiological condition of the animal. Furthermore, heart rate variability (HRV), which is the fluctuation in the time intervals between heartbeats (Table 3), can be a potent indicator of stress. High HRV usually suggests less stress, while low HRV may indicate higher stress levels.
The mean heart rate (HR) value peaks for Pig15 and dips to its lowest for Pig11. Conversely, the standard deviation for heart rate is at its maximum for Pig21. A higher standard deviation signifies greater fluctuation in heart rate. However, a higher standard deviation does not necessarily indicate elevated stress levels over time. The mean value, which is more closely tied to stress levels, suggests that Pig15 may experience higher stress levels than the other pigs. However, heart rate is not the sole determinant of stress, and a comprehensive analysis of multiple factors is required before drawing definitive conclusions.
Turning to heart rate variability (HRV), the mean HRV is lowest for Pig15 and highest for Pig22. The standard deviation of HRV is at its maximum for Pig22 and lowest for Pig15. It’s important to remember that higher HRV can be an indicator of low-stress levels, while lower HRV may suggest higher stress levels.
In summary, Pig15 exhibits the highest mean HR and the lowest mean HRV, both conditions associated with higher stress levels, suggesting that Pig15 may experience the highest stress levels. Pig21, on the other hand, shows the highest standard deviation, indicating greater fluctuation in heart rate, which could be attributed to various factors. The statistics for all other pigs show variability and can be higher or lower at different instances, underscoring the need for a comprehensive, multi-factorial approach to assessing stress levels.
4.1.1. Frequency Domain Analysis: A Deep Dive into Heart Rate Variability
Frequency domain analysis of heart rate variability (HRV) is a sophisticated method used to examine the distribution of power within the HRV signal across distinct frequency bands. HRV, defined as the variation in time intervals between consecutive heartbeats, mirrors the intricate interplay between the sympathetic and parasympathetic nervous systems.
For a detailed analysis, individual graphs are plotted for each pig, allowing for a separate examination of the frequency bands. The x-axis of these graphs represents multiple bands, each corresponding to specific activities associated with the sympathetic and parasympathetic systems.
The frequency bands for HRV are as follows:
Low-Frequency (LF): This band represents a blend of sympathetic and parasympathetic activity. An increase in LF power is indicative of heightened sympathetic activity.
High-Frequency (HF): This band primarily reflects parasympathetic activity. A decrease in HF power levels suggests reduced parasympathetic activity.
LF/HF Ratio: This ratio illustrates the balance between the sympathetic and parasympathetic nervous systems. A higher LF/HF ratio indicates a dominance of sympathetic activity.
Figure 4 presents a bar chart illustrating the power distribution across different frequency bands for Pig13 and Pig22. The frequency domain features of heart rate variability (HRV) are computed, including high-frequency (HF) power, low-frequency to high-frequency (LF/HF) ratio, total power, and very-low-frequency (VLF) power. The X-axis represents these frequency bands, while the Y-axis indicates the power values. The chart provides insights into the autonomic nervous system activity of the pigs and potential health conditions.
The analysis of frequency bands for five pigs (Pig13, Pig21, Pig22, Pig15, and Pig11) provides a comprehensive understanding of their heart rate variability (HRV) and potential stress levels.
Starting with Pig13, the total power of the frequency bands reaches up to 175, a sum of various smaller bands. The higher LF bands suggest a dominance of the sympathetic nervous system, often associated with stress. The LF/HF ratio is notably low, while the HF band is below 25, indicating lower parasympathetic activity.
In the case of Pig22, the vLF band power is lower compared to Pig13, while the overall power remains similar. All other bands show typical behavior, with a slight increase in the HF band compared to Pig13, suggesting a slightly higher parasympathetic activity. For Pig22, the total power increases to 200, with the vLF band showing a significant rise to a power of 125. This increase in vLF levels, indicative of heightened sympathetic dominance, suggests a higher likelihood of stress for Pig22.
Observing Pig15, the overall power does not exceed 160, with all other bands falling within the normal range, similar to Pig13 and Pig22. The total power, representing the overall variability in HRV over time, is dependent on the other frequency bands. As previously discussed, low HRV can also be an indicator of stress.
Lastly, for Pig11 (refer to Supplementary Information), the total power band is at a power of 300, a value remarkably higher compared to the other pigs. This elevated total power is due to variations in other bands. The higher HF indicates a heightened sympathetic response associated with relaxation. Conversely, the LFnu is within the normal range, and the LF/HF ratio is also behaving normally, indicating high parasympathetic activity, which is associated with relaxation.
The analysis of frequency bands provides valuable insights into the balance between the sympathetic and parasympathetic nervous systems in pigs, offering potential indicators of stress levels.
4.1.2. Comparative Analysis of Heart Rate and Heart Rate Variability under Different Conditions
To delve deeper into the effects of social conditions on the autonomic regulation of pigs, the animals were placed in varying environments. Given the social nature of pigs, isolation can significantly impact their behavior and autonomic responses. This study investigated the variations in heart rate (HR) and heart rate variability (HRV) under different conditions, such as isolation and pairing.
For Pig13, the mean HR is higher in isolation than in paired conditions, while the HRV is lower in isolation (Table S3Q1). The standard deviation for HR is also high, indicating more significant fluctuations in heart rate in isolation. Contrarily, for Pig15, Pig21, and Pig22, the HR is higher in paired conditions than in isolation, and the HRV is lower in paired conditions. This suggests that these pigs may experience more stress in paired conditions than in isolation, a deviation from the pattern observed in Pig13.
Individual variations in HR and HRV can be influenced by factors such as diet, behavioral patterns, environmental parameters, and health status in different housing settings. This leads to the conclusion that stress levels in pigs may vary significantly depending on their individual dynamics. Elevated heart rate and reduced heart rate variability are potential indicators of stress, often associated with a dominant sympathetic response, which is more frequently observed in isolated conditions.
4.1.3. Autocorrelation Analysis of ECG Amplitude Time Series across Different Pigs
The autocorrelation function (ACF) plot is a crucial tool for understanding the correlation structure and patterns within the ECG amplitude time series in pigs. The ACF plot, with autocorrelation values on the y-axis and corresponding lag values on the x-axis, visualizes the correlation coefficients for each lag, indicating the strength of correlation in either a positive or negative direction.
In this analysis, we focus on the autocorrelation at longer lag periods to interpret patterns and trends over extended durations. The autocorrelation plot reveals the correlation between the ECG amplitude at a given point in time and its lagged versions.
For Pig11, a positive correlation is observed between the ECG amplitude at a given time and its lagged versions (Figure 5). The correlation varies over the lag period, indicating similar patterns observed in ECG amplitude. For Pig13, a stronger positive correlation is observed, indicating remarkably consistent patterns of ECG amplitude over a given period. When analyzing Pigs 15, 21, and 22, a positive correlation is observed for all, indicating similar patterns of ECG amplitude at a given time. Pig15 exhibits a stronger positive correlation than Pigs 21 and 22. For Pig22, the correlation varies more over the lagged versions, indicating greater fluctuation in ECG amplitude.
These findings provide valuable insights into the temporal patterns of ECG amplitude in pigs, contributing to our understanding of their physiological responses under different conditions.
4.1.4. Time Domain Analysis: Unraveling the Heart Rate Characteristics
In the time domain analysis, various metrics are calculated for each pig and activity. These metrics, such as Mean RR, SDRR, RMSSD, pNN50, and others, aid in comparing the heart rate characteristics of pigs in isolated vs. paired settings. They help us identify patterns and differences that indicate variations in heart rate variability and potential stress levels between the two settings.
In the time domain analysis of the collected data, we computed various metrics for each pig and activity, providing a rich and detailed examination of heart rate variability and potential indicators of stress levels.
For instance, the mean RR interval (the average duration between consecutive heartbeats) was calculated. In general, higher mean RR values were suggestive of lower stress levels. The standard deviation of these RR intervals (SDRR) was also calculated, with higher values indicating greater heart rate variability and potentially lower stress levels. Other metrics such as RMSSD (the root mean square of successive RR interval differences), pNN50 (the percentage of successive RR intervals that differ by more than 50 milliseconds), and NN50 (the number of successive RR intervals that differ by more than 50 milliseconds) were computed, which further enriched our understanding of heart rate variability and its potential correlation with stress levels.
For example, pig11, when in isolation, exhibited a mean RR of 121.78 ms and an average heart rate of 134.05 beats/min. Similarly, pig22, when paired, displayed a mean RR of 151.33 ms and an average heart rate of 139.28 beats/min. Comparison of these metrics provided an opportunity to explore variations in heart rate variability and potential stress levels between the different settings.
For frequency domain analysis, metrics like power spectral density (PSD) were calculated using Fast Fourier Transform (FFT). This enabled us to examine the frequency distribution of heart rate variability. By analyzing the power distribution across different frequency bands (e.g., high-frequency (HF), low-frequency (LF), very-low-frequency (VLF)), we gained insights into the autonomic regulation of the heart and potential stress-related changes.
For instance, pig11, when isolated, exhibited a total power of 605,530.74, with VLF, LF, and HF powers of 78,413.02, 55,994.48, and 53,143.34 respectively, and an LF/HF ratio of 1.05. In contrast, pig22, when paired, displayed a total power of 1,349,284.61, with VLF, LF, and HF powers of 93,236.78, 191,955.11, and 172,817.98 respectively, and an LF/HF ratio of 1.11. Such analysis and comparison of the power spectral densities across different activities allowed us to identify differences in autonomic balance and potential stress-induced alterations.
Taken together, findings from both time and frequency domain analyzes provided a comprehensive understanding of the heart rate patterns and heart rate variability related to stress in pigs under different conditions. Please refer to Supplementary File S3Q4 for further details, including the complete set of calculated metrics and relevant visualizations.
4.1.5. Poincaré Plot Analysis: A Nonlinear Perspective on Heart Rate Variability
The Poincaré plot provides a nonlinear graphical representation of the dynamic properties of RR interval data, offering insights into the autonomic control and regulatory mechanisms of the cardiovascular system. By analyzing the Poincaré plots, we can understand the complex interactions of the autonomic nervous system on heart rate modulation.
In our analysis, we observed that the value of sd2 was more pronounced (Figure 6) across all pigs and their respective activities. In a Poincaré plot, sd2 signifies the standard deviation of the points deviating from the line of identity. It typifies the dispersal of successive RR intervals along the line of identity; the diagonal line presented in the plot.
The sd2 value encapsulates the long-term variability in heart rate, explicitly elucidating variations between successive heartbeats. It imparts information about fluctuations in heart rate on a beat-to-beat basis, correlating with the parasympathetic (vagal) regulation of the heart.
A larger sd2 designates a heightened variability between successive RR intervals, indicative of a more intricate and flexible heart rate pattern. This might serve as a marker of a robust autonomic nervous system and commendable cardiovascular adaptability. On the contrary, a reduced sd2 infers diminished variability, which might be associated with an increased cardiovascular risk and decreased autonomic function.
To summarize, in a Poincaré plot, sd2 quantifies the dispersal of consecutive RR intervals perpendicular to the line of identity, offering valuable insights into heart rate variability and autonomic nervous system activity.
4.1.6. A Multifaceted Approach to Understanding Heart Rate Patterns
This multifaceted approach that combines both time and frequency domain analyses, along with Poincaré plot analysis, provides a comprehensive understanding of the heart rate patterns and heart rate variability related to stress in pigs in isolated vs. paired settings.
In this study, I also computed a variety of heart rate variability (HRV) metrics derived from RR interval data for each pig. HRV metrics offer pivotal insights into heart rate patterns and fluctuations, mirroring the dynamic interaction between the sympathetic and parasympathetic branches of the autonomic nervous system.
Utilizing the hrvanalysis library, I calculated HRV metrics across different domains, encompassing time domain (including metrics like mean RR interval, SDNN, RMSSD, pNN50), frequency domain (with metrics like LF power, HF power, LF/HF ratio), and Poincaré plot features (SD1 and SD2). These metrics facilitated the assessment of overall variability, autonomic balance, and complexity of heart rate dynamics for each pig.
By grouping the data based on the animal and activity, I computed HRV metrics for every combination of pig and activity. The outcomes were stored in a DataFrame, results_df, where each row corresponded to a pig’s data, and each column signified an HRV metric. The resulting DataFrame could then be further analyzed, visualized, or used for comparative studies and statistical analyses.
Our intention was to extract and calculate HRV metrics from RR interval data, providing quantitative measures of heart rate variability for different pigs and activities. The analysis revealed that periods when the animals experienced the highest stress, presumably as indicated by the maximum values of LF and SDNN, produced similar results across the different pigs. This suggests a consistent physiological response to stress across the animals studied, offering valuable insights into stress-related changes in heart rate dynamics.
Individual Variability: A Key Factor in Heart Rate Dynamics
The results revealed that the average HR and HRV differed significantly among the pigs, suggesting individual variability. For instance, pig13 exhibited a higher average HR in isolation than in pairs, with a lower HRV in isolation than in pairs. This suggests that pig13 experienced more stress when isolated. In contrast, pigs 15, 21, and 22 showed higher HR in pair conditions than in isolation, indicating more stress in pair conditions.
The Influence of External Factors on Heart Rate Variability
The study also revealed that factors such as diet, behavioral patterns, environmental parameters, and health status in different housing settings could influence individual variation in HR and HRV. It was concluded that pigs are more likely to experience greater stress depending on their individual dynamics.
Beyond Heart Rate: Other Indicators of Stress
In addition to HR and HRV, other factors such as breathing rate (BR), posture, electrocardiogram (ECG) noise, galvanic skin response (GSR), movement directions, and stress score were examined under isolated and paired conditions. It was observed that HR and BR were higher in isolated conditions, potentially indicating elevated stress levels.
The Role of Age in Heart Rate Variability
Interestingly, the average age of pigs in isolated conditions was 101, while in paired conditions, it was 89. This age difference might have contributed to the higher stress signs detected in isolated pigs. The study also considered age as a crucial component when interpreting HR and HRV data. It was observed that older pigs had a higher HR compared to younger ones and a lower HRV, potentially indicating elevated stress levels as they aged.
A Step toward Better Understanding of Stress in Pigs
This study’s specific objective is to provide valuable insights into the effects of social conditions on the heart rate and heart rate variability in pigs. It highlights the importance of considering individual variability and other factors, such as age and environmental conditions, when assessing the stress levels in pigs. Further research is needed to explore these factors in more depth and to develop strategies to manage and mitigate stress in pigs in different housing settings.
4.2. Q2. Respiration Rate Changes in Paired vs. Isolation Conditions: Assessing Stress Levels
We delved into an exploration of variations in the respiration rates of pigs during isolation and pairing periods, with an intention to unearth potential stress indicators. A meticulous analysis of the ‘BR’ (Breathing Rate) variable was carried out during these periods to decode potential manifestations of stress.
The cornerstone of our investigation rested on the calculation of key summary statistics, such as the mean, median, and standard deviation of respiration rates for both isolation and pairing periods. These statistical measures were instrumental in understanding the central tendency and variability of respiration rates under each condition. To aid visual interpretation, we employed histograms to display the distribution of respiration rates in both settings.
Insights derived from the comparison of these summary statistics, along with the inspection of the histograms, led us to infer a perceptible difference in the respiration rates between the two conditions. While respiration rate offers a crucial piece of the puzzle, it’s essential to consider that it alone may not provide a holistic view of stress levels, given the potential influence of various other factors. Consequently, our comprehensive assessment of stress levels involved taking into account other physiological and behavioral indicators in conjunction with the respiration rate.
Figure 7 delineates the variation in the respiration rate of Pig22 with respect to age. As an essential physiological parameter, the respiration rate is portrayed in a box plot format against different age stages, offering a clear visual representation of the central tendency, dispersion, and outliers within each age group. It is noteworthy that any observed trends or age-related differences could potentially illuminate the physiological changes that transpire as pigs age. For instance, if an increase in respiration rate with age was observed, it could imply age-related changes in the pigs’ metabolism or overall health status.
To validate our findings statistically, we employed the Mann–Whitney U test, which compares the ranks of respiration rates between the isolation and pairing conditions. The p-value derived from the test served as a decisive factor in establishing whether there was a statistically significant difference in the respiration rates between the two conditions. A p-value below the set significance level (typically 0.05) indicated a significant difference, suggesting that the state of pairing might have had an impact on respiration rates and, thereby, stress levels.
In Figure 8, we present a comparative analysis of the Mean Normal-to-Normal interval (NNI), a key parameter in heart rate variability (HRV), for Pig21 in isolation and pair settings. This comparison was conducted with a view to unearthing changes in heart rate variability, which is known to be influenced by the interplay of the parasympathetic and sympathetic branches of the autonomic nervous system. The bar chart distinctly displays the Mean NNI for the two different social environments. If a significant divergence in the Mean NNI between the isolation and pair settings was discerned, it could be indicative of variances in the physiological stress experienced by the pig in these distinct contexts. For example, higher variability (and thus, higher Mean NNI) in one of the conditions could suggest a healthier autonomic nervous system response in that particular setting.
Our results demonstrated an intriguing trend where isolation appeared to induce more stress, as evidenced by a higher SDNN/LF ratio. Conversely, the paired setting was characterized by increased LF values, pointing towards elevated stress levels. Furthermore, the SDNN metric underscored heightened stress levels in the paired condition.
The detailed results showed that during isolation, the mean respiration rate varied across pigs, ranging from approximately 13.36 to 17.16 breaths per minute. In contrast, during the paired setting, the mean respiration rate ranged roughly from 15.97 to 20.42 breaths per minute. The standard deviation, which measures the variability in respiration rate, was noticeably higher in the paired setting across all pigs, indicating a more varied and dynamic respiratory response in this condition.
Additional, more advanced analytical techniques were also employed, which involved autocorrelation plots and time-series decomposition. Autocorrelation plots shed light on the temporal persistence of patterns in respiration rates. For instance, a high autocorrelation at a lag of one indicates a strong relationship between the respiration rate at any point and the rate in the preceding period. Time-series decomposition, on the other hand, helps segregate trends, seasonality, and residual components in the respiration rate data, providing an understanding of systematic patterns or cycles over time, which could be indicative of underlying biological or environmental processes.
4.3. Q3. Comparison of Activity Levels (Measured by Accelerometer Data) in Pigs during Isolation vs. Paired Settings: Insights into Stress-Related Behavioral Changes
How does the activity, as measured by accelerometer data, change when pigs are isolated versus when they are paired? Is there a discernible difference in activity levels or patterns that might suggest behavioral changes related to stress?
In addressing this question, we conducted a comprehensive analysis of the collected data, with a specific focus on the accelerometer data. The dataset included variables such as ‘PeakAccel’, ‘VerticalMin’, ‘VerticalPeak’, ‘LateralMin’, ‘LateralPeak’, ‘SagittalMin’, and ‘SagittalPeak’, which provide valuable insights into the movement patterns of the pigs.
It is crucial to consider variables like ‘Activity’ and ‘Posture’ to evaluate activity changes during isolation versus pairing periods. These variables can offer indications of overall activity levels and potential behavioral changes when pigs are isolated compared to when they are paired.
For a more nuanced analysis, we utilized the ‘Time’ and ‘Date (Age of pigs)’ variables to contextualize the data within isolation and pairing periods. This allowed us to identify potential temporal patterns and variations in activity levels.
To examine if changes in activity patterns suggest behavioral changes related to stress, we simultaneously analyzed variables such as ‘HR’ (Heart Rate), ‘BR’ (Breathing Rate), and ‘HRV’ (Heart Rate Variability). These physiological markers can serve as indicators of stress responses and provide insights into the pigs’ well-being.
To identify significant changes or deviations in the time series data, we employed change point detection techniques. The process involved variable selection based on mutual information scores, encoding the target variable numerically, and applying CUSUM analysis to detect change points in the selected variables. This approach allowed us to pinpoint the specific time points where significant changes occurred in the accelerometer data.
Furthermore, we visualized the time series data for each pig and activity group, highlighting the detected change points. This visual representation facilitated a thorough examination of the identified deviations in the data, enabling us to gain a better understanding of the patterns and potential stress-related behavioral changes.
To explore the clustering of accelerometer data and gain further insights into activity patterns, we applied K-means clustering. By clustering the data based on selected variables, we were able to identify distinct clusters and visualize the relationships between accelerometer measurements. This analysis provided valuable information about the different activity levels or patterns exhibited by the pigs during isolation and pairing periods.
To analyze the changes in activity levels for Pig22 during isolation and pairing periods, we conducted a change point detection analysis. Figure 9 presents the results of this analysis, focusing on the ‘PeakAccel’ variable. The x-axis represents the dates of data collection, while the y-axis represents the ‘PeakAccel’ values.
The line plot clearly depicts the variations in ‘PeakAccel’ over time. Notably, change points are identified as significant deviations from the usual activity pattern. These change points indicate shifts in activity levels during different social contexts, namely isolation and pairing periods. By visualizing the detected change points, we gain valuable insights into the dynamic nature of pig activity and how it is influenced by the social environment. This analysis highlights the potential behavioral changes that pigs may exhibit when transitioning from isolation to pairing or vice versa.
These findings suggest that the presence or absence of social interaction can significantly impact the activity levels of pigs, which could be indicative of changes in their behavioral response and potential stress levels. Understanding these activity patterns and their relationship with stress can contribute to enhancing the welfare and well-being of pigs in various management settings.
Figure 10 displays the results of applying K-means clustering to accelerometer variables, specifically VerticalMin on the X-axis and VerticalPeak on the Y-axis. The data points are labeled with cluster assignments (Cluster 0, Cluster 1, and Cluster 2) obtained from the clustering algorithm. The cluster labels have been added to the dataset for easy interpretation and analysis. This visualization allows for the exploration of distinct patterns and relationships between VerticalMin and VerticalPeak measurements within each cluster.
Overall, our analysis of accelerometer data, including change point detection and K-means clustering, yielded important insights into the activity changes and potential behavioral alterations related to stress in pigs. These findings contribute to our understanding of the pigs’ welfare and can inform future research and interventions aimed at improving their well-being in different social contexts.
4.4. Q4 Detecting Abnormalities in Pig Gait Using Accelerometer Data: Unraveling Patterns Associated with Lameness
In order to investigate the presence of abnormalities or changes in gait that may be associated with lameness in pigs, we conducted an analysis of the accelerometer data. The data encompassed several key accelerometer variables, including ‘PeakAccel’, ‘VerticalMin’, ‘VerticalPeak’, ‘LateralMin’, ‘LateralPeak’, ‘SagittalMin’, and ‘SagittalPeak’. These variables provided valuable insights into the pigs’ movement patterns in various directions, enabling a comprehensive examination of their gait.
To identify specific patterns indicative of lameness, we focused on significant changes or inconsistencies within the accelerometer variables. For instance, a pig experiencing lameness might exhibit an irregular or asymmetrical movement pattern, which could manifest as erratic readings within the accelerometer data. Additionally, we might observe a decrease in ‘PeakAccel’ when a pig moves more slowly due to lameness or alterations in the ‘Vertical’, ‘Lateral’, and ‘Sagittal’ measures if the pig is favoring one side or limping.
To further explore these patterns and detect any anomalies, we employed unsupervised learning techniques, such as clustering or anomaly detection. These methods allowed us to capture the temporal patterns within the accelerometer data and classify them as either normal or abnormal.
Specifically, we performed a k-means clustering analysis on the accelerometer data using the selected variables mentioned earlier. This analysis helped to identify distinct clusters based on activity (‘bfandaf_isoandpair’) and cluster assignments. For example, for Pig ID ‘pig13’ in Cluster 0 of the ‘bfandaf_isoandpair’ activity, the mean values for the accelerometer variables were as follows: Mean PeakAccel: 0.148, Mean VerticalMin: −0.143, Mean VerticalPeak: 0.040, Mean LateralMin: −0.573, Mean LateralPeak: −0.374, Mean SagittalMin: −0.859, and Mean SagittalPeak: −0.645. Similar mean values were calculated for other clusters and pigs.
Furthermore, we calculated various temporal parameters related to gait, such as step duration, stride length, stance duration, and swing duration. Step duration was computed as the time difference between consecutive peaks in a specific accelerometer variable, while stride length was determined by averaging the vertical and sagittal peaks. Stance duration was calculated as the time difference between consecutive peaks in the vertical variable, and swing duration was derived from the time difference between consecutive peaks in the vertical variable. For instance, within the ‘af_isoandpair’ activity, Cluster 2 exhibited a mean PeakAccel of 2.319, VerticalMin of −1.246, VerticalPeak of 1.139, LateralMin of −1.393, LateralPeak of 1.082, SagittalMin of −2.443, and SagittalPeak of 0.939 for Pig ID ‘pig22’. These values indicated significant differences in gait characteristics compared to healthy pigs.
The scatter plot (Figure 11) illustrates the clustering analysis of accelerometer data, with VerticalMin on the y-axis and PeakAccel on the x-axis. The data points are grouped into distinct clusters, highlighting patterns and relationships between these variables. Clustering enables the identification of common behavioral patterns and abnormalities in pig gait.
By comparing these temporal parameters across different pigs, activities, or time points, we were able to identify variations in gait characteristics. For instance, we analyzed the average stride length and stance duration (Figure 12) for each unique combination of ‘Animal’, ‘Activity’, and ‘Age’. The results revealed distinct patterns in gait characteristics, allowing for comparisons between different activities and age groups for each pig.
Our analysis of accelerometer data provided valuable insights into the detection of abnormalities or changes in gait associated with lameness in pigs. By focusing on specific accelerometer variables and conducting statistical analyses, we were able to identify patterns indicative of lameness and extract relevant temporal parameters for comprehensive gait assessment. These findings contribute to our understanding of the relationship between accelerometer data and lameness in pigs, providing a foundation for future research and potential interventions to improve animal welfare.
4.5. Q5 Correlation between Age and Gait/Activity Patterns in Pigs: Insights from Accelerometer Data
The specific objective of this study embarks on an exploration of the correlation between age and gait/activity patterns in pigs, employing accelerometer data as a primary tool. The accelerometer variables, including ‘PeakAccel’, ‘VerticalMin’, ‘VerticalPeak’, ‘LateralMin’, ‘LateralPeak’, and ‘SagittalMin’, were meticulously analyzed to assess the pigs’ movement patterns and overall activity levels.
The research methodology involved the use of statistical analyses, visualization techniques, and regression models. These tools were instrumental in exploring the relationships between age, accelerometer variables, and walking ability. The findings from this specific objective provide valuable insights into the walking ability of pigs as they age, contributing to a broader understanding of the factors affecting their gait patterns and physical activity levels.
A comparative analysis was conducted among selected pigs to highlight variations in step count and cadence. These variations imply differences in their activity levels and potential walking abilities. Regression models and machine learning algorithms were employed to delve deeper into the relationships between age, accelerometer variables, and walking ability. These models, by accounting for individual differences between pigs and controlling for confounding factors, offer a more comprehensive understanding of the influence of age on gait patterns and activity levels.
The correlation analysis revealed significant associations between age and accelerometer variables. Notably, the variables ‘VerticalMin’, ‘VerticalPeak’, ‘LateralMin’, ‘LateralPeak’, ‘SagittalMin’, and ‘SagittalPeak’ showed p-values less than 0.05, indicating their significance in assessing walking ability. These findings suggest that changes in these accelerometer variables may reflect alterations in gait patterns as pigs age.
Furthermore, the step count and cadence, calculated from accelerometer data, served as indicators of physical activity levels and walking ability. The step count of Pig22 was significantly lower compared to Pigs 15, 21, and 13. These results suggest that Pig22 had a lower number of steps during the observation period, indicating relatively lower activity levels. Additionally, the cadence of Pig22 was slightly lower than that of Pigs 15, 21, and 13. This indicates a potentially slower walking pace for Pig22 in comparison to the other pigs.
Time series analysis was performed on the accelerometer data to investigate how gait/activity patterns change over time within individuals. Smoothing techniques were applied, and the data were visualized over age to identify trends, patterns, or abnormalities in the gait/activity patterns of the pigs. This detailed analysis of the temporal dynamics of gait/activity patterns can provide further insights into age-related changes or anomalies in movement patterns.
Regression models and machine learning algorithms were employed to analyze the relationship between age, accelerometer variables, and walking ability. By controlling for other factors and accounting for individual differences between pigs, these models allowed for a more comprehensive understanding of the influence of age on gait patterns and activity levels.
The box plot is grouped by age, allowing for a comparative analysis of the vertical peak values within each age group. The box represents the interquartile range (IQR) of the data, with the horizontal line inside the box indicating the median. The whiskers extend to the minimum and maximum values within 1.5 times the IQR, while any data points outside this range are considered outliers and marked as individual points. By examining the box plot, we can observe variations in the vertical peak of the breathing waveform (Figure 13) across different age groups, providing insights into potential age-related differences in respiratory patterns among the pigs.
Furthermore, the step count and cadence, calculated from accelerometer data, served as indicators of physical activity levels and walking ability. Comparative analysis of selected pigs (e.g., Pig22 compared to Pigs 15, 21, and 13) demonstrated variations in step count and cadence, implying differences in their activity levels and potential walking abilities. Pig22 exhibited a lower step count and slightly lower cadence compared to the other pigs, indicating relatively lower activity levels. The correlation analysis between age and accelerometer variables provided valuable insights into the relationship between age and gait/activity patterns in pigs. Table 4 presents the correlation coefficients and p-values for each variable.
The results indicate various degrees of correlation between age and the accelerometer variables. Notably, ‘VerticalMin’, ‘VerticalPeak’, ‘LateralMin’, ‘LateralPeak’, ‘SagittalMin’, and ‘SagittalPeak’ show moderate negative correlations with age, ranging from −0.157 to −0.116. On the other hand, ‘PeakAccel’ exhibits a weak negative correlation (−0.082) with age. These findings suggest that as pigs age, there may be a tendency for certain accelerometer variables to decrease.
Step Count and Cadence Analysis: To assess the walking ability of pigs, step count, and cadence were calculated based on accelerometer data. A comparative analysis was performed to highlight differences among selected pigs, specifically Pig22, compared to Pigs 15, 21, and 13. The step count of Pig22 (8240) is significantly lower compared to Pigs 15, 21, and 13, which recorded step counts of 11,281, 12,521, and 12,422, respectively. These results suggest that Pig22 had a lower number of steps during the observation period, indicating relatively lower activity levels. Additionally, the cadence of Pig22 (393.43 steps per minute) was slightly lower than that of Pigs 15, 21, and 13. This indicates a potentially slower walking pace for Pig22 in comparison to the other pigs.
While the current analysis provides valuable insights, it is important to acknowledge certain limitations. The relationship between age and gait/activity patterns can be influenced by various factors such as pig health, fitness level, and environmental conditions. Therefore, future research should consider incorporating additional data and investigating these factors to gain a more comprehensive understanding of the observed correlations.
This study successfully explored the correlation between age and gait/activity patterns in pigs using accelerometer data. The correlation analysis revealed significant associations between age and accelerometer variables, indicating potential age-related changes in gait patterns. The step count and cadence analysis highlighted differences in activity levels and potential walking abilities among selected pigs. Moreover, time series analysis and regression models provided insights into the temporal dynamics of gait/activity patterns and the influence of age on walking ability.
These findings contribute to the assessment of pig well-being, early detection of potential health issues, and the optimization of living conditions. Further research and comprehensive analyzes considering additional factors are necessary to establish definitive conclusions and enhance our understanding of the complex relationship between age, accelerometer variables, and walking ability in pigs.
4.6. Q6 Assessing Stress and Aggression in Paired Pigs: An Accelerometer Data Analysis
The central objective of this scientific endeavor was to investigate whether accelerometer data; specifically, variables such as ‘PeakAccel’, ‘VerticalMin’, ‘VerticalPeak’, ‘LateralMin’, ‘LateralPeak’, ‘SagittalMin’, and ‘SagittalPeak’signified noteworthy modifications in the activity when pigs are paired, potentially suggesting increased aggression or stress. These measures collectively offer an inclusive picture of the movement patterns in pigs, enabling a comprehensive analysis of their activity levels under varied conditions.
As part of our analytical strategy, we examined the pigs in three specific behavioral states: feeding, isolation, and pairing. The ‘Activity’ variable, in combination with the aforementioned accelerometer variables, served as the foundation of our investigation. An initial understanding of the data and the emergent patterns was derived from an Exploratory Data Analysis (EDA). This involved the deployment of descriptive statistical measures, such as the mean, median, and variance, as well as data visualization techniques, including histograms and box plots.
Our objective was to compare activity levels across the states and discern whether any observable differences were statistically significant. Given the non-normal distribution of the data for most variables, as suggested by Kernel Density Estimation (KDE) plots, we employed non-parametric statistical testing methods, such as the Mann–Whitney U test. This test was critical to ascertain whether the observed differences in activity when pigs were paired versus when they were alone reached a level of statistical significance.
The evaluation of physiological measures, specifically ‘HR’ (Heart Rate) and ‘BR’ (Breathing Rate), was integral to our study. Both measures are established indicators of stress levels, offering insights into the autonomic responses of pigs under different conditions. Our analysis revealed that both HR and BR were elevated during the isolation state compared to the paired state. This observation suggests that isolation might induce increased stress levels in pigs.
Anomalies in accelerometer data, indicative of unusual activity patterns, were identified using unsupervised learning methods such as clustering and anomaly detection. Anomalies could represent outliers or data points deviating from the expected pattern, thus signaling potential behavioral changes. Notably, our analysis revealed a lower proportion of anomalies in the paired state compared to isolation. This pattern suggests reduced activity during pairing, possibly indicative of heightened stress or aggression in the paired state.
In our attempt to understand the variations in pig activity under different conditions, we developed a comprehensive boxplot (Figure 14) representing the accelerometer variables ‘PeakAccel’, ‘VerticalMin’, ‘VerticalPeak’, ‘LateralMin’, ‘LateralPeak’, ‘SagittalMin’, and ‘SagittalPeak’ for both isolated and paired pigs.
Figure 14 offers an insightful comparison between the two states of activity, distinctly delineating the dispersion and skewness of the accelerometer variables in each scenario. This graphical representation allows us to visualize the central tendency and variability in pig activity across the two conditions, thereby providing a more robust understanding of the behavioral changes associated with isolation and pairing.
Notably, the boxplot reveals apparent differences in the distributions of each variable when comparing isolation to pairing, suggesting a marked shift in pig activity depending on their social environment. Careful examination of these distributional disparities could yield valuable insights into the potential influence of social conditions on stress and aggression in pigs. Consequently, Figure 14 serves as a vital tool in our analytical approach, providing the visual clarity required to better comprehend and interpret the complex data gathered through our accelerometer readings.
To enhance our understanding of pigs’ activity patterns, we created three new variables: ‘AccelerometerRange’, ‘MeanAccel’, and ‘ActivityRatio’ through feature engineering. These engineered features offered additional dimensions to our analysis. ‘AccelerometerRange’ encapsulated the range of acceleration values across the three axes (vertical, lateral, sagittal). It was calculated by identifying the maximum value among the peak values and subtracting the minimum value from the corresponding minimum values. The ‘MeanAccel’ represented the average acceleration across the three axes, computed by taking the average of the peak values for vertical, lateral, and sagittal directions. Lastly, the ‘ActivityRatio’ variable denoted the ratio of mean acceleration to heart rate (HR), offering a unique perspective on the pigs’ physical activity relative to their physiological state.
Anomaly detection performed on these engineered features mirrored the results obtained from the original data, further substantiating our findings. This consistency between the original accelerometer data and the engineered features lent credibility to our methodology and reinforced the reliability of our results.
A further detailed analysis comparing HRV mean and mean acceleration between isolation and pair settings for specific animals (pig11 and pig22, respectively) revealed that isolation induced a higher mean heart rate. This observation is in alignment with established research that links increased heart rate with a stress response, suggesting potential stress during isolation. The pattern of lower activity during pairing was again confirmed in these comparisons. Refer to Figure 15 for a comparative analysis demonstrating the variations in mean acceleration for Pig21 across isolation and pair settings, providing insightful data on activity patterns under different social conditions. Detailed comparisons for other pigs can be accessed in Supplementary File S3Q6.
Collectively, these findings suggest a significant association between the pairing of pigs and a decrease in activity, potentially indicative of increased stress or aggression. The observed changes in activity were found to be statistically significant according to both the t-test and the Mann–Whitney U test, adding weight to the findings. These observations highlight the potential of accelerometer data to provide valuable insights into swine behavior and well-being under different conditions. Refer to Supplementary File S3Q6 for additional graphs and relevant data visualizations.
These findings offer preliminary evidence that pairing pigs might lead to a reduction in physical activity, potentially signaling an increase in stress or aggression. While these findings provide valuable insights into the potential impact of social conditions on pig behavior, additional research is required to further explore and validate these initial observations and to fully comprehend their implications for animal welfare. Furthermore, these findings underscore the utility of non-invasive measures like accelerometer data in studying animal behavior, opening new avenues for research in this field.
4.7. Q7. Assessing Adaptive Responses in Pigs to Feeding Isolation and Post-Feeding Re-Pairing: Insights from Cardiorespiratory and Activity Data
4.7.1. Temporal Adaptation of Pigs to Isolation and Re-Pairing
The study encompassed a period from the 86th to the 108th day of age, providing an opportunity to evaluate whether the pigs adapt to the circumstances of isolation during feeding, followed by the subsequent re-pairing post-feeding. Essential physiological parameters such as heart rate, respiration rate, and activity data were diligently collected and analyzed to unravel this adaptation process. Summary statistics for these variables were computed for different phases: during isolation, before isolation, and after isolation, to provide a comprehensive view of the physiological alterations and behavioral adaptations across these varied states. Refer to Table in Supplementary File S3Q7, which delineates an in-depth comparative examination of various physiological and behavioral indicators in pigs during different times of the day, notably evening, morning, and afternoon. The observed variations across these periods furnish critical insights into the diurnal dynamics of a multitude of parameters, such as heart rate, breathing rate, posture, and activity, to name a few.
4.7.2. Correlational Insights and Heatmap Analysis
In an effort to discern the potential influence of time on heart rate (HR) and breathing rate (BR), a correlational analysis was performed. The results yielded weak correlations between HR and BR (0.016) and between HR and activity under different conditions, specifically, ‘bfandaf_isoandpair’ (−0.15), ‘bfandaf_iso’ (0.02), and ‘Activity_af_isoandpair’ (0.12). Consequently, we concluded that there may not be a linear or non-linear relationship between activity and BR/HR for the considered activities. To visualize these correlations, a heatmap (Figure 16) was constructed, elucidating the interrelationships between time, heart rate (HR), and breathing rate (BR).
4.7.3. Unraveling the Potentials of LSTM and Random Forest Models
In the quest to better understand and predict the overall behavior and environmental responses of pigs, we employed two distinct models—the Long Short-Term Memory (LSTM) model and the Random Forest model.
The LSTM model, designed for analyzing sequential data, was trained to capture temporal patterns and dependencies in the pigs’ physiological responses and activity levels over time. The Random Forest model, renowned for its versatility in handling both categorical and numerical data, provided us with a ranked feature importance list, thereby highlighting the variables with the most substantial impact on the pigs’ physiological responses and activity levels. Figure 17 depicts the Random Forest Feature importance specifically for Pig15 and Pig21. Comprehensive Random Forest Feature Importance for the remaining animals can be found in Supplementary File Figure S3Q7.
Both LSTM and Random Forest models were valuable in identifying essential variables, detecting patterns, and providing predictions or classifications. Yet, the choice between LSTM and Random Forest depended on the specific characteristics of the data. Therefore, we evaluated both models and compared their performance, providing a comprehensive understanding of the pigs’ behavior and environment.
4.7.4. Understanding the Cross-Validation Results from LSTM Model
The LSTM model, inclusive of all variables we created, such as age and animal (all animals as different columns), aimed to make predictions for the ‘Activity’ column. The cross-validation scores derived from the LSTM model offered valuable insights into the pigs’ behavior and environment.
A higher cross-validation score implied the model’s adeptness in capturing the patterns and trends in the heart rate data to predict overall activities. The mean cross-validation score served as an assessment of how well the LSTM model captured the relationship between heart rate and activity for all pigs. A high mean score suggested that heart rate is a reliable indicator of activity levels across the pig population. Conversely, a low mean score indicated that heart rate alone may not be sufficient to accurately predict activity, pointing to the need for considering additional factors or features.
In essence, the cross-validation results from the LSTM model provided us with valuable insights into the relationship between heart rate and activity of the pigs, enabling us to understand the pigs’ behavior patterns, identify influential environmental factors, and inform strategies for monitoring and managing the overall well-being of pigs in their specific environment.
By juxtaposing the outcomes from both the LSTM and the Random Forest models, we could discern the similarity in results, with the primary difference being the variables we created for the period (isolation, feeding, pair) and for time segmentation. The Animal behavior specialist could then select the most suitable model based on these insights.
An integral aspect of our analysis, as depicted in Figure 18, involved conducting class predictions on the testing set and subsequently mapping the results in a visually insightful heatmap. This graphical representation facilitated the discernment of patterns and correlations in the data, thereby providing a comprehensive understanding of the distinct categories under investigation, namely ‘bfandaf_isoandpair’, ‘bfandaf_iso’, and ‘af_isoandpair’. In addition to the heatmap, Figure 18 also incorporates a confusion matrix. This tool offered an effective means of visualizing the performance of our prediction algorithm by contrasting the predicted classifications against the actual ones. The confusion matrix thus played a pivotal role in the assessment of our model’s accuracy and its propensity for misclassification.
Furthermore, Figure 18 provides an illustration of the training and validation loss over multiple epochs. The X-axis represents the successive epochs, while the Y-axis denotes the loss values. This graphical depiction served as a valuable aid in evaluating the performance and efficiency of our predictive model over time, enabling us to monitor the model’s learning process and its convergence toward an optimal solution.
4.8. Q8. Influence of External Factors on Pigs’ Heart Rate, Respiration Rate, and Activity Level: Exploring Time of Day and Isolation Duration Effects
The broader question that was addressed through this objective pertains to the behavioral and physiological adaptability of pigs within the span of 86 to 108 days of age. Specifically, we sought to understand whether pigs exhibited signs of acclimatization to a cycle of isolation during feeding and subsequent re-pairing. We examined key physiological variables such as heart rate, respiration rate, and general activity to understand this adaptation process.
In the course of this specific objective, we encountered several variables, both temporal and environmental, that could potentially influence the pigs’ heart rate, respiration rate, or activity level. The variable ‘Time’ was significant as it helped account for the inherent diurnal rhythms or day-to-day variations in the physiological responses of the pigs. Similarly, environmental factors like ‘DeviceTemp’ or ‘SkinTemp’ were also taken into consideration, as temperature variances could directly influence the pigs’ physiological responses and activity levels.
A robust correlation analysis was undertaken to discern any strong linear relationships between these variables and the physiological parameters—’HR’ (Heart Rate), ‘BR’ (Breathing Rate), and ‘Activity’. Post this, an in-depth regression analysis was conducted, supplemented with machine learning models such as decision trees, random forest, or gradient boosting, which facilitated modeling the relationship between these variables and the pigs’ physiological responses or activity levels. These models furnished crucial insights into the contribution of each variable to changes in heart rate, respiration rate, or activity level.
Considering ‘Time’ and ‘Date’ as significant variables, we implemented time-series analysis techniques to capture any existing temporal patterns or trends in the data. For instance, we employed ARIMA (Autoregressive Integrated Moving Average) and LSTM (Long Short-Term Memory) models to detect these patterns. Moreover, to ensure the reliability of these models, validation was carried out using appropriate methods like cross-validation or out-of-sample testing. The results were then contextualized in accordance with the pigs’ overall behavior and environment.
Analysis of Heart Rate and Breath Rate: Our F-statistics for heart rate and breath rate showed substantial and insignificant differences across different time periods, respectively. The corresponding p-values corroborated these results, indicating a significant difference in heart rate across time periods but no significant difference in breath rate. The implications of these results led us to conduct further analysis, such as post-hoc tests, to determine which specific time periods significantly differ from each other.
The Examination of Activity Level: The chi-square test indicated a strong association between time periods and activity level, thereby suggesting that the distribution of activity levels varied significantly across different time periods.
In terms of modeling, the LSTM and Random Forest models were particularly beneficial in comprehending the pigs’ overall behavior and environment. These models, adept in identifying important variables, detecting patterns, and providing predictions or classifications, were central to our understanding. Nonetheless, the choice between LSTM and Random Forest depended on the specific characteristics of the data, and thus, both models were employed, and their performance was compared to derive a comprehensive understanding of the pigs’ behavior and environment.
Our results from the LSTM model provided valuable insights into the relationship between heart rate and the activity of the pigs. These insights facilitated understanding of the pigs’ behavioral patterns, identification of influential environmental factors, and informed strategies for monitoring and managing the overall pigs’ well-being in their specific environment.
From this specific objective, our analyzes underscored the significant effects of various factors or variables on the pigs’ physiological responses and activity levels. Furthermore, our investigation highlighted the critical role of time-series analysis techniques in understanding the temporal dynamics of these effects. Lastly, our use of machine learning models such as LSTM and Random Forest effectively captured the intricate relationship between various variables and physiological responses in pigs. Figure 19 presents two boxplots depicting the variations in heart rate (Figure 19a) and breathing rate (Figure 19b) during different times of the day: morning, afternoon, and evening. The y-axis represents the rate measurements, while the x-axis indicates the corresponding time period. Figure 19a and Figure 19b, representing heart and breathing rates, respectively, reveal insightful temporal patterns in the physiological responses of the pigs. In Figure 19, the heart rate distribution shows discernible differences across morning, afternoon, and evening. For instance, we can observe that the median heart rate tends to be higher in the afternoon compared to the morning and evening, suggesting that pigs may be more active in the afternoons. However, the broad range of heart rates indicated by the length of the boxes and whiskers, particularly in the morning, implies significant variability in heart rate within each time period.
It is important to note that while boxplots are effective in visualizing the central tendency and dispersion of data, further statistical analyses would be needed to confirm these observed trends and to determine whether the differences across the time periods are statistically significant. Also, these plots only provide a general trend and might not capture certain anomalies or specific periods of unusual activity, which could be essential in understanding the pig’s behavior. Thus, from these boxplots, it seems that the time of day may have an effect on the pigs’ physiological responses, with potential increased activity in the morning.
Figure 20 shows a contingency heatmap that visualizes the distribution of different pig activity states—‘af_isoandpair’, ‘bfandaf_iso’, and ‘bfandaf_isoandpair’, across various time periods: morning, afternoon, and evening. The x-axis delineates the activity states, and the y-axis represents the respective time periods.
4.9. Q9. Behavioral Pattern Recognition during Feeding, Isolation, and Pairing Periods: Insights from Sensor Data
In striving to understand the behavioral patterns of pigs during periods of feeding, isolation, or pairing, we utilized sensor data collection techniques. Predominant variables under scrutiny included activity, posture, and accelerometer data, which encompassed peak acceleration and various motion measurements in three planes of movement. As supplementary physiological context, heart rate and breathing rate were also taken into account.
To visualize potential disparities across these periods, we utilized graphical representations such as box plots, scatter plots, and time series plots. These offered a compelling visual narrative of data distribution, revealing potential variations worth further investigation. To assert the statistical significance of these observed differences, we employed statistical tests like the Analysis of Variance (ANOVA) or, in cases of non-normal data distribution, the Kruskal–Wallis test. These tests permitted us to understand if the variability in these metrics during feeding, isolation, and pairing periods was indeed statistically significant.
Turning to machine learning techniques, we found unsupervised learning methods, such as clustering, exceptionally insightful for identifying common behavioral patterns. Such methods permit the grouping of similar data points, thus helping to identify behavioral patterns, including resting, feeding, or interactions with other pigs. In addition, sequential pattern mining, a data mining technique to identify frequent sequences of events or behaviors, proved instrumental in providing further clarity.
For a more visually intuitive comprehension of the data, we plotted box plots for each variable across feeding, isolation, and pairing periods using Python’s Matplotlib and Seaborn libraries. In cases where data included timestamps, line plots of activity or accelerometer data for each period proved helpful, with color-coded delineations to represent feeding, isolation, or pairing periods. We also created scatter plots to visualize relationships between variables during these specific periods, which proved instrumental in detecting correlations and patterns of scatter.
Figure 21 provides a visual exploration of posture variations across the distinct periods of feeding, isolation, and pairing. As observed in this figure, the distribution of posture—represented by the median, interquartile range, and outliers—appears to vary across these periods. The boxplots provide a comprehensive overview of these variations, granting us a broader understanding of how the posture of pigs changes in response to these different scenarios.
The posture, inferred from sensor data, may reflect an animal’s comfort, stress level, or engagement in specific behaviors such as resting or feeding. Consequently, this offers a non-invasive measure to evaluate the pigs’ welfare during these different periods. Understanding such patterns is paramount in ensuring optimal living conditions and welfare for the animals.
This analysis, together with the statistical and machine learning techniques mentioned earlier, provides a robust framework for dissecting the intricate dynamics of pig behavior in varying circumstances. The data underscore the potential to identify specific behavioral patterns using posture and other sensor-based measurements, thus enhancing our ability to monitor and respond to the animals’ needs effectively.
Figure 22 delineates the temporal dynamics of peak acceleration throughout the feeding, isolation, and pairing periods. The x-axis denotes the time frame, which includes both the age of the pigs and the specific experimental collection periods, while the y-axis denotes the peak acceleration, a vital measure of physical activity. This plot provides a detailed temporal perspective on how peak acceleration, and hence the physical activity of pigs varies in response to these distinct periods.
Patterns discernible from this plot may represent the pigs’ adaptation to these different conditions, thereby providing valuable insights into their behavioral responses to feeding, isolation, and re-pairing scenarios. Such visual analytics, complemented with rigorous statistical assessments, contribute significantly to understanding the complexities of pig behavior and welfare.
Following the graphical representation of data, we engaged in statistical analysis to quantify the observed relationships and differences. T-tests, ANOVA, or correlation analyses were conducted, contingent on the nature of the data and the research question at hand.
We employed K-means clustering on our dataset, leading to the discovery of distinct behavioral patterns. Each pattern represents a cluster of observations that exhibit similar behavioral characteristics. Upon deeper examination of these patterns, insights can be gleaned into specific behaviors, such as resting, feeding, or interacting with other pigs.
The emergence of three distinct behavioral patterns is represented in the supplementary tables. These outcomes highlight the capability of clustering techniques in uncovering underlying patterns in the data, providing a more profound understanding of pig behavior. Furthermore, these findings point towards the significant impact these variables exert on each other, supported by a p-value below 0.005.
4.10. Q10. Assessing Pig Welfare through Sensor Data Analysis: Insights into Stress Levels and Gait Quality
The sensor data gathered in this study was invaluable for advancing our understanding of the overall welfare of the pigs, especially in terms of stress levels and gait quality.
Physiological markers such as ‘HR’ (Heart Rate) and ‘BR’ (Breathing Rate) functioned as indicators of stress responses, with increases in these values potentially denoting elevated stress levels. ‘HRV’ (Heart Rate Variability) also served as a significant determinant of stress levels.
Behavioral variables including ‘Activity’, ‘Posture’, and accelerometer data (‘PeakAccel’, ‘VerticalMin’, ‘VerticalPeak’, ‘LateralMin’, ‘LateralPeak’, ‘SagittalMin’, ‘SagittalPeak’) provided insights into the pigs’ behavioral engagement and activity levels. Fluctuations in these metrics possibly suggested discomfort, stress, or health-related issues.
The accelerometer data were instrumental in assessing the quality of gait. Aberrant patterns within these variables could indicate problems such as lameness.
A diverse array of analysis techniques were utilized:
Descriptive Statistics and Visualizations: This initial stage involved understanding the distribution of these variables and identifying pronounced patterns or outliers.
Time-Series Analysis: Owing to the time-series nature of the data, methods like ARIMA or state-space models were beneficial for modeling temporal changes.
Machine Learning Models: The application of regression models, classification algorithms, or clustering facilitates the prediction or categorization of welfare states. Clustering techniques helped in identifying common patterns or states in the data.
Sequential Analysis: When appropriate, techniques like sequence mining or Markov models were instrumental in identifying frequent sequences of behaviors, which were relevant for a comprehensive understanding of welfare.
The findings were contextualized within the scope of the pigs’ overall behavior and environment, and individual differences among pigs were accounted for, as indicated by the ‘Animal’ variable.
Figure 23 provides a comprehensive correlation heatmap, portraying the interrelationships among physiological parameters like heart rate and breathing rate, accelerometer-based measurements, postural dynamics, activity levels, and stress indicators across the study’s pig population. This heatmap aids in discerning potential patterns and associations that might have crucial implications for understanding the overall welfare of the pigs. Particularly noteworthy are the associations between stress levels, activity intensity, and the quality of gait as depicted through postural metrics. Each correlation color-codes the strength and direction of the relationship between two variables, thereby offering a high-level view of the interconnectedness within our dataset. By scrutinizing this map, researchers can identify key variables of interest that appear to be closely tied to the welfare indicators of interest, forming the basis for more focused, hypothesis-driven analyses.
Please refer to Supplementary File S3Q10 for a comprehensive collection of visual aids, including graphs, tables, and histograms. Additionally, it includes ARIMA modeling plots, which illustrate temporal changes across our data, further elucidating the findings discussed in this section of the paper. These resources provide a more detailed visual representation of the data analyses, underpinning our discussion on the welfare of pigs in terms of stress levels and gait quality. In the table, as shown in Supplementary File S3Q10, it was observed that all association rules featured a confidence and lift value of 1.0, a leverage value of 0.0, and a conviction value of infinity. These values implied perfect confidence and lift, no leverage, and infinite conviction.
A confidence value of 1.0 indicated that the occurrence of the rule’s consequent (right-hand side) was certain when the antecedent (left-hand side) was present. Similarly, a lift value of 1.0 suggested that the occurrence of the antecedent and consequent were independent events.
The leverage value of 0.0 suggested no deviation from independence, signifying that the presence of the antecedent did not impact the occurrence of the consequent.
The conviction value of infinity implied a perfect relationship between the antecedent and consequent, suggesting that there was no chance of the consequent occurring without the presence of the antecedent. These values indicated robust relationships between the antecedents and consequents, suggesting that the behaviors encapsulated in the frequent sequential patterns were strongly associated with the pigs’ stress levels.
According to the regression evaluation metrics, the sequence of pig stress levels generated carried a relatively high Mean Squared Error (MSE) and Mean Absolute Error (MAE), indicating a significant disparity between the generated and observed sequences. The negative R-squared (R2) score suggested that the generated sequence did not account for a significant portion of the variation in the observed sequence.
These results implied that the Hidden Markov Model (HMM) used to generate the stress levels might not have accurately encapsulated the patterns and characteristics of pig stress levels within the dataset. The HMM might not have been the most suitable model for predicting or generating continuous stress levels in this context.
Given the MSE, MAE, and R2 scores, it was recommended to explore alternative modeling approaches or consider refining the existing model to enhance its performance in capturing the pigs’ stress levels more accurately.
5. Summary and Conclusions
This comprehensive study delves into the profound impact of pair housing on the physiological and behavioral characteristics of swine, with a particular emphasis on the fluctuations in heart rate variability, respiration rate, and activity data. Furthermore, the research explores the potential of accelerometer data in detecting lameness and age-related alterations in walking ability. The findings gleaned from this study offer critical insights into the adaptability of pigs to diverse social environments and the potential applications of these measurements in enhancing pig welfare.
Upon the commencement of cohabitation, pigs exhibited a marked increase in heart rate, indicative of heightened cardiovascular activity due to the novelty and potential stress of the situation. Simultaneously, certain rhythmic patterns or data points from heart rate measurements disappeared, suggesting a disruption of normal heart rate behavior.
Respiration rates also experienced an initial surge during the pairing phase, reflecting an autonomic response to the new living conditions. However, as pigs gradually acclimatized to their shared environment, both heart rate and respiration rate parameters stabilized, returning to baseline levels. This stabilization indicated a reduction in initial stress and a possible adaptation to the altered social dynamics.
The study also examined the response to isolation post-cohabitation, a crucial aspect of the pigs’ social experience. Pigs exhibited elevated heart rate and respiration rates upon isolation, possibly due to the abrupt change in environment and the stress associated with the sudden loss of social interaction. However, these parameters often returned to normal levels after an adaptation period, indicating pigs’ ability to acclimate to solitude.
In addition to accelerometer data, the study explored the use of heart rate and respiration rate measurements in understanding pigs’ physiological responses. These measurements provided valuable insights into pigs’ immediate stress levels and their adaptability to changing social conditions.
Moreover, the study underscored the potential of accelerometer data for detecting lameness in pigs. Lameness, characterized by irregular walking patterns and evident discomfort during movement, can lead to distinct alterations in a pig’s gait. By analyzing accelerometer parameters and employing detection methodologies such as Recurrent Neural Network Long Short-Term Memory (RNN-LSTM) and multi-layer classifiers, researchers can potentially identify changes indicative of lameness.
The influence of age on walking ability was also investigated, as age-related changes could impact pigs’ gait and overall mobility. By analyzing accelerometer parameters such as ‘Posture’, ‘Peak Accel’, ‘VerticalMin’, ‘VerticalPeak’, ‘LateralMin’, ‘LateralPeak’, ‘SagittalMin’, and ‘SagittalPeak’, researchers were able to identify correlations between these parameters and age, providing insights into age-related changes in walking ability.
The study emphasized the importance of the social context in which pigs operate, as it significantly influenced their behavior, including activity levels and gait patterns. Pair housing induced heightened activity levels and variable activity patterns, reflecting increased social interaction and potential competitive behavior. In contrast, isolation often leads to decreased or stable activity levels.
In summary, this study unveiled the considerable physiological and behavioral plasticity of pigs in response to changes in their social environment. The findings underscored the need to understand these changes to optimize welfare practices in pig farming. The utilization of accelerometer data, in conjunction with heart rate and respiration rate measurements, provided valuable insights into pig welfare, potential lameness detection, and age-related changes in walking ability.
Overall, this research contributes to enhancing pig welfare, optimizing living conditions, and refining care practices in the swine industry. Further investigations are necessary to deepen our understanding of pigs’ physiological and behavioral responses to varying social environments, refine the use of accelerometer data for pig monitoring, and promote overall well-being and welfare in pig farming.
The utilization of the Internet of Things (IoT) 3-in-1 sensor in this study underscores the transformative potential of technology in livestock farming. This sensor, recording heart rate, respiration rate, and accelerometer data, serves as a powerful tool for monitoring and assessing the welfare of pigs. It enables the capture of real-time, continuous data, providing a comprehensive picture of the pigs’ physiological and behavioral states. This data-driven approach allows for the detection of subtle changes and patterns that might otherwise go unnoticed, facilitating early intervention and improved care.
The lessons learned from this study, while focused on pigs, have broader implications for livestock farming. The methodologies and insights could potentially be extended to other species, such as sheep, dairy cows, and horses. Each of these animals has unique physiological and behavioral characteristics, and the use of sensor technology could provide valuable insights into their health and welfare.
Moreover, the integration of sensor technology with Artificial Intelligence (AI) opens up new possibilities for livestock farming. AI algorithms can analyze the vast amounts of data generated by sensors, identifying patterns and making predictions. This combination of IoT and AI can lead to more precise and proactive management practices, improving animal welfare and productivity.
In conclusion, the use of IoT sensors, coupled with the power of AI, paves the way for a future where livestock farming is more data-driven, efficient, and humane. This study represents a significant step in that direction, demonstrating the potential of technology to enhance our understanding of animal behavior and welfare and to transform livestock farming practices.
Supplementary Materials
The following supporting information can be downloaded at: https://www.mdpi.com/article/10.3390/agriculture13091706/s1, File S1. Comprehensive Raw Data for Pig Experiment—Includes Timestamp, Animal ID, Age, Activity Class, Physiological and Heart Rate, Respiration Rate, Accelerometer Parameters, and Device Metrics. File S2. The folder includes select frames extracted from the video footage captured over the 8-week experimental period. The images provide visual insights into four specific scenarios—pigs paired before feeding, pigs paired after feeding, isolated pigs after feeding, and isolated pigs before feeding. File S3. The provided zip file contains all the necessary Supplementary Materials for this journal article, including Python codes, tables, plots, and graphs. The supplementary files consist of 10 HTML files, each corresponding to one of the ten objectives addressed in the study (Q1, Q2, Q3, Q4, Q5, Q6, Q7, Q8, Q9, Q10). These files offer detailed insights and visual representations for each of the research questions, enhancing the understanding and reproducibility of the study’s findings.
Funding
This research received no external funding.
Institutional Review Board Statement
The animal study protocol was approved by the Institutional Review Board (or Ethics Committee) of Wageningen University & Research.
Data Availability Statement
The data that support the findings of this study are available from the authors upon reasonable request.
Acknowledgments
This study is built upon the data gathered as part of an extensive collaborative project involving the Animal Nutrition Group of the Animal Sciences Department at Wageningen University & Research. We wish to express our gratitude to the members of the Adaptation Physiology Group, particularly Sanne van Zutphen and Ali Youssef, who were under the supervision of Neethirajan. Their invaluable assistance in data collection significantly contributed to the robustness of this research. However, it is important to note that while the ADP group played an instrumental role in the data collection phase, the conception of the study, algorithm development, and data analysis. Neethirajan independently undertook the drafting of this manuscript. His contribution formed the backbone of this research, shaping the direction and depth of the analysis presented herein.
Conflicts of Interest
The author declares no conflict of interest.
References
- Elijah, O.; Rahman, T.A.; Orikumhi, I.; Leow, C.Y.; Hindia, M.N. An overview of Internet of Things (IoT) and data analytics in agriculture: Benefits and challenges. IEEE Internet Things J. 2018, 5, 3758–3773. [Google Scholar] [CrossRef]
- Rejeb, A.; Rejeb, K.; Abdollahi, A.; Al-Turjman, F.; Treiblmaier, H. The Interplay between the Internet of Things and agriculture: A bibliometric analysis and research agenda. Internet Things 2022, 19, 100580. [Google Scholar] [CrossRef]
- Neethirajan, S.; Kemp, B. Digital livestock farming. Sens. Bio-Sens. Res. 2021, 32, 100408. [Google Scholar] [CrossRef]
- Neethirajan, S.; Tuteja, S.K.; Huang, S.T.; Kelton, D. Recent advancement in biosensors technology for animal and livestock health management. Biosens. Bioelectron. 2017, 98, 398–407. [Google Scholar] [CrossRef] [PubMed]
- Neethirajan, S. The role of sensors, big data and machine learning in modern animal farming. Sens. Bio-Sens. Res. 2020, 29, 100367. [Google Scholar] [CrossRef]
- Neethirajan, S.; Kemp, B. Digital twins in livestock farming. Animals 2021, 11, 1008. [Google Scholar] [CrossRef]
- Menendez, H.M., III; Brennan, J.R.; Gaillard, C.; Ehlert, K.; Quintana, J.; Neethirajan, S.; Remus, A.; Jacobs, M.; Teixeira, I.A.; Turner, B.L.; et al. ASAS–NANP Symposium: Mathematical Modeling in Animal Nutrition: Opportunities and challenges of confined and extensive precision livestock production. J. Anim. Sci. 2022, 100, skac160. [Google Scholar] [CrossRef] [PubMed]
- Von Borell, E.; Langbein, J.; Després, G.; Hansen, S.; Leterrier, C.; Marchant-Forde, J.; Marchant-Forde, R.; Minero, M.; Mohr, E.; Prunier, A.; et al. Heart rate variability as a measure of autonomic regulation of cardiac activity for assessing stress and welfare in farm animals—A review. Physiol. Behav. 2007, 92, 293–316. [Google Scholar] [CrossRef]
- Guevara, R.D.; Pastor, J.J.; Manteca, X.; Tedo, G.; Llonch, P. Systematic review of animal-based indicators to measure thermal, social, and immune-related stress in pigs. PLoS ONE 2022, 17, e0266524. [Google Scholar] [CrossRef]
- Neethirajan, S. Transforming the adaptation physiology of farm animals through sensors. Animals 2020, 10, 1512. [Google Scholar] [CrossRef]
- Benjamin, M.; Yik, S. Precision livestock farming in swine welfare: A review for swine practitioners. Animals 2019, 9, 133. [Google Scholar] [CrossRef]
- Matthews, S.G.; Miller, A.L.; PlÖtz, T.; Kyriazakis, I. Automated tracking to measure behavioural changes in pigs for health and welfare monitoring. Sci. Rep. 2017, 7, 17582. [Google Scholar] [CrossRef]
- Neethirajan, S. SOLARIA-SensOr-driven resiLient and adaptive monitoRIng of farm Animals. Agriculture 2023, 13, 436. [Google Scholar] [CrossRef]
- Lemos Teixeira, D.; Salazar, L.C.; Enriquez-Hidalgo, D.; Hötzel, M.J. Pigs’ capacity to experience feelings and to suffer from tail lesion, ear lesion and lameness: Exploring citizens and pig farm and abattoir workers’ knowledge and perceptions. PLoS ONE 2023, 18, e0286188. [Google Scholar] [CrossRef] [PubMed]
- Bekoff, M. Time to stop pretending we don’t know other animals are sentient beings. Anim. Sentience 2022, 31, 2. [Google Scholar] [CrossRef]
- Clouard, C.; Resmond, R.; Prunier, A.; Tallet, C.; Merlot, E. Exploration of early social behaviors and social styles in relation to individual characteristics in suckling piglets. Sci. Rep. 2022, 12, 2318. [Google Scholar] [CrossRef]
- Buettner, K.; Scheffler, K.; Czycholl, I.; Krieter, J. Network characteristics and development of social structure of agonistic behaviour in pigs across three repeated rehousing and mixing events. Appl. Anim. Behav. Sci. 2015, 168, 24–30. [Google Scholar] [CrossRef]
- Nakov, D.; Hristov, S.; Stankovic, B.; Pol, F.; Dimitrov, I.; Ilieski, V.; Mormede, P.; Hervé, J.; Terenina, E.; Lieubeau, B.; et al. Methodologies for assessing disease tolerance in pigs. Front. Vet. Sci. 2019, 5, 329. [Google Scholar] [CrossRef]
- Oczak, M.; Bayer, F.; Vetter, S.; Maschat, K.; Baumgartner, J. Comparison of the automated monitoring of the sow activity in farrowing pens using video and accelerometer data. Comput. Electron. Agric. 2022, 192, 106517. [Google Scholar] [CrossRef]
- Yaxley, K.J.; Joiner, K.F.; Abbass, H. Drone approach parameters leading to lower stress sheep flocking and movement: Sky shepherding. Sci. Rep. 2021, 11, 7803. [Google Scholar] [CrossRef]
- Maselyne, J.; Adriaens, I.; Huybrechts, T.; De Ketelaere, B.; Millet, S.; Vangeyte, J.; Van Nuffel, A.; Saeys, W. Measuring the drinking behaviour of individual pigs housed in group using radio frequency identification (RFID). Animal 2016, 10, 1557–1566. [Google Scholar] [CrossRef]
- Pavlovic, D.; Czerkawski, M.; Davison, C.; Marko, O.; Michie, C.; Atkinson, R.; Crnojevic, V.; Andonovic, I.; Rajovic, V.; Kvascev, G.; et al. Behavioural classification of cattle using neck-mounted accelerometer-equipped collars. Sensors 2022, 22, 2323. [Google Scholar] [CrossRef]
- Arablouei, R.; Wang, L.; Currie, L.; Yates, J.; Alvarenga, F.A.; Bishop-Hurley, G.J. Animal behavior classification via deep learning on embedded systems. Comput. Electron. Agric. 2023, 207, 107707. [Google Scholar] [CrossRef]
- Wang, L.; Arablouei, R.; Alvarenga, F.A.; Bishop-Hurley, G.J. Classifying animal behavior from accelerometry data via recurrent neural networks. Comput. Electron. Agric. 2023, 206, 107647. [Google Scholar] [CrossRef]
- Byrd, C.J.; Johnson, J.S.; Radcliffe, J.S.; Craig, B.A.; Eicher, S.D.; Lay, D.C. Nonlinear analysis of heart rate variability for evaluating the growing pig stress response to an acute heat episode. Animal 2020, 14, 379–387. [Google Scholar] [CrossRef]
- Flores-Peinado, S.; Mota-Rojas, D.; Guerrero-Legarreta, I.; Mora-Medina, P.; Cruz-Monterrosa, R.; Gómez-Prado, J.; Guadalupe Hernández, M.; Cruz-Playas, J.; Martínez-Burnes, J. Physiological responses of pigs to preslaughter handling: Infrared and thermal imaging applications. Int. J. Vet. Sci. Med. 2020, 8, 71–84. [Google Scholar] [CrossRef] [PubMed]
- Wallgren, T.; Larsen, A.; Gunnarsson, S. Tail posture as an indicator of tail biting in undocked finishing pigs. Animals 2019, 9, 18. [Google Scholar] [CrossRef] [PubMed]
- Wutke, M.; Schmitt, A.O.; Traulsen, I.; Gültas, M. Investigation of pig activity based on video data and semi-supervised neural networks. AgriEngineering 2020, 2, 581–595. [Google Scholar] [CrossRef]
Figure 1.
Detailed demonstration of the Zephyr BioHarness belt application on a Topigs Norsvin TN70 piglet. (a) Diagram illustrating the axis orientation. (b) Overhead view portraying the Zephyr BioHarness 3.0 strap’s arrangement around the piglet’s chest, reinforced with a Vetrap bandage. (c) Side perspective showcasing the piglet adorned with the Zephyr BioHarness.

Figure 2.
AI algorithm flowchart for analyzing animal behavior. This flowchart elucidates the complex interplay within the AI system, segmented into architecture, agent function, and agent program.
Figure 2.
AI algorithm flowchart for analyzing animal behavior. This flowchart elucidates the complex interplay within the AI system, segmented into architecture, agent function, and agent program.

Figure 3.
Photograph of the 3-in-1 wearable belt used in our study. This image offers a detailed view of the components designed to gather essential data, providing insight into the pigs’ behavioral patterns and well-being.
Figure 3.
Photograph of the 3-in-1 wearable belt used in our study. This image offers a detailed view of the components designed to gather essential data, providing insight into the pigs’ behavioral patterns and well-being.

Figure 4.
Power distribution in frequency bands for (a) Pig13 and (b) Pig22: insights into autonomic nervous system activity and potential health conditions. The power distribution across frequency bands for the remaining pigs can be found in the Supplementary Information (Supplementary File S3Q1).
Figure 4.
Power distribution in frequency bands for (a) Pig13 and (b) Pig22: insights into autonomic nervous system activity and potential health conditions. The power distribution across frequency bands for the remaining pigs can be found in the Supplementary Information (Supplementary File S3Q1).

Figure 5.
Autocorrelation plot analysis of ECG amplitude time series in pigs.


Figure 6.
Poincaré Plot for Pig11 during ‘bfandaf_sio’ Activity: This figure depicts the scatterplot of RR intervals (RRn) against the next RR intervals (RRn+1), serving as a graphical representation of heart rate variability. The x-axis represents the current RR interval (RRn) in milliseconds (ms), while the y-axis represents the following RR interval (RRn+1) also in milliseconds (ms). This plot allows the visualization of the correlation between successive RR intervals, providing insights into the dynamics of the heart rate under different activities.

Figure 7.
Age-based variation in respiration rate for Pig22. The box plot illustrates the respiration rate for Pig22 plotted against different age stages. The central tendency and dispersion of respiration rates across ages can provide insights into the physiological changes associated with pig aging.

Figure 8.
Comparative analysis of mean NNI between isolation and pair settings for Pig21. The bar chart delineates the mean NNI (Normal-to-Normal interval, an HRV parameter) for Pig21 during isolation and pair settings. Any significant differences observed could suggest changes in the heart rate variability and associated physiological stress between different social environments.

Figure 9.
Change point detection for Pig22—isolation and pairing periods. The line plot illustrates the changes in the ‘PeakAccel’ variable for Pig22 during isolation and pairing periods. The x-axis represents the dates of data collection, while the y-axis represents the ‘PeakAccel’ values. Change points, indicated by significant deviations in the data, are identified and visualized, providing insights into the shifts in activity levels during different social contexts.

Figure 10.
Cluster analysis of VerticalMin and VerticalPeak: visualization of K-means clustering results with Cluster 0, Cluster 1, and Cluster 2 assignments.
Figure 10.
Cluster analysis of VerticalMin and VerticalPeak: visualization of K-means clustering results with Cluster 0, Cluster 1, and Cluster 2 assignments.

Figure 11.
Clustering analysis of accelerometer data: VerticalMin vs. PeakAccel for Pig13.

Figure 12.
Trends of stride length and stance duration over time. This line graph depicts the trends of stride length and stance duration over time. The x-axis represents the trend, while the y-axis represents the dates of data collection. The graph provides insights into the changes and patterns in stride length and stance duration, allowing for the analysis of gait dynamics and potential abnormalities in pigs.

Figure 13.
Box plot of vertical peak breathing waveform by age group. The box plot visualizes the distribution of vertical peak breathing waveform values across different age groups of pigs. The age of pigs is plotted on the x-axis, while the vertical peak of the breathing waveform is represented on the y-axis.

Figure 14.
Boxplot comparisons of ‘PeakAccel’, ‘VerticalMin’, ‘VerticalPeak’, ‘LateralMin’, ‘LateralPeak’, ‘SagittalMin’, and ‘SagittalPeak’ accelerometer variables for pigs in isolation vs. paired activity.
Figure 14.
Boxplot comparisons of ‘PeakAccel’, ‘VerticalMin’, ‘VerticalPeak’, ‘LateralMin’, ‘LateralPeak’, ‘SagittalMin’, and ‘SagittalPeak’ accelerometer variables for pigs in isolation vs. paired activity.

Figure 15.
Age-dependent mean acceleration of pigs: invisibility of isolation data up to day 91.

Figure 16.
Correlation matrix heatmap illustrating associations between time, heart rate (HR), and breathing rate (BR).
Figure 16.
Correlation matrix heatmap illustrating associations between time, heart rate (HR), and breathing rate (BR).

Figure 17.
Illustration of random forest feature importance for Pig15 and Pig21.

Figure 18.
Visual representation of class predictions on the testing set and the associated confusion matrix (a) for ‘bfandaf_isoandpair’, ‘bfandaf_iso’, ‘af_isoandpair’ conditions, along with a depiction of train and validation loss (b) over epochs.
Figure 18.
Visual representation of class predictions on the testing set and the associated confusion matrix (a) for ‘bfandaf_isoandpair’, ‘bfandaf_iso’, ‘af_isoandpair’ conditions, along with a depiction of train and validation loss (b) over epochs.

Figure 19.
(a) Diurnal heart patterns in pigs: a boxplot analysis of morning, afternoon, and evening readings. (b) Correlation heatmap of heart rate vs. breathing rate across different time periods: morning, afternoon, and evening.
Figure 19.
(a) Diurnal heart patterns in pigs: a boxplot analysis of morning, afternoon, and evening readings. (b) Correlation heatmap of heart rate vs. breathing rate across different time periods: morning, afternoon, and evening.

Figure 20.
Time-of-day impact on pig activity levels: a contingency heatmap analysis.

Figure 21.
Comparative boxplots depicting posture variations across feeding, isolation, and pairing periods.
Figure 21.
Comparative boxplots depicting posture variations across feeding, isolation, and pairing periods.

Figure 22.
Temporal dynamics of peak acceleration: comparative analysis across feeding, isolation, and pairing periods.
Figure 22.
Temporal dynamics of peak acceleration: comparative analysis across feeding, isolation, and pairing periods.

Figure 23.
Correlation heatmap displaying interrelationships among physiological parameters, activity, posture, and stress levels across individual pigs.
Figure 23.
Correlation heatmap displaying interrelationships among physiological parameters, activity, posture, and stress levels across individual pigs.


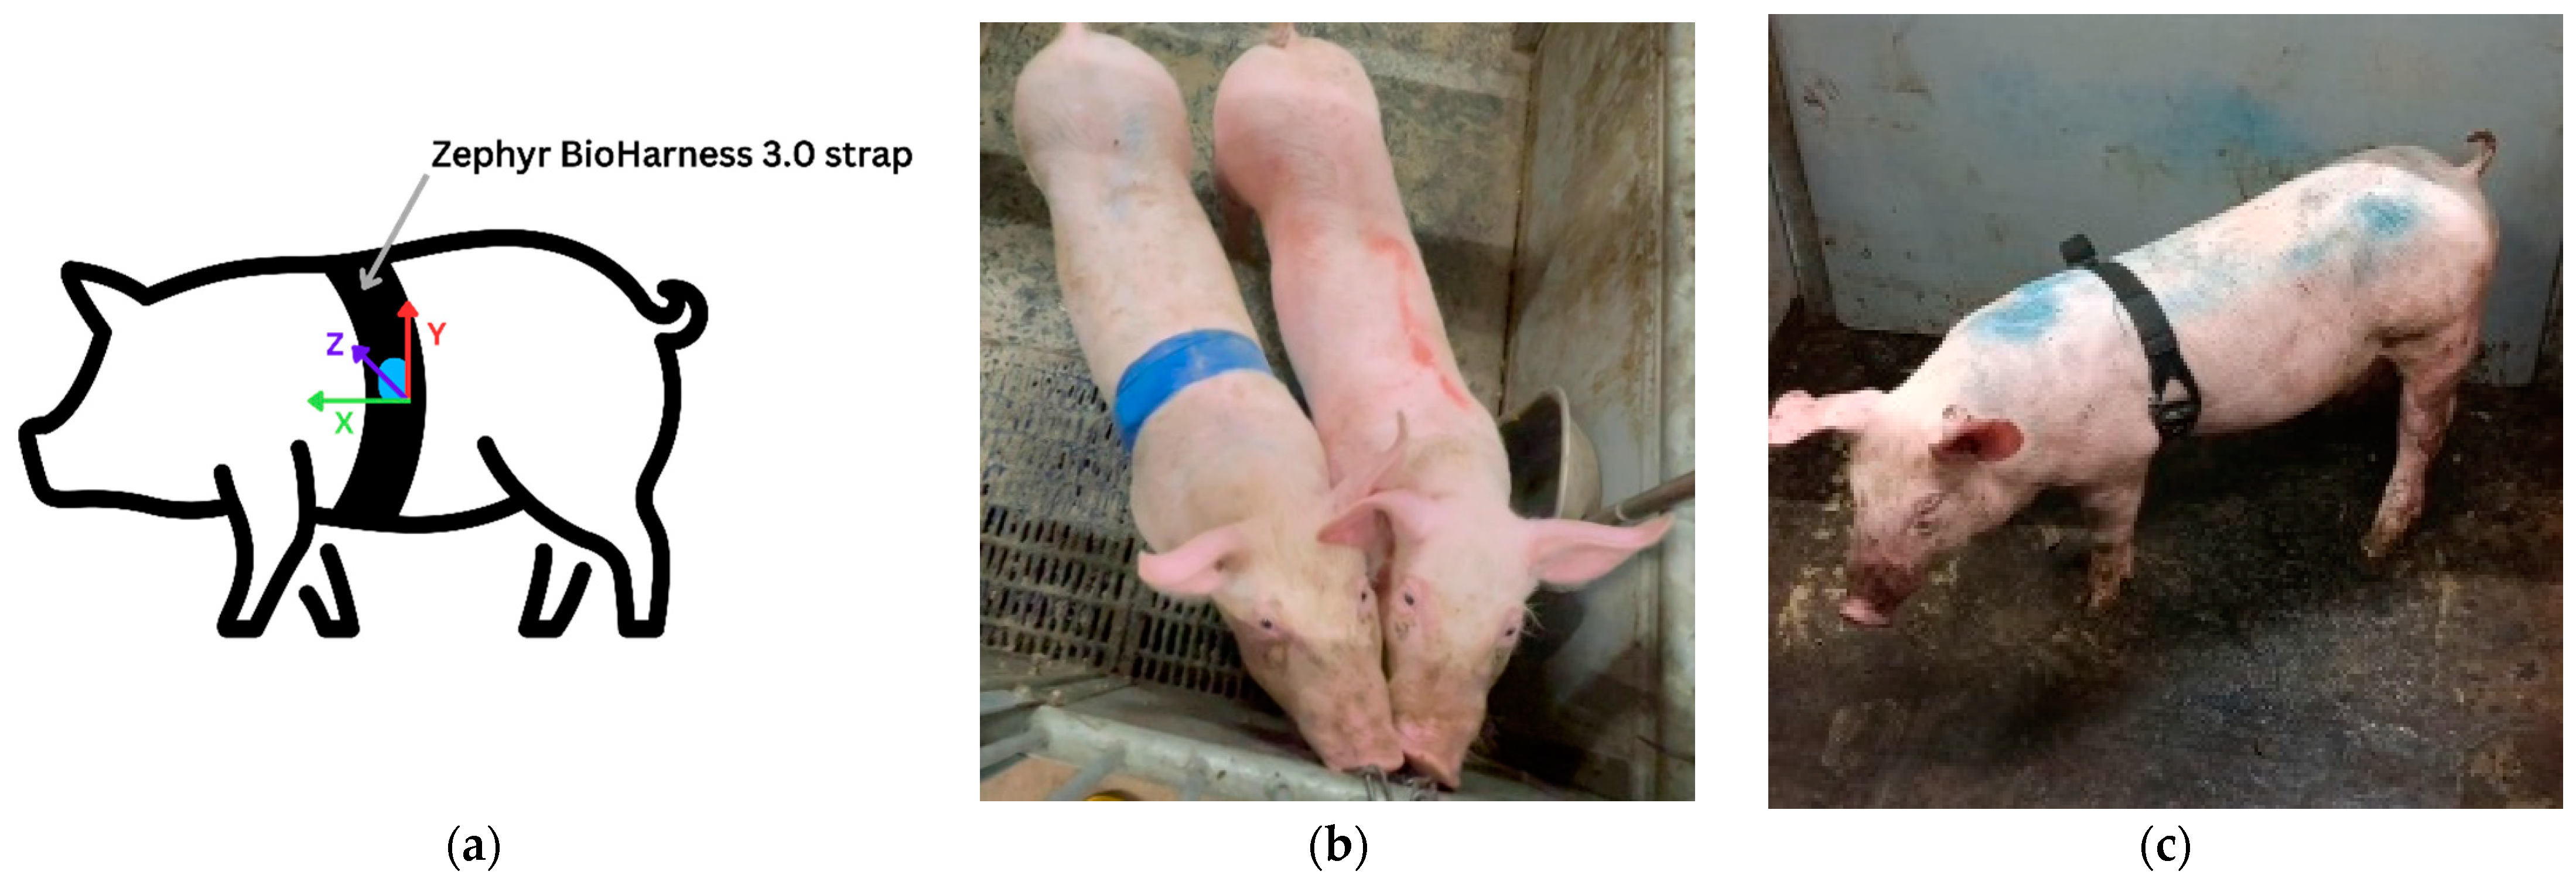
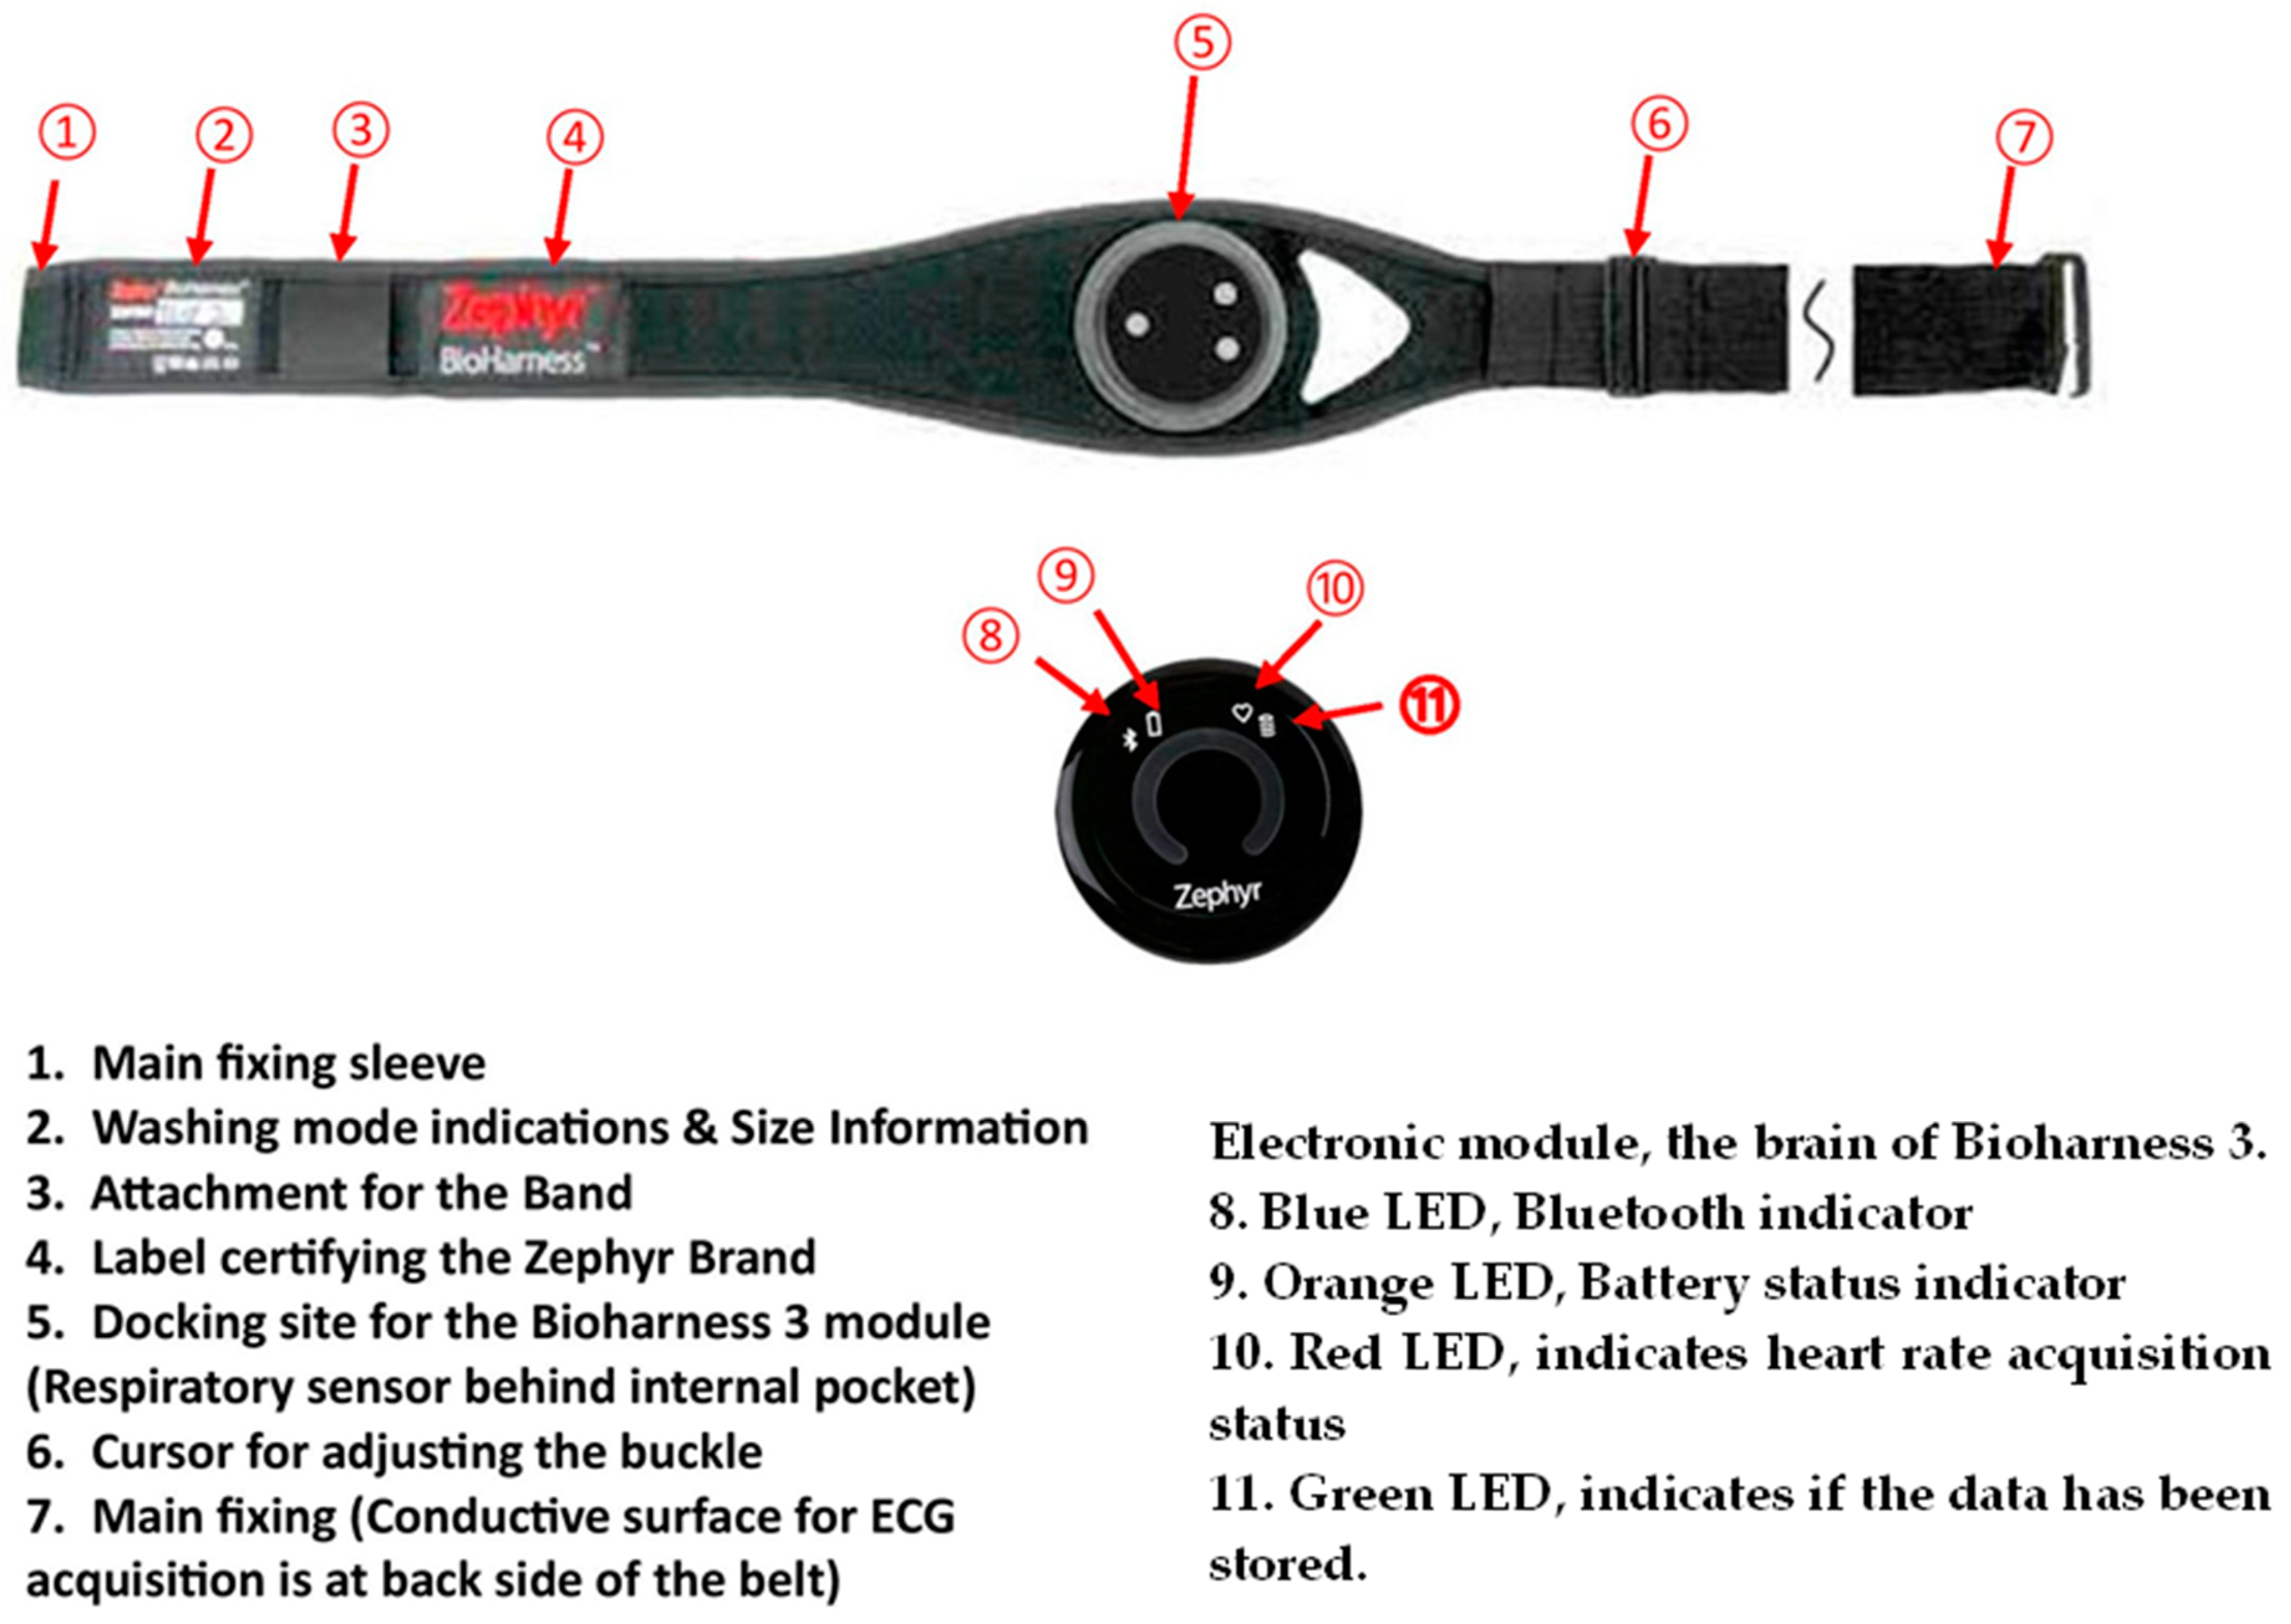
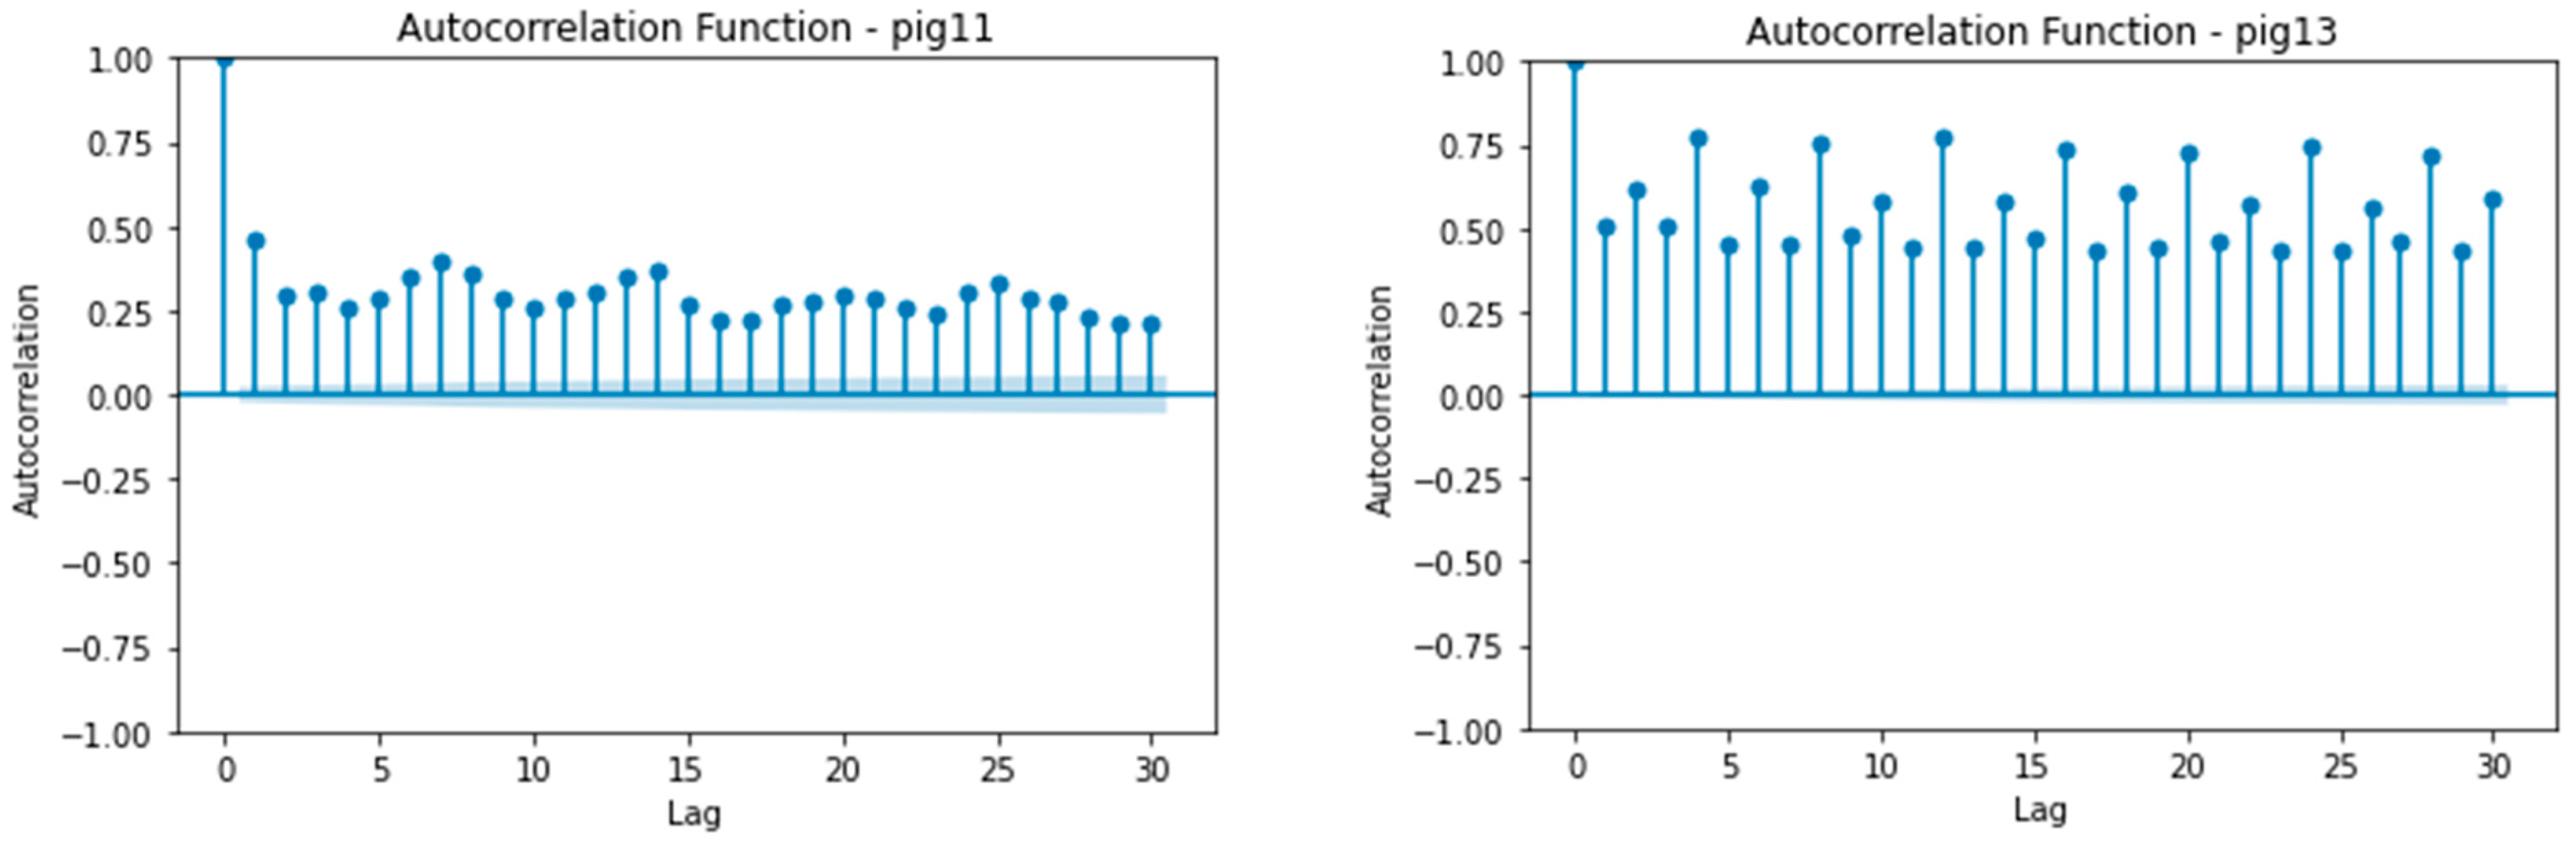
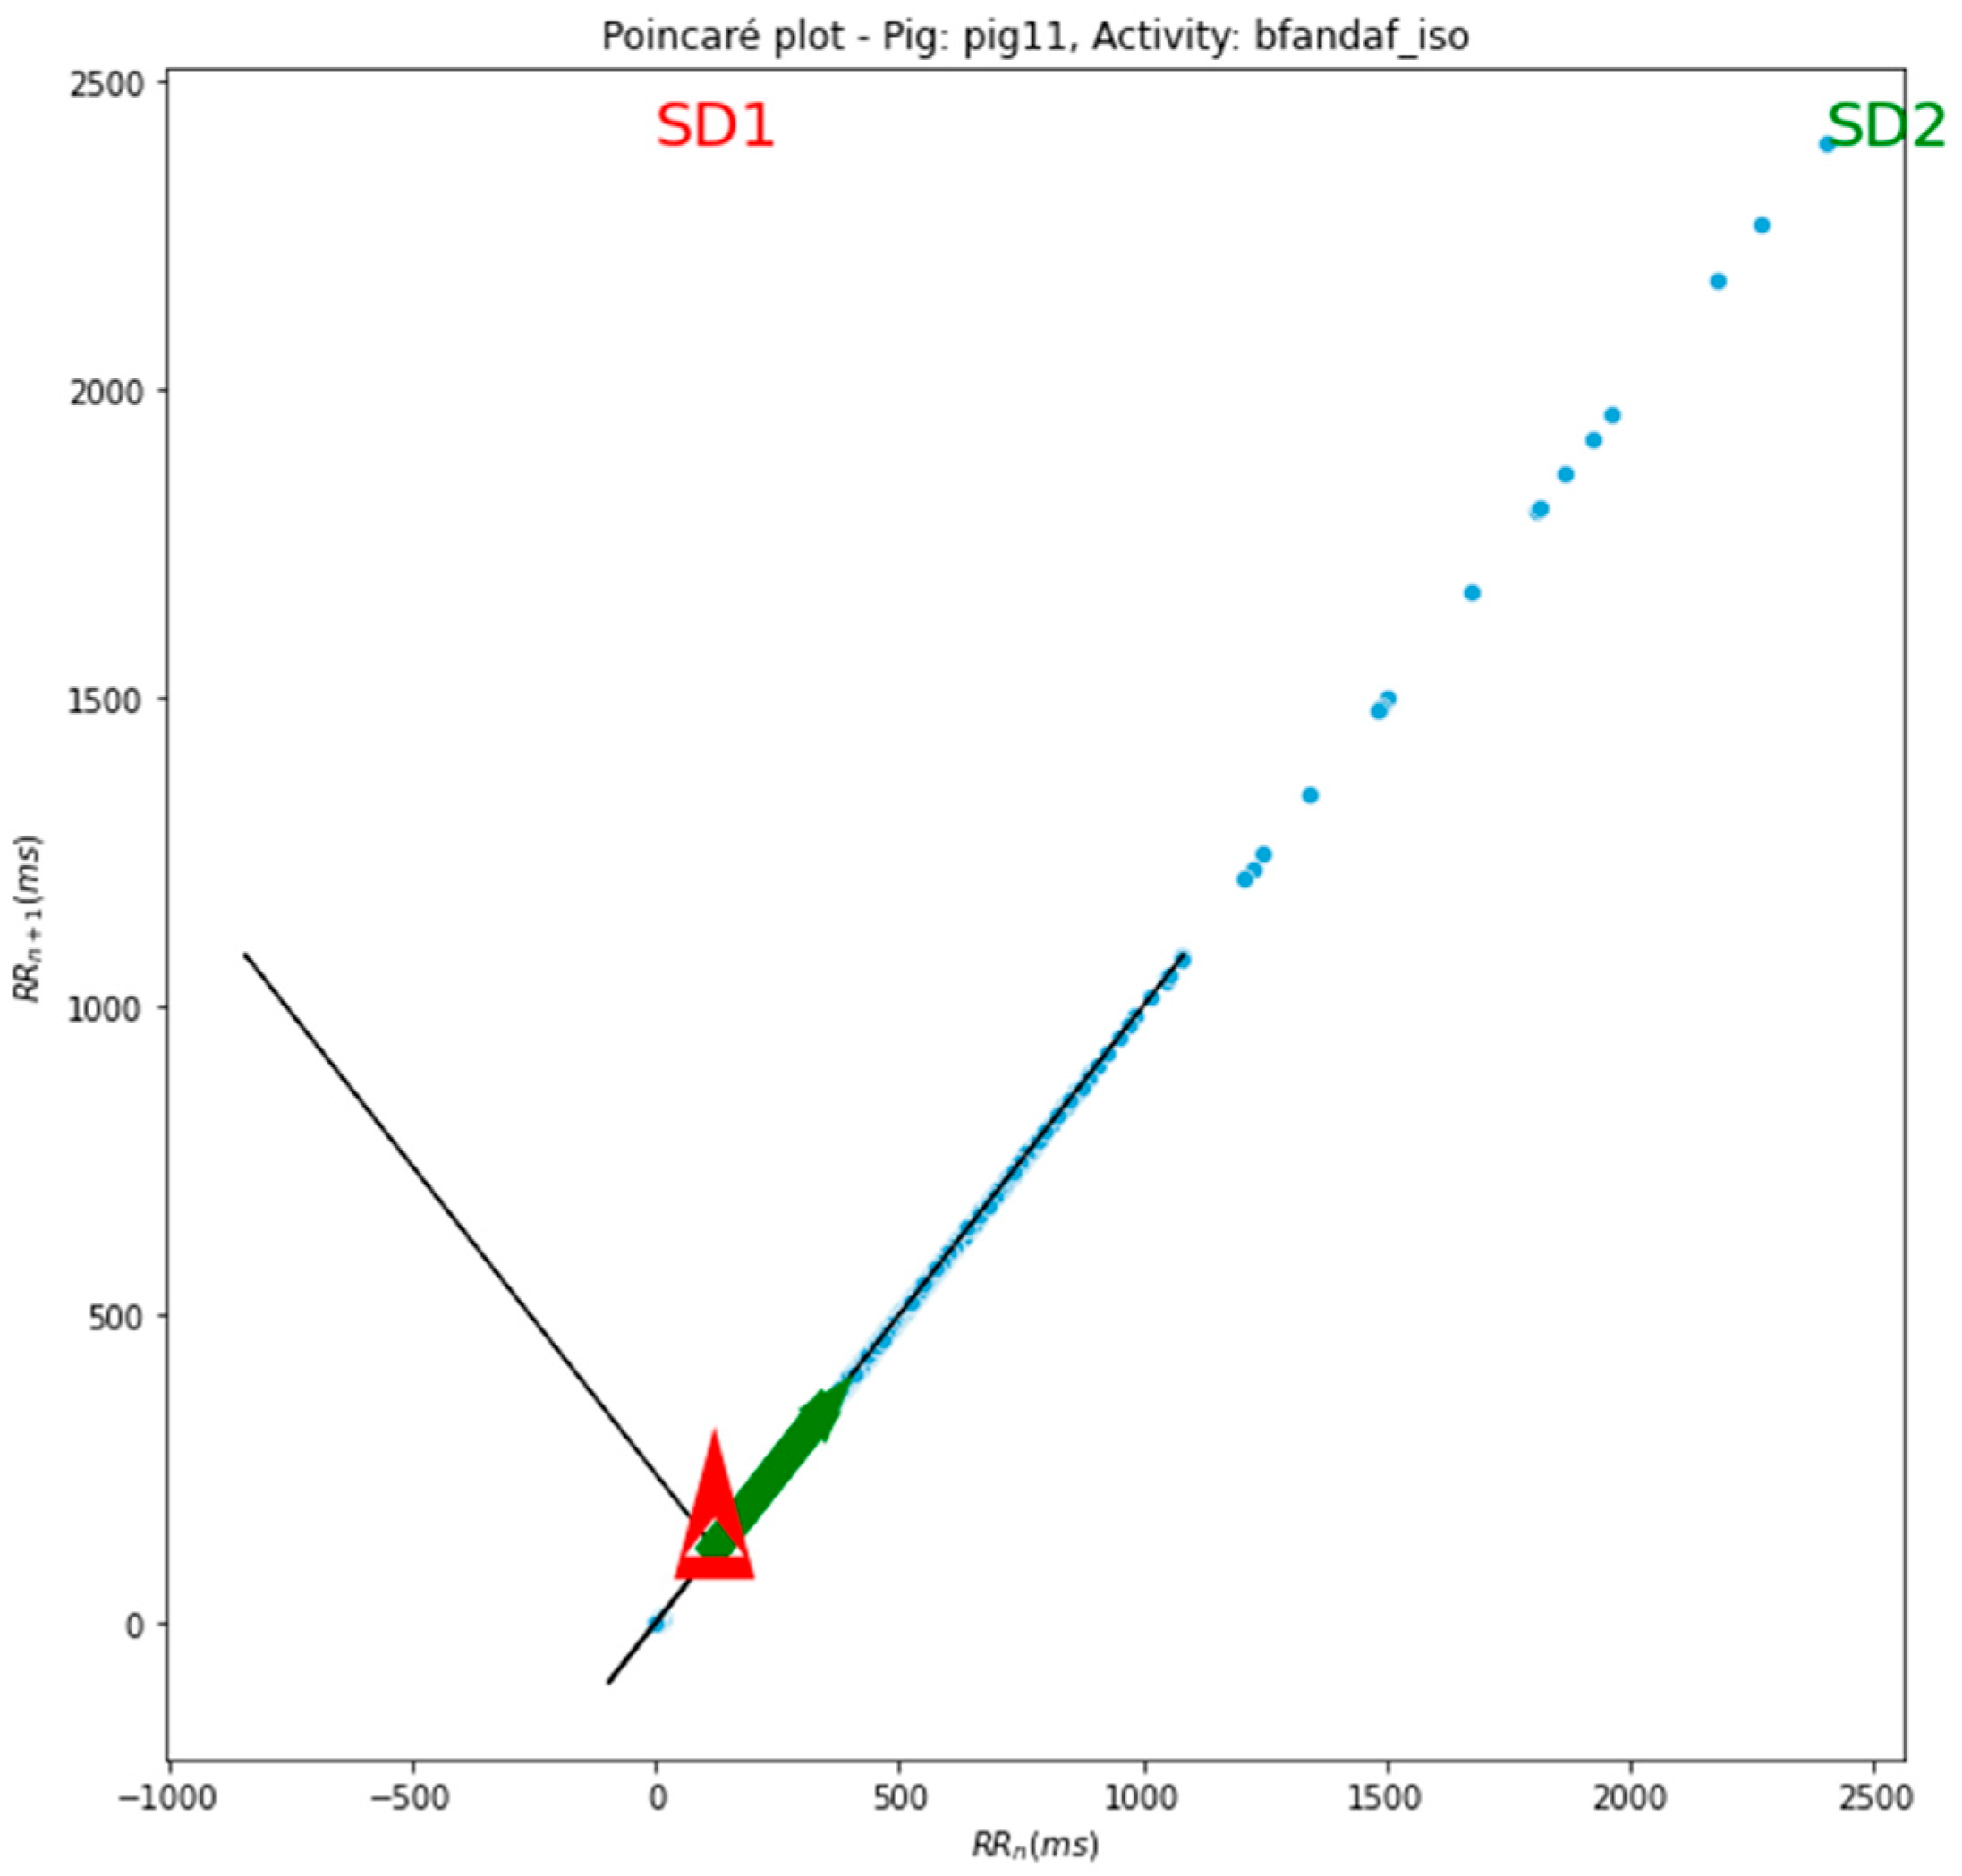
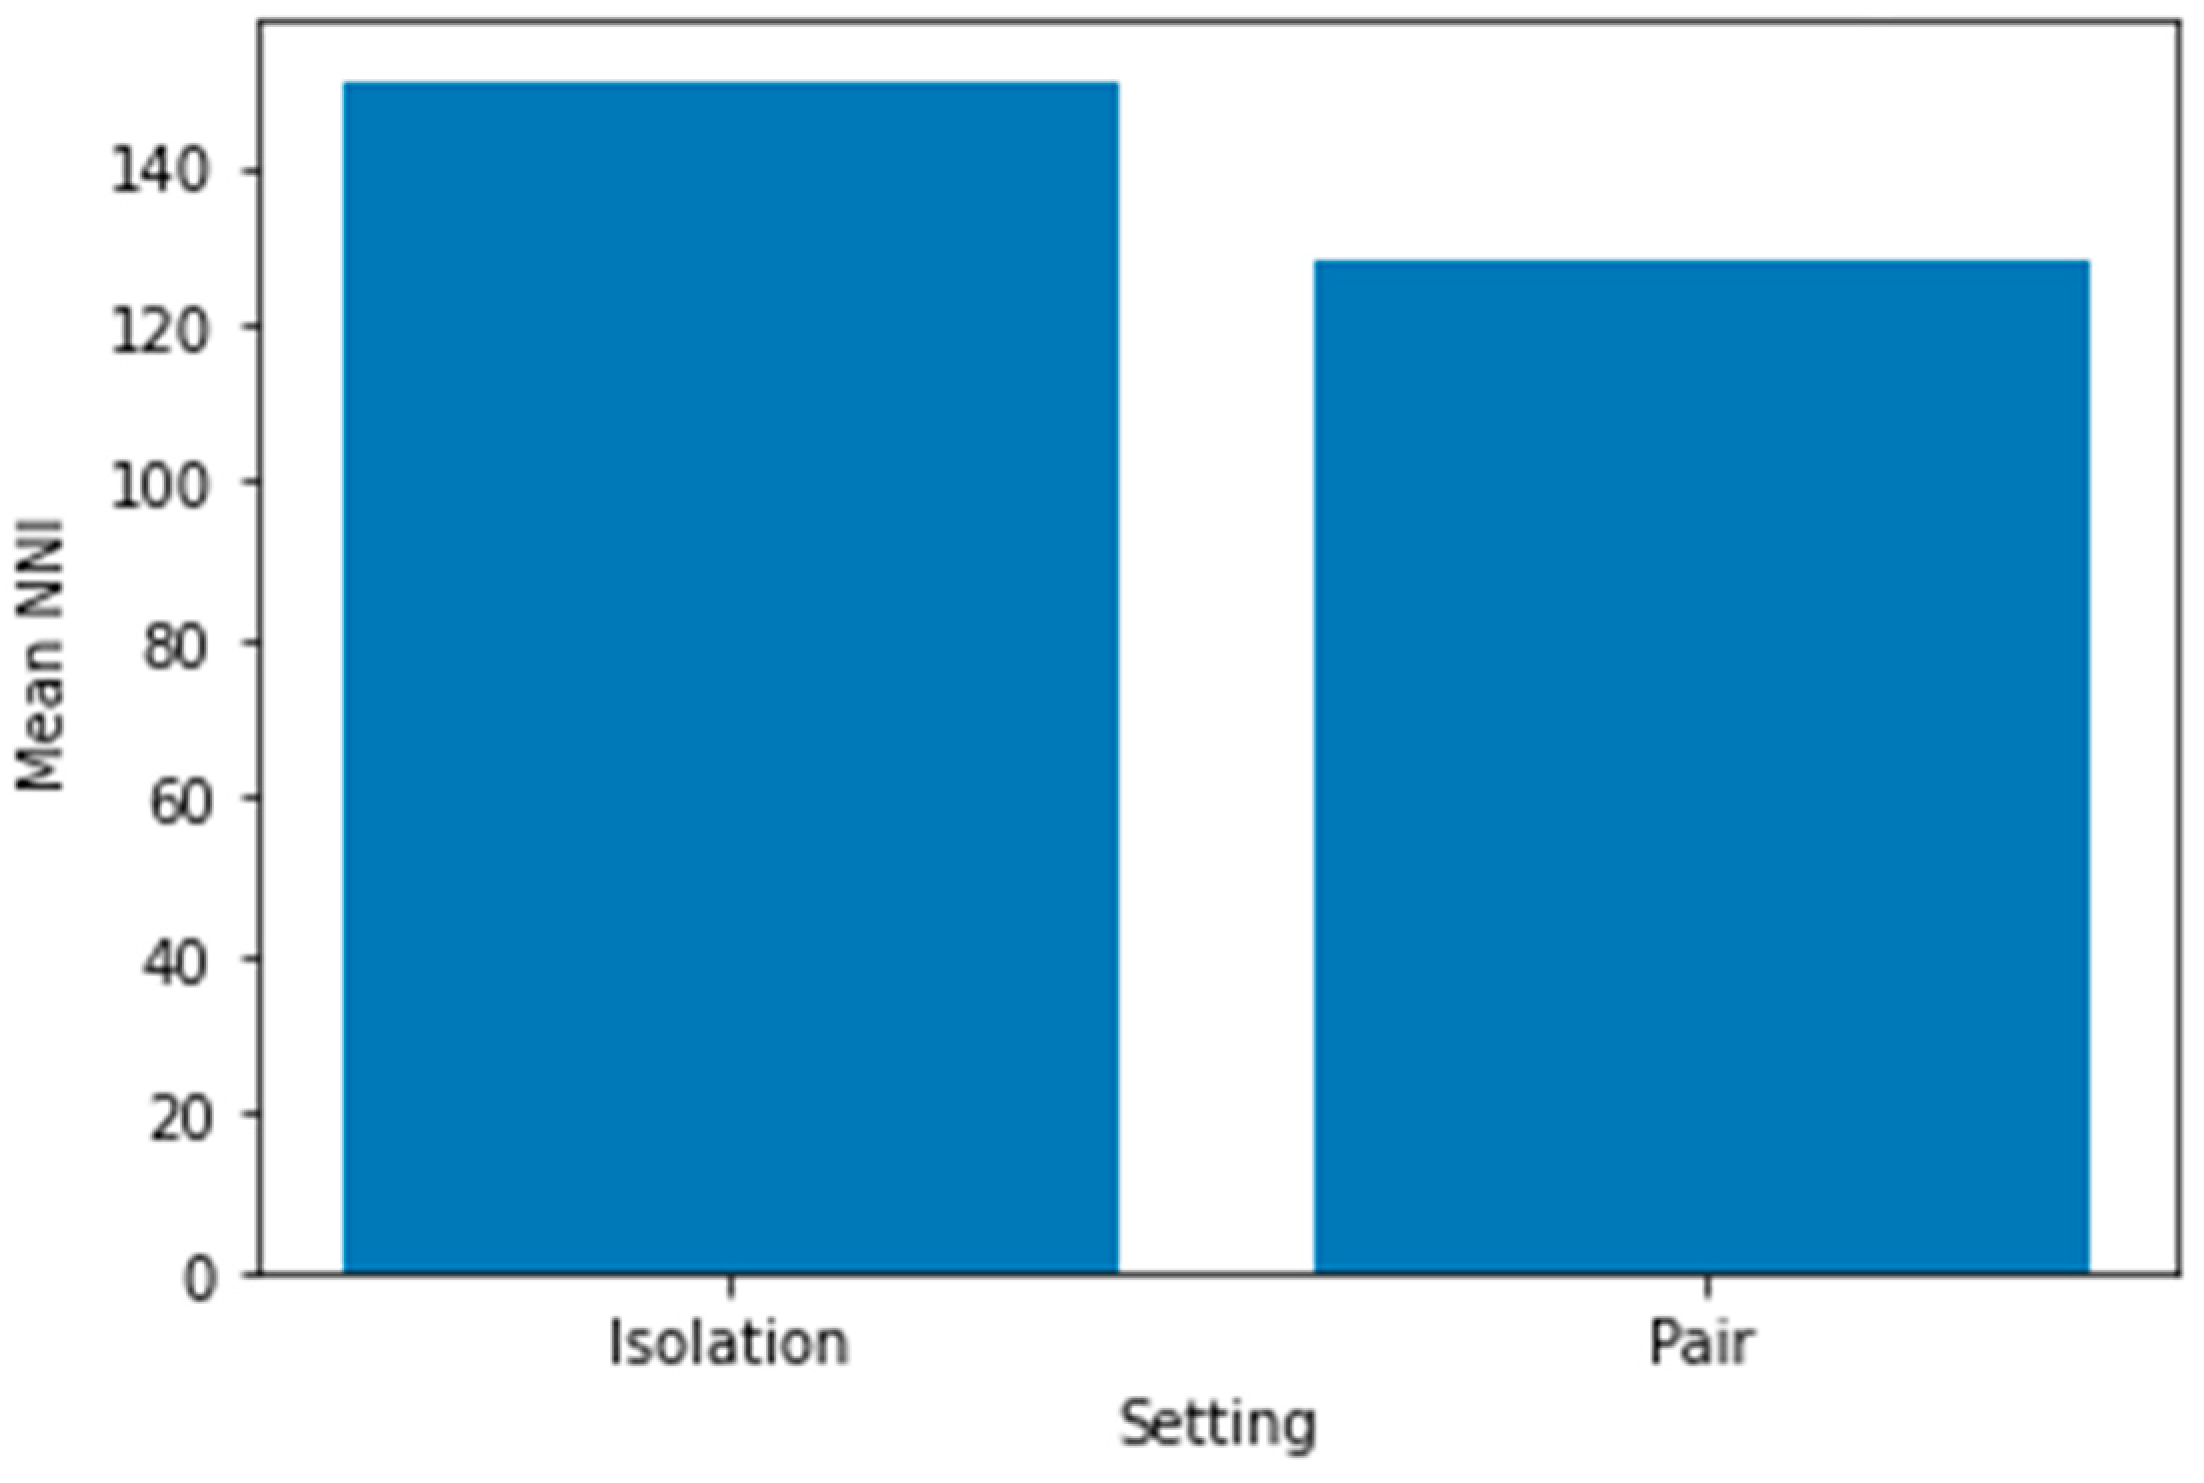
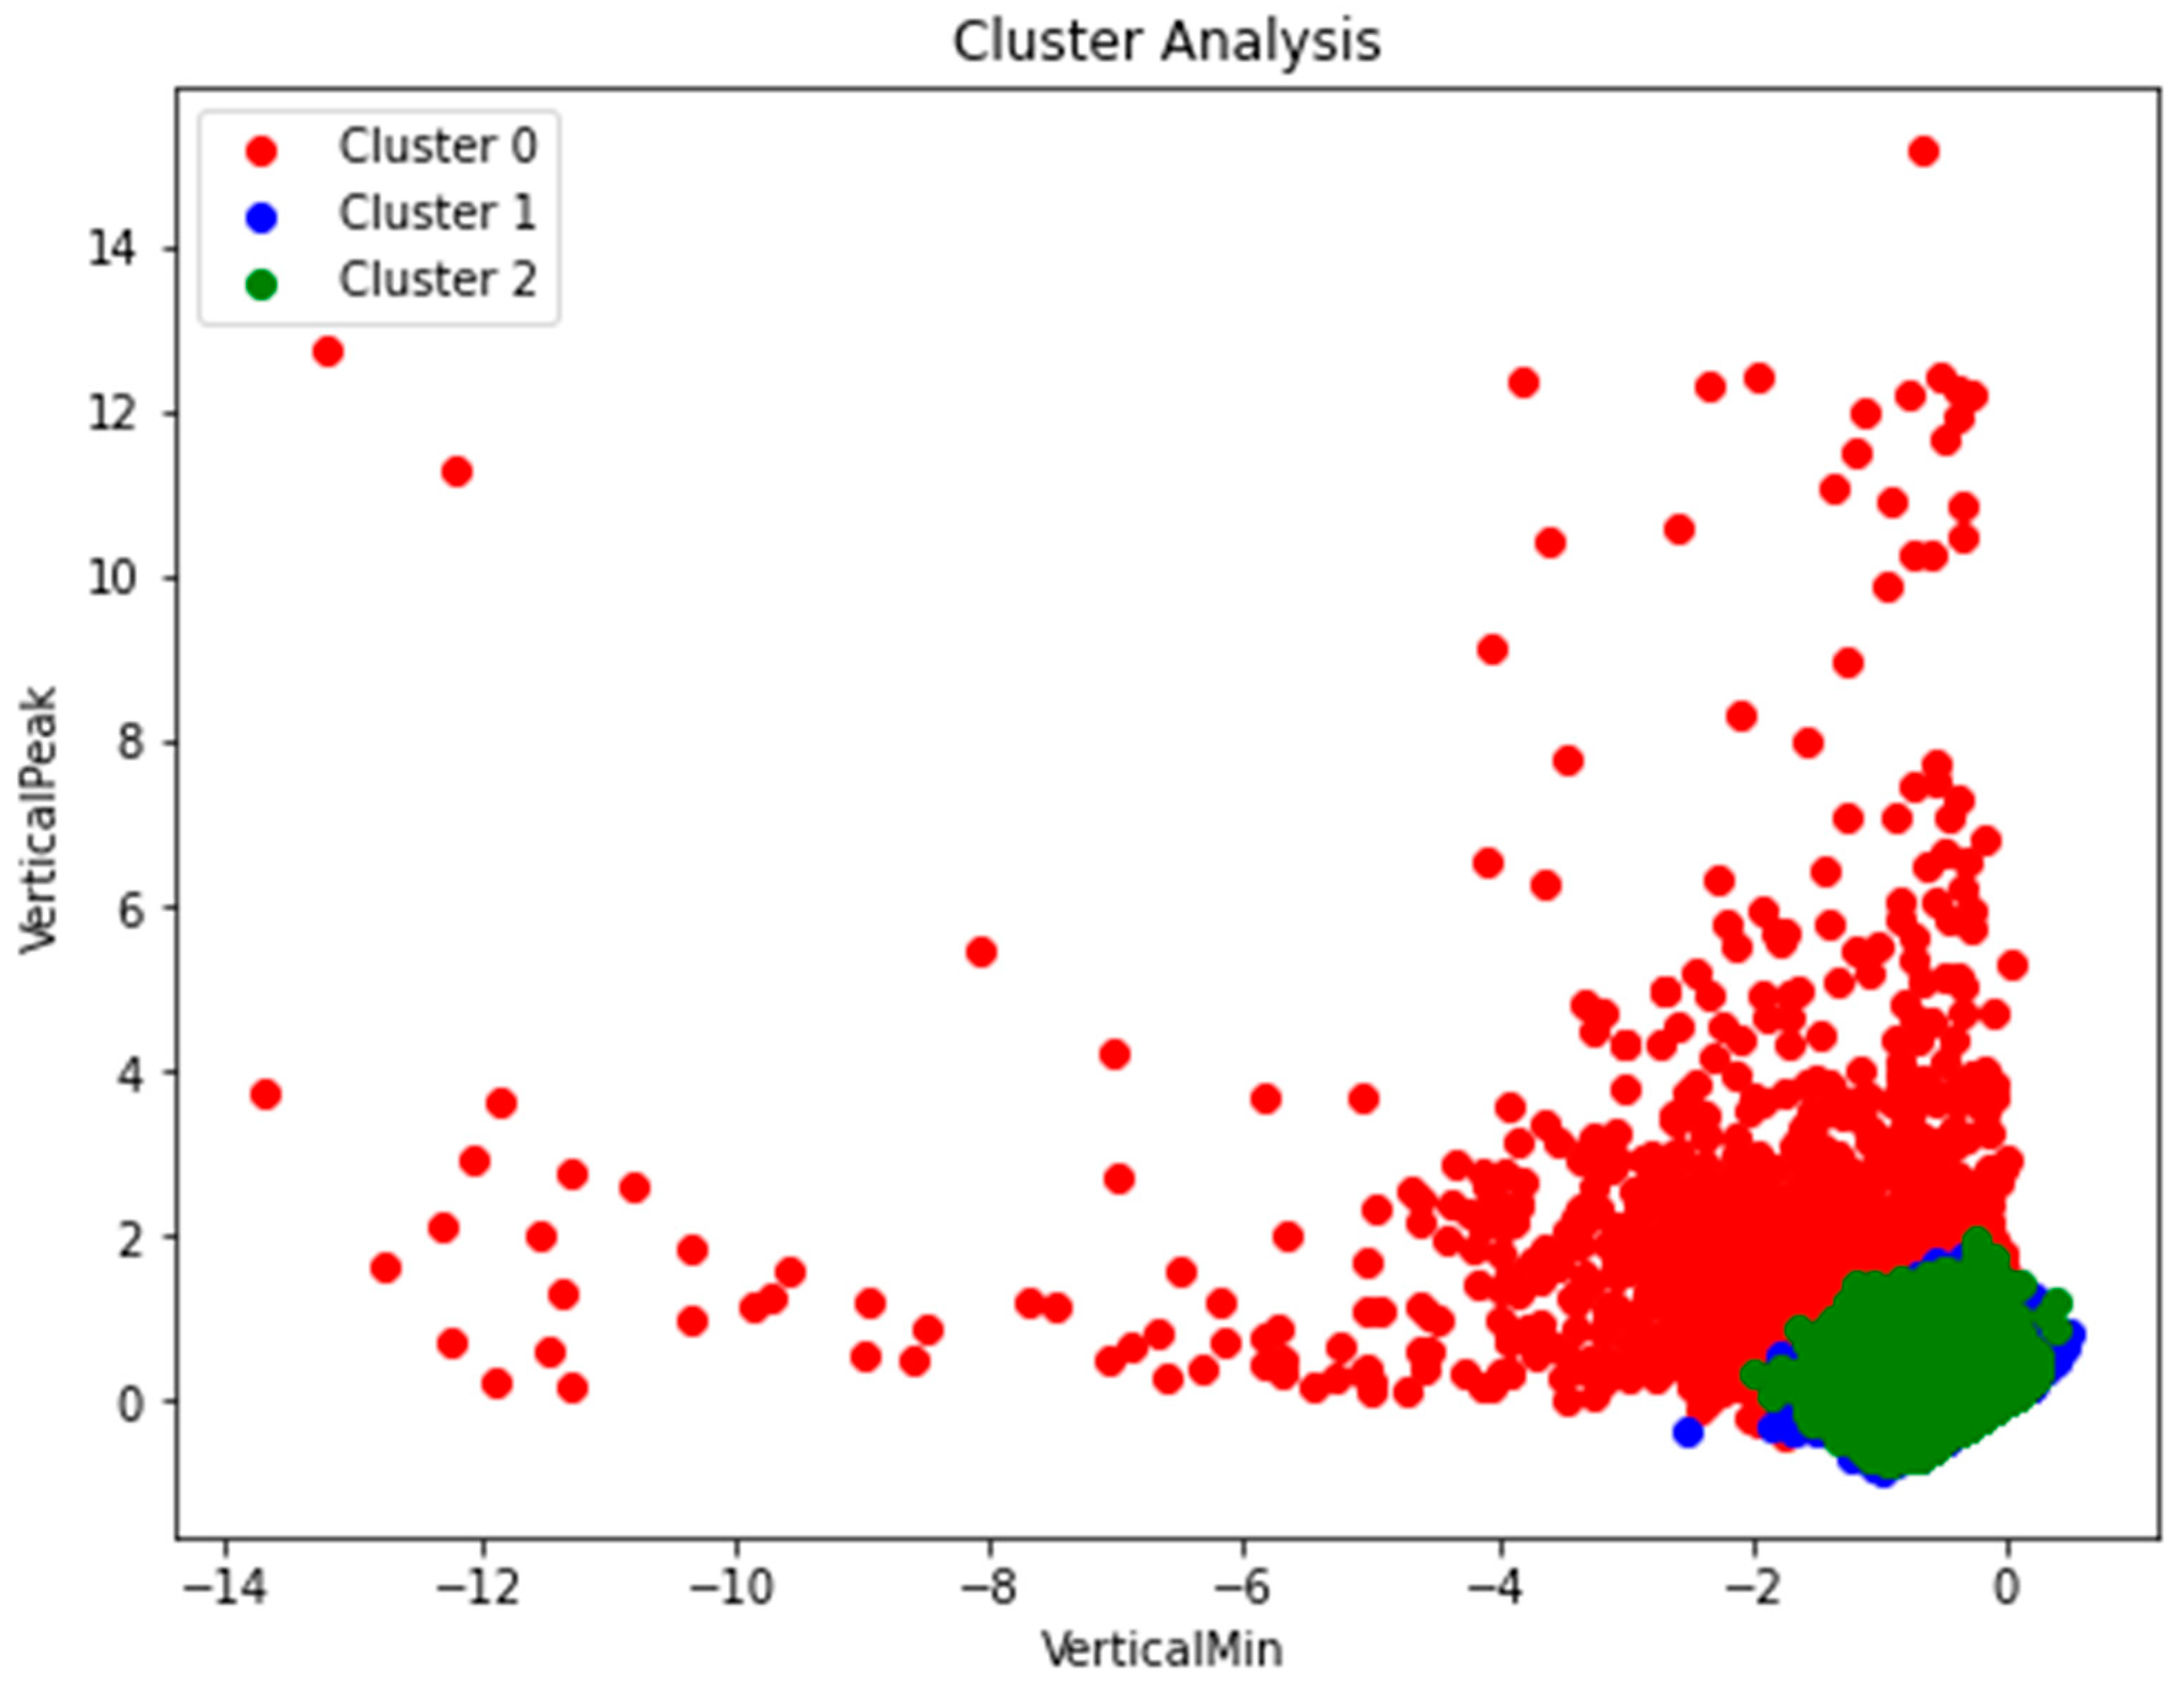
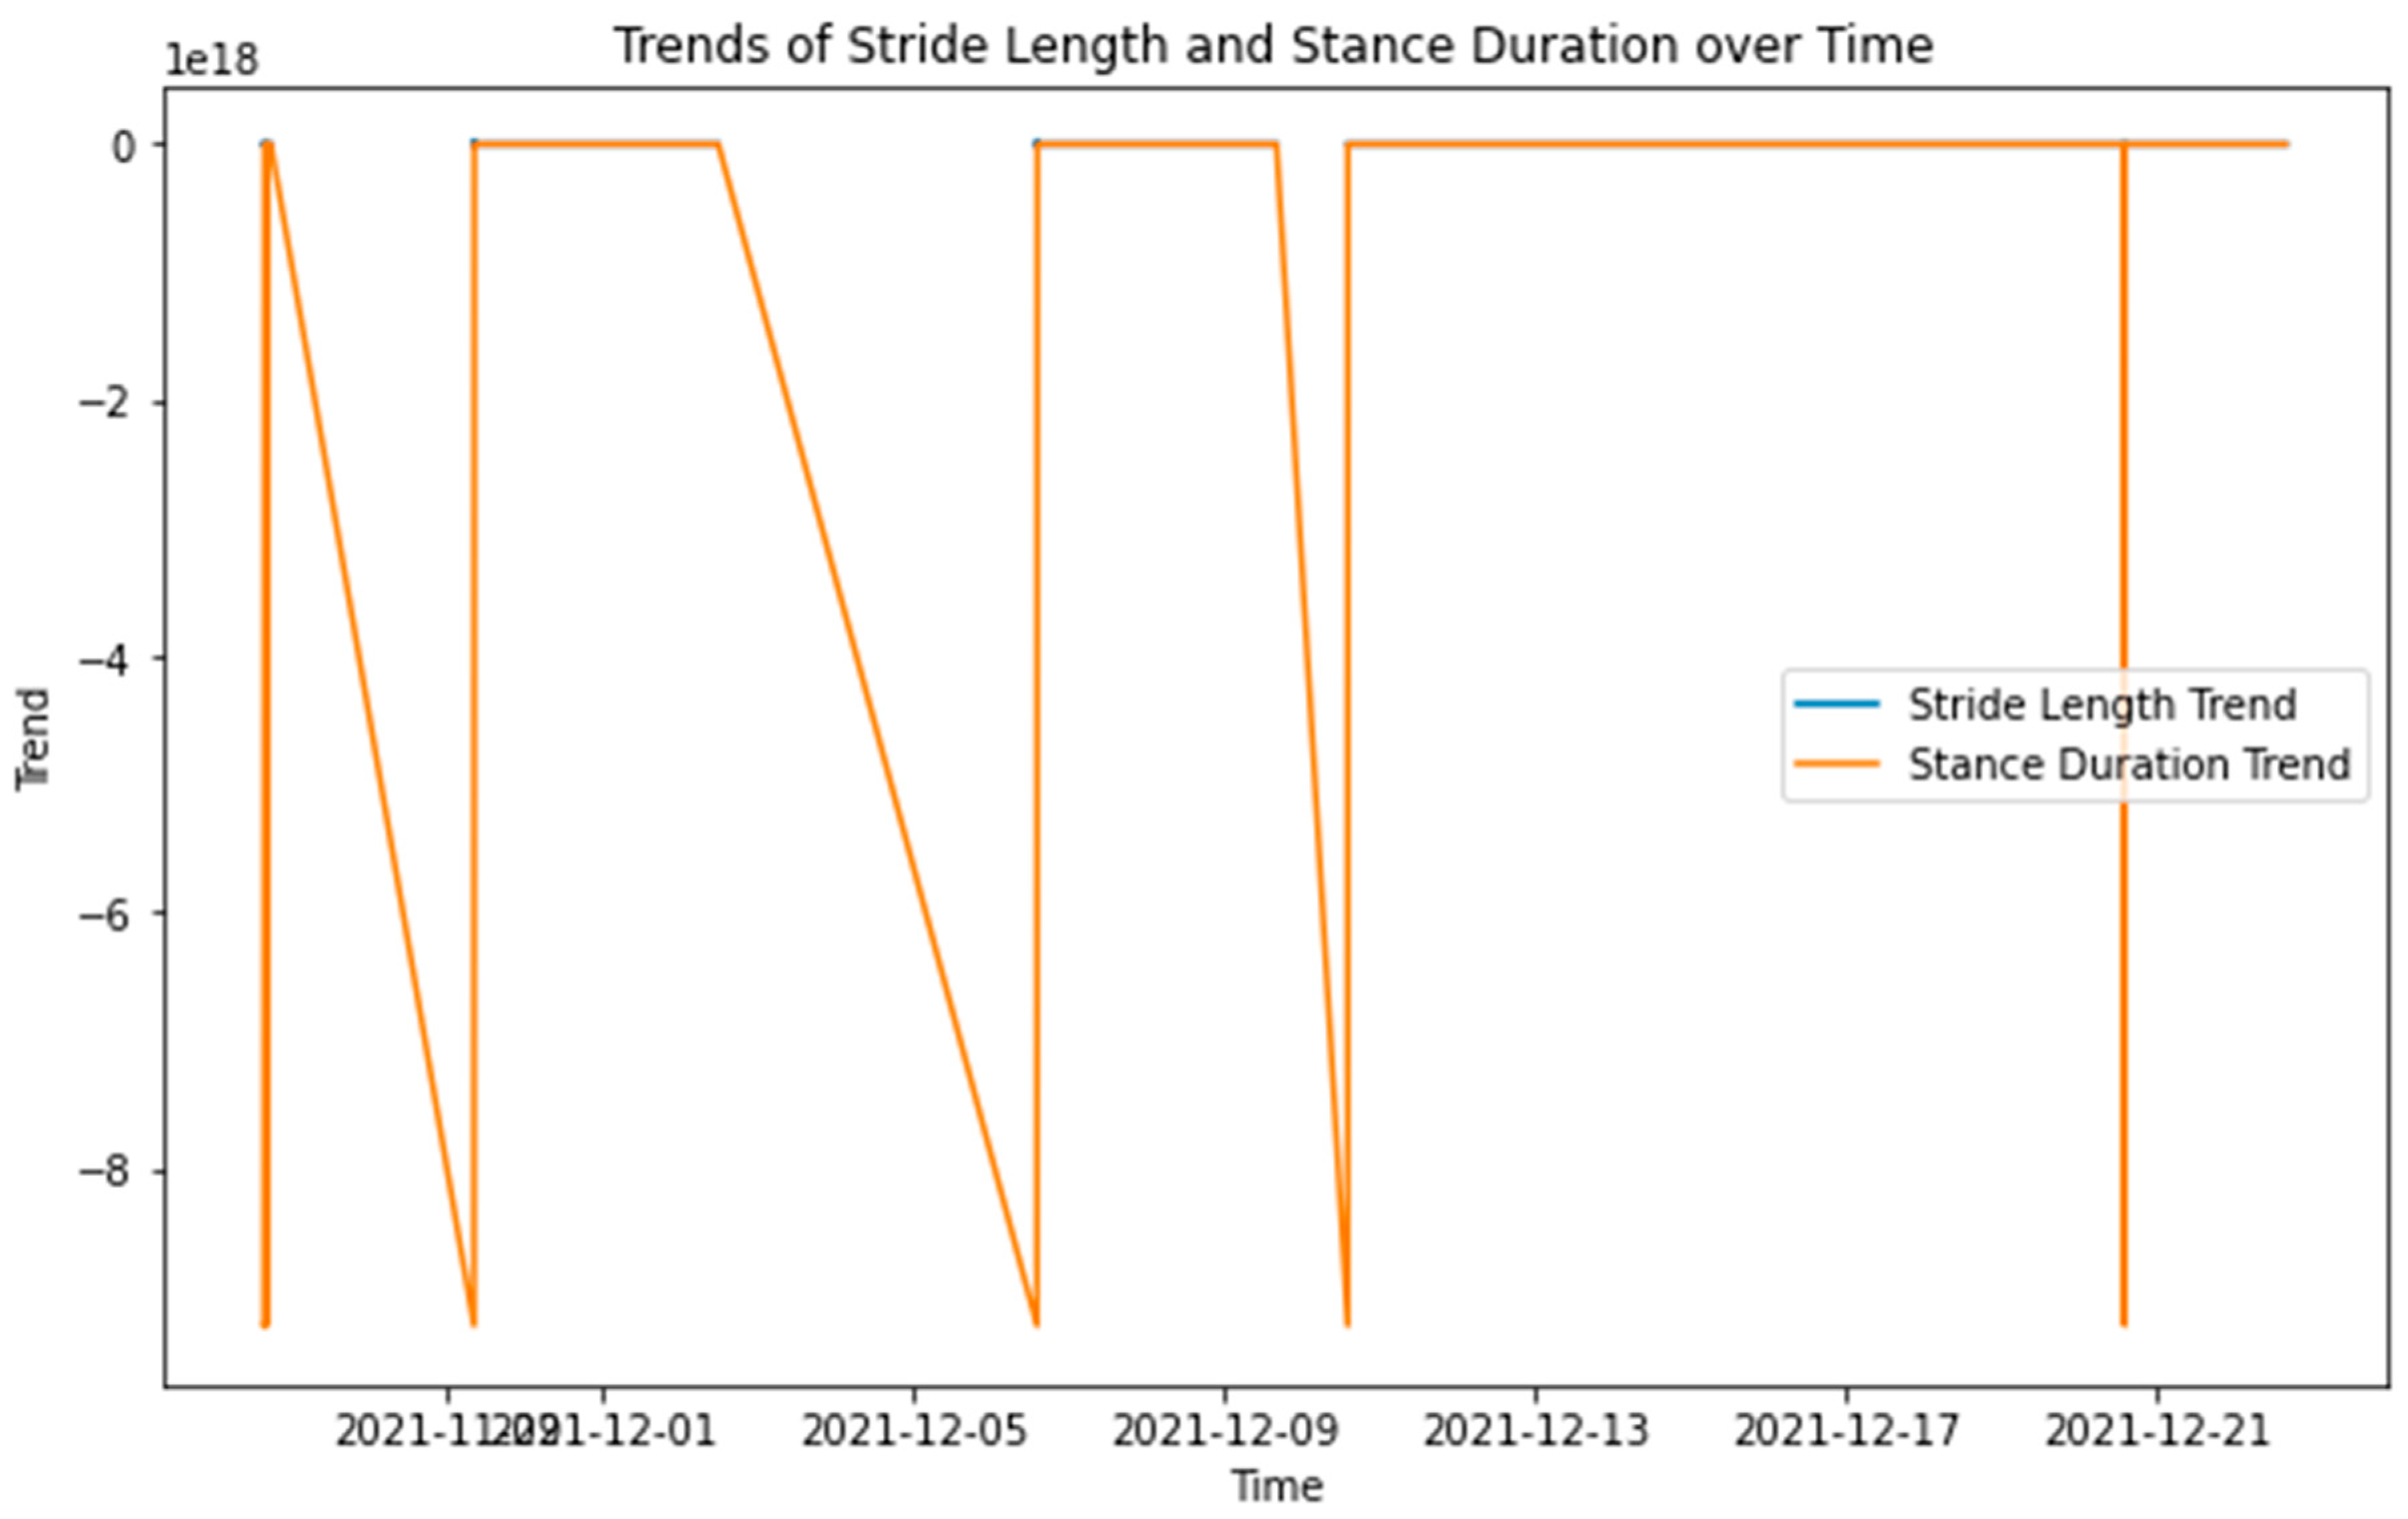
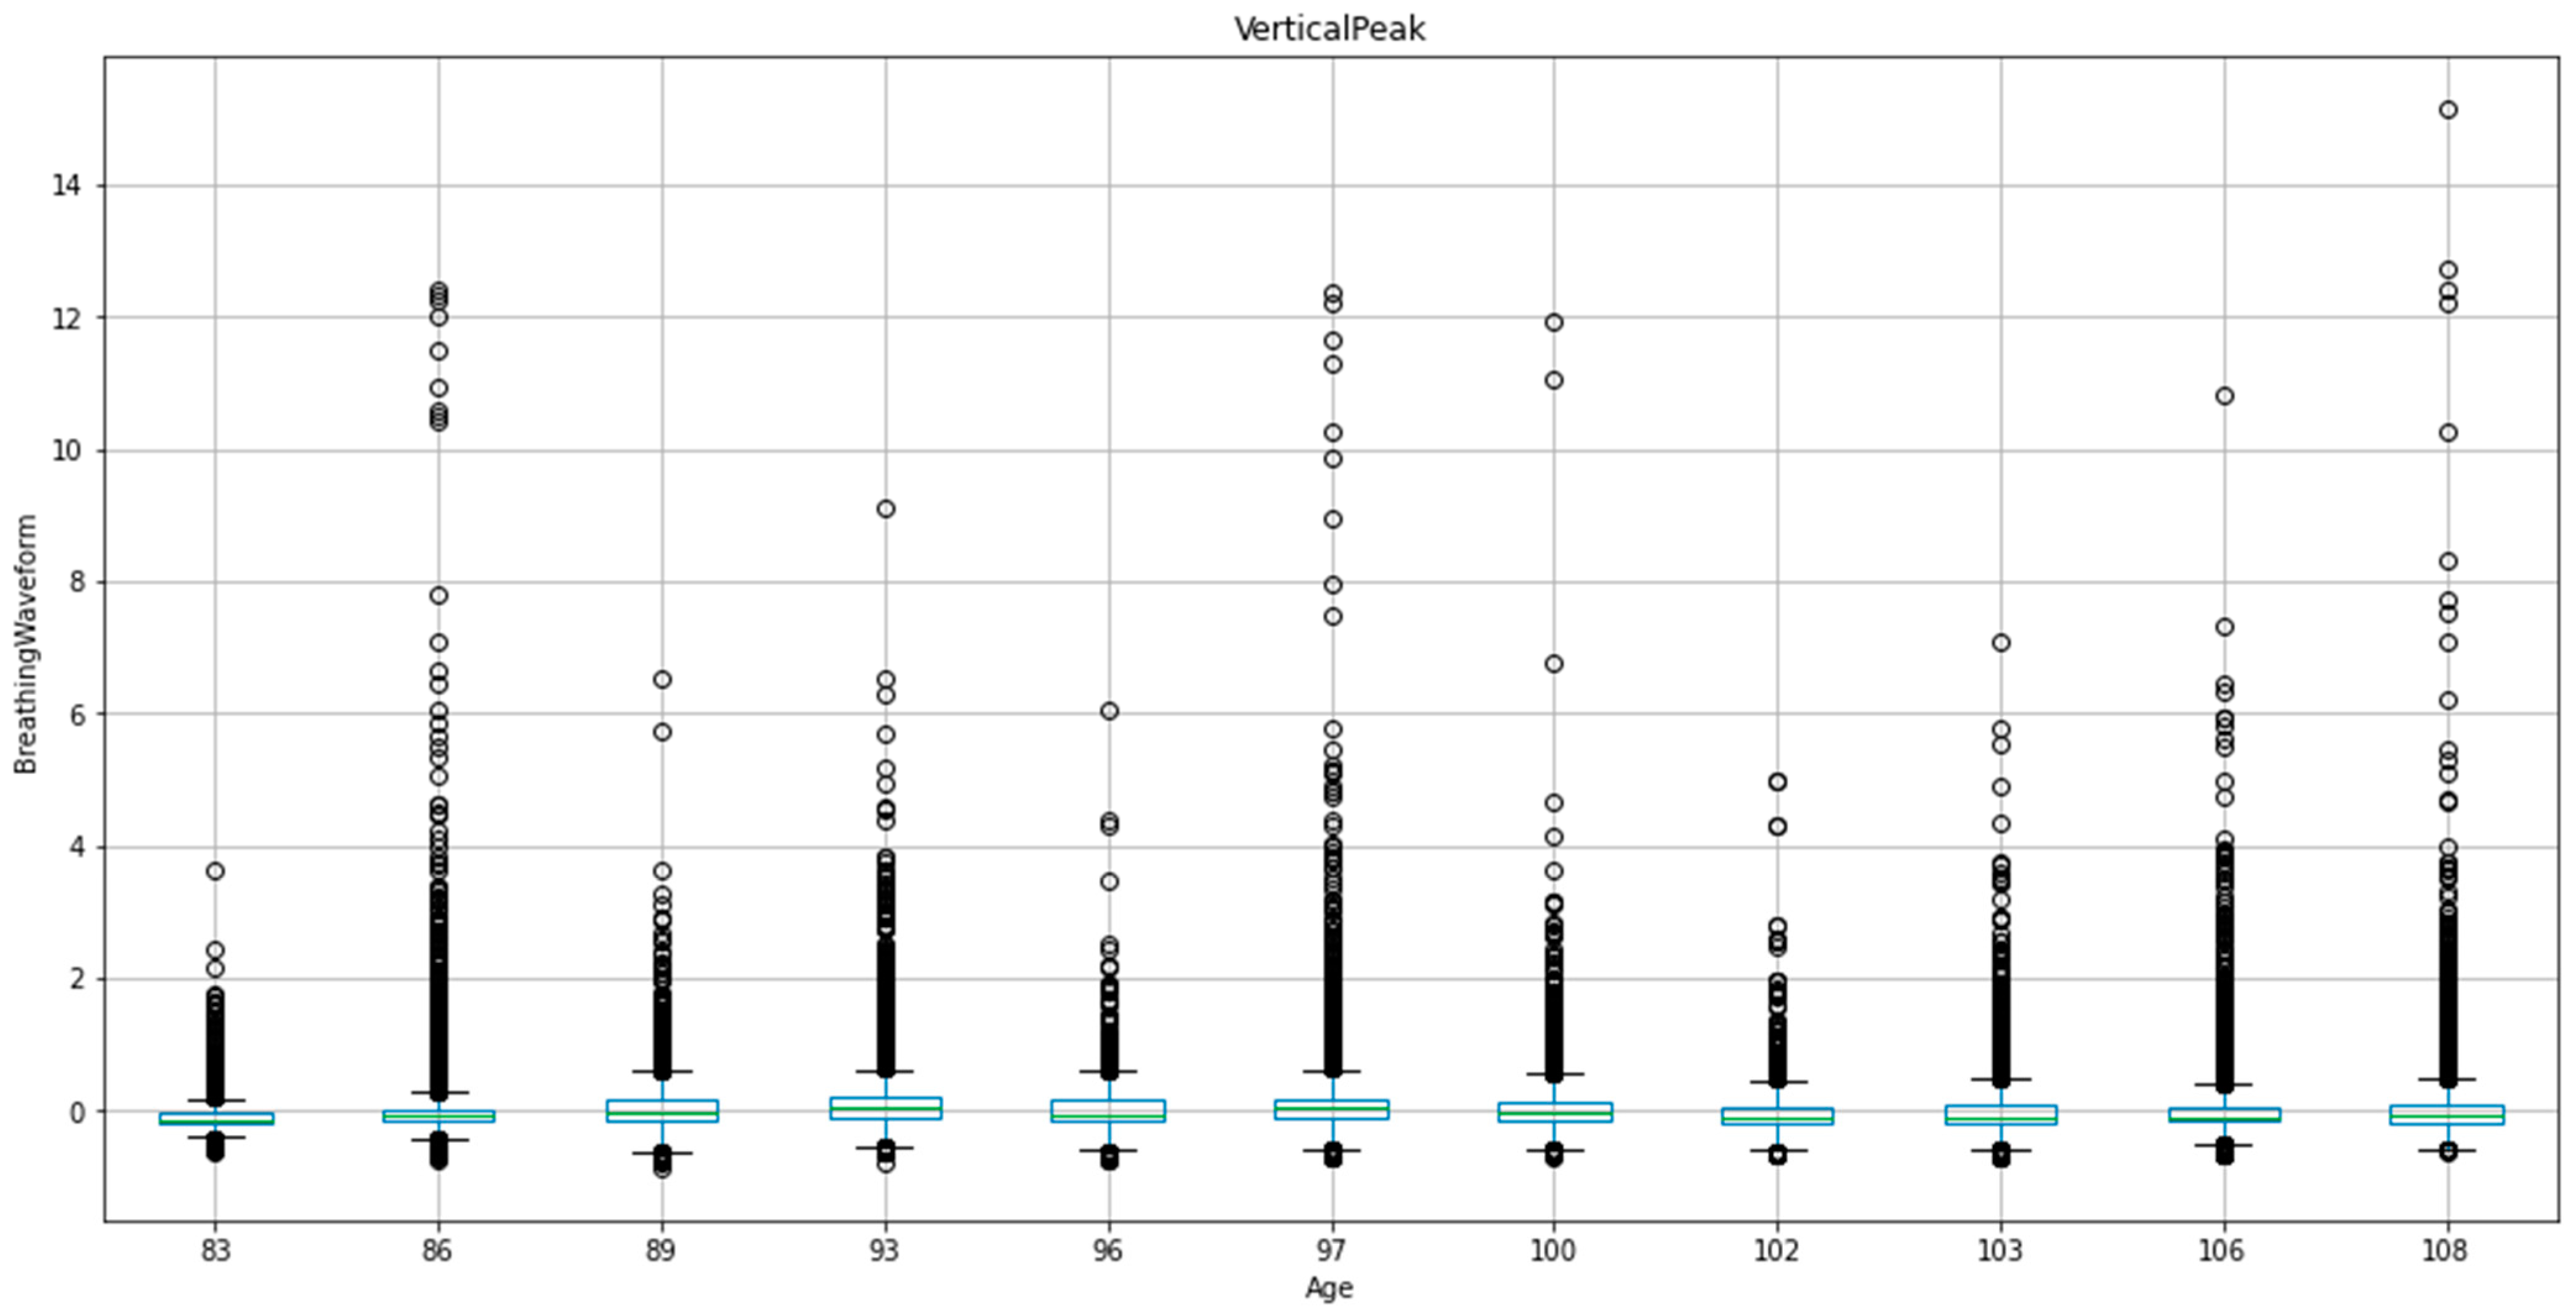
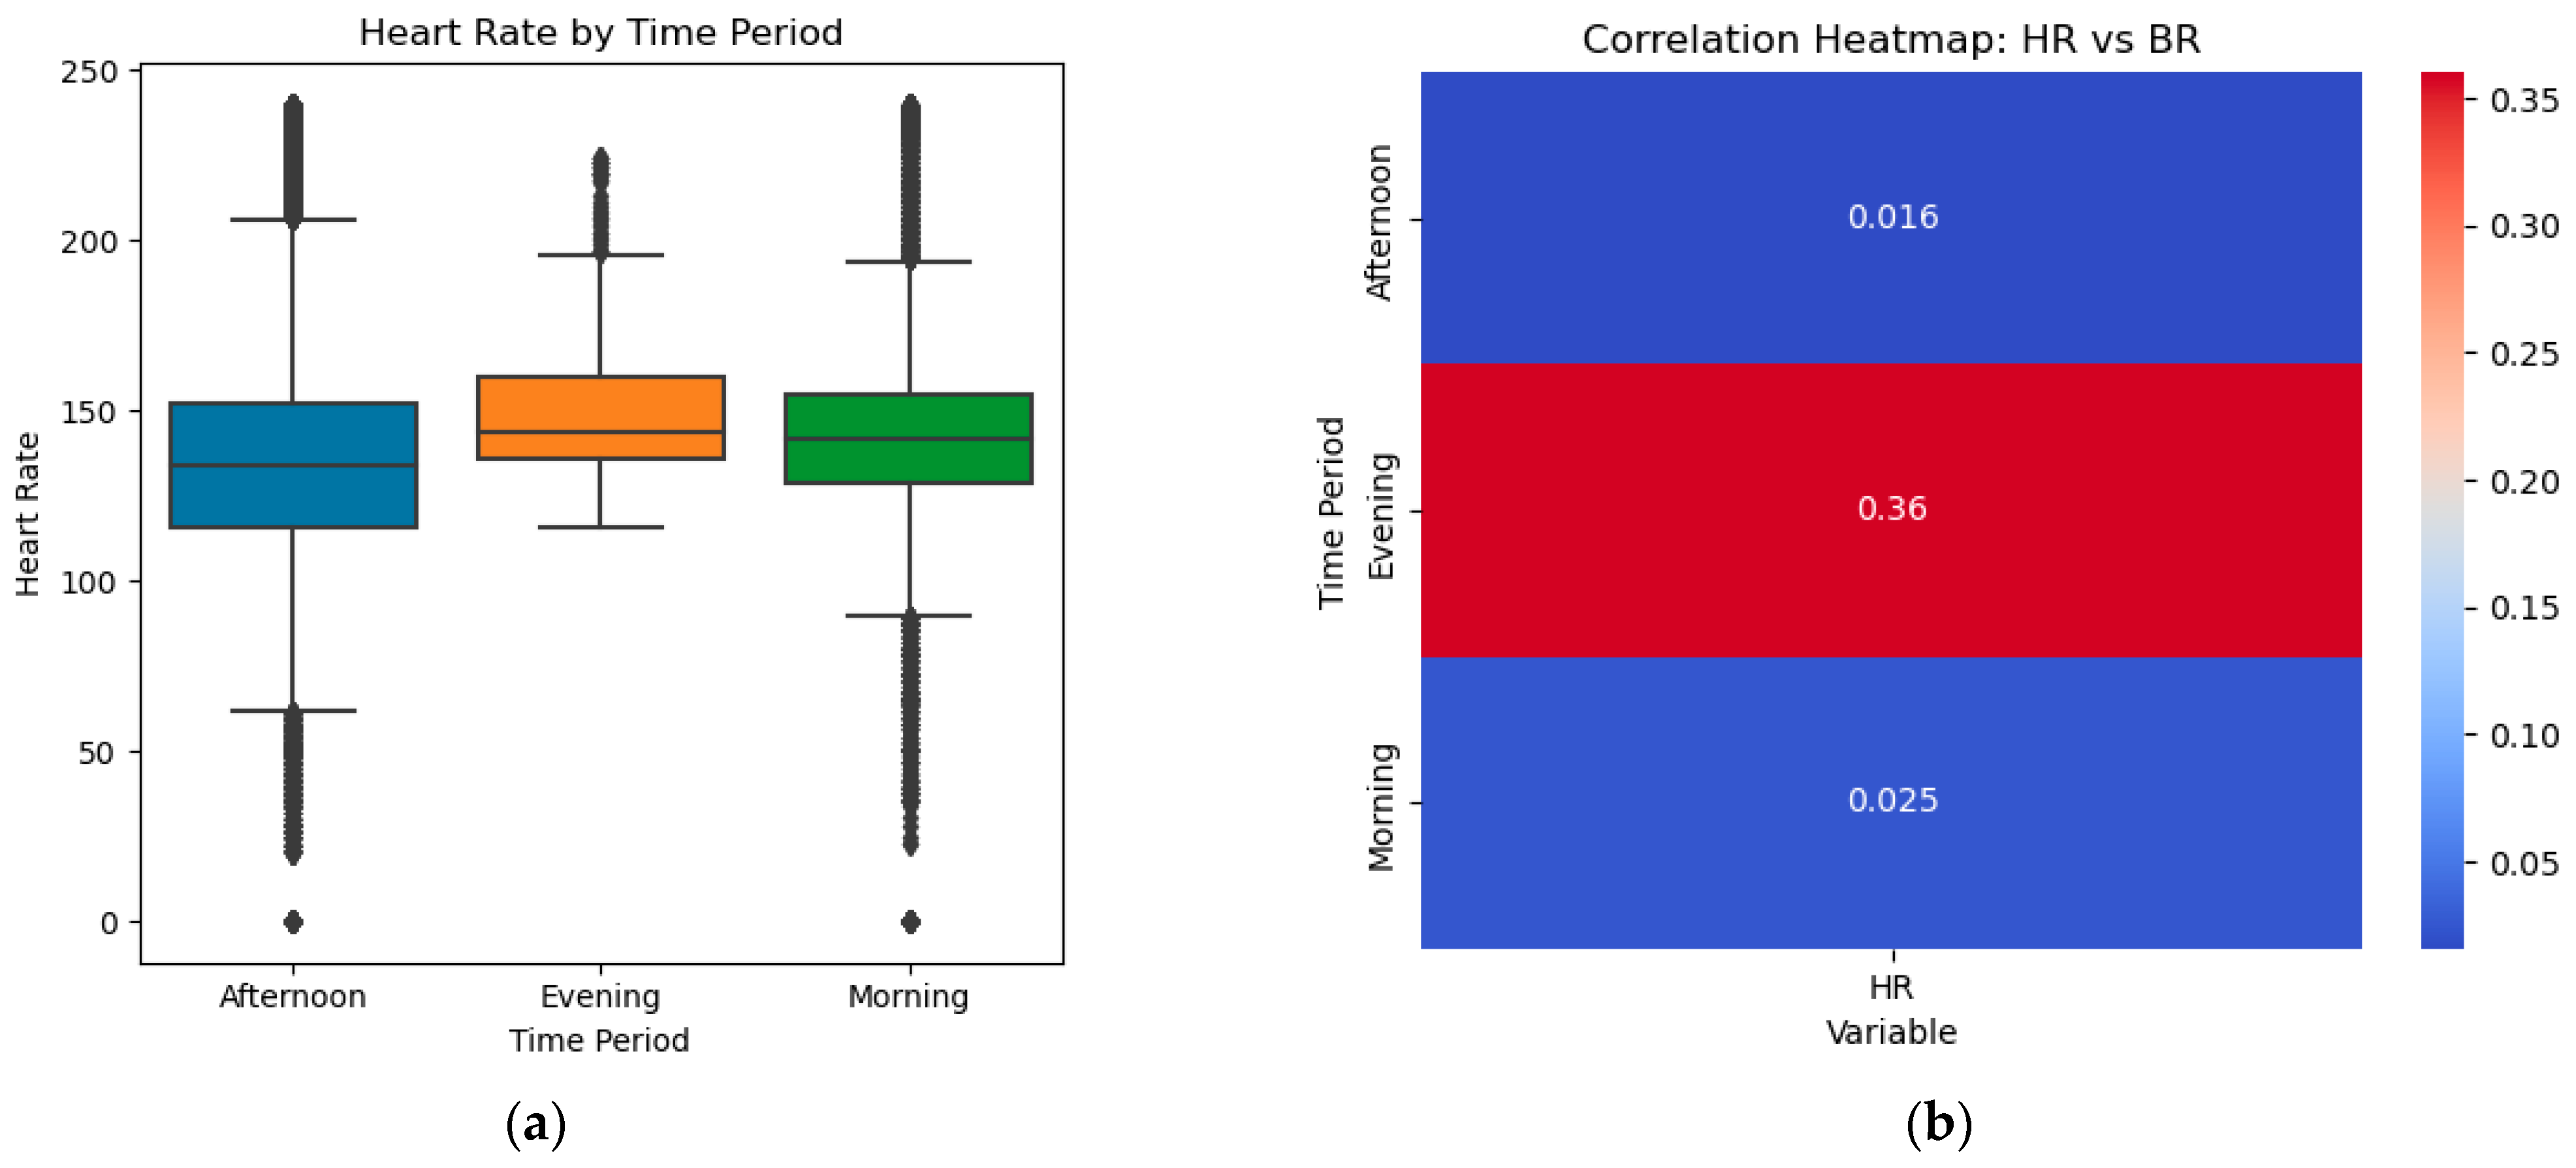
Table 1.
Comparative analysis of wearable sensors use and machine learning models in livestock behavior and resilience monitoring.
Table 1.
Comparative analysis of wearable sensors use and machine learning models in livestock behavior and resilience monitoring.
| Animal Species | Wearable Sensor Model | Collected Data | Machine Learning Models | Applications | References |
|---|---|---|---|---|---|
| Pigs | SMARTBOW® Ear Tag | Activity levels | RetinaNet Object Detection Algorithm | Automatically detect parts of the body of a sow and a hay rack in a farrowing pen | [19] |
| Sheep | Zephyr Bioharness 3.0 | Heart Rate Signal | Artificial Neural Networks | Stress measurement as indicated by heart signal during herding sheep flock | [20] |
| Pigs | High-Frequency Radio Frequency Identification (HF RFID) Ear Tags | Visits to water drinking stations | Linear Regressions, Statistical analysis | Drinking behavior of individual pigs | [21] |
| Beef Cattle (Limousin Cross Breed Steer) | Afimilk Silent Herdsman neck-mounted collar and Rumiwatch halter | 3-axis accelerometer sampled at 10 Hz with range of 2 g and 12-bit resolution | Hidden Markov Model, Linear Discriminant Analysis and Partial Least Squares Discriminant Analysis | Early detection of illness, detection of the onset of oestrus cycles | [22] |
| Beef cattle of Angus breed | eGrazor collar tags | Distributed over the spectral range of zero to 25 Hz, segment size of 5.12 s | Recurrent and Convolutional Neural Network models | Classification of animal behaviors such as grazing, walking, ruminating, resting, drinking | [23] |
| Cattle | Collar tag made of MPU9250 9-axis micro-electro-mechanical system (MEMS) inertial measurement unit (IMU), including a tri-axial accelerometer | Accelerometer sampling rate was 50 Hz for the collar tags and 62.5 Hz for the ear tags | RNN models, which feature long short-time memory (LSTM) | Animal behavior classification, such as grazing, resting, ruminating | [24] |
Table 2.
Comprehensive analysis of pig stress levels and adaptation physiology: A study of techniques, methodologies, and outcomes in data-driven animal behavioral science.
Table 2.
Comprehensive analysis of pig stress levels and adaptation physiology: A study of techniques, methodologies, and outcomes in data-driven animal behavioral science.
| Question Number | Question Description | Analysis Techniques Used | Methodology | Insights Gained |
|---|---|---|---|---|
| 1 | How do heart rate patterns differ in pigs in isolation vs. paired settings? | EDA, time and frequency domain analyzes, correlation analysis, spectral and Poincaré plot analyzes | Sensor data were visualized and subjected to time and frequency analyzes to discern patterns. Correlations between heart rates and environmental conditions were also explored. | Identified differences in heart rate patterns under varying settings, offering insights into stress levels. |
| 2 | How does respiration rate change when pigs are paired vs. in isolation? | Statistical testing, ANOVA tests, correlation analysis, time-series analysis | Respiration rates were compared under different social contexts using t-tests and ANOVA. Correlations and time-series analyzes were also performed to study the trend. | Found changes in respiration rates based on social context, serving as a potential stress indicator. |
| 3 | How does activity change in isolation vs. pairing conditions? | Visualization, change point detection, k-means clustering, random forest classification. | Activity patterns were visualized, and change points detected. Clustering and classification were applied to accelerometer data to categorize behaviors. | Noted significant changes in activity under isolation and pairing, hinting at behavioral changes linked to stress. |
| 4 | Can we detect changes in gait linked to lameness? | K-means clustering, Fourier analysis, temporal parameter calculation | Gait data were clustered to identify distinct patterns. Fourier analysis and temporal parameters were calculated to detect abnormalities. | Detected abnormalities in gait, aiding in early detection of potential health issues. |
| 5 | Does pigs’ age correlate with their gait or activity pattern? | Statistical analyzes, linear regression modeling, time series analysis | Correlations between age and gait or activity patterns were investigated using statistical analyzes and linear regression models. Time series analyzes were also performed to study trends. | Revealed that gait and activity patterns evolve with age, reflecting physical capabilities and comfort levels |
| 6 | Are there significant activity changes when pigs are paired? | Outlier removal, box plotting, time series analysis, statistical testing, feature engineering, anomaly detection, classification | Data outliers were removed, and data visualized. Statistical tests were conducted, and machine learning models were trained to detect anomalies and classify behaviors. | Discovered pairing has an impact on pigs’ activity levels, possibly indicating aggression or stress. |
| 7 | Do pigs adapt to the isolation during feeding and subsequent re-pairing? | Activity segmentation, statistical analyzes, machine learning models | Activities were segmented based on conditions. Statistical analyzes were performed, and machine learning models were used to study the adaptation process. | Found evidence of adaptation to repeated isolation and pairing, using changes in physiological parameters. |
| 8 | What other factors affect the pigs’ heart rate, respiration rate, or activity level? | Time segmentation, statistical analyzes, correlation analysis, contingency table, machine learning models | The day was segmented into periods. Statistical analyzes, correlation studies, and machine learning models were used to investigate the effects of various factors on physiological parameters. | Identified factors like time of day and duration of isolation significantly influencing physiological parameters. |
| 9 | Can we identify behavioral patterns during feeding, isolation, or pairing? | Visualization, statistical analyzes, clustering | Behaviors were visualized and statistically analyzed. Clustering was performed to identify distinct patterns during different activities. | Detected distinct behavioral patterns during different activities, offering deeper insights into pig behavior. |
| 10 | How can we assess the overall welfare of the pigs? | Descriptive statistics, visualizations, feature engineering, correlation analysis, time series analysis, sequence mining, Gaussian Hidden Markov Model | Descriptive statistics were calculated, and data visualized. Features were engineered to measure stress and gait quality. Time series analyzes, sequence mining, and Gaussian Hidden Markov Models were employed for trend analysis and state prediction. | Provided an overall assessment of pigs’ welfare in terms of stress levels and gait quality, enhancing livestock management. |
Table 3.
Comparative analysis of mean, median, and standard deviation for heart rate and heart rate variability among pigs.
Table 3.
Comparative analysis of mean, median, and standard deviation for heart rate and heart rate variability among pigs.
| Animal | HR Mean | HR Median | HR Std | HRV Mean | HRV Median | HRV Std |
|---|---|---|---|---|---|---|
| Pig11 | 134.050 | 138.000 | 36.185 | 24,339.519 | 22.000 | 31,654.858 |
| Pig13 | 134.978 | 136.000 | 34.869 | 20,468.156 | 28.000 | 30,353.554 |
| Pig15 | 137.898 | 139.000 | 31.670 | 16,583.735 | 26.000 | 28,472.199 |
| Pig21 | 134.396 | 137.000 | 40.453 | 25,021.694 | 28.000 | 31,825.314 |
| Pig22 | 137.109 | 136.000 | 31.948 | 31,597.587 | 50.000 | 32,733.994 |
Table 4.
Correlation coefficients between age and accelerometer variables.
| Age | PeakAccel | VerticalMin | VerticalPeak | LateralMin | LateralPeak | SagittalMin | SagittalPeak | |
|---|---|---|---|---|---|---|---|---|
| Age | 1.000 | −0.082 | −0.157 | −0.098 | 0.025 | −0.043 | −0.116 | −0.098 |
| PeakAccel | −0.082 | 1.000 | 0.315 | 0.406 | 0.152 | 0.235 | 0.272 | 0.339 |
| VerticalMin | −0.157 | 0.315 | 1.000 | 0.697 | 0.201 | 0.238 | 0.470 | 0.532 |
| VerticalPeak | −0.098 | 0.406 | 0.697 | 1.000 | 0.189 | 0.303 | 0.541 | 0.694 |
| LateralMin | 0.025 | 0.152 | 0.201 | 0.189 | 1.000 | 0.484 | 0.431 | 0.536 |
| LateralPeak | −0.043 | 0.235 | 0.238 | 0.303 | 0.484 | 1.000 | 0.420 | 0.559 |
| SagittalMin | −0.116 | 0.272 | 0.470 | 0.541 | 0.431 | 0.420 | 1.000 | 0.736 |
| SagittalPeak | −0.098 | 0.339 | 0.532 | 0.694 | 0.536 | 0.559 | 0.736 | 1.000 |
Disclaimer/Publisher’s Note: The statements, opinions and data contained in all publications are solely those of the individual author(s) and contributor(s) and not of MDPI and/or the editor(s). MDPI and/or the editor(s) disclaim responsibility for any injury to people or property resulting from any ideas, methods, instructions or products referred to in the content. |
© 2023 by the author. Licensee MDPI, Basel, Switzerland. This article is an open access article distributed under the terms and conditions of the Creative Commons Attribution (CC BY) license (https://creativecommons.org/licenses/by/4.0/).
Share and Cite
MDPI and ACS Style
Neethirajan, S. AI in Sustainable Pig Farming: IoT Insights into Stress and Gait. Agriculture 2023, 13, 1706. https://doi.org/10.3390/agriculture13091706
AMA Style
Neethirajan S. AI in Sustainable Pig Farming: IoT Insights into Stress and Gait. Agriculture. 2023; 13(9):1706. https://doi.org/10.3390/agriculture13091706
Chicago/Turabian StyleNeethirajan, Suresh. 2023. "AI in Sustainable Pig Farming: IoT Insights into Stress and Gait" Agriculture 13, no. 9: 1706. https://doi.org/10.3390/agriculture13091706
Note that from the first issue of 2016, this journal uses article numbers instead of page numbers. See further details here.