Article

Balancing Yield and Antioxidant Capacity in Basil Microgreens: An Exploration of Nutrient Solution Concentrations in a Floating System

by
Mohammad Reza Fayezizadeh
1,
Naser Alemzadeh Ansari
1,*,
Mohammad Mahmoodi Sourestani
1 and
Mirza Hasanuzzaman
2,3,*
1
Department of Horticultural Science, Faculty of Agriculture, Shahid Chamran University of Ahvaz, Ahvaz 61357-43311, Iran
2
Department of Agronomy, Faculty of Agriculture, Sher-e-Bangla Agricultural University, Sher-e-Bangla Nagar, Dhaka 1207, Bangladesh
3
Kyung Hee University, 26 Kyungheedae-ro, Dongdaemun-gu, Seoul 02447, Republic of Korea
*
Authors to whom correspondence should be addressed.
Agriculture 2023, 13(9), 1691; https://doi.org/10.3390/agriculture13091691
Submission received: 27 July 2023 / Revised: 17 August 2023 / Accepted: 24 August 2023 / Published: 28 August 2023
(This article belongs to the Special Issue Advances in Nutrient Management in Soil-Plant System)

Abstract

:
The appropriate concentration of the nutrient solution (NS) plays an important role in the yield, antioxidant capacity, and biochemical compounds of basil microgreens in the floating system. This study examined the impact of five different concentrations of Hoagland’s NS (25%, 50%, 75%, 100%, and 125%) on the antioxidant capacity, biochemical compounds, and yield of four basil cultivars and genotypes (Persian Ablagh, Violeto, Kapoor and Red Rubin) in a floating system, utilizing a split plots designs. Results revealed that the highest yield was achieved with a 50% NS concentration. The Persian Ablagh genotype, under a 125% NS concentration, exhibited the highest content of carotenoids, flavonoids, phenolic compounds, and antioxidant potential index (APCI). The Violeto cultivar at a 100% NS concentration produced the highest amounts of vitamin C and anthocyanin. The Kapoor cultivar, when grown with a 100% NS concentration, demonstrated the greatest antioxidant capacity. The nutrient solution with 125% concentration compared to 50% concentration reduced the yield by 23.29%. Also, the performance of the Violeto cultivar increased by 36.24% compared to the red variety of Robin. According to the APCI index, the genotype of Iranian Ablaq basil increased by 152.79% in the treatment of nutrient solution with a concentration of 125% compared to 50%. In this study, yield and total chlorophyll showed a significant negative correlation. A significant positive correlation was observed between vitamin C content and flavonoids, anthocyanin, phenolic compounds, and antioxidant capacity. Anthocyanin content exhibited a positive and significant correlation with the APCI. Based on these findings, we recommend a 50% NS concentration of Hoagland’s NS for optimal yield, a 125% NS concentration for the production of secondary metabolites with enhanced antioxidant capacity, and a 100% NS concentration as a balance between antioxidant properties and yield for basil microgreens production in a floating system.

1. Introduction

The connection between the consumption of nutritious food and the prevalence of chronic diseases can be linked to the absence of beneficial phytochemical antioxidants in plants [1]. These biomolecules, often referred to as secondary metabolites, are vital for the defense mechanisms and functional interaction between the plant and its environment [2].
Microgreens, introduced in the 21st century, offer the possibility of large and small-scale cultivation while delivering a higher concentration of nutrients and antioxidants compared to mature plants [3]. However, their low yields, increased production costs, and the accessibility of cheaper processed foods impact their consumption, thereby affecting the nutritional value of contemporary diets [4]. Therefore, strategies to improve food quality without compromising yield are urgently needed. Due to these challenges, microgreens are becoming popular subjects of studies exploring biochemical properties and enhancing antioxidant capabilities; hence, their labels as “functional foods” or “superfoods.” Previous research has shown variable responses among commercial microgreen basil (Ocimum basilicum L.) cultivars and genotypes. Some noteworthy cultivars and genotypes include Persian Ablagh, Violeto, Kapoor, and Red Rubin, which demonstrated superior antioxidant potential and yield among 21 cultivars in a floating system with LED lighting [5].
The antioxidant potential of basil microgreens is related to the presence of secondary metabolites with antioxidant properties such as polyphenols, flavonoids (principally flavonols and anthocyanins), vitamin C, carotenoids, glucosinolates, essential oils, alkaloids, etc. [6,7]. The different concentrations of nutrient solution (NS) affect the metabolism of these secondary metabolites [8]; therefore, according to the reaction of different types of basil in different concentrations of NS, the regulation and synthesis of these phytochemicals need more research. Many studies have pointed out, that the best production methods for microgreen cultivation in hydroponic systems with increasing the antioxidant potential and yield have not been developed [9,10].
Prior research also highlights the significant role of NSs in enhancing antioxidant potential. Numerous studies have been conducted on different concentrations of Hoagland’s NS in microgreen cultivation across various species [11,12,13]. For instance, studies involving radish and watercress cultivation under different levels of Hoagland’s NS (25%, 50%, and 100%) demonstrated how altering the NS concentration could impact the amount of carotenoids, total phenols, nitrates, and antioxidant capacity [14]. Similarly, different NS levels (50% and 100%) affected the growth characteristics of purple cabbage, influencing both biomass and carotenoid content at harvest [15]. Recent research on Brussels sprouts and green cabbage microgreens revealed that a 25% concentration of Hoagland’s NS increased yield and chlorophyll (chl) content, while the carotenoid content increased with a higher NS concentration [16]. It is clear from past research that low NS concentrations can inhibit plant growth, while excessive nutrient use and high electrical conductivity (EC) can raise production costs and potentially be harmful to plants [17,18,19]. The ambiguous effects of low-concentration NS (nutritional stresses) on leafy vegetable yield parameters have led producers to use higher concentrations than required [20].
Ultimately, previous studies conclude that the ideal EC of the NS depends on the cultivation method and the product being produced [21]. While methods to boost antioxidant properties without damaging the performance of basil microgreens exist, these are limited and need further exploration. Hoagland’s NS has been the base NS for microgreen cultivation [22]. However, the response of specific important cultivars, as well as the Persian Ablagh genotype, to different concentrations of Hoagland’s NS in a floating system, especially at 125% NS concentration, is not well understood. The aim of this study is to understand the responses of key commercial microgreen basil cultivars and the Persian genotype to changes in NS concentration within a floating system.

2. Materials and Methods

2.1. Experimental Setup and Design

This experiment was conducted using a split-plot design based on randomized complete blocks with three replications. The main factor examined was different concentrations of Hoagland’s NS (25%, 50%, 75%, 100%, and 125%). The subplot factor consisted of four basil cultivars: Red Rubin, Kapoor, Violeto (obtained from Emanuele Larosa Seeds, Puglia, Italy), and the Persian Ablagh genotype (sourced from local farmers in Tabriz city, N: 48°25′ and E: 38°2′). The cultivation was conducted in a floating system. Basil seeds were uniformly planted in a mixture of cocopeat and perlite (v/v: 50%) in seedling trays with cell dimensions of 5 × 3 × 3 cm with a density of 48.5 g m−2. Each concentration of the tested solution had a volume of 20 L, which was placed in containers measuring 96 × 18 × 14 cm. Seedling trays were kept at a temperature of 25 °C and humidity of 65% for 24 h, and dark conditions were applied to accelerate germination. After germination, the microgreens were nourished with five levels of Hoagland’s NS (Table 1). The basil microgreens were grown under blue and red LED lights (1:1) with a light intensity of 300 ± 15 μmol photons m−2 s−1 for a photoperiod of 16 h within the floating system. Night and day temperatures were maintained at 22 ± 1 and 24 ± 1 °C, respectively, while the night and day relative humidity were set at 75 ± 5 and 65 ± 5, respectively. The pH and EC of the NS were controlled daily after sowing seeds.

2.2. Determination of Photosynthetic Pigments

Arnon’s method [23] was used with some modifications to measure the photosynthetic pigments of leaves. According to this method, 30 mg of fresh leaves were placed in the dark with 300 microliters of 80% acetone for 72 h. In the next step, the samples were centrifuged for 10 min and 250 microliters of extract from each sample was added to each well of a microplate reader (INNO, LTEK, Seongnam, Korea) and measured at wavelengths of 663, 645, and 470 nm. Using formulas 1–4, the contents of chlorophyll a (chl a), chlorophyll b (chl b), total chlorophyll, and carotenoids were calculated, respectively.
Chl a = (((12.7 × A663) − (2.69 × A645))/W) × V
Chl b = (((22.9 × A645) − (4.68 × A663))/W) × V
Total chl = (((20.08 A645) + (8.02 A663))/W) × V
Carotenoids = (1000(A470) − 1.8 (chl a) − 58.2 (chl b))/198
W = sample weight (g), V = sample volume (mL).

2.3. Determination of Vitamin C Content

To determine the vitamin C content of fresh microgreen basil leaves, 0.3 g of each sample was separated and mixed with 1 mL of 1% metaphosphoric acid and then centrifuged at 900 g for 15 min. In the next step, 70 microliters of the supernatant were mixed with an equal amount of 2,6-dichloroindophenol sodium salt (DCIP) (30 ppm) and incubated at room temperature for one minute [24]. In the last step, absorbance was measured at a wavelength of 515 nm by the microplate reader described above. Vitamin C concentration was calculated based on a standard curve for vitamin C (mg AA g−1 fresh weight, FW); (y = 629.42x − 5.3205, R2 = 0.99).

2.4. Measurement of Antioxidant Capacity, Polyphenols, Flavonoids, and Anthocyanin

Half a gram of fresh basil microgreen leaves was extracted with 5 mL of 80% methanol and then stored in the dark in the refrigerator (4 °C) for 24 h. To calculate the antioxidant and biochemical compounds, the extracted samples were centrifuged at 3000 rpm for 15 min.
The method proposed by Sharma and Bhat [25] was used to evaluate the antioxidant capacity. The percentage of 2-diphenyl-1-picrylhydrazyl (DPPH) inhibition was calculated using the following equation:
Radical scavenging activity DPPH % = {(Abs of control − Abs of sample)/(Abs of control)} × 100.
Total phenolic compounds were measured by mixing 20 µL of the extract with 20 µL of 10% (w/v) Folin–Ciocalteu reagent and 160 µL of 1 M Na2CO3 solution [26]. After incubating the samples for 20 min in the dark, the absorbance was measured at a wavelength of 765 nm using a microplate reader. The polyphenolic compounds were calculated in terms of mg gallic acid g−1 FW from the calibration curve of gallic acid, GA (y = 105.88 × x, R2 = 0.99).
Flavonoids were measured by adding 20 μL of the extracted sample to a mixture of 85 μL of distilled water and 5 μL of 5% NaNO2. After a 6 min reaction, 10 μL of 10% AlCl3·6H2O was added to the mixture. After another 5 min reaction, 35 μL of 1 M NaOH and 20 μL of distilled water were added, and the absorbance was measured at a wavelength of 520 nm. The results were expressed as mg of (+)-catechin (CAE) hydrate g−1 FW of basil leaf [27].
The amount of anthocyanin in the extract was measured by adding 40 μL of extract and 160 μL of buffer to the microplate wells, with absorbance measured at 520 and 700 nm after 20 to 50 min [28].

2.5. Determination of the Antioxidant Potential Composite Index

The combined antioxidant potential composite index (APCI) was used to quantitatively assess the antioxidant capacity of basil microgreens [29]. Based on the formula, APCI was the average of six antioxidant activity indices, including antioxidant capacity, vitamin C, carotenoids, flavonoids, polyphenols, and anthocyanins.
X1: Antioxidant capacity;
X2: Polyphenols;
X3: Vitamin C;
APCI = ( m e a s u r e d   X 1 M a x   X 1 + + m e a s u r e d   X 6 M a x   X 6 n ) · 100
X4: Flavonoids;
X5: Anthocyanin;
X6: Carotenoids;
n: Number of the trains.

2.6. Yield of Basil Microgreen

On the 25th day after planting, the yield of microgreens was measured and reported in terms of kg m−2.

2.7. Statistical Analysis

IBM SPSS software version 22 was used for data analysis. Duncan’s multiple range test (p ≤ 0.05) was used for mean comparison. A bivariate Pearson correlation analysis was performed to identify any linear relationship between the studied trains.

3. Results

3.1. Content of Photosynthetic Pigments

Based on the variance analysis results, the effects of NS concentration, the cultivar (C), and the interaction between NS concentration and cultivar (NS × C) on chl a, chl b, and total chl content significantly differed at a 1% level. The highest and lowest chl a content were observed in the Red Rubin cultivar at 125% NS concentration (0.9 mg g−1 FW) and the Violeto cultivar at 75% NS concentration (0.34 mg g−1 FW), respectively. The highest and lowest chl b content were related to the Red Rubin cultivar at 100% NS concentration (0.58 mg g−1 FW) and the Violeto cultivar at 50% NS concentration (0.15 mg g−1 FW), respectively. The highest and lowest total chl content were measured in the Ablagh genotype at 100% NS concentration (1.41 mg g−1 FW) and the Violeto cultivar at 75% NS concentration (0.5 mg g−1 FW), respectively (Table 2). Total chl content had a significant positive correlation with carotenoid (r = 0.278**), vitamin C (r = 0.325*), total phenolic compounds (r = 0.299*), antioxidant capacity (r = 0.309*), and APCI index (r = 0.343**) (Table 3). A significant negative correlation was observed between the yield of microgreens and the content of chl a, chl b, and total chl (Table 3).

3.2. Carotenoid Content

Based on the variance analysis results, the effects of NS, C, and their interaction (NS × C) on carotenoid content differed significantly at the 1% level. The highest and lowest carotenoid content were observed in the Ablagh genotype at 125% NS (0.56 mg g−1 FW) and the Violeto cultivar at 25% NS (0.10 mg g−1 FW), respectively (Table 2). Carotenoid content had a significant positive correlation with vitamin C (r = 0.785**), flavonoids (r = 0.829**), phenolic compounds (r = 0.530**), antioxidant capacity (r = 0.618**), and APCI index (r = 0.888**) (Table 3).
Table 3. Correlation coefficient between studied characters.
Chl aChl bChl a+bCarVit CTFCACNsTPCACAPCIY
Chl a1
Chl b0.874 **1
Chl a+b0.976 **0.959 **1
Car0.326 *0.1930.278 *1
Vit C0.377 **0.2320.325 *0.785 **1
TFC0.2240.0760.1660.829 **0.606 **1
ACNs0.1800.1360.1640.2390.455 **0.1441
TPC0.394 **0.1540.299 *0.530 **0.468 **0.590 **0.0661
AC0.372 **0.2010.309 *0.618 **0.482 **0.697 **−0.0140.730 **1
APCI0.414 **0.2240.343 **0.888 **0.852 **0.851 **0.426 **0.727 **0.775 **1
Y−0.423 **−0.345 **−0.401 **0.0250.062−0.056−0.085−0.239−0.242−0.1121
** Correlation is significant at the 0.01 level, * correlation is significant at the 0.05. N = 20, Chl a = Chlorophyll a; Chl b = Chlorophyll b; Chl a+b = Chlorophyll a+b; Car = Carotenoids; Vit C = Vitamin C; TFC = total flavonoid contents; ACNs = Anthocyanins; TPC = total polyphenols content; AC = antioxidant capacity (%), Y = Yield.

3.3. Vitamin C Content

The effects of NS, C, and their interaction (NS × C) on vitamin C content showed a significant difference at the 1% level. The highest and lowest content of vitamin C were measured for the Violeto cultivar at 100% NS (4.34 mg g−1 FW) and 25% NS (1.07 mg g−1 FW), respectively (Table 4). Vitamin C content showed a significant positive correlation with flavonoids (r = 0.606**), anthocyanin (r = 0.455**), phenolic compounds (r = 0.468**), antioxidant capacity (r = 0.482**), and APCI index (r = 0.852**) (Table 3).

3.4. Flavonoid Content

Based on the variance analysis results, the effects of NS, C, and their interaction (NS × C) on flavonoid content showed a significant difference at the 1% level. The highest and lowest flavonoid content were measured in the Ablagh genotype at 125% NS (8.49 mg CAE g−1 FW) and the Violeto cultivar at 25% NS (0.99 mg CAE g−1 FW), respectively (Table 4). Flavonoid content had a significant positive correlation with phenolic compounds (r = 0.590**), antioxidant capacity (r = 0.697**), and APCI index (r = 0.851**) (Table 3).

3.5. Anthocyanin Content

The effects of NS, C, and their interaction (NS × C) showed a significant difference in anthocyanin content at the 1% level. The highest and lowest anthocyanin content were observed in the Violeto cultivar at 100% NS (28.77 mg 100 g−1 FW) and the Kapoor cultivar at 125% NS (6.52 mg 100 g−1 FW), respectively (Table 4). Anthocyanin content showed a significant positive correlation with the APCI index (r = 0.426**) (Table 3).

3.6. Total Polyphenols Content

The effects of NS, C, and their interaction (NS × C) showed a significant difference in phenolic compounds at the 1% level. The highest and lowest phenolic compound content were measured in the Ablagh genotype at 125% NS (1444.91 mg GA 100 g−1 FW) and the Violeto cultivar at 75% NS (699.29 mg GA 100 g−1 FW), respectively (Table 4). Phenolic compounds showed a significant positive correlation with antioxidant capacity (r = 0.730**) and APCI index (r = 0.727**) (Table 3).

3.7. Antioxidant Capacity

The effects of NS, C, and their interaction (NS × C) showed a significant difference in antioxidant capacity at the 1% level. The highest and lowest antioxidant capacity were observed in the Kapoor cultivar at 100% NS (93.10% DPPH inhibition) and the Red Rubin cultivar at 75% NS (23.30% DPPH inhibition), respectively (Table 4).

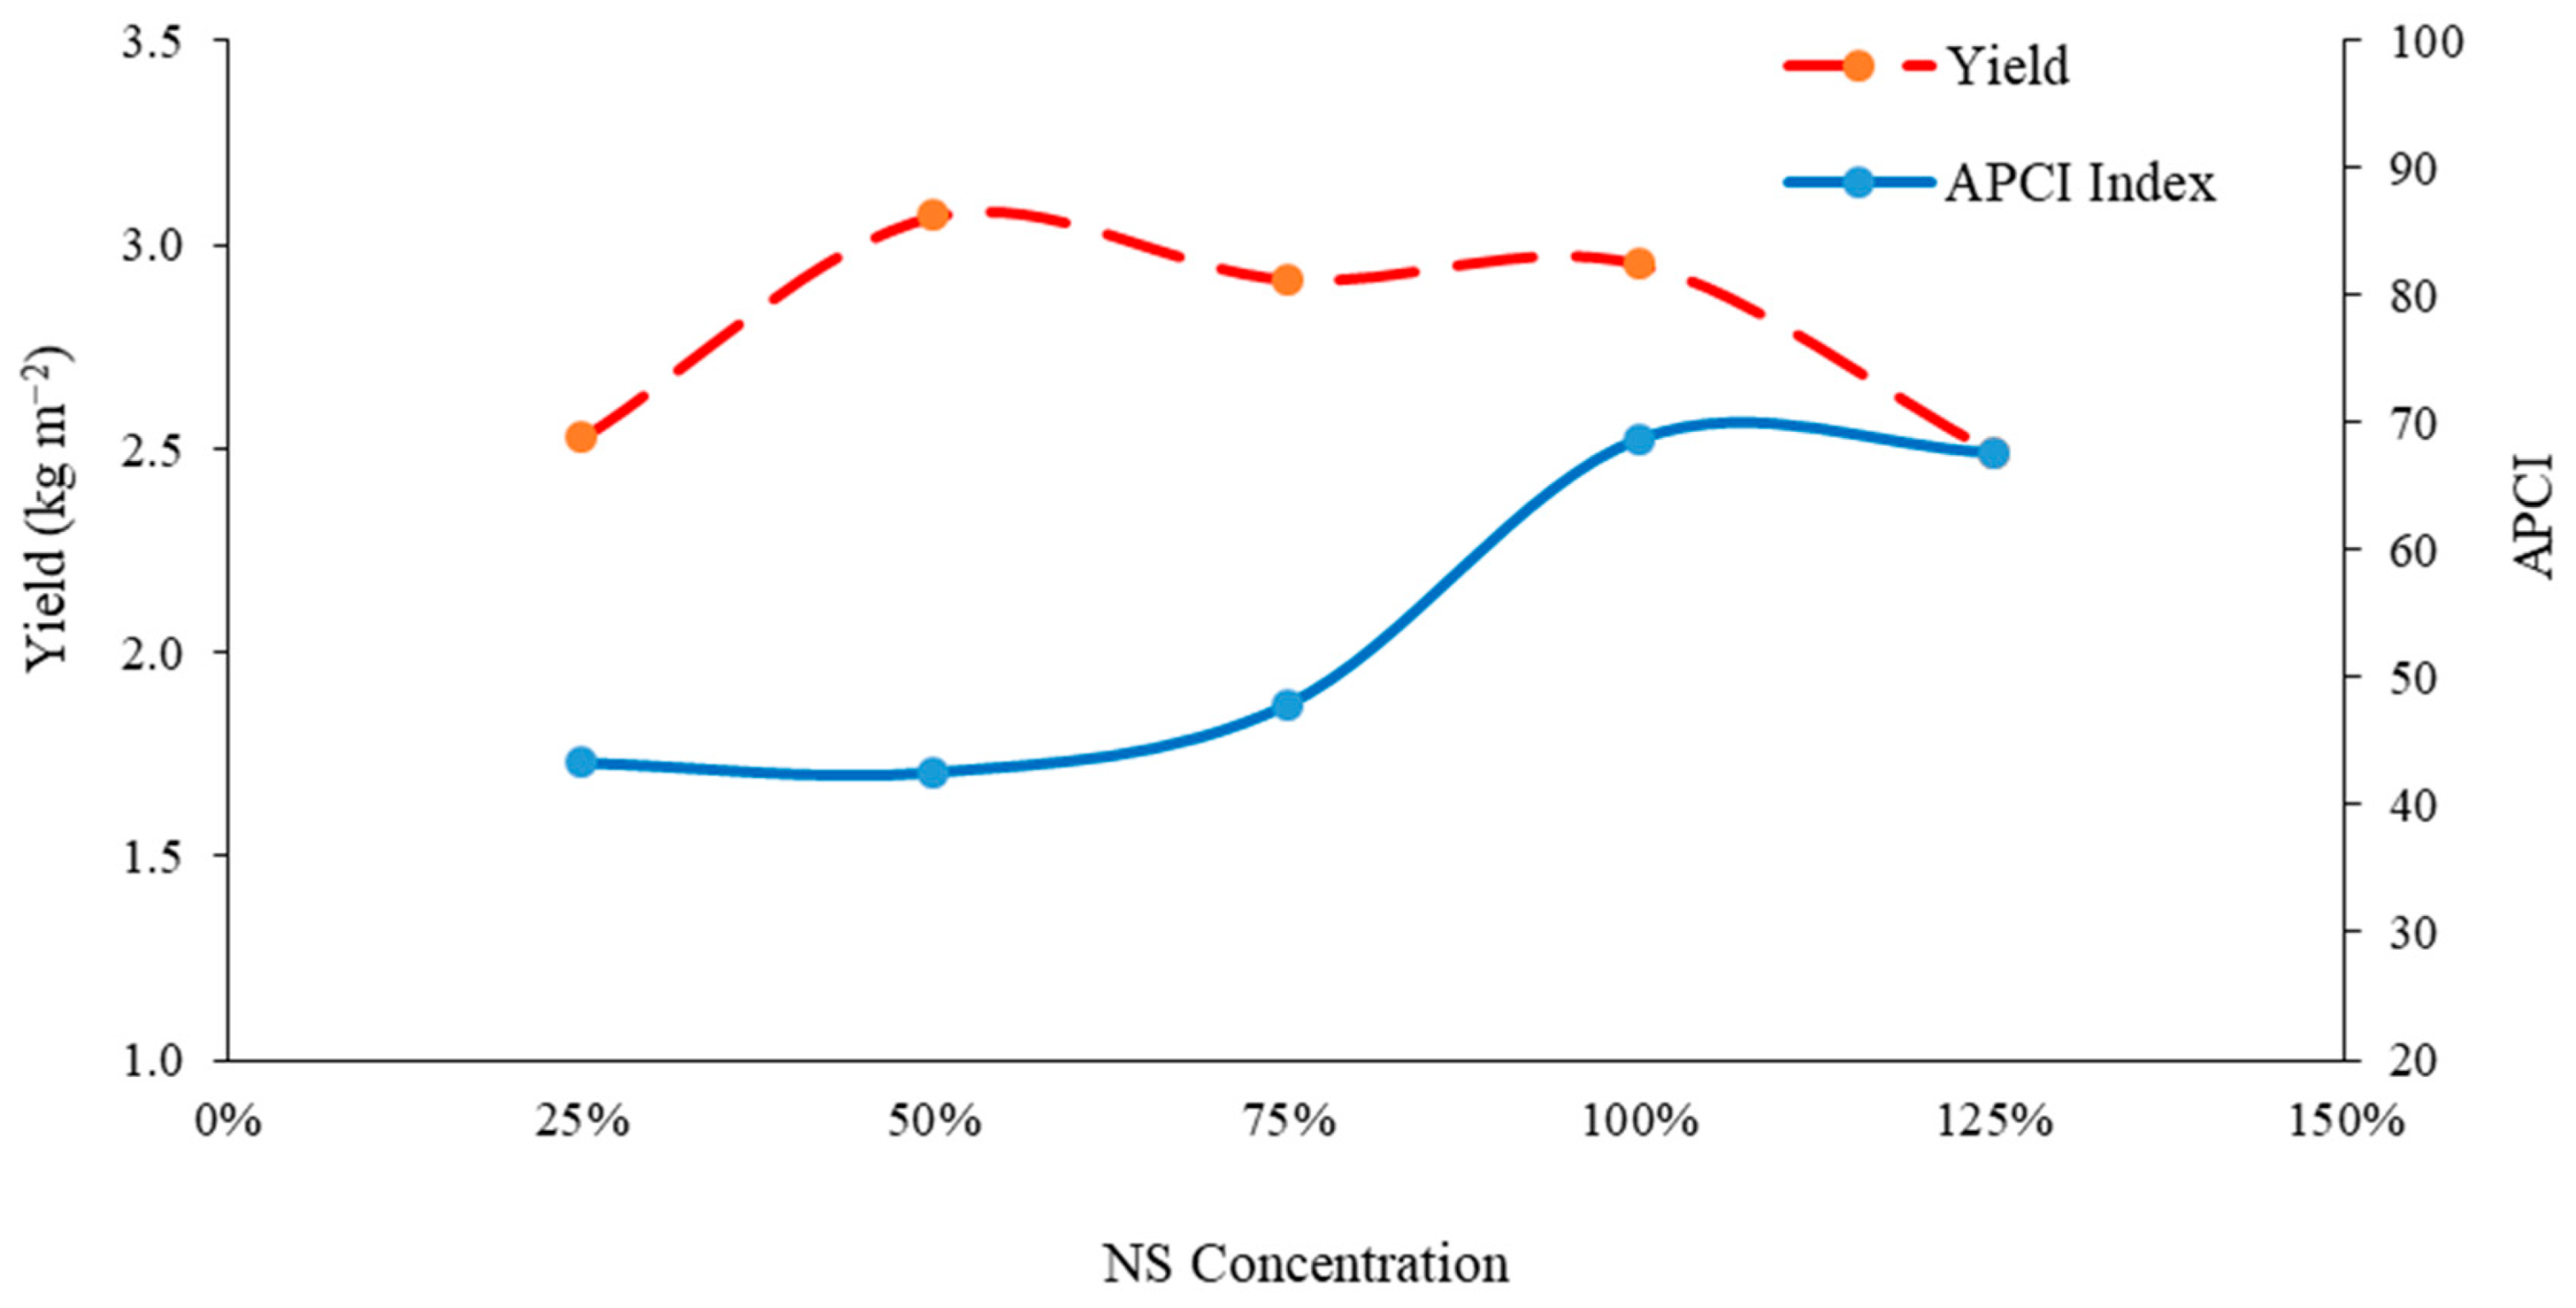
3.8. Antioxidant Potential Composite Index

The effects of NS, C, and their interaction (NS × C) on the APCI index differed significantly at the 1% level. The highest and lowest APCI index was measured for the Ablagh genotype at 125% NS concentration (87.81) and 50% NS concentration (34.74), respectively (Table 4 and Figure 1).

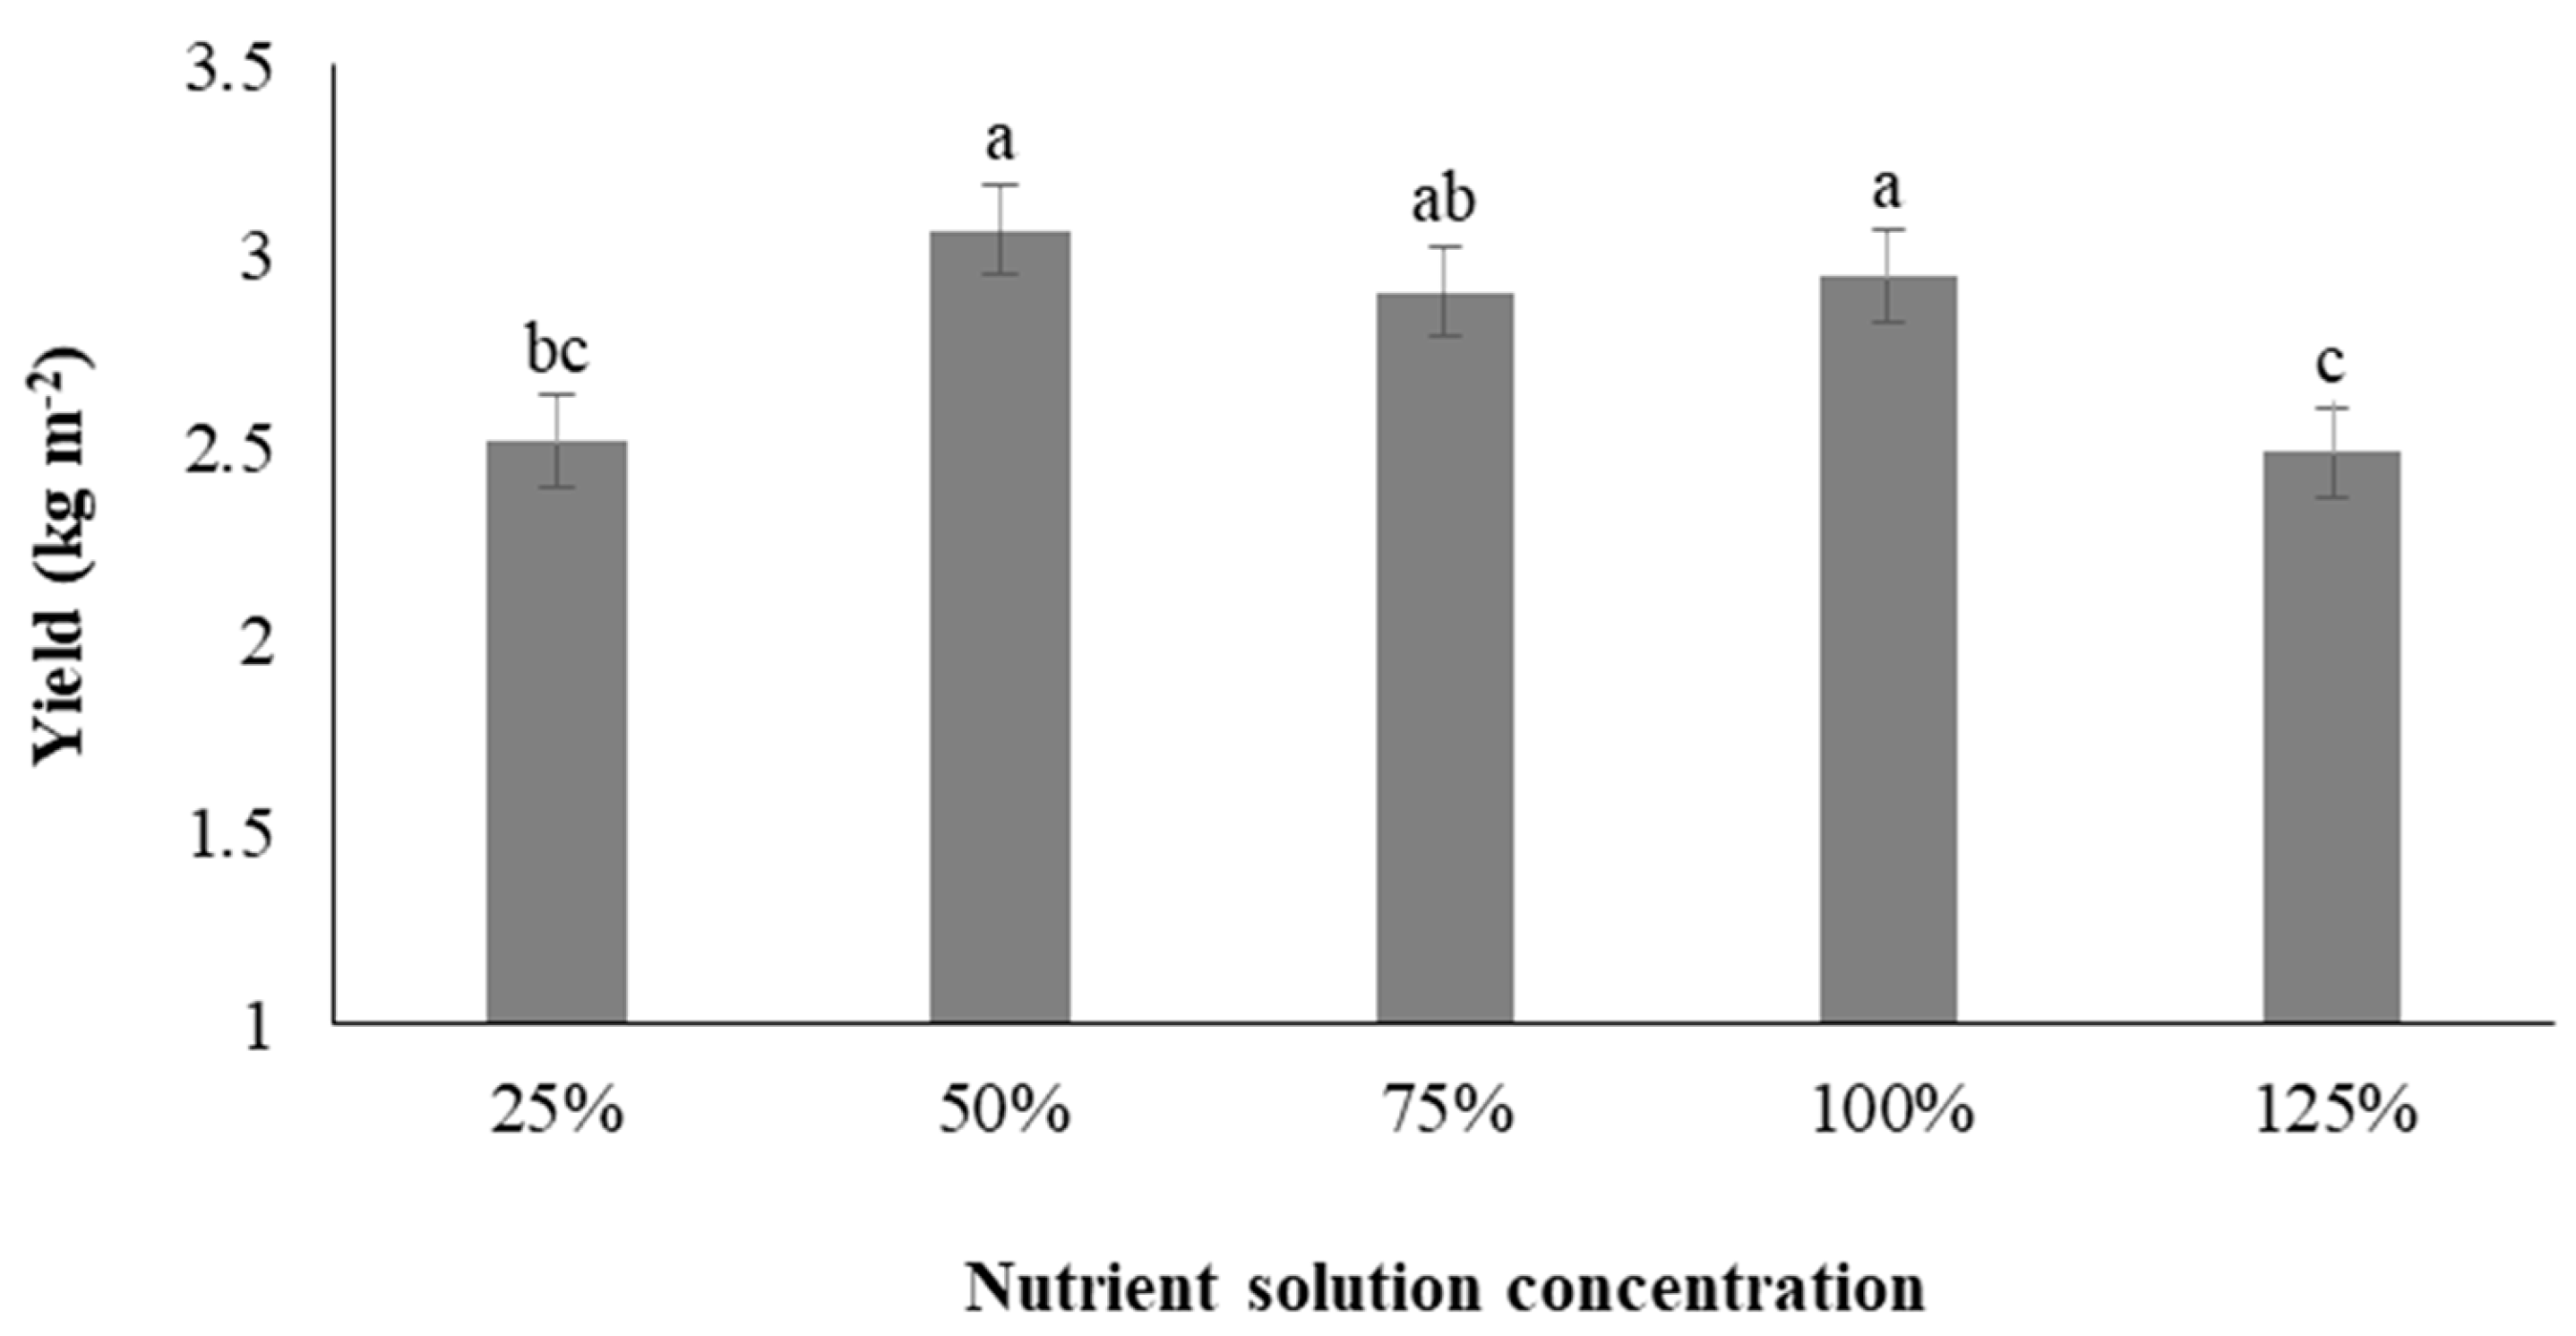
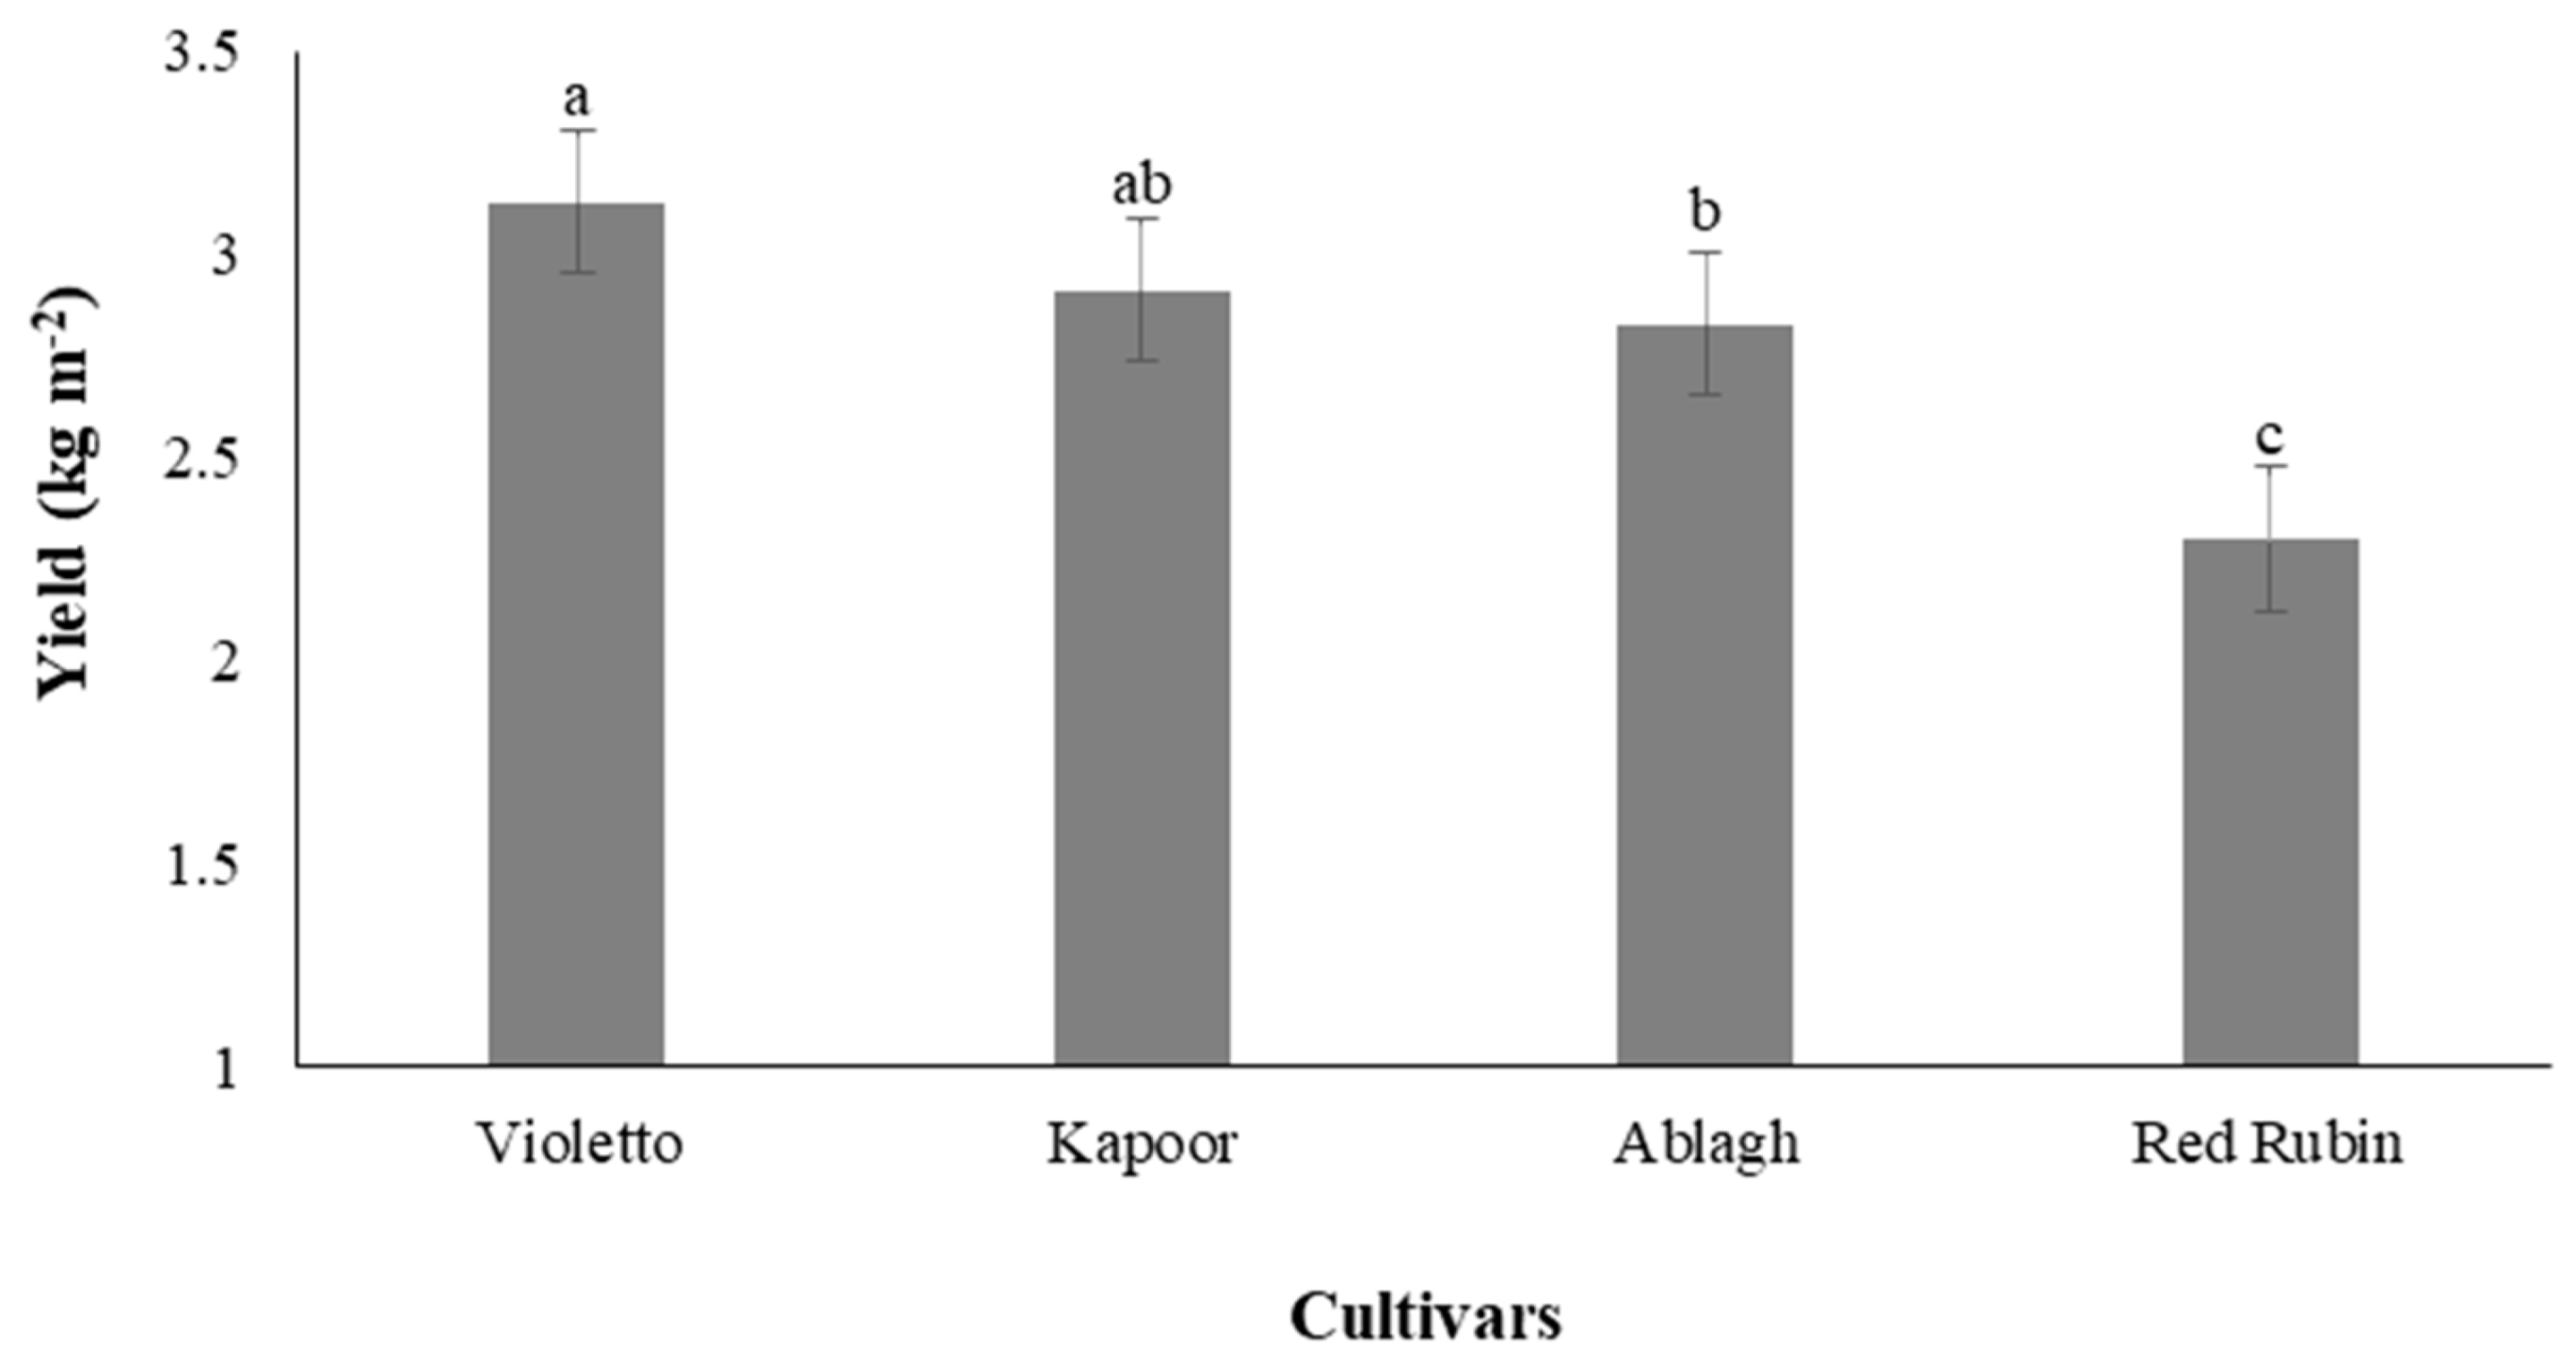
3.9. Yield of Microgreens

The effects of NS and C on the yield of basil microgreens showed a significant difference at the 1% level, but the interaction of NS × C did not significantly affect the yield. The highest and lowest yields were observed at 50% NS (3.07 kg m−2) and 125% NS (2.49 kg m−2), respectively (Figure 2). The Violeto and Red Rubin cultivars yielded the highest (3.12 kg m−2) and lowest (2.29 kg m−2) amounts, respectively (Figure 3).

3.10. Balance of Yield and Antioxidant Accumulation under Different Concentrations of Nutrient Solution

In general, if the primary goal is to produce secondary metabolites with antioxidant properties, a 125% NS, according to the APCI index, can be a good option. However, if the target is a higher yield, a 50% NS would be more suitable. To balance antioxidant content and yield, a 100% NS appears to be the best choice for growing basil microgreens in a floating system (Figure 4).

4. Discussion

The results showed that the concentration of the NS impacts the antioxidant capacity, biochemical compounds, and yield of different microgreen basil cultivars. Different production targets can be achieved by adjusting the NS concentration. Previous studies have indicated that reducing or lacking phosphorus can lower plant energy, leading to a decrease in plant metabolism and photosynthesis [30]. Moreover, nitrogen, a crucial component of many cellular structural and metabolic compounds such as chl, amino acids, and enzymes like ribulose-1, 5-bisphosphate carboxylase-oxygenase, plays an integral role. When nitrogen availability decreases, the plant’s photochemical energy conversion efficiency in the cell drops, reducing protein synthesis, particularly chloroplastic proteins related to photosystem I and II [16].
Given the increased concentration of elements such as nitrogen, phosphorus, magnesium, and iron (water-soluble type), which are structural components involved in the biosynthetic pathway of chl in the leaves, it can be inferred that elevating the concentration of NS could enhance chl synthesis by making these elements more accessible. As the concentration of nitrogen, magnesium, and iron in the NS (key structural components of chl) increased, the amount of chl rose. However, when the concentration of NS increased from 100% to 125%, the chl amount decreased, suggesting that high concentrations of macronutrients might degrade chl pigments, reducing photosynthetic efficiency and the nutritional properties of leafy vegetables [31]. The loss of chl under a high concentration of NS could be attributed to the formation of reactive oxygen species, leading to a decrease in photosynthesis and overall plant performance [32]. Broadly speaking, for growing basil microgreens, the optimal level of NS in this experiment is a 100% concentration of Hoagland’s NS. This concentration can enhance photosynthetic efficiency and, ultimately, yield by providing the elements involved in chl synthesis. The chl content exhibited a negative and significant relationship with the yield of microgreens. This result introduces a new concept of the relationship between plant sink and source. Unlike the final growth stages where mature plants have a positive relationship between chl content and yield [33], there is a negative relationship during the microgreen stage.
This difference could be attributed to the high growth rate of microgreens during the cultivation period, which disrupts the balanced construction of organelles such as chloroplasts and the yield of microgreens. Consequently, carbohydrates, the products of photosynthesis, are redirected towards the production of plant secondary metabolites. Carotenoids, particularly when present in leaves, safeguard the photosynthetic system [34]; hence, there is a correlation between chl and carotenoid content. The biosynthesis and accumulation of carotenoids are primarily regulated by genetic factors [35]. Previous results have shown that principal carotenoids, lutein, and beta-carotene have a positive correlation with potassium since K+ plays a pivotal role in the biosynthesis of carotenoids and affects key enzymes such as pyruvate kinase and phosphofructokinase [11]. Therefore, it is reasonable to expect an increase in carotenoids with the rise in the concentration of the NS and potassium available to the plant. The observed trend of carotenoid response in basil microgreens to changes in NS concentration aligns with the results presented by Kopsell et al. [36] for kale microgreens, where increasing nitrogen rates caused a linear increase in carotenoids [37]. Neugart et al. [38] also confirmed that the availability of nitrogen in NS correlates positively with chl and carotenoid concentrations.
In addition, the increase in carotenoids is beneficial due to their antioxidant properties [39]. Thus, the direct relationship between carotenoids and vitamin C, total phenol, flavonoid, and antioxidant capacity underlines the significant contribution of these pigments to the APCI index. The results indicate that 125% of Hoagland’s NS was the optimal concentration for increasing carotenoids. However, the synthesis of these compounds in the plant is highly species dependent. Increasing the production of vitamin C in plants presents considerable difficulty due to its complex biosynthesis pathways and instability [40,41]. Moreover, alterations in crop quality and growing methods can cause its amount to decrease at delivery or within 24–72 h in mature plants [42]. Thus, the biofortification of vitamin C is critical to ensure a consistent source without compromising other nutrients. El-Nakhel et al. [11] attributed vitamin C accumulation to the activation of L-galactose dehydrogenase, potentially triggered by increasing NS concentration. Kathi et al. [43] previously reported the feasibility of vitamin C biofortification in the early stages of plant growth. Only four studies [44,45,46,47] within the last decade have successfully elevated vitamin C content. This research’s results indicate that adjusting the NS concentration in basil microgreens can enhance vitamin C production. Given the short shelf life of these products, they are often consumed immediately post harvest, making them an excellent fresh source of vitamin C. These results suggest that microgreen producers can employ NS adjustments to boost vitamin C production, a factor that varies significantly depending on different cultivars’ reactions and the influence of diverse production conditions like NS concentrations. Overall, in this experiment, the most effective concentration of the NS for increasing the vitamin C content in microgreen basil was a 100% concentration of Hoagland’s NS, which amplified vitamin C and antioxidant potential.
Flavonoid content increased linearly with the rise in NS concentration. Flavonoid biosynthesis and nitrogen metabolism are linked by the shikimate pathway, which catalyzes the pentose phosphate and glycolysis of carbohydrates to synthesize aromatic amino acids (tyrosine, phenylalanine, and tryptophan) [48]. Lillo et al. [49] showed that the photosynthetic carbon source from the shikimate pathway could be important for flavonoid synthesis, where flavonoids are synthesized from phenylalanine. Thus, flavonoid biosynthesis is regulated by nitrogen availability through the allocation of photosynthetic carbon among different biochemical pathways, reinforcing the correlation between nitrogen and flavonoids [5,50]. Therefore, by elevating the NS concentration up to 125%, flavonoid content increases due to the greater nitrogen availability. This concentration is suggested for producing more flavonoids because of its direct relationship with phenolic compounds and antioxidant capacity in growing basil microgreens.
Anthocyanins, highly water-soluble plant pigments, accumulate in cell vacuoles in varying concentrations and compositions based on genetic and environmental factors. Consequently, their production does not follow a uniform pattern [51]. Our study found no clear pattern in anthocyanin synthesis under different NS concentrations, aligning with the report of Martínez-Ispizua et al. [52]. However, Toscano et al. [53] noted that defensive flavonoids (e.g., anthocyanins) are costly for plants and can inhibit growth. This was observed in the Red Rubin cultivar in our experiment, where heightened anthocyanins led to reduced yield compared to other cultivars. Generally, the Violeto cultivar, which turns purple when fed a 100% NS concentration, had higher anthocyanin content than other cultivars. This treatment also showed greater antioxidant capacity based on its anthocyanin-APCI index correlation.
Phenols are primary components of the antioxidant potential of basil microgreens. These compounds act as scavengers of reactive oxygen species, protecting young growing leaves from photodamage [54]. Toscano et al. [53] reported that broccoli under nitrogen stress conditions showed an elevated phenolic compound content. During nutrient deficiency or excess availability, plant secondary metabolite production can increase, allowing fixed carbon to convert into secondary metabolites [55]. Keutgen et al. [14] found that total phenolic compound content decreases with increasing Hoagland’s NS concentration from 25% to 100%, corroborating our experiment’s results. In addition, the varying total phenolic content might be explained by the physiological status of different basil cultivars, as nutrient deficiency can slow growth processes. Growth inhibition can cause available carbon to shift towards nitrogen-free compounds, like carbohydrates or phenolic compounds, resulting in species- and cultivar-dependent changes in total phenolic content [14,56]. Past research [57,58] has shown that low nitrogen levels stimulate phenylpropanoid metabolism, leading to the accumulation of phenylalanine ammonia-lyase and other vital enzymes involved in phenolic compound biosynthesis, consistent with our experiment’s findings. This suggests that lower nitrogen levels, by reducing growth requirements, can enhance the accumulation of specialized metabolites [12]. Our results showed that basil microgreens at low and high NS concentrations (25% and 125%) can boost antioxidant activity and polyphenols, the primary biochemical class of plant antioxidants, aligning with Corrado et al. [59] findings. Our experiment indicates that NSs at 25% similar 125% concentrations can match high concentration outcomes regarding phenolic compound production by reducing production cost, chemical fertilizer consumption, and enhancing product health, making them considerable options for basil microgreen production.
Previous research [60,61] investigating the effect of EC on antioxidant activity reported that basil cultivars react differently due to genetic influences on their responses to varying concentrations of NS. The accumulation of secondary metabolites, including total polyphenol—the plant’s most important antioxidant compound—was significantly impacted by different EC levels. A significant correlation was observed between basil cultivars and EC for phenolic acids [62]. Interestingly, the concentration of antioxidants and the plant’s performance may exhibit inverse trends under the same environmental conditions, especially under mild NS stress [8,63]. Nutrient deficiency significantly enhanced the content of phenolic compounds and the antioxidant capacity of basil [64]. Therefore, the optimal EC levels in the NS often vary depending on the desired crop production goals, such as prioritizing high yield or high antioxidant content. Our study, aimed at balancing antioxidant activity and yield, corroborated previous research, suggesting that the antioxidant capacity of basil microgreens negatively correlates with performance. However, we recommend a 100% NS concentration as the most conducive for boosting yield and secondary metabolite production with antioxidant properties. In our research, high NS concentration significantly influenced the growth of the basil plant. Munns et al. [65] demonstrated that high levels of NS inhibit plant growth in two ways: by reducing the plant’s ability to absorb water due to reverse osmosis—leading to slower growth—and by allowing excessive amounts of certain salts to enter the transpiration stream, potentially damaging the cells of the transpiring leaves and reducing photosynthesis and growth. The altered growth patterns observed in our study may be due to physiological water deficits arising from increased osmotic pressure at high NS concentrations [65]. High levels of NS could negatively impact plant growth and water content due to metabolic issues within plant cells. High osmotic pressure induced by high salinity limits plant cells’ absorption of water and soluble mineral nutrients in the culture. Brauer et al. [66] posited that growth inhibition under osmotic conditions might be primarily due to decreased cytoplasmic volume and loss of cell turgor as intracellular water is osmotically extracted. Furthermore, it was reported that fresh and dried weights of basil leaves decreased significantly when the EC level increased from 1.2 to 0.5 dS m−1 [67]. However, the optimal EC level to maximize beet growth and yield depends on cultivar and environmental conditions [61,62]. Nutritional stress, due to insufficient or excessive intake of essential nutrients, can inhibit plant growth and development and may enhance antioxidant accumulation [68]. Balancing yield and antioxidant accumulation in vegetables is crucial yet challenging. In our study, we aimed to identify the optimal NS by striking a balance between performance and antioxidant capacity. Consequently, our results suggest that a 100% NS could be a viable option for cultivating basil microgreens in a floating system.

5. Conclusions

Given the high concentration of beneficial phytochemicals in basil and its frequent consumption, basil microgreens serve as an intriguing source of these secondary metabolites. Our study’s results indicate that the biochemical and antioxidant content of basil microgreens relies on the cultivar/genotype and the nutrient solution concentration. We observed a relationship between nutrient solution concentration, chlorophyll content, yield, and secondary metabolites with antioxidant properties. This relationship demonstrates that when the growth rate of the microgreens is slower, the antioxidant potential increases, and vice versa. Interestingly, these changes can be modulated by managing the concentration of the nutrient solution. By striking a balance between the yield and antioxidant potential of basil microgreens, we determined that a 100% concentration of Hoagland’s nutrient solution is advisable. This concentration promotes the production of secondary metabolites, such as total chlorophyll, vitamin C, anthocyanin, and antioxidant capacity, without negatively impacting the yield. Our research offers a new and relatively straightforward method for balancing yield and antioxidant accumulation in the cultivation of basil microgreens in a floating system.

Author Contributions

Conceptualization, M.R.F., N.A.A. and M.H.; methodology, M.R.F., N.A.A. and M.M.S.; formal analysis, M.R.F. and M.H.; investigation, M.R.F., N.A.A. and M.M.S.; writing—original draft preparation, M.R.F., N.A.A., M.M.S. and M.H.; writing—review and editing, M.H.; visualization, M.R.F., N.A.A. and M.H.; supervision, N.A.A.; project administration, N.A.A. All authors have read and agreed to the published version of the manuscript.

Funding

This study was funded by “Shahid Chamran University of Ahvaz”.

Institutional Review Board Statement

Not applicable.

Data Availability Statement

Data will be made available on request.

Acknowledgments

We are thankful to the Research Council of Shahid Chamran University of Ahvaz for financial support (GN: SCU.AH401.735).

Conflicts of Interest

The authors declare no conflict of interest.

References

  1. Teklić, T.; Parađiković, N.; Špoljarević, M.; Zeljković, S.; Lončarić, Z.; Lisjak, M. Linking abiotic stress, plant metabolites, biostimulants and functional food. Ann. Appl. Biol. 2021, 178, 169–191. [Google Scholar] [CrossRef]
  2. Verma, N.; Shukla, S. Impact of various factors responsible for fluctuation in plant secondary metabolites. J. Appl. Res. Med. Aromat. Plants 2015, 2, 105–113. [Google Scholar] [CrossRef]
  3. Mir, S.A.; Shah, M.A.; Mir, M.M. Microgreens: Production, shelf life, and bioactive components. Crit. Rev. Food Sci. Nutr. 2017, 57, 2730–2736. [Google Scholar] [CrossRef] [PubMed]
  4. Martin, C.; Li, J. Medicine is not health care, food is health care: Plant metabolic engineering, diet and human health. New Phytol. 2017, 216, 699–719. [Google Scholar] [CrossRef]
  5. Fayezizadeh, M.R.; Ansari, N.A.; Sourestani, M.M.; Hasanuzzaman, M. Biochemical Compounds, Antioxidant Capacity, Leaf Color Profile and Yield of Basil (Ocimum sp.) Microgreens in Floating System. Plants 2023, 12, 2652. [Google Scholar] [CrossRef]
  6. Larsen, D.H.; Li, H.; Shrestha, S.; Verdonk, J.C.; Nicole, C.; Marcelis, L.F.; Woltering, E.J. Lack of blue light regulation of antioxidants and chilling tolerance in Basil. Front. Plant Sci. 2022, 13, 852654. [Google Scholar] [CrossRef]
  7. Shomali, A.; Das, S.; Arif, N.; Sarraf, M.; Zahra, N.; Yadav, V.; Aliniaeifard, S.; Chauhan, D.K.; Hasanuzzaman, M. Diverse Physiological Roles of Flavonoids in Plant Environmental Stress Responses and Tolerance. Plants 2022, 11, 3158. [Google Scholar] [CrossRef]
  8. Lu, N.; Bernardo, E.L.; Tippayadarapanich, C.; Takagaki, M.; Kagawa, N.; Yamori, W. Growth and accumulation of secondary metabolites in perilla as affected by photosynthetic photon flux density and electrical conductivity of the nutrient solution. Front. Plant Sci. 2017, 8, 708. [Google Scholar] [CrossRef]
  9. Tan, L.; Nuffer, H.; Feng, J.; Kwan, S.H.; Chen, H.; Tong, X.; Kong, L. Antioxidant properties and sensory evaluation of microgreens from commercial and local farms. Food Sci. Human Wellness 2020, 9, 45–51. [Google Scholar] [CrossRef]
  10. Kyriacou, M.C.; De Pascale, S.; Kyratzis, A.; Rouphael, Y. Microgreens as a Component of Space Life Support Systems: A Cornucopia of Functional Food. Front. Plant Sci. 2017, 8, 1587. [Google Scholar] [CrossRef]
  11. El-Nakhel, C.; Pannico, A.; Kyriacou, M.C.; Giordano, M.; De Pascale, S.; Rouphael, Y. Macronutrient deprivation eustress elicits differential secondary metabolites in red and green-pigmented butterhead lettuce grown in a closed soilless system. J. Sci. Food Agric. 2019, 99, 6962–6972. [Google Scholar] [CrossRef] [PubMed]
  12. Prinsi, B.; Negrini, N.; Morgutti, S.; Espen, L. Nitrogen Starvation and Nitrate or Ammonium Availability Differently Affect Phenolic Composition in Green and Purple Basil. Agronomy 2020, 10, 498. [Google Scholar] [CrossRef]
  13. Aktsoglou, D.-C.; Kasampalis, D.S.; Sarrou, E.; Tsouvaltzis, P.; Chatzopoulou, P.; Martens, S.; Siomos, A.S. Protein Hydrolysates Supplement in the Nutrient Solution of Soilless Grown Fresh Peppermint and Spearmint as a Tool for Improving Product Quality. Agronomy 2021, 11, 317. [Google Scholar] [CrossRef]
  14. Keutgen, N.; Hausknecht, M.; Tomaszewska-Sowa, M.; Keutgen, A.J. Nutritional and Sensory Quality of Two Types of Cress Microgreens Depending on the Mineral Nutrition. Agronomy 2021, 11, 1110. [Google Scholar] [CrossRef]
  15. Wieth, A.R.; Pinheiro, W.D.; Duarte, T.S. Purple cabbage microgreens grown in different substrates and nutritive solution concentrations. Rev. Caatinga 2019, 32, 976–985. [Google Scholar] [CrossRef]
  16. El-Nakhel, C.; Pannico, A.; Graziani, G.; Kyriacou, M.C.; Gaspari, A.; Ritieni, A.; De Pascale, S.; Rouphael, Y. Nutrient Supplementation Configures the Bioactive Profile and Production Characteristics of Three Brassica L. Microgreens Species Grown in Peat-Based Media. Agronomy 2021, 11, 346. [Google Scholar] [CrossRef]
  17. Öztekin, G.B.; Uludağ, T.; Tüzel, Y. Growing spinach (Spinacia oleracea L.) in a floating system with different concentrations of nutrient solution. Appl. Ecol. Environ. Res. 2018, 16, 3333–3350. [Google Scholar] [CrossRef]
  18. Leibar-Porcel, E.; McAinsh, M.R.; Dodd, I.C. Elevated Root-Zone Dissolved Inorganic Carbon Alters Plant Nutrition of Lettuce and Pepper Grown Hydroponically and Aeroponically. Agronomy 2020, 10, 403. [Google Scholar] [CrossRef]
  19. Sakamoto, M.; Suzuki, T. Effect of Nutrient Solution Concentration on the Growth of Hydroponic Sweetpotato. Agronomy 2020, 10, 1708. [Google Scholar] [CrossRef]
  20. Yang, T.; Kim, H.-J. Characterizing Nutrient Composition and Concentration in Tomato-, Basil-, and Lettuce-Based Aquaponic and Hydroponic Systems. Water 2020, 12, 1259. [Google Scholar] [CrossRef]
  21. Petropoulos, S.A.; Chatzieustratiou, E.; Constantopoulou, E.; Kapotis, G. Yield and quality of lettuce and rocket grown in floating culture system. Not. Bot. Horti Agrobot. Cluj-Napoca 2016, 44, 603–612. [Google Scholar] [CrossRef]
  22. Spehia, R.S.; Devi, M.; Singh, J.; Sharma, S.; Negi, A.; Singh, S.; Sharma, J.C. Lettuce growth and yield in hoagland solution with an organic concoction. Int. J. Veg. Sci. 2018, 24, 557–566. [Google Scholar] [CrossRef]
  23. Arnon, A. Method of extraction of chlorophyll in the plants. Agron. J. 1967, 23, 112–121. [Google Scholar]
  24. Ochoa-Velasco, C.E.; Valadez-Blanco, R.; Salas-Coronado, R.; Sustaita-Rivera, F.; Hernández-Carlos, B.; García-Ortega, S.; Santos-Sánchez, N.F. Effect of nitrogen fertilization and Bacillus licheniformis biofertilizer addition on the antioxidants compounds and antioxidant activity of greenhouse cultivated tomato fruits (Solanum lycopersicum L. var. Sheva). Sci. Hortic. 2016, 201, 338–345. [Google Scholar] [CrossRef]
  25. Sharma, O.P.; Bhat, T.K. DPPH antioxidant assay revisited. Food Chem. 2009, 113, 1202–1205. [Google Scholar] [CrossRef]
  26. Benzie, I.F.F.; Strain, J.J. The ferric reducing ability of plasma (FRAP) as a measure of “Antioxidant power”: The FRAP assay. Anal. Biochem. 1996, 239, 70–76. [Google Scholar] [CrossRef]
  27. Dou, H.; Niu, G.; Gu, M.; Masabni, J.G. Responses of Sweet Basil to Different Daily Light Integrals in Photosynthesis, Morphology, Yield, and Nutritional Quality. Hortic. Sci. 2018, 53, 496–503. [Google Scholar] [CrossRef]
  28. Lee, J.; Durst, R.W.; Wrolstad, R.E.; Eisele, T.; Giusti, M.M.; Hach, J.; Hofsommer, H.; Koswig, S.; Krueger, D.A.; Kupina, S.; et al. Determination of total monomeric anthocyanin pigment content of fruit juices, beverages, natural colorants, and wines by the pH differential method: Collaborative study. J. AOAC Int. 2005, 88, 1269–1278. [Google Scholar] [CrossRef]
  29. Ghoora, M.D.; Babu, D.R.; Srividya, N. Nutrient composition, oxalate content and nutritional ranking of ten culinary microgreens. J. Food Compos. Anal. 2020, 91, 103495. [Google Scholar] [CrossRef]
  30. Islam, M.Z.; Lee, Y.-T.; Mele, M.A.; Choi, I.-L.; Kang, H.-M. The Effect of Phosphorus and Root Zone Temperature on Anthocyanin of Red Romaine Lettuce. Agronomy 2019, 9, 47. [Google Scholar] [CrossRef]
  31. Alberici, A.; Quattrini, E.; Penati, M.; Martinetti, L.; Marino Gallina, P.; Ferrante, A. Effect of the reduction of nutrient solution concentration on leafy vegetables quality grown in floating system. Acta Hortic. 2008, 801, 1167–1176. [Google Scholar] [CrossRef]
  32. Pompelli, M.F.; Arrieta, D.V.; Rodríguez, Y.Y.P.; Ramírez, A.M.J.; Bettin, A.M.V.; Avilez, M.A.Q.; Cárcamo, J.A.A.; Garcia-Castaño, S.G.; González, L.M.M.; Cordero, E.D.F.; et al. Can Chlorophyll a Fluorescence and Photobleaching Be a Stress Signal under Abiotic Stress in Vigna unguiculata L.? Sustainability 2022, 14, 15503. [Google Scholar] [CrossRef]
  33. Purwanto, S.; Salsabila, J. Growth response and yield of saline tolerant rice varieties to bio-fertilizer application at central Java north coastal saline paddy field. IOP Conf. Ser. Earth Environ. 2019, 406, 012001. [Google Scholar] [CrossRef]
  34. Tammam, A.; El-Aggan, W.; Helaly, A.; Badr, G.; El-Dakak, R. Proteomics and photosynthetic apparatus response to vermicompost attenuation of salinity stress Vicia faba leaves. Acta Physiol. Plant 2023, 45, 17. [Google Scholar] [CrossRef]
  35. Di Gioia, F.; Tzortzakis, N.; Rouphael, Y.; Kyriacou, M.C.; Sampaio, S.L.; Ferreira, I.C.F.R.; Ferreira, I.; Petropoulos, S.A. Grown to Be Blue—Antioxidant Properties and Health Effects of Colored Vegetables. Part II: Leafy, Fruit, and Other Vegetables. Antioxidants 2020, 9, 97. [Google Scholar] [CrossRef]
  36. Kopsell, D.A.; Kopsell, D.E.; Curran-Celentano, J. Carotenoid pigments in kale are influenced by nitrogen concentration and form. J. Sci. Food Agric. 2007, 87, 900–907. [Google Scholar] [CrossRef]
  37. Dhami, N.; Cazzonelli, C.I. Environmental impacts on carotenoid metabolism in leaves. Plant Growth Regul. 2020, 92, 455–477. [Google Scholar] [CrossRef]
  38. Neugart, S.; Baldermann, S.; Hanschen, F.S.; Klopsch, R.; Wiesner-Reinhold, M.; Schreiner, M. The intrinsic quality of brassicaceous vegetables: How secondary plant metabolites are affected by genetic, environmental, and agronomic factors. Sci. Hortic. 2018, 233, 460–478. [Google Scholar] [CrossRef]
  39. Mampholo, B.M.; Maboko, M.M.; Soundy, P.; Sivakumar, D. Phytochemicals and overall quality of leafy lettuce (Lactuca sativa L.) varieties grown in closed hydroponic system. J. Food Qual. 2016, 39, 805–815. [Google Scholar] [CrossRef]
  40. Raiola, A.; Tenore, G.C.; Barone, A.; Frusciante, L.; Rigano, M.M. Vitamin E Content and Composition in Tomato Fruits: Beneficial Roles and Bio-Fortification. Int. J. Mol. Sci. 2015, 16, 29250–29264. [Google Scholar] [CrossRef]
  41. Paciolla, C.; Fortunato, S.; Dipierro, N.; Paradiso, A.; De Leonardis, S.; Mastropasqua, L.; de Pinto, M.C. Vitamin C in Plants: From Functions to Biofortification. Antioxidants 2019, 8, 519. [Google Scholar] [CrossRef] [PubMed]
  42. Gibson, A.R.; O’Leary, B.R.; Du, J.; Sarsour, E.H.; Kalen, A.L.; Wagner, B.A.; Stolwijk, J.M.; Falls-Hubert, K.C.; Alexander, M.S.; Carroll, R.S.; et al. Dual Oxidase-Induced Sustained Generation of Hydrogen Peroxide Contributes to Pharmacologic Ascorbate-Induced Cytotoxicity. Cancer Res. 2020, 80, 1401–1413. [Google Scholar] [CrossRef] [PubMed]
  43. 43. Kathi, S.; Laza, H.; Singh, S.; Thompson, L.; Li, W.; Simpson, C. Vitamin C biofortification of broccoli microgreens and resulting effects on nutrient composition. Front. Plant Sci. 2023, 14, 1145992. [Google Scholar] [CrossRef]
  44. De Souza, J.Z.; De Mello Prado, R.; Silva, S.L.; Farias, T.P.; Neto, J.G.; Souza Junior, J.P. Silicon Leaf Fertilization Promotes Biofortification and Increases Dry Matter, Ascorbate Content, and Decreases Post-Harvest Leaf Water Loss of Chard and Kale. Commun. Soil Sci. Plant Anal. 2019, 50, 164–172. [Google Scholar] [CrossRef]
  45. Garcia Neto, J.; Prado, R.M.; de Souza Júnior, J.P.; Silva, S.L.O.; Farias, T.P. Silicon leaf spraying increases biofortification production, ascorbate content and decreases water loss post-harvest from land cress and chicory leaves. J. Plant Nutr. 2022, 45, 1283–1290. [Google Scholar] [CrossRef]
  46. Dos Santos, M.M.M.; da Silva, G.P.; de Mello Prado, R.; Pinsetta Junior, J.S.; Mattiuz, B.H.; Braun, H. Biofortification of Tomato with Stabilized Alkaline Silicate and Silicic Acid, Nanosilica, and Potassium Silicate via Leaf Increased Ascorbic Acid Content and Fruit Firmness. J. Plant Nutr. 2021, 45, 896–903. [Google Scholar] [CrossRef]
  47. Kathi, S.; Laza, H.; Singh, S.; Thompson, L.; Li, W.; Simpson, C. Increasing vitamin C through agronomic biofortification of arugula microgreens. Sci. Rep. 2022, 12, 13093. [Google Scholar] [CrossRef]
  48. Sun, J.C.; Li, X.J.; Qu, Z.; Wang, H.R.; Cheng, Y.; Dong, S.J.; Zhao, H. Comparative proteomic analysis reveals novel insights into the continuous cropping induced response in Scrophularia ningpoensis. J. Sci. Food Agric. 2023, 103, 1832–1845. [Google Scholar] [CrossRef]
  49. Lillo, C.; Lea, U.S.; Ruoff, P. Nutrient depletion as a key factor for manipulating gene expression and product formation in different branches of the flavonoid pathway. Plant Cell Environ. 2008, 31, 587–601. [Google Scholar] [CrossRef]
  50. Taiz, L.; Zeiger, E. Photosynthesis: Physiological and ecological considerations. Plant Physiol. 2002, 9, 172–174. [Google Scholar]
  51. Oancea, S.; Oprean, L. Anthocyanins, from biosynthesis in plants to human health benefits. Acta Univ. Cinbinesis Ser. E Food Technol. 2011, 15, 3–16. [Google Scholar]
  52. Martínez-Ispizua, E.; Calatayud, Á.; Marsal, J.I.; Cannata, C.; Basile, F.; Abdelkhalik, A.; Soler, S.; Valcárcel, J.V.; Martínez-Cuenca, M.-R. The Nutritional Quality Potential of Microgreens, Baby Leaves, and Adult Lettuce: An Underexploited Nutraceutical Source. Foods 2022, 11, 423. [Google Scholar] [CrossRef] [PubMed]
  53. Toscano, S.; Trivellini, A.; Cocetta, G.; Bulgari, R.; Francini, A.; Romano, D.; Ferrante, A. Effect of preharvest abiotic stresses on the accumulation of bioactive compounds in horticultural produce. Front. Plant. Sci. 2019, 10, 1212. [Google Scholar] [CrossRef] [PubMed]
  54. El-Nakhel, C.; Pannico, A.; Graziani, G.; Kyriacou, M.C.; Giordano, M.; Ritieni, A.; De Pascale, S.; Rouphael, Y. Variation in Macronutrient Content, Phytochemical Constitution and In Vitro Antioxidant Capacity of Green and Red Butterhead Lettuce Dictated by Different Developmental Stages of Harvest Maturity. Antioxidants 2020, 9, 300. [Google Scholar] [CrossRef]
  55. Žnidarčič, D.; Ban, D.; Šircelj, H. Carotenoid and chlorophyll composition of commonly consumed leafy vegetables in Mediterranean countries. Food Chem. 2011, 129, 1164–1168. [Google Scholar] [CrossRef] [PubMed]
  56. Scagel, C.F.; Lee, J.; Mitchell, J.N. Salinity from NaCl changes the nutrient and polyphenolic composition of basil leaves. Ind. Crops Prod. 2019, 127, 119–128. [Google Scholar] [CrossRef]
  57. Wada, K.C.; Mizuuchi, K.; Koshio, A.; Kaneko, K.; Mitsui, T.; Takeno, K. Stress Enhances the Gene Expression and Enzyme Activity of Phenylalanine Ammonia-Lyase and the Endogenous Content of Salicylic Acid to Induce Flowering in Pharbitis. J. Plant Physiol. 2014, 171, 895–902. [Google Scholar] [CrossRef]
  58. Mahajan, M.; Kuiry, R.; Pal, P.K. Understanding the consequence of environmental stress for accumulation of secondary metabolites in medicinal and aromatic plants. J. Appl. Res. Med. Aromat. Plants 2020, 18, 100255. [Google Scholar] [CrossRef]
  59. Corrado, G.; Vitaglione, P.; Chiaiese, P.; Rouphael, Y. Unraveling the Modulation of Controlled Salinity Stress on Morphometric Traits, Mineral Profile, and Bioactive Metabolome Equilibrium in Hydroponic Basil. Horticulturae 2021, 7, 273. [Google Scholar] [CrossRef]
  60. Maggio, A.; De Pascale, S.; Barbieri, G.; Raimondi, G.; Orsini, F. Yield and quality of hydroponically grown sweet basil cultivars. Acta Hort. 2006, 723, 357–360. [Google Scholar] [CrossRef]
  61. Ren, X.; Lu, N.; Xu, W.; Zhuang, Y.; Takagaki, M. Optimization of the Yield, Total Phenolic Content, and Antioxidant Capacity of Basil by Controlling the Electrical Conductivity of the Nutrient Solution. Horticulturae 2022, 8, 216. [Google Scholar] [CrossRef]
  62. Ciriello, M.; Pannico, A.; El-Nakhel, C.; Formisano, L.; Cristofano, F.; Duri, L.G.; Pizzolongo, F.; Romano, R.; De Pascale, S.; Colla, G.; et al. Sweet Basil Functional Quality as Shaped by Genotype and Macronutrient Concentration Reciprocal Action. Plants 2020, 9, 1786. [Google Scholar] [CrossRef] [PubMed]
  63. Al-Huqail, A.; El-Dakak, R.M.; Sanad, M.N.; Badr, R.H.; Ibrahim, M.M.; Soliman, D.; Khan, F. Effects of climate temperature and water stress on plant growth and accumulation of antioxidant compounds in sweet basil (Ocimum basilicum L.) leafy vegetable. Scientifica 2020, 2020, 3808909. [Google Scholar] [CrossRef]
  64. Jakovljević, D.; Topuzović, M.; Stanković, M. Nutrient Limitation as a Tool for the Induction of Secondary Metabolites with Antioxidant Activity in Basil Cultivars. Ind. Crops Prod. 2019, 138, 111462. [Google Scholar] [CrossRef]
  65. Munns, R.; James, R.A.; Läuchli, A. Approaches to increasing the salt tolerance of wheat and other cereals. J. Exp. Bot. 2006, 57, 1025–1043. [Google Scholar] [CrossRef]
  66. Brauer, A.M.; Shi, H.; Levin, P.A.; Huang, K.C. Physiological and regulatory convergence between osmotic and nutrient stress responses in microbes. Curr. Opin. Cell Biol. 2023, 81, 102170. [Google Scholar] [CrossRef]
  67. Hosseini, H.; Mozafari, V.; Roosta, H.R.; Shirani, H.; van de Vlasakker, P.C.H.; Farhangi, M. Nutrient Use in Vertical Farming: Optimal Electrical Conductivity of Nutrient Solution for Growth of Lettuce and Basil in Hydroponic Cultivation. Horticulturae 2021, 7, 283. [Google Scholar] [CrossRef]
  68. Zeng, H.; Wang, G.; Hu, X.; Wang, H.; Du, L.; Zhu, Y. Role of microRNAs in plant responses to nutrient stress. Plant Soil 2014, 374, 1005–1021. [Google Scholar] [CrossRef]
Figure 1. APCI index profiles of the basil microgreens in different concentrations of Hoagland’s nutrient solution.
Agriculture 13 01691 g001
Figure 2. Effect of the different concentrations of Hoagland’s NS on yield. Different letters within each column indicate significant differences according to Duncan’s multiple range test (p = 0.05).
Agriculture 13 01691 g002
Figure 3. Yield of the basil microgreen cultivars. Different letters within each column indicate significant differences according to Duncan’s multiple range test (p = 0.05).
Agriculture 13 01691 g003
Figure 4. Changes in yield and antioxidant index of four basil microgreens under five different NS concentrations.
Agriculture 13 01691 g004
Table 1. Different concentrations of Hoagland’s nutrient solution (1938).
Concentration of Nutrients
(mg L−1)
25%50%75%100%125%
N52.50105157.50210262.50
K58.75117.50176.25235293.75
Ca50100150200250
P7.7515.5023.253138.75
S1632486480
Mg1224364860
Fe0.751.502.2533.75
B0.1250.250.3750.50.625
Mn0.1250.250.3750.50.625
Zn0.0120.020.0370.050.065
Cu0.0050.010.0150.020.025
Mo0.0020.0050.0070.010.012
EC (mS cm−1)
y = 0.0237x + 0.0351, R2 = 0.99
0.601.241.852.422.97
Table 2. Mean comparison of photosynthetic pigment contents of basil microgreen in different concentrations of Hoagland’s NS.
FactorsChlorophyll a
(mg g−1 FW)
Chlorophyll b
(mg g−1 FW)
Total Chlorophyll
(mg g−1 FW)
Carotenoids
(mg g−1 FW)
NS
Concentration
Cultivar
25%Violeto0.39 e0.20 ghi0.60 f0.10 h
Ablagh0.63 cd0.33 cdefgh0.97 cde0.25 f
Red Rubin0.74 abc0.42 abcde1.17 abc0.31 e
Kapoor0.68 c0.35 cdefg1.04 bcd0.24 f
50%Violeto0.37 e0.15 i0.51 f0.39 d
Ablagh0.46 de0.25 fghi0.70 ef0.23 f
Red Rubin0.48 de0.27 efghi0.76 def0.32 e
Kapoor0.48 de0.24 ghi0.71 def0.30 e
75%Violeto0.34 e0.15 i0.49 f0.38 d
Ablagh0.70 bc0.45 abc1.15 abc0.30 e
Red Rubin0.75 abc0.53 ab1.28 abc0.18 g
Kapoor0.45 e0.28 defghi0.73 def0.41 d
100%Violeto0.39 e0.17 hi0.56 f0.41 d
Ablagh0.89 a0.53 ab1.41 a0.53 ab
Red Rubin0.73 abc0.58 a1.31 ab0.32 e
Kapoor0.48 de0.29 cdefghi0.77 def0.48 c
125%Violeto0.46 de0.16 i0.62 f0.21 fg
Ablagh0.87 ab0.45 abc1.32 ab0.56 a
Red Rubin0.89 a0.41 bcdef1.30 ab0.51 bc
Kapoor0.46 de0.28 defghi0.75 def0.33 e
Various letters in each column showed significant differences according to Duncan’s multiple range test (p = 0.05).
Table 4. Mean comparison of antioxidant traits of basil microgreen in different concentrations of Hoagland’s NS.
Source of VarianceVitamin C
(mg g−1 FW)
Flavonoids
(mg CAE g−1 FW)
Anthocyanin
(mg 100 g−1 FW)
Polyphenols
(mg GA 100 g−1 FW)
Antioxidant Capacity (%)APCI Index
NS ConcentrationCultivar
25%Violeto1.07 g0.99 h19.70 d788.44 ghi56.40 e37.25 jk
Ablagh1.09 g2.65 def11.90 gh1063.40 d66.17 cd44.87 i
Red Rubin1.32 fg2.55 def21.00 cd934.22 e72.15 bc51.80 efg
Kapoor2.22 d1.21 gh9.57 h866.97 efg46.53 f39.41 j
50%Violeto1.83 e2.93 de23.53 bc836.88 fgh43.33 f51.62 efg
Ablagh1.09 g1.61 fgh15.23 ef838.42 fgh24.90 g34.74 k
Red Rubin2.29 d2.12 efg24.17 bc746.71 ij30.23 g47.03 hi
Kapoor1.53 f3.30 cd10.20 h700.51 j25.00 g36.92 jk
75%Violeto2.56 c2.68 def25.17 b699.29 j26.13 g49.91 fgh
Ablagh2.68 c2.08 efgh18.00 de757.81 hij47.20 f47.71 ghi
Red Rubin1.19 g1.69 fgh25.93 ab745.49 ij23.30 g37.98 jk
Kapoor1.82 e5.46 b11.47 gh902.56 ef71.57 bc55.94 e
100%Violeto4.34 a5.34 b28.77 a1024.56 d65.10 cd74.14 c
Ablagh4.23 a4.20 c23.87 bc1425.96 ab77.83 b79.41 b
Red Rubin2.58 c2.15 efg26.43 ab866.97 efg43.63 f53.04 ef
Kapoor2.64 c5.83 b14.50 fg1050.39 d93.10 a68.57 d
125%Violeto1.25 g2.48 def20.21 d1395.30 ab56.20 e50.14 fgh
Ablagh3.63 b8.49 a24.97 b1444.92 a87.57 a87.82 a
Red Rubin4.28 a5.37 b24.51 b1358.00 b90.27 a82.73 b
Kapoor1.93 e3.37 cd6.52 i1268.69 c62.33 de50.14 fgh
Different letters within each column indicate significant differences according to Duncan’s multiple range test (p = 0.05).
Disclaimer/Publisher’s Note: The statements, opinions and data contained in all publications are solely those of the individual author(s) and contributor(s) and not of MDPI and/or the editor(s). MDPI and/or the editor(s) disclaim responsibility for any injury to people or property resulting from any ideas, methods, instructions or products referred to in the content.

