Article

QTL-seq Identifies Pokkali-Derived QTLs and Candidate Genes for Salt Tolerance at Seedling Stage in Rice (Oryza sativa L.)

by
Decha Songtoasesakul
1,2,
Wanchana Aesomnuk
3,
Sarinthip Pannak
3,
Jonaliza Lanceras Siangliw
4,
Meechai Siangliw
4,
Theerayut Toojinda
4,
Samart Wanchana
4,* and
Siwaret Arikit
3,5,*
1
Center for Agricultural Biotechnology, Kasetsart University, Kamphaeng Saen Campus, Nakhon Pathom 73140, Thailand
2
Center of Excellence on Agricultural Biotechnology: (AG-BIO/MHESI), Bangkok 10900, Thailand
3
Rice Science Center, Kasetsart University, Kamphaeng Saen Campus, Nakhon Pathom 73140, Thailand
4
National Center for Genetic Engineering and Biotechnology (BIOTEC), 113 Thailand Science Park, Pahonyothin Road, Khlong Luang, Pathum Thani 12120, Thailand
5
Department of Agronomy, Faculty of Agriculture at Kamphaeng Saen, Kasetsart University, Kamphaeng Saen Campus, Nakhon Pathom 73140, Thailand
*
Authors to whom correspondence should be addressed.
Agriculture 2023, 13(8), 1596; https://doi.org/10.3390/agriculture13081596
Submission received: 8 July 2023 / Revised: 29 July 2023 / Accepted: 11 August 2023 / Published: 12 August 2023
(This article belongs to the Topic Tolerance to Drought and Salt Stress in Plants)

Abstract

:
Rice is a staple food crop that plays a pivotal role in global food security, feeding more than half of the world’s population. Soil salinity is one of the most important global problems affecting rice productivity. Salt stress at the seedling stage inhibits root growth, impairs nutrient and water uptake, and affects overall plant vigor, resulting in poor establishment and reduced growth. Therefore, acquiring salt tolerance, especially at the seedling stage, is critical for successful rice production in salinity-affected areas. In this study, 160 RILs derived from a cross between Pokkali and KDML105 were evaluated for their salt tolerance at the seedling stage. QTL-seq analysis with this population identified nine QTLs associated with salt tolerance. Through a comprehensive examination of the effects of coding sequence variants of the 360 annotated genes within the QTLs and gene expression under salt stress, 47 candidate genes were prioritized. In particular, Os01g0200700 (metallothionein-like protein) and Os12g0625000 (O-acetylserine (thiol)lyase) were suggested as potential candidates based on annotated functions and expression data. The results provide valuable insights for improving rice productivity and resistance under salt stress conditions during the critical seedling stage.

1. Introduction

Rice is a staple food crop that plays a pivotal role in global food security, feeding a large proportion of the world’s population [1]. However, rice cultivation faces significant challenges, and in many rice-growing areas, salinity is one of the major problems after drought [2]. Soil salinity currently affects about 33% of irrigated agricultural land and 20% of all cultivated land globally, which will increase further by 2050 [3]. Salinity, caused by the accumulation of salts in soil and irrigation water, affects rice growth and productivity [4]. Salinity stress can cause annual losses of 30–50% in rice production [5,6]. Typically, there is an average yield loss of approximately 12% in rice for every increase of one dS m−1 in soil EC value, although these effects may not be consistent across all cases [7]. The trait of salt tolerance has become an important rice breeding target in many Asian countries where large salinized rice fields occur [8,9].
Rice is a relatively highly salt-sensitive crop [10]. Salt stress adversely affects various stages of rice growth and development [11]. Among these stages, the seedling stage is particularly susceptible to salt stress [12]. Salt stress at the seedling stage inhibits root growth, impairs nutrient and water uptake, and affects overall plant vigor, resulting in poor establishment and reduced growth [13]. Therefore, acquiring salt tolerance, especially at the seedling stage, is critical for successful rice production in salinity-affected areas. Salt tolerance in plants is the ultimate manifestation of several physiological processes, including Na+ uptake and exclusion, ionic balance (especially Na+/K+ ratio), and distribution [14]. Salt tolerance in rice is controlled by multiple genes with a complex genetic mechanism [15,16]. In addition, salt tolerance is controlled by complex and interacting genetic, molecular, and physiological mechanisms, such that numerous gene families and interaction networks are involved in regulating the response of rice to salinity [17,18].
Efforts have been made to understand the genetic basis of salt tolerance in rice by identifying quantitative trait loci (QTLs). To date, hundreds of QTLs for salt response have been identified using segregating populations derived from crosses between salt-tolerant and salt-sensitive varieties, and a number of candidate genes have been characterized [8,18,19,20,21,22,23,24,25]. A notable QTL, Saltol, associated with K+/Na+ homeostasis in the shoot was mapped to chromosome 1 using recombinant inbred lines (RILs) derived from a cross between IR29 and Pokkali [26]. The SKC1 gene, which encodes a member of the HKT transporter, is located within the Saltol QTL region. SKC1 in salt-tolerant rice varieties, e.g., Pokkali and Nona bokra, plays a critical role in potassium transport, an important physiological process affected by salt stress. Inclusion of SKC1 in rice breeding programs has shown promising results in improving salt tolerance [27]. However, it is important to consider the limitations of SKC1 in specific populations, as its efficacy may vary due to genetic variation or interactions with other genetic factors [26].
QTL mapping allows the discovery and characterization of genomic regions associated with specific traits and provides valuable insights into underlying genetic factors [28]. QTL mapping has traditionally relied on bi-parental mapping populations and molecular markers. However, recent advances in genomics and sequencing technologies have paved the way for more efficient and rapid methods for QTL identification. QTL-seq, a high-throughput sequencing-based approach, enables the identification of QTLs by comparing the genome sequences of two groups of individuals with contrasting phenotypes from segregating populations [29]. The method aims to identify genomic regions showing variations in the single nucleotide polymorphism (SNP) index between two pooled samples. QTL-seq has been used to rapidly identify genes or QTLs in various crops such as chickpea [30], peanut [31,32], barley [33], soybean [34], canola [35], cucumber [36,37,38,39], sesame [38], squash [40], and rice [29,41,42,43,44,45,46,47,48,49]. In this study, we used the QTL-seq approach to identify genomic regions associated with salt tolerance at the seedling stage of rice in an RIL population. RNA-seq was also used to prioritize candidate genes for the discovered QTL regions. The differentially expressed genes (DEGs) and their variants in the QTL regions for salt tolerance were identified for both validation and use in molecular breeding to improve salt tolerance in the future. The results of this study will contribute to the development of improved salt-tolerant rice varieties and facilitate sustainable rice production in salt-stressed regions.

2. Materials and Methods

2.1. Plant Materials and Growth Conditions and SKC1 Genotyping

The mapping population used for identification of QTLs associated with salt tolerance using QTL-seq analysis composed of 160 recombinant inbred lines (RILs: F7) derived from a cross of Pokkali (salt tolerant) and KDML105 (salt sensitive). The experiment was carried out in a greenhouse at the Rice Science Center, Kasetsart University, Kamphaeng Saen, Nakhon Pathom, Thailand. The design of the experiment was randomized complete block design (RCBD) with four replications under normal condition and salt-stressed treatment (150 mM NaCl). Seeds of each RIL were germinated in a petri dish for three days. Germinated seeds were then transferred to seedling hole-trays (200 holes per tray) containing clay soil from the rice field. In each replication, five seeds per line were grown in a row, one seed per hole, in the germinating trays. The plants were allowed to grow in the greenhouse for 14 days.
SKC1, encoding a member of the HKT transporters, was reported as a candidate gene in a major QTL on chromosome 1 (Saltol), and the SKC1 genotype of Pokkali was associated with salt tolerance [50]. A KASP marker specific for a nonsynonymous SNP (C/T) on exon 1 at position 1:11462725 in SKC1 with distinguishable alleles in Pokkali (allele T) and KDML105 (allele C) was used to divide RILs into two groups based on the SKC1 alleles of the parents. DNA was extracted from young leaf of each RIL using the DNeasy Plant Mini Kit (QIAGEN, Germany) and KASP assay was performed according to the LGC Genomics manual (http://www.lgcgenomics.com, accessed on 1 July 2023). The 96-well format was utilized for the KASP reaction, with a total reaction volume of 5 µL. This reaction mixture was composed of 2 µL of DNA template, 0.075 µL of assay mix, and 2.5 µL of master mix. The amplification process was initiated at 94 °C for 5 min, followed by 10 cycles involving 94 °C for 20 s and 61 °C for 60 s, using a touchdown method with a gradual temperature reduction of 0.6 °C per cycle. Subsequently, an additional 27 cycles were conducted at 94 °C for 20 s and 55 °C for 30 s, followed by a resting period at 37 °C for 1 min. To determine the fluorescence signals, the final PCR products were analyzed using the QuantStudio 6 Flex Real-Time PCR System (Thermo Fisher Scientific, Watham, MA, USA). The KASP marker for SKC1 (unpublished) was courtesy of the Innovative Plant Biotechnology and Precision Agriculture Research Team, National Center for Genetic Engineering and Biotechnology (BIOTEC), Thailand.

2.2. Salinity Treatment and Phenotypic Evaluation

The seedlings aged 14 days after sowing (DAS) were used to screen for salinity tolerance following the methods described in [51]. The nutrient solution in control (normal condition) was Bangsai nutrient solution (1:100) without NaCl, whereas the salinity stress treatment was the same solution supplemented with 150 mM NaCl. The trays containing seedlings were placed in two cement tanks (900 cm × 900 cm × 50 cm) for control and salinity treatment, respectively. During the growth of the seedlings, the solution pH was set to 6.0–6.5 and the salinity was set to the desired level every day. A water pump was installed to flow the water within each tank. Twelve days after treatments, all plants were evaluated for the plant injury caused by salinity stress using the salt injury score (SIS) according to the IRRI’s Standard Evaluation System [52] as follows: 1 = normal growth, no leaf symptoms (highly tolerant), 3 = nearly normal growth, but leaf tips or few leaves whitish and rolled (tolerant), 5 = growth severely retarded; most leaves rolled; only a few elongating (moderate), 7 = complete cessation of growth; most leaves dry; some plants dying (sensitive), and 9 = almost all plants dead or dying (highly sensitive). Pokkali and FL496 (a salt-tolerant RIL derived from IR29 × Pokkali) were used as salt-tolerant check varieties and KDML105 and IR29 (an indica variety referred as salt-sensitive standard) [53] were used as susceptible check varieties.
In addition to salinity injury evaluation, another set of salinity stress experiments were conducted and Na+ and K+ contents in 14-day-old seedling shoots were measured in 160 RILs at ten days after treatment. In order to quantify the level of Na+ and K+ concentrations of rice samples, shoots were harvested at 10 days after salt treatment. All samples were rinsed with tap water and washed with distilled water. The samples were dried, and the exact amount of 0.2 g was carefully weighed, dissolved in 10 mL acetic acid (100 mM), and kept at 90 °C for 2 h. The Na+ and K+ were determined by using inductively coupled plasma optical emission spectrometry (ICP-OES, Avio 200) with unit of mg ion per g dry weight sample.

2.3. Sample Bulking, DNA Isolation and Whole-Genome Sequencing

RILs with the lowest SIS values (SIS < 4.8) and RILs with the highest SIS values (SIS > 7.2) were selected and grouped as the salt-tolerant bulk (T-bulk) and salt-sensitive bulk (S-bulk), respectively. High-quality genomic DNA was isolated from the young leaves of each selected plant in the two bulks along with the parents (Pokkali and KDML105) using the DNeasy Plant Mini Kit (Qiagen, Hilden, Germany). The 33 RILs in the two groups together with the parents Pokkali and KDML105 were sequenced in the whole genome individually using an MGI-seq platform at China National GeneBank (CNGB; Shenzhen, China).

2.4. QTL-seq Analysis

Raw reads were processed by Trimmomatic software version 0.30 [54] to remove adapter sequences and low-quality reads. The clean read data were used to perform QTL-seq analysis using the QTL-seq pipeline v2.2.2 (https://github.com/YuSugihara/QTL-seq, accessed on 1 July 2023). The Pokkali-based pseudo reference genome was generated by aligning clean reads of Pokkali to the publicly available reference rice genome (Nipponbare: IRGSP1.0) and replacing the genome of Nipponbare with the variants of the Pokkali parent. Clean reads were obtained from each F2 sample in equal numbers and pooled into T and S bulks. SNP calling and SNP index calculations were performed using the QTL-seq pipeline as previously described [29]. Briefly, the SNP index of the T-bulk and S-bulk was defined as the ratio between the Pokkali’s SNP alleles and the total number of reads corresponding to the SNP. The Δ(SNP index) was calculated according to the formula Δ(SNP index) = [(SNP index of S-bulk) − (SNP index of T-bulk)]. A sliding window analysis was performed by averaging the Δ(SNP index), in which the window size was set to 1 Mb, with 250 kb steps. The minimum aligned read depth cutoff for obtaining SNPs was set to 15 reads.

2.5. Candidate Gene Annotation and Prioritization

The candidate genes within the detected QTL regions were obtained from the RAP-DB (https://rapdb.dna.affrc.go.jp; accessed on 1 July 2023). The genes annotated as a hypothetical gene and genes without an annotation were excluded. The candidate genes were further filtered to obtain those containing SNPs/Indels with moderate or high effects. The SNP effects were determined using a variant effect predictor (VEP; https://www.plants.ensembl.org/Oryzasativa/Tools/VEP; accessed on 1 July 2023).

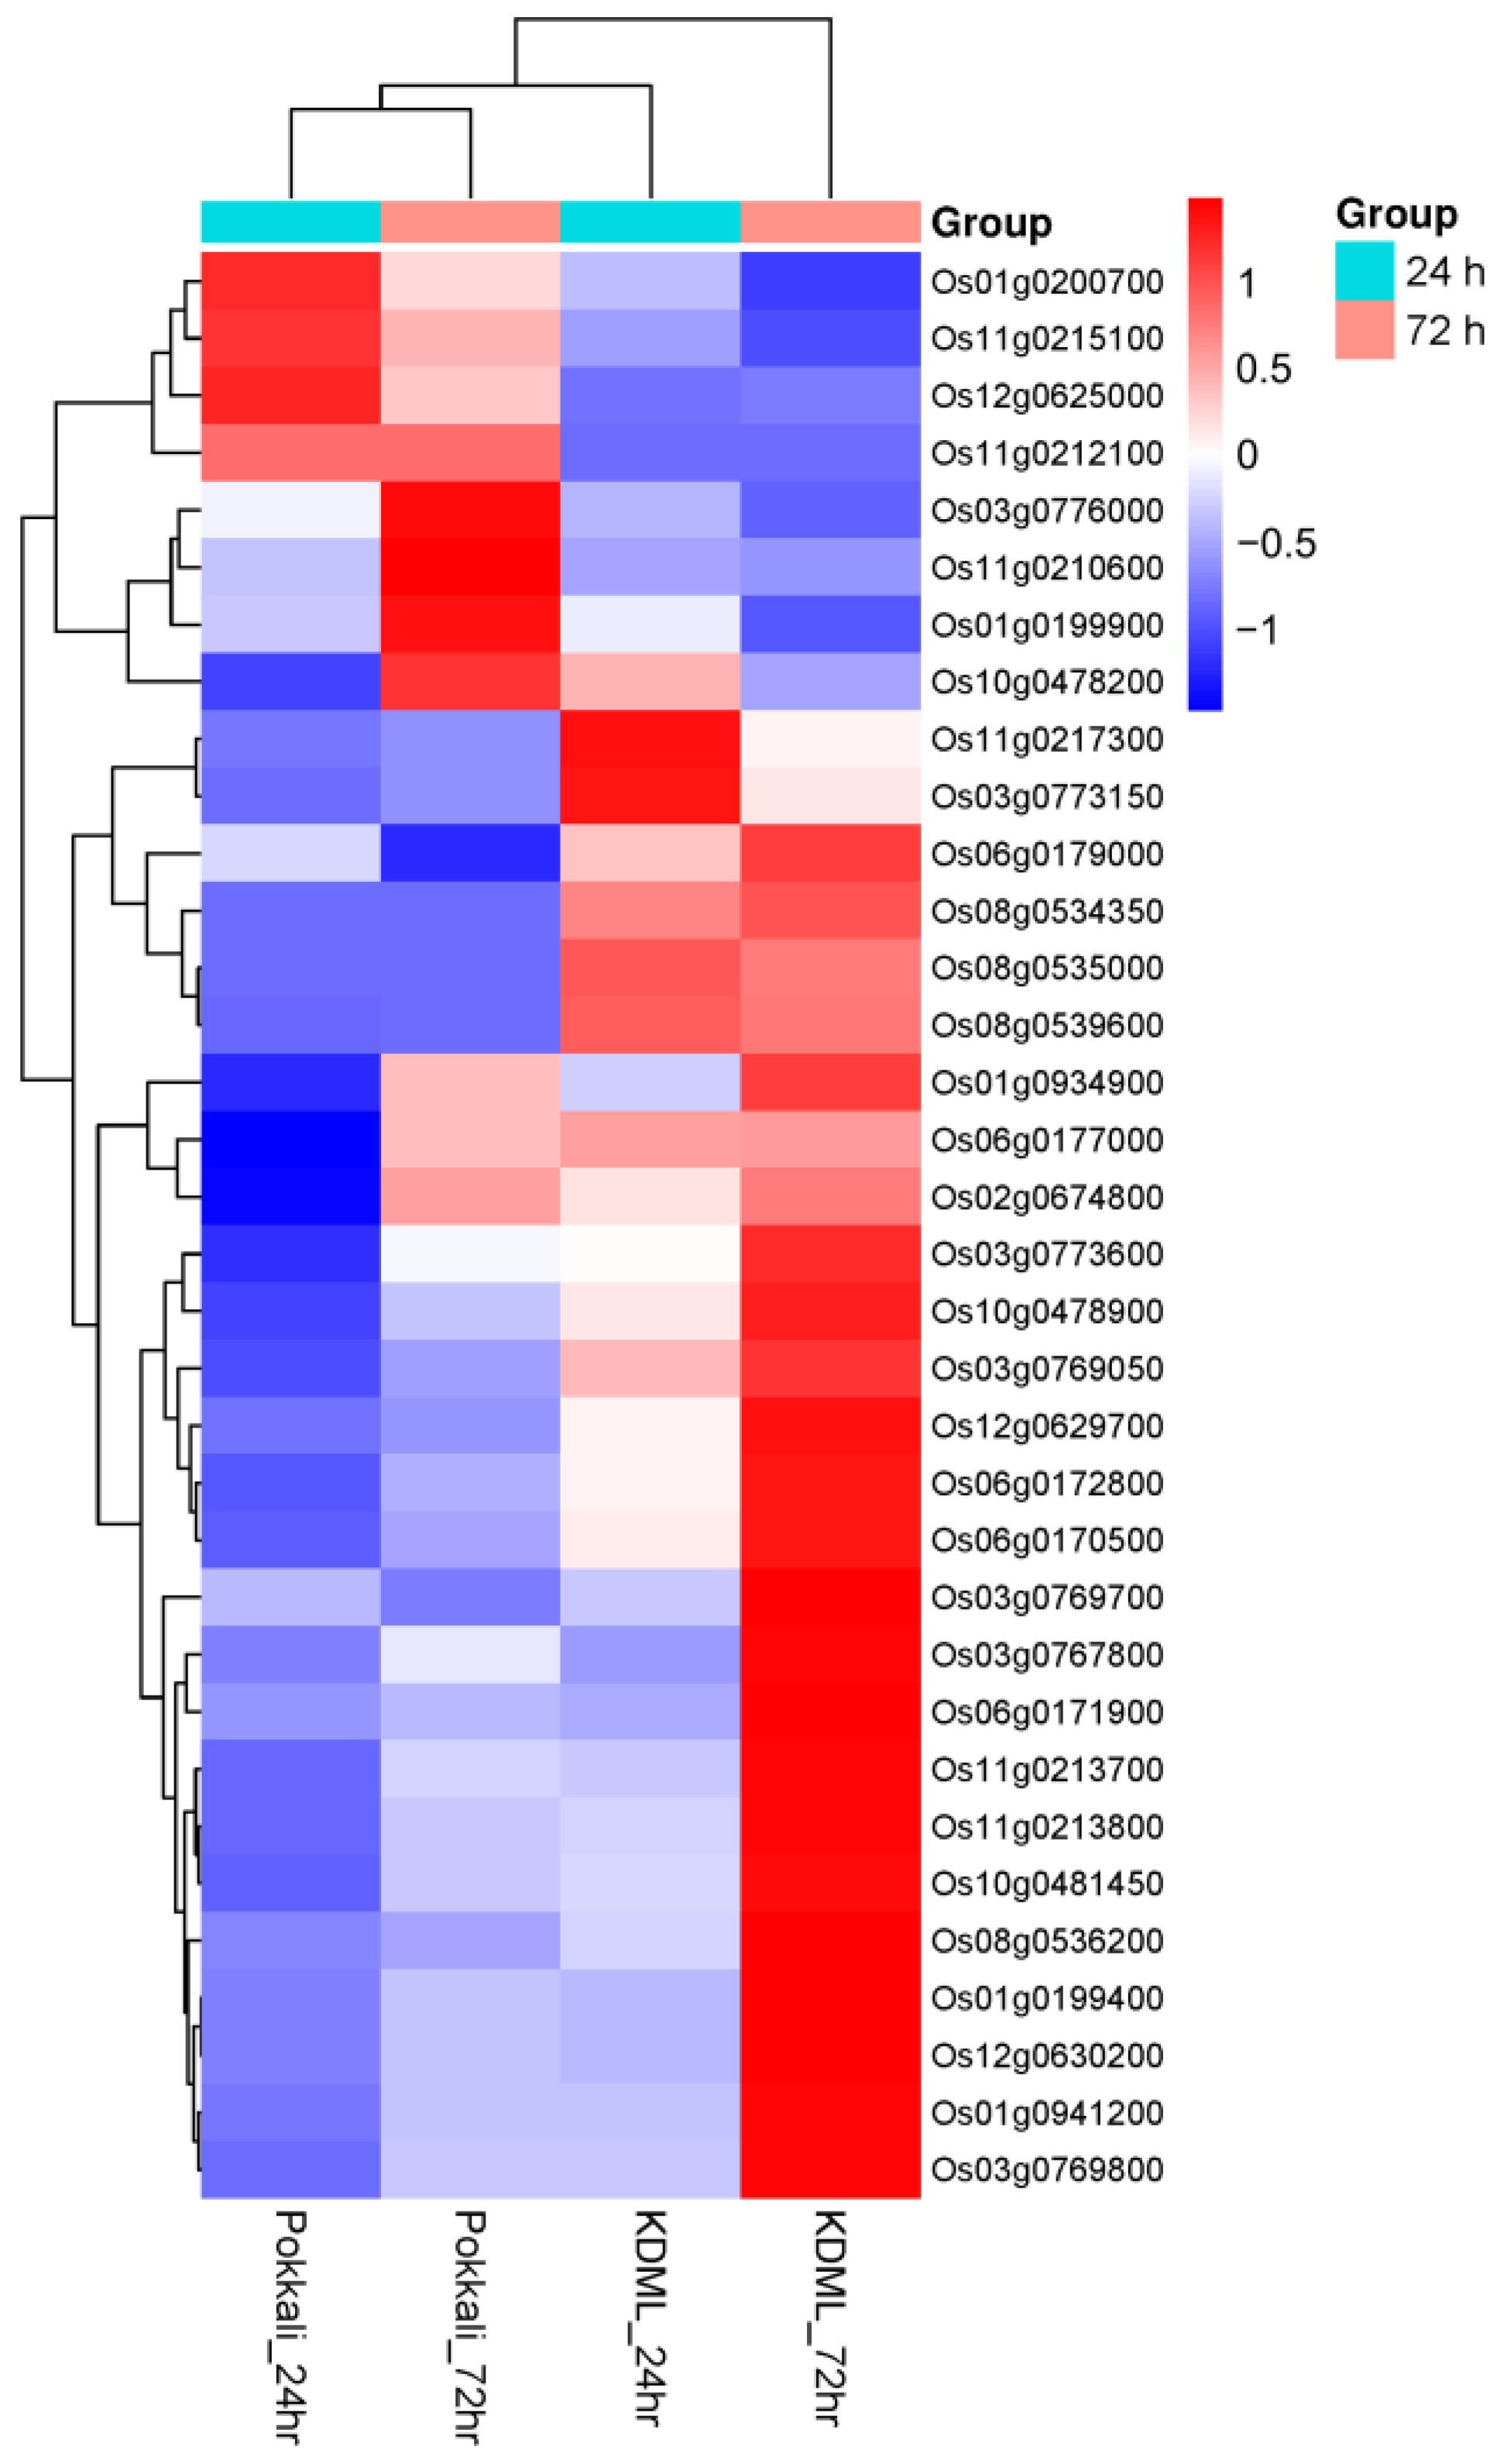
2.6. Differential Gene Expression Analysis of Candidate Genes

The expression of candidate genes within each detected QTL was analyzed by transcriptome analysis of Pokkali and KDML105 under salt treatment at 24 and 72 h. The shoot tissues of 14-day-old seedlings of Pokkali and KDML105 were collected in three replications at 24 and 72 h after salt treatment. Total RNA was extracted using the TRIzol method (Life Technologies). The RNA samples were sequenced at China National GeneBank (CNGB; Shenzhen, China) using an MGI-seq platform. Quantitative gene expression measurements based on RNA-seq data for Pokkali and KDML105 were performed using Salmon (v.0.30) [55] with the Nipponbare transcriptome as a reference (Osativa_323_v7.0: Phytozome database version 12.0). Transcript counts for all expressed genes in KDML105 and Pokkali 24 and 72 h after salt treatment in three replicates were used to perform differential gene expression analysis with DEseq2 [56]. Differentially expressed genes 24 and 72 h after salt treatment comparing Pokkali and KDML105 were determined with a p-value cutoff of p < 0.01 and a false discovery rate (FDR) < 0.2. Cluster analysis of differential gene expression and heatmap plots was performed using SRPLOT (https://www.bioinformatics.com.cn/en; accessed on 1 July 2023), a free online platform for data analysis and visualization.

3. Results

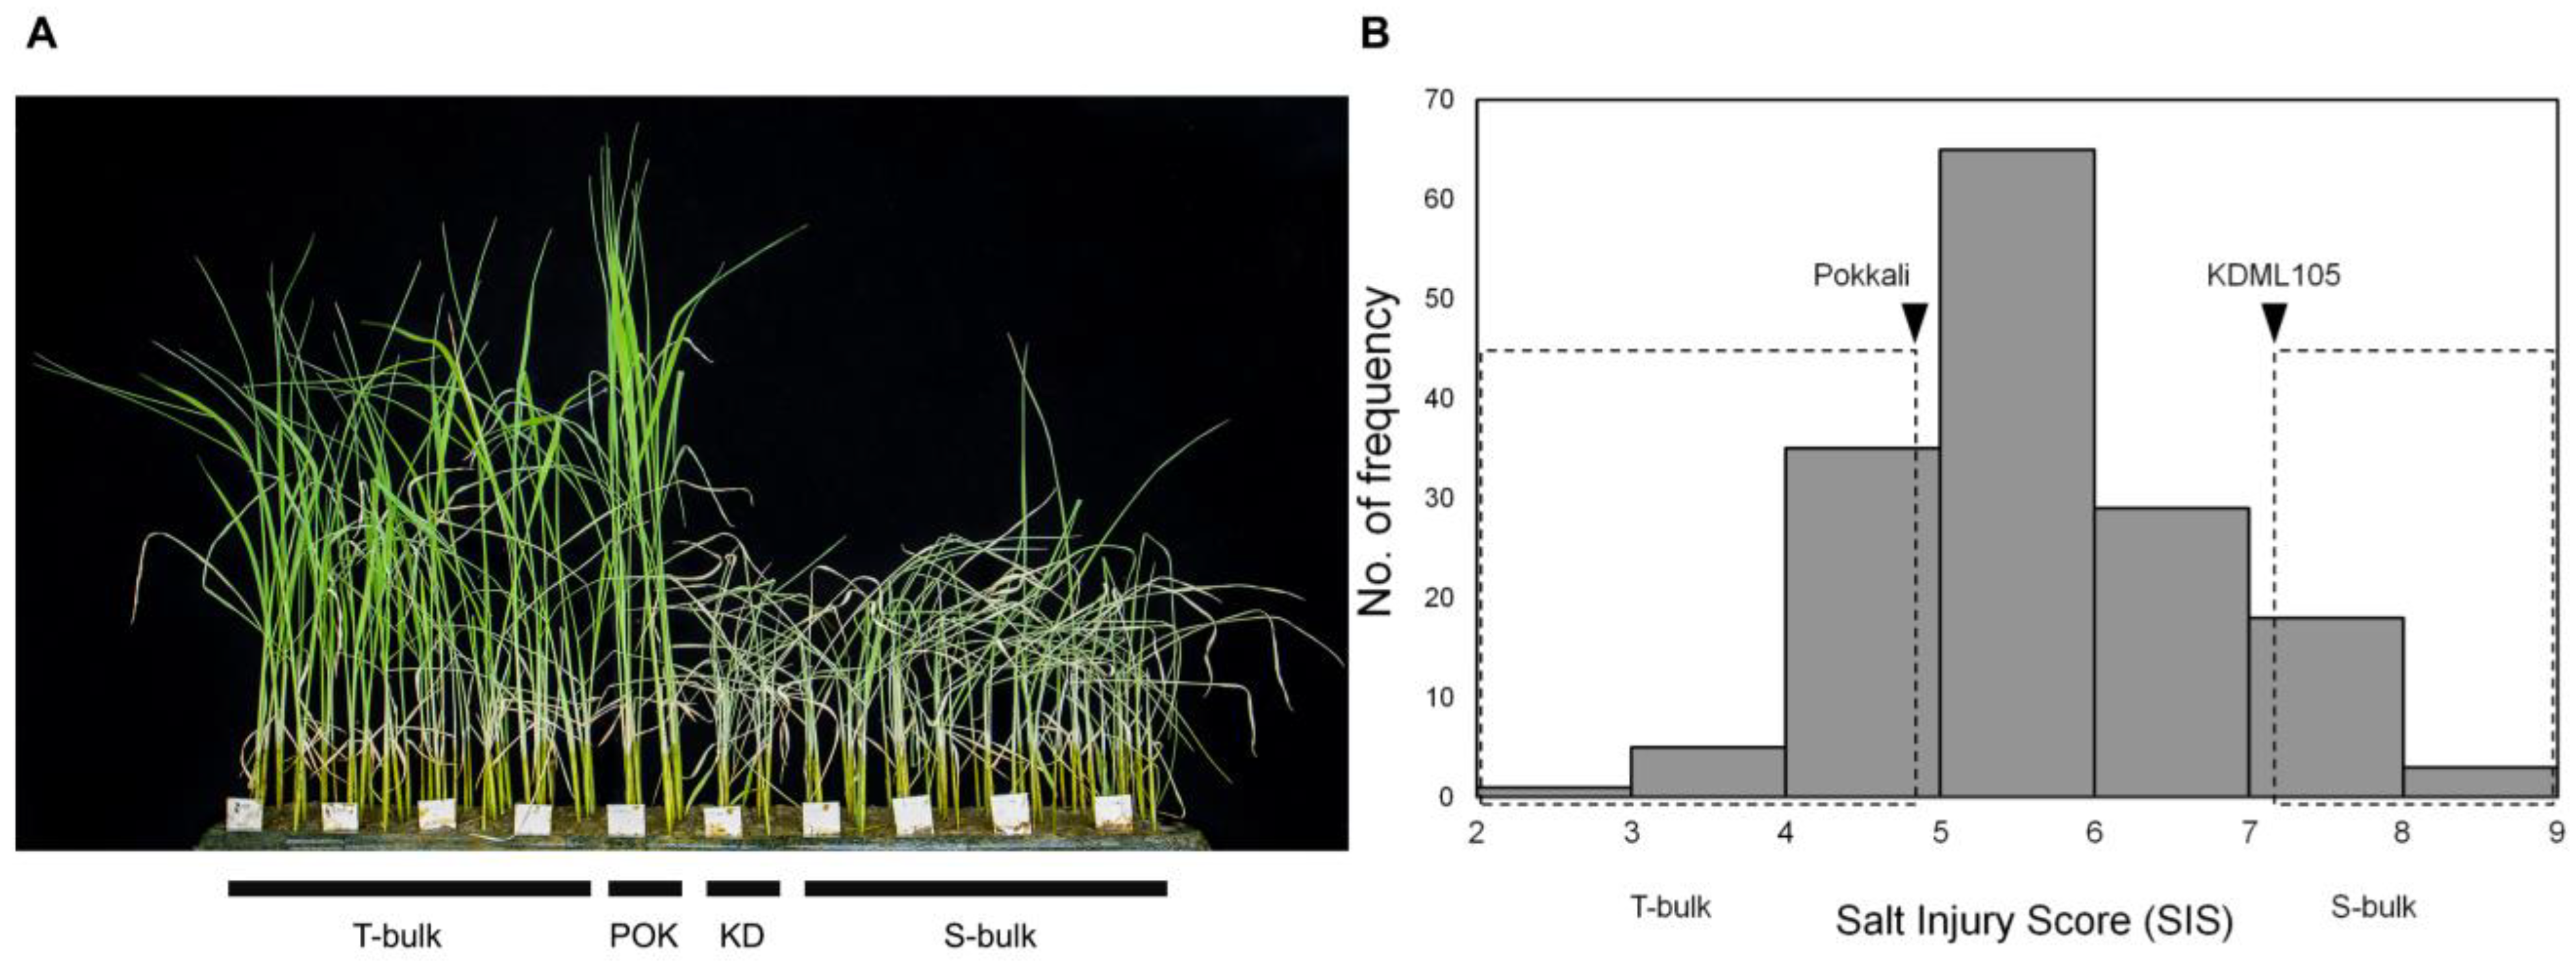
3.1. Phenotypic Screening of Salt Tolerance at Seedling Stage in RILs with Different SKC1 Alleles

A total of 160 recombinant inbred lines (RILs: F7) derived from a cross of KDML105 and Pokkali were genotyped with a KASP marker specific for SKC1 (the SNP C/T at the position 1:11,462,725) to divide the plants into two groups: (1) the group of plants containing the Pokkali allele of SKC1 (allele T), hereafter referred to as SKC1Pokkali, and (2) the group of plants containing the KDML105 allele of SKC1 (allele C), hereafter referred to as SKC1KDML105. As a result, 81 RILs were found to contain the SKC1Pokkali allele and another 71 contained the SKC1KDML105 allele (Figure S1). Another eight RILs were heterozygous for SKC1. As a result of salt tolerance screening, the phenotype of salt injury (salt injury score: SIS) of the parents Pokkali and KDML105 differed significantly, as the mean SIS score was 4.8 in Pokkali and 7.2 in KDML105 (Figure 1A). The average SIS values in RILs containing the SKC1Pokkali allele varied from 2.1 to 8.3, with an average of 5.5, and the values in RILs containing the SKC1KDML105 allele varied from 3.2 to 8.1, with an average of 5.8. The average SIS values in the two groups were not significantly different (Figure 1A). The results of Na+ and K+ content analysis showed that the shoot Na+/K+ ratio of Pokkali was 1.1 and that of KDML105 was 2.4 (Figure 1B). Interestingly, although the SIS values of the two RIL groups were not significantly different, the average Na+/K+ ratio of the RILs in the SKC1POKKALI group and in the SKC1KDML105 group was significantly different, being 1.04 in the first group and 1.49 in the second group (Figure 1B). According to these results, it is likely that SKC1 had little effect on salt injury and that the Na+/K+ ratio in this RIL population was not related to the variation of SIS. This suggests that SKC1 has less effect on salt tolerance (determined by SIS) in this population and that the tolerance phenotype may be controlled by other genes.

3.2. Segregation of the Salinity Tolerance Phenotype in the RIL Population and Construction of Salt-Tolerance (T) and Salt Sensitive (S) Bulks

To identify genomic regions associated with salt tolerance in this population, we performed QTL-seq analysis considering the whole population regardless of SKC1 genotypes. We used SIS values to determine plants with different salt tolerance phenotypes. In the 160 RILs, SIS values varied from 2.1 to 8.3, with an average of 5.7 (Figure 2). The distribution of SIS values in this population was near normal distribution, indicating polygenic segregation. A total of 17 plants with high tolerance to salt stress (SIS values of 2.1–4.8) were selected as salt tolerant group and another 16 plants with high sensitivity to salt stress (SIS values of 7.2–8.3) were selected as salt sensitive group.

3.3. Whole-Genome Sequencing of Parents and the Two Bulks of RILs

In the samples of Pokkali and KDML105, a total of 37.44 million reads and 41.69 million reads were obtained, respectively. This corresponded to approximately 10.38-fold and 11.44-fold coverage of the rice genome (with an approximate size of 400 Mb). Each of the 33 RIL samples yielded 20 million clean reads, providing about 5x genome coverage. The sequences of 17 RILs exhibiting salt-tolerant characteristics were combined to form the tolerant bulk (T bulk), while those of 16 RILs displaying salt-sensitive traits were combined to create the sensitive bulk (S bulk). Regarding the read alignments to the Nipponbare reference genome, the proportions of aligned reads in Pokkali, KDML105, T bulk, and S bulk were 94.21%, 94.03%, 90.61%, and 90.06%, respectively (Table 1).

3.4. Variant Detection and QTL-seq Analysis for Salt Tolerance

QTL-seq analysis used the common SNP variants identified in both the tolerant (T) and sensitive (S) bulks and determined by read mapping against the Pokkali parental genome. Initially, 2,946,843 SNPs were identified in the two bulks, which required a read-support criterion of at least five reads (Table 2). However, to ensure robustness of the results, a more stringent read support criterion of 15 reads was applied to filter out the original set of SNPs. Consequently, 213,922 SNPs were detected with high confidence across the 12 chromosomes and used to calculate the SNP index (Table 2; Figure S2).
The SNP index was calculated for the selected SNPs in both the tolerant (T) and sensitive (S) bulks, using the Pokkali parental genome as a reference. The ∆ (SNP index) was then determined by subtracting the SNP index values in the T-bulk from those in the S-bulk. Moving windows were applied to calculate the average SNP indexes for SNPs located within a 1-Mb region with a 250-kb increment. To identify genomic regions associated with salt tolerance, the SNP index and ∆ (SNP index) were plotted across the 12 rice chromosomes. This analysis led to the identification of nine candidate genomic regions on chromosomes 1, 2, 3, 6, 8, 10, 11, and 12, where the average ∆(SNP index) exceeded the 99% confidence interval (Figure 3; Table 3). We determined the QTL region for each QTL within a 500-kb interval surrounding the peaks. In the T-bulk, the average SNP index for these QTLs ranged from 0.10 to 0.40, while in the S-bulk, it ranged from 0.65 to 0.99. The average ∆(SNP index) for these QTLs ranged from 0.55 to 0.69 (Table 3). Interestingly, some of these QTLs, such as qST1.2, qST2, qST3, qST6, qST8, and qST12, were found to overlap with previously reported QTLs or genes associated with salt tolerance (Table 3).

3.5. Annotation and Prioritization of Candidate Genes in QTL Regions

To determine the candidate genes for the discovered QTLs, we obtained genes within each QTL based on the RAP-DB annotation. The total number of candidate genes with an annotated function within these QTLs was 360 genes, ranging from 32 to 50 genes in each QTL (Table S1). We prioritized this number of candidate genes by filtering genes with a functional variant and a contrasting SNP index between the two bulks. As a result, only qST1.1, qST1.2, qST6, qST10, qST11, and qST12 were found to contain 2, 1, 2, 1, 5, and 2 genes, respectively, with a functional variant and contrasting SNP index between the two bulks (Table 4).
Differential expression analysis was also performed to prioritize candidate genes based on transcriptome data from 14-day-old seedlings of both parent plants KDML105 and Pokkali observed 24 h and 72 h after salt stress (HAS). A total of 34 genes of all nine QTLs were found to be differentially expressed between the two parent plants (Table 5; Figure 4 and Table S2). Of these, 17 and 28 genes were differentially expressed 24 and 72 HAS, respectively. Eleven genes were differentially expressed at both 24 and 72 HAS (Table 5). These included genes encoding an esterase (Os01g0934900), a 40S ribosomal protein (Os03g0773150), a kinesin (Os03g0773600), a glucose-6-phosphate isomerase (Os03g0776000), an RNA-binding protein (Os03g0776000), a cytochrome b-c1 complex subunit 8 (Os06g0177000), two cation antiporters (Os08g0534350 and Os08g0535000), an ankyrin (Os08g0539600), various classes of plant disease resistance proteins (Os08g0539600, Os11g0212100 and Os11g0215100, Os12g0629700, Os12g0630200), a mevalonate and galactokinase (Os11g0217300), and an O-acetylserine(thiol)lyase (Os12g0625000). Among the 17 DE genes that were strongly expressed in Pokkali at both 24 and 72 HAS were Os01g0200700 (metallothionein-like protein) from qST1.1 and Os12g0625000 (O-acetylserine (thiol)lyase) from qST12.

4. Discussion

Salinity is one of the most important abiotic stresses that negatively affects various agricultural crops and can limit crop growth and productivity. For decades, efforts have been made to map genes and QTLs associated with salinity tolerance. Hundreds of QTLs associated with salt responses and salt tolerance have been reported in rice [8,18,19,20,21,22,24,25,26,50,62,63]. Among these, Saltol co-localized with qSKC-1 on chromosome 1 was reported to be an important QTL associated with K+/Na+ homeostasis in the shoot and contributing to salt tolerance at the seedling stage [22,26]. Saltol has been used in rice breeding programs to develop salt-tolerant varieties [26,27]. However, since the mechanism of salt tolerance is extremely complex, not all salt tolerance can be explained by Saltol [64]. The SKC1 (OsHKT1;5) gene encoding a member of the high-affinity K+ transporter (HKT) was cloned in the Saltol/qSKC-1 locus [65]. It has been suggested that the function of SKC1 is involved in the regulation of Na+/K+ homeostasis under salt stress [65,66]. According to the results in our study, we confirmed that SKC1 may affect Na+/K+ content in shoots of the RIL population (F7-RILs) derived from KDML105 × Pokkali, because the plants carrying the SKC1Pokkali allele had significant lower Na+/K+ ratio in shoots. However, it is likely that the variation in SIS values in this population is not due to the SKC1 or Saltol locus. The RIL plants with the SKC1Pokkali allele had a variable SIS score (2.1–8.3) like those with the SKC1KDML105 allele (3.2–8.1), and the means of the two groups were not significantly different. Therefore, we suspected that other genes play an important role in the phenotype of salt tolerance in this population and not SKC1. This suggests that there is probably still a great opportunity to find more novel genes/QTLs involved in salt tolerance in rice and that it would be beneficial to obtain more genetic information on this trait.
The QTL-seq method is a combination of bulk-segregant analysis (BSA) and next-generation sequencing technologies that can rapidly identify the chromosome region where the genes or QTLs of interest are located [29]. Using the QTL-seq analysis with the RIL population, we identified nine genomic regions on eight chromosomes associated with salt tolerance. Among these, six QTLs, i.e., qST1.2, qST2, qST3, qST6, qST8, and qST12, were found to overlap with the previously reported QTLs/genes associated with SIS and other physiological and morphological traits responding to salt stress (Table 3). In this study, no QTL associated with SIS was identified that overlapped with the region of Saltol and SKC1 (chr.1: 11,458,955–11,463,442). This is similar to a previous report using the population derived from the same salt-tolerant donor, Pokkali [59]. This confirms that the phenotype of salt tolerance in this population is unlikely to be affected by the action of SKC1. Pokkali, a landrace widely known for its tolerance to salt stress, has been widely used as a salt-tolerant donor in rice breeding programs as well as in QTL mapping studies to identify QTLs associated with salt tolerance [26,58,59,67]. It was reported that Saltol identified from Pokkali was not highly associated with salt tolerance based on overall visual performance at the seedling stage [26], suggesting that additional QTLs associated with salt tolerance derived from Pokkali exist. Among the nine QTLs identified, qST1.2 was located in the same genomic regions as qSIS1, a QTL previously identified for SIS based on conventional QTL mapping with a population of 148 RILs from a cross between IR29 and Pokkali and a set of 14,470 SNPs [59]. In addition, qST3 was found to be co-localized with the previously reported qSES3 associated with seedling stage salinity tolerance based on SIS values [26]. In the previous study, two additional QTLs were also identified for SIS on chromosomes 4 and 12 [68]. However, these two QTLs were not found to overlap with the QTLs identified in our study. On the other hand, qST1.1, qST10, and qST11 identified in this study may be novel QTLs for salt tolerance at the seedling stage, which have not been identified in previous QTL mapping studies using the same salt-tolerant donor, Pokkali [26,58,67].
In a conventional QTL mapping study, candidate genes are unlikely to be proposed without further fine mapping to narrow down the region. With the QTL-seq approach, which involves bulk-segregant analysis and whole-genome sequencing, QTLs associated with traits of interest can be rapidly identified, and with the integration of transcriptome analysis, there is a greater chance that the potential candidate genes within the discovered QTLs can be suggested. In this study, a total of 360 genes within a 500-kb interval region were annotated for the nine QTLs. We used two strategies to prioritize the candidate genes: (1) filtering the genes that contain functional variants, e.g., SNPs with nonsynonymous effect, and that have contrasting SNP indices in the two bulks, and (2) filtering the genes that are differentially expressed between plants with contrasting phenotypes. A total of 13 genes were prioritized based on the identification of functional variants and 34 genes were prioritized based on the differential gene expression analysis. Based on the functional annotation from the RAP-DB, four genes contain an annotated function relevant to salt or other abiotic stresses. These include Os01g0200700 (metallothionein-like protein), Os03g0773150 (40S ribosomal protein S29), Os06g0171900 (WD40 subfamily protein), and Os12g0625000 (O-acetylserine(thiol)lyase, cysteine synthase). Among the 47 candidate genes, there was no overlap between the two groups of genes that were prioritized. According to the results in this study, we suggest that both candidate-gene prioritization methods should be considered complementarily to obtain a more comprehensive set of potential candidate genes.
Among the 34 differentially expressed genes (DEGs), many of them were more highly expressed in KDML105 (salt-sensitive) than in Pokkali (salt-tolerant). However, there were two salt-stress or other stress-related genes that were more highly expressed in Pokkali than in KDML105, namely Os01g0200700 (metallothionein-like protein) and Os12g0625000 (O-acetylserine(thiol)lyase). Metallothionein (MT) proteins are low-molecular-weight, cysteine-rich, and metal-binding proteins that play important roles in the maintaining of metal homeostasis, detoxification, and stress response [69]. O-acetylserine(thiol)lyase or OAS-TL encodes the enzyme required for the final step of cysteine biosynthesis. It has been reported as a salt stress-induced gene in Arabidopsis and the protein has been shown to confer salt tolerance to yeast cells [70]. In addition, OAS-TL has been suggested to play a role in salt stress adaptation in sea daffodil (Pancratium maritimum) [71]. These two genes, as well as other candidate genes identified in this study, could be a good target for further studies on the molecular mechanism of salt tolerance in rice and could be useful for the rice breeding program for salt tolerance.

5. Conclusions

In this study, we identified nine QTLs associated with salt tolerance at the seedling stage of rice. The QTLs associated with SIS identified in this study included known QTLs associated with salt response and novel QTLs. It has been clearly demonstrated that salt tolerance performance in this population is unlikely to be controlled by the Saltol QTL. Several candidate genes have been proposed and two genes, namely Os01g0200700 (metallothionein-like protein) and Os12g0625000 (O-acetylserine(thiol)lyase), were suggested as potential candidate genes based on transcriptome analysis of the two parents. Since breeders usually make their selections based on overall visual performances, i.e., injury scores under salt stress, the QTLs and candidate genes identified in the present study for SIS will be useful for rice breeding programs for salt tolerance at the seedling stage.

Supplementary Materials

The following supporting information can be downloaded at: https://www.mdpi.com/article/10.3390/agriculture13081596/s1, Figure S1: Allelic discrimination plots of the PCR results of the SKC1-KASP marker genotyped in the RIL population; Figure S2: Distribution of SNPs on the 12 rice chromosomes.; Table S1: Annotated genes within the detected QTLs; Table S2: Gene ontology (GO) terms and annotations for the differentially expressed genes.

Author Contributions

Conceptualization, T.T., M.S., S.A., J.L.S. and S.W.; formal analysis, D.S., W.A. and S.P.; resources, M.S. and J.L.S.; data curation, D.S. and S.W.; writing—original draft preparation, D.S. and M.S.; writing—review and editing, S.W. and S.A.; supervision, S.A., S.W. and M.S.; funding acquisition, T.T. All authors have read and agreed to the published version of the manuscript.

Funding

This work was financially supported by the National Research Council of Thailand (NRCT Grant Number: NRCT-RTA/812/2563) and the National Science and Technology Development Agency (NSTDA), Thailand (NSTDA Grant Number: P-18-51456 and P-19-50205). D.S. was supported by Thailand Graduate Institute of Science and Technology (TGIS) Scholarships (Grant No. TG-22-11-60-033M), NSTDA, Thailand.

Institutional Review Board Statement

Not applicable.

Data Availability Statement

Data presented in this study are available in the Supplementary Materials or upon request from the corresponding author.

Acknowledgments

The authors thank the Innovative Plant Biotechnology and Precision Agriculture Research Team, National Center for Genetic Engineering and Biotechnology, Thailand, for providing the plant material used in this study and the KASP marker for SKC1 and inductively coupled plasma optical emission spectrometry (ICP-OES, Avio 200).

Conflicts of Interest

The authors declare no conflict of interest.

References

  1. Khush, G.S. What it will take to feed 5.0 billion rice consumers in 2030. Plant Mol. Biol. 2005, 59, 1–6. [Google Scholar] [CrossRef] [PubMed]
  2. Zahra, N.; Al Hinai, M.S.; Hafeez, M.B.; Rehman, A.; Wahid, A.; Siddique, K.H.M.; Farooq, M. Regulation of photosynthesis under salt stress and associated tolerance mechanisms. Plant Physiol. Biochem. 2022, 178, 55–69. [Google Scholar] [CrossRef] [PubMed]
  3. Mukhopadhyay, R.; Sarkar, B.; Jat, H.S.; Sharma, P.C.; Bolan, N.S. Soil salinity under climate change: Challenges for sustainable agriculture and food security. J. Environ. Manag. 2021, 280, 111736. [Google Scholar] [CrossRef] [PubMed]
  4. Rad, H.E.; Aref, F.; Rezaei, M. Response of rice to different salinity levels during different growth stages. Res. J. Appl. Sci. Eng. Technol. 2012, 4, 3040–3047. [Google Scholar]
  5. Eynard, A.; Lal, R.; Wiebe, K. Crop Response in Salt-Affected Soils. J. Sustain. Agric. 2005, 27, 5–50. [Google Scholar] [CrossRef]
  6. Hoang, T.M.L.; Moghaddam, L.; Williams, B.; Khanna, H.; Dale, J.; Mundree, S.G. Development of salinity tolerance in rice by constitutive-overexpression of genes involved in the regulation of programmed cell death. Front. Plant Sci. 2015, 6, 175. [Google Scholar] [CrossRef]
  7. Gao, J.-P.; Chao, D.-Y.; Lin, H.-X. Understanding abiotic stress tolerance mechanisms: Recent studies on stress response in rice. J. Integr. Plant Biol. 2007, 49, 742–750. [Google Scholar] [CrossRef]
  8. Shi, Y.; Gao, L.; Wu, Z.; Zhang, X.; Wang, M.; Zhang, C.; Zhang, F.; Zhou, Y.; Li, Z. Genome-wide association study of salt tolerance at the seed germination stage in rice. BMC Plant Biol. 2017, 17, 92. [Google Scholar] [CrossRef] [Green Version]
  9. Measho, S.; Li, F.; Pellikka, P.; Tian, C.; Hirwa, H.; Xu, N.; Qiao, Y.; Khasanov, S.; Kulmatov, R.; Chen, G. Soil salinity variations and associated implications for agriculture and land resources development using remote sensing datasets in central asia. Remote Sens. 2022, 14, 2501. [Google Scholar] [CrossRef]
  10. Solis, C.A.; Yong, M.-T.; Zhou, M.; Venkataraman, G.; Shabala, L.; Holford, P.; Shabala, S.; Chen, Z.-H. Evolutionary significance of NHX family and NHX1 in salinity stress adaptation in the genus oryza. Int. J. Mol. Sci. 2022, 23, 2092. [Google Scholar] [CrossRef]
  11. Hakim, M.A.; Juraimi, A.S.; Hanafi, M.M.; Ismail, M.R.; Rafii, M.Y.; Islam, M.M.; Selamat, A. The effect of salinity on growth, ion accumulation and yield of rice varieties. JAPS J. Anim. Plant Sci. 2014, 24, 874–885. [Google Scholar]
  12. Bundó, M.; Martín-Cardoso, H.; Pesenti, M.; Gómez-Ariza, J.; Castillo, L.; Frouin, J.; Serrat, X.; Nogués, S.; Courtois, B.; Grenier, C.; et al. Integrative approach for precise genotyping and transcriptomics of salt tolerant introgression rice lines. Front. Plant Sci. 2022, 12, 797141. [Google Scholar] [CrossRef] [PubMed]
  13. Munns, R. Comparative physiology of salt and water stress. Plant Cell Environ. 2002, 25, 239–250. [Google Scholar] [CrossRef] [Green Version]
  14. Hussain, S.; Hussain, S.; Ali, B.; Ren, X.; Chen, X.; Li, Q.; Saqib, M.; Ahmad, N. Recent progress in understanding salinity tolerance in plants: Story of Na+/K+ balance and beyond. Plant Physiol. Biochem. 2021, 160, 239–256. [Google Scholar] [CrossRef] [PubMed]
  15. Jahan, N.; Zhang, Y.; Lv, Y.; Song, M.; Zhao, C.; Hu, H.; Cui, Y.; Wang, Z.; Yang, S.; Zhang, A.; et al. QTL analysis for rice salinity tolerance and fine mapping of a candidate locus qSL7 for shoot length under salt stress. Plant Growth Regul. 2020, 90, 307–319. [Google Scholar] [CrossRef] [Green Version]
  16. Flowers, T.J.; Koyama, M.L.; Flowers, S.A.; Sudhakar, C.; Singh, K.P.; Yeo, A.R. QTL: Their place in engineering tolerance of rice to salinity. J. Exp. Bot. 2000, 51, 99–106. [Google Scholar] [CrossRef]
  17. Chinnusamy, V.; Jagendorf, A.; Zhu, J.-K. Understanding and Improving Salt Tolerance in Plants. Crop Sci. 2005, 45, 437. [Google Scholar] [CrossRef] [Green Version]
  18. Wang, Z.; Cheng, J.; Chen, Z.; Huang, J.; Bao, Y.; Wang, J.; Zhang, H. Identification of QTLs with main, epistatic and QTL × environment interaction effects for salt tolerance in rice seedlings under different salinity conditions. Theor. Appl. Genet. 2012, 125, 807–815. [Google Scholar] [CrossRef]
  19. Rahman, M.A.; Thomson, M.J.; De Ocampo, M.; Egdane, J.A.; Salam, M.A.; Shah-E-Alam, M.; Ismail, A.M. Assessing trait contribution and mapping novel QTL for salinity tolerance using the Bangladeshi rice landrace Capsule. Rice 2019, 12, 63. [Google Scholar] [CrossRef] [Green Version]
  20. Gregoria, G.B.; Senadhira, D.; Mendoza, R.D. Screening Rice for Salinity Tolerance; Interantional Rice Research Institute: Manila, Philippines, 1997. [Google Scholar]
  21. Koyama, M.L.; Levesley, A.; Koebner, R.M.; Flowers, T.J.; Yeo, A.R. Quantitative trait loci for component physiological traits determining salt tolerance in rice. Plant Physiol. 2001, 125, 406–422. [Google Scholar] [CrossRef] [Green Version]
  22. Lin, H.X.; Zhu, M.Z.; Yano, M.; Gao, J.P.; Liang, Z.W.; Su, W.A.; Hu, X.H.; Ren, Z.H.; Chao, D.Y. QTLs for Na+ and K+ uptake of the shoots and roots controlling rice salt tolerance. Theor. Appl. Genet. 2004, 108, 253–260. [Google Scholar] [CrossRef]
  23. Lee, S.Y.; Ahn, J.H.; Cha, Y.S.; Yun, D.W.; Lee, M.C.; Ko, J.C.; Lee, K.S.; Eun, M.Y. Mapping QTLs related to salinity tolerance of rice at the young seedling stage. Plant Breed. 2007, 126, 43–46. [Google Scholar] [CrossRef]
  24. Ghomi, K.; Rabiei, B.; Sabouri, H.; Sabouri, A. Mapping QTLs for traits related to salinity tolerance at seedling stage of rice (Oryza sativa L.): An agrigenomics study of an Iranian rice population. OMICS 2013, 17, 242–251. [Google Scholar] [CrossRef] [PubMed]
  25. Sun, B.-R.; Fu, C.-Y.; Fan, Z.-L.; Chen, Y.; Chen, W.-F.; Zhang, J.; Jiang, L.-Q.; Lv, S.; Pan, D.-J.; Li, C. Genomic and transcriptomic analysis reveal molecular basis of salinity tolerance in a novel strong salt-tolerant rice landrace Changmaogu. Rice 2019, 12, 99. [Google Scholar] [CrossRef] [PubMed]
  26. Thomson, M.J.; de Ocampo, M.; Egdane, J.; Rahman, M.A.; Sajise, A.G.; Adorada, D.L.; Tumimbang-Raiz, E.; Blumwald, E.; Seraj, Z.I.; Singh, R.K.; et al. Characterizing the saltol quantitative trait locus for salinity tolerance in rice. Rice 2010, 3, 148–160. [Google Scholar] [CrossRef] [Green Version]
  27. Gregorio, G.B.; Islam, M.R.; Vergara, G.V.; Thirumeni, S. Recent advances in rice science to design salinity and other abiotic stress tolerant rice varieties. Sabrao J. Breed Genet. 2013, 45, 31–41. [Google Scholar]
  28. Collard, B.C.Y.; Jahufer, M.Z.Z.; Brouwer, J.B.; Pang, E.C.K. An introduction to markers, quantitative trait loci (QTL) mapping and marker-assisted selection for crop improvement: The basic concepts. Euphytica 2005, 142, 169–196. [Google Scholar] [CrossRef]
  29. Takagi, H.; Abe, A.; Yoshida, K.; Kosugi, S.; Natsume, S.; Mitsuoka, C.; Uemura, A.; Utsushi, H.; Tamiru, M.; Takuno, S.; et al. QTL-seq: Rapid mapping of quantitative trait loci in rice by whole genome resequencing of DNA from two bulked populations. Plant J. 2013, 74, 174–183. [Google Scholar] [CrossRef]
  30. Singh, V.K.; Khan, A.W.; Jaganathan, D.; Thudi, M.; Roorkiwal, M.; Takagi, H.; Garg, V.; Kumar, V.; Chitikineni, A.; Gaur, P.M.; et al. QTL-seq for rapid identification of candidate genes for 100-seed weight and root/total plant dry weight ratio under rainfed conditions in chickpea. Plant Biotechnol. J. 2016, 14, 2110–2119. [Google Scholar] [CrossRef] [Green Version]
  31. Pandey, M.K.; Khan, A.W.; Singh, V.K.; Vishwakarma, M.K.; Shasidhar, Y.; Kumar, V.; Garg, V.; Bhat, R.S.; Chitikineni, A.; Janila, P.; et al. QTL-seq approach identified genomic regions and diagnostic markers for rust and late leaf spot resistance in groundnut (Arachis hypogaea L.). Plant Biotechnol. J. 2017, 15, 927–941. [Google Scholar] [CrossRef] [Green Version]
  32. Clevenger, J.; Chu, Y.; Chavarro, C.; Botton, S.; Culbreath, A.; Isleib, T.G.; Holbrook, C.C.; Ozias-Akins, P. Mapping Late Leaf Spot Resistance in Peanut (Arachis hypogaea) Using QTL-seq Reveals Markers for Marker-Assisted Selection. Front. Plant Sci. 2018, 9, 83. [Google Scholar] [CrossRef] [PubMed] [Green Version]
  33. Hisano, H.; Sakamoto, K.; Takagi, H.; Terauchi, R.; Sato, K. Exome QTL-seq maps monogenic locus and QTLs in barley. BMC Genom. 2017, 18, 125. [Google Scholar] [CrossRef] [PubMed] [Green Version]
  34. Zhang, X.; Wang, W.; Guo, N.; Zhang, Y.; Bu, Y.; Zhao, J.; Xing, H. Combining QTL-seq and linkage mapping to fine map a wild soybean allele characteristic of greater plant height. BMC Genom. 2018, 19, 226. [Google Scholar] [CrossRef] [PubMed] [Green Version]
  35. Dong, Z.; Alam, M.K.; Xie, M.; Yang, L.; Liu, J.; Helal, M.M.U.; Huang, J.; Cheng, X.; Liu, Y.; Tong, C.; et al. Mapping of a major QTL controlling plant height using a high-density genetic map and QTL-seq methods based on whole-genome resequencing in Brassica napus. G3 2021, 11, jkab118. [Google Scholar] [CrossRef] [PubMed]
  36. Lu, H.; Lin, T.; Klein, J.; Wang, S.; Qi, J.; Zhou, Q.; Sun, J.; Zhang, Z.; Weng, Y.; Huang, S. QTL-seq identifies an early flowering QTL located near Flowering Locus T in cucumber. Theor. Appl. Genet. 2014, 127, 1491–1499. [Google Scholar] [CrossRef]
  37. Cao, M.; Li, S.; Deng, Q.; Wang, H.; Yang, R. Identification of a major-effect QTL associated with pre-harvest sprouting in cucumber (Cucumis sativus L.) using the QTL-seq method. BMC Genom. 2021, 22, 249. [Google Scholar] [CrossRef]
  38. Sheng, C.; Song, S.; Zhou, R.; Li, D.; Gao, Y.; Cui, X.; Tang, X.; Zhang, Y.; Tu, J.; Zhang, X.; et al. QTL-Seq and Transcriptome Analysis Disclose Major QTL and Candidate Genes Controlling Leaf Size in Sesame (Sesamum indicum L.). Front. Plant Sci. 2021, 12, 580846. [Google Scholar] [CrossRef]
  39. Zhang, C.; Badri Anarjan, M.; Win, K.T.; Begum, S.; Lee, S. QTL-seq analysis of powdery mildew resistance in a Korean cucumber inbred line. Theor. Appl. Genet. 2021, 134, 435–451. [Google Scholar] [CrossRef]
  40. Ramos, A.; Fu, Y.; Michael, V.; Meru, G. QTL-seq for identification of loci associated with resistance to Phytophthora crown rot in squash. Sci. Rep. 2020, 10, 5326. [Google Scholar] [CrossRef] [Green Version]
  41. Yaobin, Q.; Peng, C.; Yichen, C.; Yue, F.; Derun, H.; Tingxu, H.; Xianjun, S.; Jiezheng, Y. QTL-Seq Identified a Major QTL for Grain Length and Weight in Rice Using Near Isogenic F 2 Population. Rice Sci. 2018, 25, 121–131. [Google Scholar] [CrossRef]
  42. Kadambari, G.; Vemireddy, L.R.; Srividhya, A.; Nagireddy, R.; Jena, S.S.; Gandikota, M.; Patil, S.; Veeraghattapu, R.; Deborah, D.A.K.; Reddy, G.E.; et al. QTL-Seq-based genetic analysis identifies a major genomic region governing dwarfness in rice (Oryza sativa L.). Plant Cell Rep. 2018, 37, 677–687. [Google Scholar] [CrossRef] [PubMed]
  43. Arikit, S.; Wanchana, S.; Khanthong, S.; Saensuk, C.; Thianthavon, T.; Vanavichit, A.; Toojinda, T. QTL-seq identifies cooked grain elongation QTLs near soluble starch synthase and starch branching enzymes in rice (Oryza sativa L.). Sci. Rep. 2019, 9, 8328. [Google Scholar] [CrossRef] [PubMed] [Green Version]
  44. Lei, L.; Zheng, H.; Bi, Y.; Yang, L.; Liu, H.; Wang, J.; Sun, J.; Zhao, H.; Li, X.; Li, J.; et al. Identification of a Major QTL and Candidate Gene Analysis of Salt Tolerance at the Bud Burst Stage in Rice (Oryza sativa L.) Using QTL-Seq and RNA-Seq. Rice 2020, 13, 55. [Google Scholar] [CrossRef]
  45. Nubankoh, P.; Wanchana, S.; Saensuk, C.; Ruanjaichon, V.; Cheabu, S.; Vanavichit, A.; Toojinda, T.; Malumpong, C.; Arikit, S. QTL-seq reveals genomic regions associated with spikelet fertility in response to a high temperature in rice (Oryza sativa L.). Plant Cell Rep. 2020, 39, 149–162. [Google Scholar] [CrossRef]
  46. Thianthavon, T.; Aesomnuk, W.; Pitaloka, M.K.; Sattayachiti, W.; Sonsom, Y.; Nubankoh, P.; Malichan, S.; Riangwong, K.; Ruanjaichon, V.; Toojinda, T.; et al. Identification and Validation of a QTL for Bacterial Leaf Streak Resistance in Rice (Oryza sativa L.) against Thai Xoc Strains. Genes 2021, 12, 1587. [Google Scholar] [CrossRef] [PubMed]
  47. Netpakdee, C.; Mathasiripakorn, S.; Sribunrueang, A.; Chankaew, S.; Monkham, T.; Arikit, S.; Sanitchon, J. QTL-Seq Approach Identified Pi63 Conferring Blast Resistance at the Seedling and Tillering Stages of Thai Indigenous Rice Variety “Phaladum”. Agriculture 2022, 12, 1166. [Google Scholar] [CrossRef]
  48. Pannak, S.; Wanchana, S.; Aesomnuk, W.; Pitaloka, M.K.; Jamboonsri, W.; Siangliw, M.; Meyers, B.C.; Toojinda, T.; Arikit, S. Functional Bph14 from Rathu Heenati promotes resistance to BPH at the early seedling stage of rice (Oryza sativa L.) as revealed by QTL-seq. Theor. Appl. Genet. 2023, 136, 25. [Google Scholar] [CrossRef]
  49. Riangwong, K.; Aesomnuk, W.; Sonsom, Y.; Siangliw, M.; Unartngam, J.; Toojinda, T.; Wanchana, S.; Arikit, S. QTL-seq Identifies Genomic Regions Associated with Resistance to Dirty Panicle Disease in Rice. Agronomy 2023, 13, 1905. [Google Scholar] [CrossRef]
  50. Kim, S.-H.; Bhat, P.R.; Cui, X.; Walia, H.; Xu, J.; Wanamaker, S.; Ismail, A.M.; Wilson, C.; Close, T.J. Detection and validation of single feature polymorphisms using RNA expression data from a rice genome array. BMC Plant Biol. 2009, 9, 65. [Google Scholar] [CrossRef] [Green Version]
  51. Chutimanukul, P.; Kositsup, B.; Plaimas, K.; Buaboocha, T.; Siangliw, M.; Toojinda, T.; Comai, L.; Chadchawan, S. Photosynthetic responses and identification of salt tolerance genes in a chromosome segment substitution line of ‘Khao dawk Mali 105’ rice. Environ. Exp. Bot. 2018, 155, 497–508. [Google Scholar] [CrossRef]
  52. International Rice Research Institute. Standard Evaluation System for Rice; International Rice Research Institute: Los Banios, Philippines, 2013. [Google Scholar]
  53. Bonilla, P. RFLP and SSLP mapping of salinity tolerance genes in chromosome 1 of rice (Oryza sativa L.) using recombinant inbred lines. Philipp. Agric. Sci. 2002, 85, 68–76. [Google Scholar]
  54. Bolger, A.M.; Lohse, M.; Usadel, B. Trimmomatic: A flexible trimmer for Illumina sequence data. Bioinformatics 2014, 30, 2114–2120. [Google Scholar] [CrossRef] [Green Version]
  55. Patro, R.; Duggal, G.; Love, M.; Irizarry, R.A.; Kingsford, C. Salmon provideds fast and bias-aware quantification of transcript expression. Nat. Methods 2017, 14, 417–419. [Google Scholar] [CrossRef] [Green Version]
  56. Anders, S.; Huber, W. Differential expression analysis for sequence count data. Genome Biol. 2010, 11, R106. [Google Scholar] [CrossRef] [Green Version]
  57. Kim, T.-H.; Kim, S.-M. Identification of Candidate Genes for Salt Tolerance at the Seedling Stage Using Integrated Genome-Wide Association Study and Transcriptome Analysis in Rice. Plants 2023, 12, 1401. [Google Scholar] [CrossRef]
  58. De Leon, T.B.; Linscombe, S.; Subudhi, P.K. Identification and validation of QTLs for seedling salinity tolerance in introgression lines of a salt tolerant rice landrace “Pokkali”. PLoS ONE 2017, 12, e0175361. [Google Scholar] [CrossRef] [PubMed] [Green Version]
  59. Chen, T.; Zhu, Y.; Chen, K.; Shen, C.; Zhao, X.; Shabala, S.; Shabala, L.; Meinke, H.; Venkataraman, G.; Chen, Z.; et al. Identification of new QTL for salt tolerance from rice variety Pokkali. J. Agro. Crop Sci. 2020, 206, 202–213. [Google Scholar] [CrossRef]
  60. Quan, R.; Wang, J.; Hui, J.; Bai, H.; Lyu, X.; Zhu, Y.; Zhang, H.; Zhang, Z.; Li, S.; Huang, R. Improvement of salt tolerance using wild rice genes. Front. Plant Sci. 2017, 8, 2269. [Google Scholar] [CrossRef] [PubMed] [Green Version]
  61. Bañuelos, M.A.; Garciadeblas, B.; Cubero, B.; Rodríguez-Navarro, A. Inventory and functional characterization of the HAK potassium transporters of rice. Plant Physiol. 2002, 130, 784–795. [Google Scholar] [CrossRef] [Green Version]
  62. Lee, S.Y.; Ahn, J.H.; Cha, Y.S.; Yun, D.W.; Lee, M.C.; Ko, J.C.; Lee, K.S.; Eun, M.Y. Mapping of quantitative trait loci for salt tolerance at the seedling stage in rice. In Molecules & Cells; Springer Science & Business Media BV: Berlin/Heidelberg, Germany, 2006; Volume 21. [Google Scholar]
  63. Huang, X.; Kurata, N.; Wei, X.; Wang, Z.-X.; Wang, A.; Zhao, Q.; Zhao, Y.; Liu, K.; Lu, H.; Li, W.; et al. A map of rice genome variation reveals the origin of cultivated rice. Nature 2012, 490, 497–501. [Google Scholar] [CrossRef] [Green Version]
  64. Nguyen, T.T.; Dwiyanti, M.S.; Sakaguchi, S.; Koide, Y.; Le, D.V.; Watanabe, T.; Kishima, Y. Identification of a Saltol-Independent Salinity Tolerance Polymorphism in Rice Mekong Delta Landraces and Characterization of a Promising Line, Doc Phung. Rice 2022, 15, 65. [Google Scholar] [CrossRef] [PubMed]
  65. Ren, Z.-H.; Gao, J.-P.; Li, L.-G.; Cai, X.-L.; Huang, W.; Chao, D.-Y.; Zhu, M.-Z.; Wang, Z.-Y.; Luan, S.; Lin, H.-X. A rice quantitative trait locus for salt tolerance encodes a sodium transporter. Nat. Genet. 2005, 37, 1141–1146. [Google Scholar] [CrossRef] [PubMed]
  66. Kobayashi, N.I.; Yamaji, N.; Yamamoto, H.; Okubo, K.; Ueno, H.; Costa, A.; Tanoi, K.; Matsumura, H.; Fujii-Kashino, M.; Horiuchi, T.; et al. OsHKT1;5 mediates Na+ exclusion in the vasculature to protect leaf blades and reproductive tissues from salt toxicity in rice. Plant J. 2017, 91, 657–670. [Google Scholar] [CrossRef] [PubMed] [Green Version]
  67. Alam, R.; Sazzadur Rahman, M.; Seraj, Z.I.; Thomson, M.J.; Ismail, A.M.; Tumimbang-Raiz, E.; Gregorio, G.B. Investigation of seedling-stage salinity tolerance QTLs using backcross lines derived from Oryza sativa L. Pokkali. Plant Breed. 2011, 130, 430–437. [Google Scholar] [CrossRef]
  68. Chen, H.; Zhao, X.; Zhai, L.; Shao, K.; Jiang, K.; Shen, C.; Chen, K.; Wang, S.; Wang, Y.; Xu, J. Genetic Bases of the Stomata-Related Traits Revealed by a Genome-Wide Association Analysis in Rice (Oryza sativa L.). Front. Genet. 2020, 11, 611. [Google Scholar] [CrossRef] [PubMed]
  69. Zhou, Y.; Liu, J.; Liu, S.; Jiang, L.; Hu, L. Identification of the metallothionein gene family from cucumber and functional characterization of CsMT4 in Escherichia coli under salinity and osmotic stress. 3 Biotech 2019, 9, 394. [Google Scholar] [CrossRef]
  70. Romero, L.C.; Domínguez-Solís, J.R.; Gutiérrez-Alcalá, G.; Gotor, C. Salt regulation of O-acetylserine(thiol)lyase in Arabidopsis thaliana and increased tolerance in yeast. Plant Physiol. Biochem. 2001, 39, 643–647. [Google Scholar] [CrossRef]
  71. De Castro, O.; Innangi, M.; Menale, B.; Carfagna, S. O-acetylserine(thio)lyase (OAS-TL) molecular expression in Pancratium maritimum L. (Amaryllidaceae) under salt stress. Planta 2018, 247, 773–777. [Google Scholar] [CrossRef]
Figure 1. Evaluation of salt injury and analysis of Na+ and K+ content on Pokkali, KDML105, and RILs in SKC1Pokkali and SKC1KDML105 groups. (A) Evaluation of salt damage and (B) results of analysis of Na+/K+ content comparing Pokkali, KDML105, RILs in SKC1Pokkali, and SKC1KDML105 groups. (C) The visual damage observed in the parents, Pokkali (POK) and KDML105 (KD), and representatives of tolerant RILs with Pokkali allele of SKC1 (T-SKC1Pokkali) and representatives of sensitive RILs with KDML105 allele (S-SKC1Pokkali). (D) The visual damage observed in Pokkali, KDML, T-SKC1KDML105, and S-SKC1KDML105. ***, p ≤ 0.001; **, p ≤ 0.01; *, p ≤ 0.05; ns, not significant.
Agriculture 13 01596 g001
Figure 2. Salinity tolerance evaluation of two parents and the RIL (F7) population. (A). Symptoms of salt damage in representative RILs in salt-tolerant bulk (T-bulk) and in salt-sensitive bulk (S-bulk), compared with the tolerant (Pokkali: POK) and susceptible parents (KDML105: KD). (B) Frequency distribution of the salt injury score (SIS) in the RIL (F7) population. Dashed rectangle indicates plants selected to generate T-bulk and S-bulk.
Agriculture 13 01596 g002
Figure 3. Diagrams showing the SNP index of the T-bulk and S-bulk and the Δ(SNP index) across 12 rice chromosomes. (A) The SNP index diagrams for the salt-sensitive bulk (S-bulk). (B) The SNP index diagrams for the salt-tolerant bulk (T-bulk). (C) The Δ(SNP index) diagram. The plots of the moving windows of the average SNP index with a window size of 1 Mb and 250 kb steps are shown as blue lines in (A,B) and as a black line in (C). The blue and red line pairs in (C) correspond to the 95% and 99% confidence intervals, respectively. The dashed vertical bar in the figure also indicates the peak SNPs identified in the candidate regions.
Agriculture 13 01596 g003
Figure 4. Cluster analysis of differential gene expression. Heatmap of 34 genes showing differential expression between Pokkali and KDML105 at 24 and 72 h after salt treatment. Expression values for each gene (row) are normalized across all samples (columns) by a Z-score. Both column and row clustering were applied.
Agriculture 13 01596 g004
Table 1. Summary of whole-genome sequencing data of parental lines and tolerant and sensitive bulks.
SampleCleaned Reads (Million)Cleaned Base (Gb)% AlignmentAverage Depth Coverage (x)
Pokkali37.443.7494.2110.38
KDML10541.694.1694.0311.44
Tolerant bulk (17)340.0034.0090.6184
Sensitive bulk (16)320.0032.0090.0680
Table 2. Chromosome-wise distribution of common single nucleotide polymorphisms (SNPs) and Insertion-Deletion (InDels) between the two bulks.
ChrLength (bp)No. of SNPs
(Depth > 5)
No. of InDels
(Depth > 5)
SNP
(Depth > 15)
InDels
(Depth > 15)
143,270,923338,10074,01126,9898584
235,937,250287,76261,42318,5955970
336,413,819270,71558,49320,4105849
435,502,694235,86845,92724,1556498
529,958,434225,14945,59622,0705790
631,248,787254,02050,20814,1644220
729,697,621238,00745,75011,1043417
828,443,022231,65545,17718,0615523
923,012,720187,08536,24810,6462913
1023,207,287205,54437,96287522734
1129,021,106252,20145,85915,5674434
1227,531,856220,73741,05223,4096104
Total373,245,5192,946,843587,706213,92262,036
Table 3. Summary of the genomic region associated with salinity tolerance in rice.
QTLChr.QTL-Region (Mb)p99 ap95 bSNP Index (T-Bulk)SNP Index (S-Bulk)Δ(SNP Index)Reported QTLs/Genes
qST1.115.0–5.500.340.260.280.860.58
qST1.2141.0–41.500.340.260.100.650.55qDTS12 [57]; qSIS1.41 [58]; qSIS1 [59]; qST1.1 [60]; OsHAK2, OsHAK5, OsHAK6 [61]
qST2227.25–27.750.330.250.170.740.57qCHL2.20, qRTL2.26 [58]
qST3331.70–32.250.350.270.250.890.64qCHL3, qSES3 [26]; qNaK3.32 [58]
qST663.5–4.00.340.260.210.790.58qSIS6.5, qSHL6.5, qDWT6.5 [58]
qST8826.5–27.00.350.270.400.990.59qlogSIS8.24, qRTL8.27 [58]; qRSKC8 [59]
qST101017.75–18.250.340.260.270.870.60
qST11115.75–6.250.340.260.130.820.69
qST121226.50–27.000.340.260.160.750.58qSHL12.25 [59]
a p99 means confidence interval (99%); b p95 means confidence interval (95%).
Table 4. Candidate genes that contain nonsynonymous SNPs (missense variants) with contrasting SNP index in the two bulks.
QTLChrPosSNP Index T-BulkSNP Index
S-Bulk
Delta SNP IndexPokkaliKDML105SNP EffectStrandGene IDDescription
qST1.115,288,6780.450.940.49GAGCA > GTA-Os01g0197900γ-clade RNA-dependent RNA polymerase 3
15,313,6060.390.940.55CTGGG > GAG-Os01g0198000γ-clade RNA-dependent RNA polymerase 4
qST1.2141,055,7510.120.710.59TCTAC > CAT+Os01g0935300Similar to cullin-1
qST663,594,8040.240.850.62TAATT > TTT-Os06g0171600Membrane insertion protein, OxaA/YidC domain containing protein
63,687,6510.230.840.62TCATT > ACT+Os06g0173000Armadillo-type fold domain containing protein
qST101018,151,1300.360.930.57CTAGG > AAG-Os10g0481400Similar to Zinc finger, C3HC4 type family protein
qST11115,909,4290.100.860.76TCAAG > GAG-Os11g0213700Leucine-rich repeat, typical subtype containing protein
115,909,6450.150.900.76GCCAG > GAG-Os11g0213700Leucine-rich repeat, typical subtype containing protein
116,024,0330.000.330.33CTGTC > ATC-Os11g0215400Peptidase aspartic, catalytic domain containing protein.
116,063,8750.160.930.77CTGCG > GTG+Os11g0216000Pyruvate kinase
116,147,8200.170.890.72CAGTG > TTG-Os11g0218100Similar to RNApol24
qST121226,580,4100.150.860.71GAGAA > AAA+Os12g0622500Homologue of the archaeal topoisomerase VIA
1226,602,7810.140.870.74CTGCA > GTA+Os12g0622900Mov34/MPN/PAD-1 family protein
Table 5. Differentially expressed genes within the detected QTLs in Pokkali (PK) and KDML105 (KD). Expression level is expressed in units of transcript per million (TPM).
QTLChrLocus ID24 h after Salt Stress72 h after Salt StressDescription
PK (TPM)KD (TPM)p-ValuePK (TPM)KD (TPM)p-Value
qST1.11Os01g019940017.3324.67ns *26.3367.330.01Alpha/beta hydrolase family protein
1Os01g019990015.3316.33ns23.0012.330.00Phosphoribosylaminoimidazole carboxylase catalytic subunit
1Os01g02007004529.002433.33ns3203.331442.000.01Metallothionein-like protein (Tolerance to salinity and heavy metal stresses)
qST1.21Os01g09349003.6719.330.0130.0042.33nsEsterase PIR7A
1Os01g09412003.0011.33ns11.3343.330.00Glucan endo-1,3-beta-glucosidase GII precursor
qST2.12Os02g067480013.0034.670.0040.0042.67nsHomeodomain leucine zipper class IV transcriptional factor
qST33Os03g0767800128.33138.00ns171.33292.000.00Cold acclimation protein WCOR413-like protein
3Os03g07690502.0010.000.014.6714.330.01Similar to EMB2756
3Os03g07697002.332.67ns1.338.000.01Uncharacterised conserved protein
3Os03g076980016.3321.67ns21.6739.330.01Homeodomain-leucine zipper protein interfascicular fiberless 1 (Revoluta)
3Os03g077315099.00226.000.01110.00156.33ns40S ribosomal protein S29 (salt tolerance (TO:0006001))
3Os03g077360032.0072.330.0070.33113.000.00Kinesin, motor region domain containing protein
3Os03g077600056.0051.330.0174.0045.670.00Glucose-6-phosphate isomerase, cytosolic A
qST66Os06g017050038.33111.000.0066.00197.670.00RNA-binding protein-like
6Os06g017190050.6754.67ns59.00136.000.00WD40 subfamily protein, Salt stress
6Os06g01728003.009.67ns6.3318.000.01Alkaline alpha galactosidase 2
6Os06g017700049.33120.330.00114.33121.00nsCytochrome b-c1 complex subunit 8
6Os06g017900036.0042.33ns24.0051.330.00Glycoside hydrolase family 79
qST88Os08g05343500.0013.330.000.0016.000.00Cation cation antiporter
8Os08g05350000.005.670.000.005.000.00Cation cation antiporter
8Os08g05362000.002.33ns1.0011.670.01trans-membrane plant subgroup domain containing protein
8Os08g05396000.0074.330.000.6768.670.00Ankyrin repeat domain-containing protein 2
qST1010Os10g0478200469.00770.67ns917.00581.670.00NAD-dependent cytosolic malate dehydrogenase (CMDH)
10Os10g047890021.6744.33ns35.3365.670.01Multi-organelle localized protein, Control of leaf senescence, Disease resistance, Salt tolerance
10Os10g048145015.6723.33ns22.3342.000.01Zinc finger, C3HC4 type family protein
qST1111Os11g02106005.675.00ns13.004.670.01Alcohol dehydrogenase
11Os11g02121002.330.000.012.330.000.01Similar to NBS-LRR disease resistance protein family-4
11Os11g02137002.336.00ns6.3317.330.01Leucine-rich repeat, typical subtype containing protein
11Os11g02138003.678.67ns8.3322.670.00NBS-LRR disease resistance protein
11Os11g021510028.3311.330.0021.006.670.00Plant disease resistance response protein family protein
11Os11g02173008.3322.670.019.3314.00nsMevalonate and galactokinase family protein
qST1212Os12g0625000326.67156.000.00249.67161.00nsO-acetylserine(thiol)lyase, (stress trait (TO:0000164))
12Os12g06297000.679.000.002.6721.000.00Thaumatin-like protein precursor
12Os12g06302002.6713.000.0115.0072.670.00Thaumatin, pathogenesis-related family protein
* ns stands for “not significant”.
Disclaimer/Publisher’s Note: The statements, opinions and data contained in all publications are solely those of the individual author(s) and contributor(s) and not of MDPI and/or the editor(s). MDPI and/or the editor(s) disclaim responsibility for any injury to people or property resulting from any ideas, methods, instructions or products referred to in the content.

