Article

The Efficiency of China’s Agricultural Circular Economy and Its Influencing Factors under the Rural Revitalization Strategy: A DEA–Malmquist–Tobit Approach

1
School of Business, University of Queensland, Toowoomba, QLD 4350, Australia
2
FutureFront Interdisciplinary Research Institute, Wuhan 430074, China
3
School of Computer of Science and Technology, Huazhong University of Science and Technology, Wuhan 430074, China
4
School of Energy and Power Engineering, Huazhong University of Science and Technology, Wuhan 430074, China
*
Author to whom correspondence should be addressed.
Agriculture 2023, 13(7), 1454; https://doi.org/10.3390/agriculture13071454
Submission received: 19 June 2023 / Revised: 17 July 2023 / Accepted: 21 July 2023 / Published: 23 July 2023
(This article belongs to the Special Issue Sustainable Agriculture: Theories, Methods, Practices and Policies)

Abstract

:
In 2018, the Chinese government proposed the Rural Revitalization Strategy with the objective of bolstering economic development, social progress, and ecological protection in rural areas, thereby achieving rural modernization. This paper employs the Data Envelopment Analysis (DEA) method and the Malmquist index model to measure the efficiency and changes of the agricultural circular economy in 31 provinces and cities in China from 2017 to 2020. Using Tobit regression, we further examine the correlation analysis in the context of the rural revitalization policy. The study reveals that the efficiency of China’s agricultural circular economy continued to grow between 2017 and 2020. The policy of the rural revitalization strategy significantly impacts the efficiency of the agricultural circular economy. Government financial support has a significant positive influence on the efficiency of the agricultural circular economy. Based on the research findings, we proposed several constructive suggestions.

1. Introduction

1.1. China Agricultural Circular Economy

In the fifth plenary session of the 16th Central Committee of the Communist Party of China held in 2005, it was explicitly proposed that China should develop a circular agricultural economy. “An ecological agricultural model based on the circular economy contemplates the coordination of various production elements in rural areas such as soil, water, seeds, fertilizers, pesticides, electricity, oil, firewood, and grains, facilitating holistic planning, systemic conservation, and comprehensive development. This model encourages the recycling and extensive utilization of waste products from rural agricultural and livestock activities, as well as waste generated by urban industries and rural enterprises that use agricultural products as raw materials. This results in the transformation of waste into useful resources, generating significant economic, social, and environmental benefits. The model aims to continuously improve the productivity of various resources in agricultural production and the overall agricultural production capacity, leading to an increase in farmers’ income. The circular economy-oriented ecological agriculture promotes the acceleration of agricultural technological progress, facilitates the adjustment of rural industrial structures, transforms agricultural growth modes, expands the scale of modern agriculture, extends the industrial chain, and broadens the employment space in urban and rural areas [1]”. The development of this type of ecological agriculture not only produces safe and high-quality agricultural products, but is also beneficial for soil improvement and resource conservation, and promotes the sustainable development of agriculture.
In conclusion, the focus of the circular economy is the enhancement of production efficiency, that is, achieving the maximum output with the minimum input. The study by Wu et al. considers efficiency as a key factor in evaluating the level of the circular economy [2]. The inputs of the agricultural circular economy include the aforementioned production factors such as “soil, water, seeds, fertilizers, pesticides, electricity, oil, firewood, and grains”. Improving the efficiency of the agricultural circular economy implies increasing output while effectively controlling emissions and environmental pollution during the production process, thus achieving sustainable development. In their research on the agricultural circular economy, Xin et al. [3] evaluated the level of development of the agricultural circular economy by constructing efficiency models. Their research findings indicate an upward trend in the level of agricultural resource recycling, economic benefits, and ecological benefits, but the effect of controlling the reduction of agricultural resource usage is less than ideal. Ul Haq et al. employed efficiency as a measure to evaluate the circular economy efficiency of tea gardens in Turkey [4]. Similarly, when assessing the level of development of the circular economy in China, Fan et al. also centered their evaluation around the concept of efficiency [5]. Shahbaz and colleagues also utilized efficiency as a metric to study the level of agricultural circular economy in Pakistan [6].

1.2. Rural Revitalization Strategy

The Rural Revitalization Strategy of China is a significant strategic initiative proposed by the Chinese government in 2018. It aims to stimulate economic development, social progress, and ecological protection in rural areas, realizing the harmonious and integrated development of urban and rural regions. “Rural revitalization represents a comprehensive revitalization encompassing the rejuvenation of industries, talents, culture, ecology, and organizations. The overarching goal of implementing the rural revitalization strategy is the modernization of agriculture and rural areas. The primary guideline is to prioritize the development of agriculture and rural areas. The overall requirements are the prosperity of industries, ecological livability, civilized ethos, effective governance, and affluent life. The institutional guarantee is the establishment of a sound urban-rural integration development system, mechanism, and policy framework [7]”. The implementation of this strategy aims to resolve numerous issues faced by rural areas, such as population outflow, rural poverty, underdeveloped infrastructure, and the deterioration of the ecological environment.
To achieve this objective, the Chinese government has implemented a series of policies and measures. The first is the financial guarantee supported by policies, which includes direct fiscal expenditure, tax incentives, financial support, and land policies. These policies and measures aim to encourage participation in rural revitalization from all sectors and provide the necessary financial guarantees. From 2016 to 2019, the national general public budget allocated a cumulative expenditure of CNY 16.07 trillion related to agriculture and rural areas, with an average annual growth of 8.8%, higher than the average increase in the national general public budget expenditure [8]. In 2023, further increases were made to the scale of the central fiscal subsidies for promoting rural revitalization, with CNY 175 billion allocated, representing an increase of CNY 10 billion from the previous year [9]. These policies include the following:
Rural Infrastructure Construction: The government has increased its investment in rural infrastructure construction, including improvements in rural roads, water supply, electricity, and communication. This contributes to enhancing the accessibility of transportation and living conditions in rural areas, promoting industrial development, and facilitating employment and entrepreneurship among farmers [10,11].
Industrial Upgrading in Rural Areas: This pertains to facilitating the adjustment and transformation of the rural industrial structure and accelerating the modernization of agriculture on a large scale. In December 2018, the “Guidance of the State Council on Accelerating the Transformation and Upgrading of Agricultural Mechanization and Agricultural Machinery Equipment Industry” [12] was promulgated, emphatically stipulating the steady implementation of agricultural machinery purchase subsidy policies to maximize policy benefits. Moreover, the government has been encouraging the development of new business models, such as rural characteristic industries, modern agriculture, and rural e-commerce. The industrial upgrading also manifests in vigorously promoting the corporatization and industrialization of agriculture. In 2022, the Chinese government officially issued the “Notice of the State Council on Printing and Distributing the ‘14th Five-Year Plan’ for Promoting Modernization of Agriculture and Rural Areas”, explicitly proposing to accelerate the modernization process of agriculture and rural areas with Chinese characteristics [13].
Development of Social Undertakings: This strategy entails bolstering support for rural education, healthcare, culture, and other social undertakings to enhance public service levels in rural areas. This includes constructing rural schools, healthcare institutions, and cultural facilities; improving rural educational and medical conditions; and raising the educational level and quality of life of farmers. The government has also begun to adopt a service procurement approach, purchasing services such as sanitation, public legal assistance, public cultural activities, public sports programs, medical and health services, educational services, disability assistance, elderly care, and youth services, to support the development of the rural revitalization strategy [14].
Protection of Rural Ecological Environment: The government has intensified efforts towards the protection of the rural ecological environment and the promotion of greener and sustainable agricultural production methods [7]. These efforts encompass the advocacy for organic agriculture, ecological agriculture, and circular agriculture; strengthening of farmland water conservancy construction; improving the quality of the rural environment; and protecting the integrity and stability of rural ecosystems.

2. Literature Review and Objectives of This Paper

2.1. Research Related to Agricultural Policy and Efficiency

The foundation of the agricultural circular economy is predicated on the modernization of agricultural production. The primary objective of the rural revitalization strategy is to establish aesthetically pleasing, economically prosperous, and habitable rural communities, ultimately achieving rural modernization. However, the relationship between agricultural modernization and rural modernization, particularly the overlapping process where agricultural modernization expands into rural modernization, is inherently complex. This complexity can be attributed to the law of diminishing returns on land, as proposed by Malthus [15].
Contrasting the transition process from industrialization to urbanization, Scott [16] demonstrated that industrial modernization catalyzes the agglomeration of industrial elements, subsequently fostering urbanization. Urbanization, through its induced agglomeration of industrial elements and deepening division of labor, further stimulates industrialization, culminating in a mutually beneficial and reciprocally enhancing relationship between industrialization and urbanization. This premise is also validated by the research conducted by Hubendick [17] and others on the interplay between industrialization and urbanization.
The progression from agricultural socialization to rural modernization presents a different narrative. Agricultural modernization, which is an extension of industrial modernization, results in the agglomeration of industrial elements [18]. This trajectory, however, does not entirely align with the goals of agricultural modernization. For instance, while agricultural modernization enhances production efficiency, in accordance with Malthus’s law of diminishing returns, the dual action of diminishing returns and increasing efficiency inevitably results in a requisite reduction in the scale of inputs. This subsequently triggers a decrease in rural employment opportunities and an increase in unemployment rate [19]. Conversely, escalating the agriculture-related inputs may potentially lead to a decrease in production efficiency [20].
Although the law of diminishing returns was not traditionally accepted by mainstream economists in China, it has been increasingly recognized in recent years. Jiang and Wang [21] explored the relationships among industrialization, urbanization, and agricultural modernization in Jilin. They posited that the improvement in the level of agricultural modernization could facilitate the transfer of surplus labor, gradually enlarging the demand scale for agricultural means of production, and advancing the level of urbanization. However, the elevation of urbanization levels often signifies a decline in rural modernization. Additionally, Yao and Liu [22], in their research on China’s grain production, suggested that even in developing China, the law of diminishing returns is in effect. They assert that long-term growth in grain yield must be achieved through efficiency improvements.
Countries often adopt increased government investment and subsidies in their efforts to support agriculture, and rural revitalization strategies likewise emphasize government financial backing. Nevertheless, due to the law of diminishing returns and the effect of diminishing marginal returns, financial support faces potential risks of reducing production efficiency. For instance, de Jorge et al. found a correlation between the subsidies received by R&D companies and low efficiency in their study of Spanish manufacturing. They advised caution when using subsidies to stimulate enterprise innovation efficiency [23]. In China, Yao and Leng et al. [24] found that even within strategic emerging industries receiving strong government support and subsidies, fiscal subsidies had a significant inhibitory effect. They recommended adjustments in the direction of fiscal subsidies to enhance their benefits. Gao et al. [25] discovered that since China intensified fiscal and financial support in 2004, the direct effect of fiscal and financial support on agriculture has improved, but the spatial spillover effect turned from positive to negative. Kumbhakar and Lien [26] studied unbalanced panel data of Norwegian grain farms from 1991 to 2006, finding that agricultural subsidies negatively impacted agricultural production efficiency. According to the research by Guan Zhengfei et al., fiscal subsidies have a significant negative impact on agricultural productivity growth in the Netherlands, while debt, on the contrary, promotes productivity growth [27].

2.2. Research Objectives of This Paper

In conclusion, the development of China’s agricultural circular economy requires agricultural modernization, whereas the goal of the rural revitalization strategy is the modernization of rural areas. Theoretically, these two concepts are incompatible. Many scholars have turned their attention to this issue. However, the rural revitalization strategy, which began implementation in 2018 and was affected by the outbreak of COVID-19 in 2020, has had a relatively short duration of undisturbed execution. Consequently, studies analyzing its influence on the overall efficiency of China’s agricultural circular economy are rather limited. Much of the research remains at the qualitative level, with some focusing only on particular regions or specific dimensions.
This paper aims to fill this gap. Through the use of spatial econometrics, quantitative research and empirical analysis of the efficiency of the agricultural circular economy under the rural revitalization strategy are undertaken. The goals are as follows:
  • To measure and assess the efficiency of China’s agricultural circular economy under the rural revitalization strategy, and analyze its development trend.
  • To conduct empirical research on the correlation between the efficiency of the agricultural circular economy and related policies of rural revitalization.

3. Materials and Methods

3.1. Data and Sources

The Rural Revitalization Strategy in China was formally proposed in 2018. Therefore, in this study, panel data from 2017 to 2020 are chosen as the research basis to compare the changes in the efficiency of agricultural circular economy before and after the strategy. This study selects panel data from 31 provinces, municipalities, and autonomous regions out of all 34 provincial-level administrative units in China.
The three excluded provincial-level administrative units are Taiwan, Hong Kong, and Macau, for the following reasons:
  • There are significant differences in the formulation and implementation of agricultural policies.
  • The statistical calibers of relevant data vary significantly.
  • The agricultural economies of these three provinces and cities is relatively small.
Thus, including Taiwan, Hong Kong, and Macau in the research scope would interfere with the research results and violate the consistency assumption in the DEA method. We believe that the selected 31 provinces and cities can represent the overall picture of China’s agricultural circular economy.
Data source: China Statistical Yearbook, China Rural Statistical Yearbook.

3.2. Research Methodology

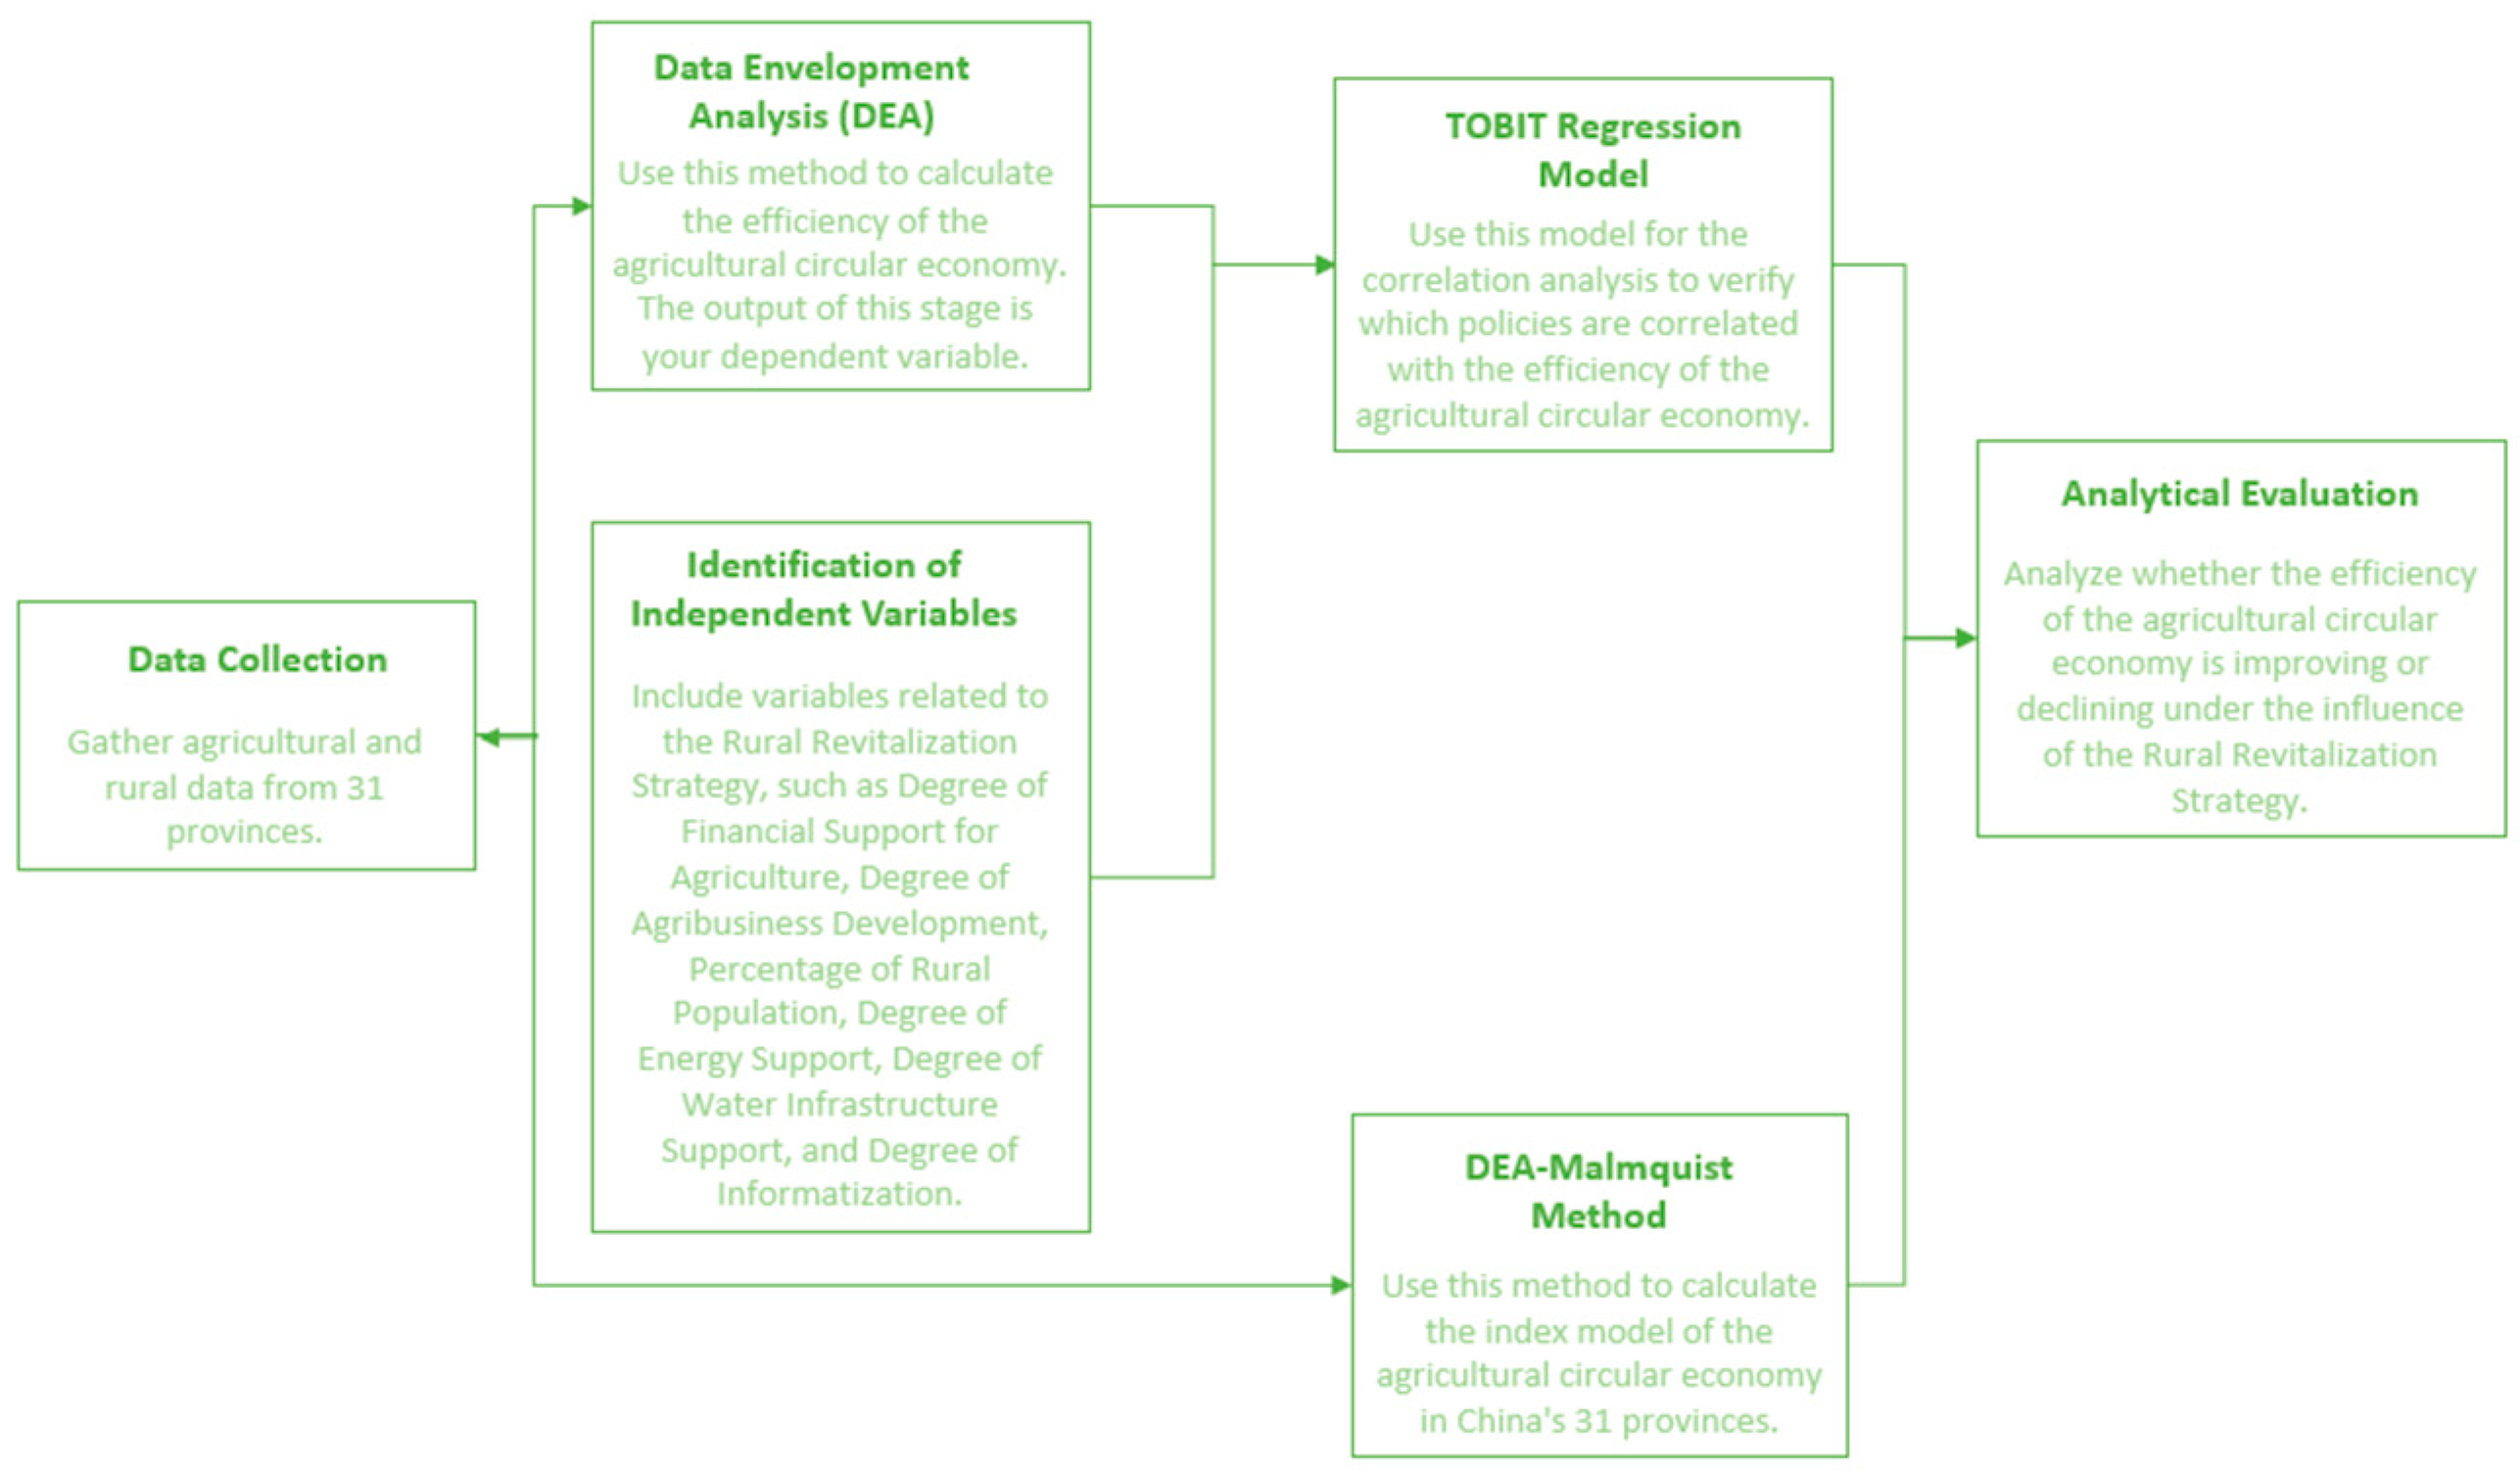
3.2.1. Research Process

The research process of this paper is as follows:
Data Collection: Gather agricultural and rural data from 31 provinces.
Data Envelopment Analysis (DEA): Use this method to calculate the efficiency of the agricultural circular economy. The output of this stage is the dependent variable.
Identification of Independent Variables: Include variables related to the Rural Revitalization Strategy, such as Degree of Financial Support for Agriculture, Degree of Agribusiness Development, Percentage of Rural Population, Degree of Energy Support, Degree of Water Infrastructure Support, and Degree of Informatization.
TOBIT Regression Model: Use this model for the correlation analysis to verify which policies are correlated with the efficiency of the agricultural circular economy.
DEA-Malmquist Method: Use this method to calculate the index model of the agricultural circular economy in China’s 31 provinces.
Analytical Evaluation: Analyze whether the efficiency of the agricultural circular economy is improving or declining under the influence of the Rural Revitalization Strategy.
The flowchart of the study is shown below, as shown in Figure 1:

3.2.2. Measuring the Efficiency of China’s Agricultural Circular Economy Using DEA Method

The Data Envelopment Analysis (DEA) model is a method for input–output analysis based on relative efficiency, proposed by Charnes et al. in 1978 [28]. It does not require the assignment of a priori weights to inputs and outputs, and can measure the relative efficiency of decision-making units (DMUs) with multiple inputs and outputs; as a result, it is widely used in efficiency assessment. The DEA model comprises several DMUs, each of which has the same input and output indicators. The efficiency frontier surface is determined through computation, which is then used to evaluate the efficiency of each DMU. Fundamental DEA models include the CCR model (named after its authors A. Charnes, W.W. Cooper, and E. Rhodes) [28] and the BCC model (named after its authors R.D Banker, A Charnes, and W.W. Cooper) [29]. The CCR model assumes constant returns to scale, and the resulting overall technical efficiency can be decomposed into pure technical efficiency and scale efficiency. On the other hand, the BCC model assumes variable returns to scale. The differences between the two are minor.
Currently, the DEA method is widely adopted in economic research, particularly in studies on the circular economy. Ul Haq et al. utilized the DEA method to evaluate the green economy efficiency of tea gardens in the Rize province of Turkey, establishing an efficiency model and identifying areas for improvement [4]. Zhao et al. applied the DEA method to analyze panel data from 286 prefecture-level cities in China, conducting a comprehensive study on China’s green economy and its driving factors [30]. Streimikis and others also specifically examined the use of the DEA method in the green economy and agricultural pollution scenarios, finding that the DEA method has a broad-ranging impact [31].
The development of the DEA method has led to various models. For instance, the super-efficiency model was proposed by Andersen and Petersen in 1993 to solve the issue of further comparisons when multiple DMUs are on the frontier (i.e., efficiency equals 1) in the DEA model [32]. In the super-efficiency model, the super-efficiency score of a DMU can exceed 1, making it especially suitable for comparative studies between different DMUs [33]. However, the super-efficiency model has some drawbacks: it can often result in infeasible solutions during computation [34]; the results may change due to alterations in the scale of input or output data, implying it does not have scale-invariance; and it violates the weak disposability assumption in DEA when calculating the super-efficiency score by excluding the DMU under assessment, which could affect the model’s theoretical consistency [35].
This study primarily analyzes the influence of policies on China’s agricultural circular economy efficiency at a macro level. Taking into account both the strengths and weaknesses, we chose not to adopt the super-efficiency model, but instead applied the classic basic CCR model to measure the agricultural circular economy efficiency of 31 provinces in China. The calculation formula for the input-oriented CCR model is as follows:
Minimize:
θ ε × ( Σ ( i = 1   t o   n )   s ^ _ i + Σ ( r = 1   t o   s )   s ^ + _ r )
Subject to:
Σ ( j = 1   t o   m )   λ _ j × x _ i j x _ i k + s ^ _ i = 0   f o r   a l l   i
Σ ( j = 1   t o   m )   λ _ j × y _ r j y _ r k s ^ + _ r = 0   f o r   a l l   r
Σ ( j = 1   t o   m )   λ _ j = 1
λ _ j     0   f o r   a l l   j
s ^ _ i     0   f o r   a l l   i
s ^ + _ r     0   f o r   a l l   r
In the above formulation:
θ represents the efficiency score to be evaluated.
x_ij is the ith input of the jth DMU.
y_rj is the rth output of the jth DMU.
λ_j are the decision variables, representing the weights for constructing a virtual decision-making unit (VDMU).
s^-_i are the slack variables for inputs, representing the efficiency loss of the ith input.
s^+_r are the slack variables for outputs, representing the efficiency gain of the rth output.
ε is a non-Archimedean infinitesimal, employed to ensure the resolution of the multiple-objective linear programming problem.
The aim of this model is to minimize the efficiency score (θ) and the sum of all slack variables for inputs/outputs. The constraints ensure that the efficiency loss of all inputs and outputs for all DMUs does not exceed their actual values in the evaluation of DMU_k. In addition, all weights (λ) and slack variables should be greater than or equal to zero.

3.2.3. Assessment of Changes in the Efficiency of China’s Agricultural Circular Economy from 2017–2020 Using the DEA–Malmquist Index Model

The CCR model can only evaluate the efficiency of multiple DMUs within a single period or the efficiency of a single DMU across multiple periods. Each instance of the CCR model is a relative measure; hence, CCR models from different periods cannot be directly compared. Swedish economist and statistician Sten Malmquist proposed the Malmquist index for analyzing consumer changes over time [36]. By 1982, Caves et al. first proposed the Malmquist Total Factor Productivity Index (referred to as the Malmquist TFP index) [37]. They defined the total factor productivity index using a Malmquist input or output function. In 1992, Färe et al. developed a nonparametric (linear programming) method for calculating the Malmquist productivity index to evaluate the growth of total factor productivity [38]. As the Malmquist index can better analyze panel data, it can reflect the dynamic changes in relative efficiency at different periods [39], measure dynamic continuously changing characteristics, and analyze efficiency changes more effectively. The DEA–Malmquist model has been widely applied in various fields, especially in the construction of efficiency evaluation systems [40,41,42].
This paper employs the Malmquist index model to evaluate changes in the efficiency of China’s agricultural circular economy. The Malmquist index model can evaluate multiple DMUs across multiple periods, thereby deriving the change index for total factor productivity (TFPCH). TFPCH is used to measure the dynamic trend of total factor productivity (TFP) of a DMU from time t to time t + 1, using a non-parametric distance function, that is, the ratio of distance functions before and after the two periods.
M t = D t ( X t + 1 , Y t + 1 ) D t ( X t , Y t )
M t + 1 = D t + 1 ( X t + 1 , Y t + 1 ) D t + 1 ( X t , Y t )
The expression for TFPCH is derived from the square root of the product of M t and M t + 1 , denoted as M t , t + 1 , and its expression form is as follows:
T F P C H = M t , t + 1 = D t ( X t + 1 , Y t + 1 ) D t ( X t , Y t ) × D t + 1 ( X t + 1 , Y t + 1 ) D t + 1 ( X t , Y t )
If TFPCH > 1, this implies an increase in the level of total factor productivity from period t to t + 1; if TFPCH = 1, it signifies no change in the level of total factor productivity from period t to t + 1; if TFPCH < 1, this indicates a decline in the level of total factor productivity from period t to t + 1.
The total factor productivity index (TFPCH) can further be decomposed into the product of the index of technical efficiency change (EFFCH) and the index of technological progress (TECHCH):
T F P C H = E f f c h × T e c h c h = D t + 1 ( X t + 1 , Y t + 1 ) D t ( X t , Y t ) × D t X t + 1 , Y t + 1 D t + 1 X t + 1 , Y t + 1 × D t X t , Y t D t + 1 X t , Y t  

3.2.4. Study of the Factors Influencing the Efficiency of China’s Agricultural Circular Economy Using Tobit Regression Model

Correlation research aims to determine whether there is a mutual connection between two or more sets of data, and to carry out a quantitative analysis of any potential links. The most common method is regression analysis. There are many methods of regression analysis, and this study primarily analyzes the correlation between the efficiency of the agricultural circular economy and the policy of the rural revitalization strategy. The dependent variable chosen, i.e., the variable to be explained, is the comprehensive efficiency of the agricultural circular economy calculated by the DEA method, whose value is between 0 and 1 [43]. Therefore, this study will employ the Tobit regression model.
The Tobit regression model was originally proposed by economist James Tobin in 1958, from which it derived its name [44]. The Tobit regression model is a type of linear regression model characterized by the truncation phenomenon in its dependent variable. Truncation refers to the inability to observe certain values, i.e., these values are restricted within a certain range. The Tobit regression model can transform such truncated data into a probability model, thereby statistically analyzing truncated data [45]. The mathematical formula for the Tobit model is as follows:
Firstly, we define a latent variable y*, representing the true but unobserved value of the observed variable y. We assume that y* follows a linear regression model:
y * = X β + ε
In this, y* is a continuous latent variable, X is a matrix containing independent variables, β represents regression coefficients, and ε is the error term. Next, we define the observed variable y as follows:
y = m a x ( 0 ,   y * )
This equation implies that if y* is less than or equal to 0, the observed y value is 0; otherwise, it equals y*. Next, to take truncation into account, a truncation variable c is introduced. If y* is less than the truncation point c, the observed y value is c; otherwise, it equals y*. This can be represented as:
y = m a x ( c ,   y * )
The mathematical formula for the Tobit model encompasses both a linear regression model and the treatment of the observed value truncation. Through methods such as maximum likelihood estimation, parameters can be estimated and inferences made in the Tobit model.
The Tobit model offers the following advantages: it takes into account the impact of truncated data and can effectively handle issues with such data; it uses the maximum likelihood estimation method to estimate parameters, which provides high estimation accuracy and credibility. There are also some drawbacks to the Tobit regression model: the model assumes that the error term follows a normal distribution, so it may not be applicable for data with a skewed distribution.
The DEA–Tobit combination method is extensively employed in research within operations research, econometrics, and management science. Aldieri et al. utilized the DEA-Tobit method to study the energy economic policies of 136 countries, providing beneficial recommendations for energy policy modeling [46]. Shuai et al. applied the DEA–Tobit method to simulate the role of environmental regulations in China’s green economy [47]. Dalei et al. examined the efficiency of refining in India using the DEA–Tobit method [48]. The logical reasoning behind the DEA–Tobit method is quite clear: it initially uses the DEA method to calculate the “outcome”, i.e., the level of efficiency, and then applies the Tobit model to test associated factors or “causes”. This closed-loop research process has led to its widespread application.

4. Results

4.1. Results of the Study on the Efficiency of Agricultural Circular Economy in 31 Provinces and Cities in China

1. Input and output indicators
In constructing the DEA-CCR model for agricultural circular economic efficiency, we select the number of rural personnel in each province and city to represent human capital input. The quantity of fertilizer applied, the amount of pesticide used, and the volume of diesel consumed represent the physical inputs. The area of crops sown serves as a representation of land input. On the output side, the total output value of agriculture, forestry, animal husbandry, and fishery is selected as an indicator of total agricultural income, while per capita disposable income in rural areas represents individual rural income. The inputs and outputs are summarized in Table 1.
It is worth noting that a more reasonable model for agricultural circular economy efficiency should include certain undesired output indicators, such as the amount of wastewater discharged and air pollution. However, the data collection poses certain challenges. The pollutant emission data for each province or city cannot be readily distinguished from data for industrial or agricultural emissions, necessitating further analysis. Secondly, agricultural economic efficiency itself implies achieving more output with less pesticide, diesel, and fertilizer use. Reducing these inputs often correlates with less pollutant emissions. Therefore, we did not choose undesired output indicators such as pollutant emissions when selecting input and output indicators.
This study employs DEARUN software to compute the CCR model of agricultural circular economic efficiency for 31 provinces and cities across China over four periods from 2017 to 2020. In the CCR model results, “crste” represents overall efficiency, “vrste” signifies pure technical efficiency, and “scale” denotes scale efficiency. A value of 1 for these three elements indicates DEA efficiency, suggesting a relatively ideal state. “Return of scale” represents scale returns, where a value of “CRS” signifies constant returns to scale for the corresponding province or city, “IRS” represents increasing returns to scale, and “DRS” denotes decreasing returns to scale.
The pure technical efficiency is presented in Table 2, the scale efficiency is shown in Table 3, the scale returns are displayed in Table 4, and the overall efficiency is summarized in Table 5.

4.2. Empirical Study of the Factors Influencing the Efficiency of Agricultural Circular Economy

This paper carries out an empirical study of agricultural circular economic efficiency using the Tobit model. The dependent variable is the overall technical efficiency value of the agricultural circular economy for the 31 provinces and cities computed earlier. The independent variables are selected considering the key policies of the rural revitalization strategy and the ease of data accessibility, with the following variables chosen. As the dependent variable is a dimensionless efficiency value, the selected independent variables are also processed for dimension lessness:
Degree of financial support for agriculture: This represents the direct financial support from the government, calculated as the ratio of expenditure on agriculture, forestry, and water to the general public budget expenditure for each province and city (Supplementary Table S1).
Degree of agribusiness: This represents the scale and industrial transformation of agricultural production, calculated as the ratio of the number of agricultural legal entities to the total number of legal entities in each province and city (Supplementary Table S2). The data on the number of agricultural legal entities for each province in 2018 are missing and are supplemented using linear interpolation.
Percentage of rural population: This represents the direction of the flow of human resources, calculated as the ratio of the rural population to the total population in each province and city (Supplementary Table S3).
Degree of energy support: This represents the policies in the aspect of energy, which is computed as the ratio of electricity usage in rural areas to the total electricity usage in each province and city (Supplementary Table S4).
Degree of water support: This represents the supportive capacity of water infrastructure to agricultural production and to some extent reflects the effort in building agricultural water facilities. It is calculated as the ratio of the area of irrigated arable land to the total area of arable land in each province and city in a given year (Supplementary Table S5).
Degree of informatization: This represents the level of informatization in rural areas. It is calculated as the ratio of the number of Internet access point in the rural areas of each province and city to the total number of Internet access point in that province and city in a given year (Supplementary Table S6).
Using the degree of financial support for agriculture, the degree of energy support, the degree of water support, the degree of informatization, the degree of agribusiness, and the percentage of rural population, a total of six variables as independent variables, and the overall technical efficiency as the dependent variable for Tobit regression analysis, it can be seen from the table above that the model formula is:
Comprehensive Efficiency = 1.179 + 0.993 × Degree of Financial Support for Agriculture—0.043 × Degree of Energy Support—0.157 × Degree of Water Infrastructure Construction + 0.111 × Degree of Informatization—1.044 × Degree of Agribusiness—0.665 × Percentage of Rural Population.
In this paper, SPSSAU software was used to construct the Tobit model, and the results of the likelihood ratio test are as follows.
As seen in Table 6, the likelihood ratio test result of this model is p < 0.05, indicating that the null hypothesis is rejected, meaning that the selected independent variables in this model are valid and the construction of the model is meaningful. The Akaike Information Criterion (AIC) is a standard proposed by the Japanese statistician Hirotugu Akaike in 1974 to measure the goodness of fit of statistical models [49]. The Bayesian Information Criterion (BIC) was proposed by Schwarz in 1978, similar to AIC, and is used to prevent overfitting caused by excessive model complexity during model selection [50]. The relatively small AIC and BIC values in the likelihood ratio test of this model indicate a good relative representativeness of the model.
The final results of the Tobit model are presented in Table 7.

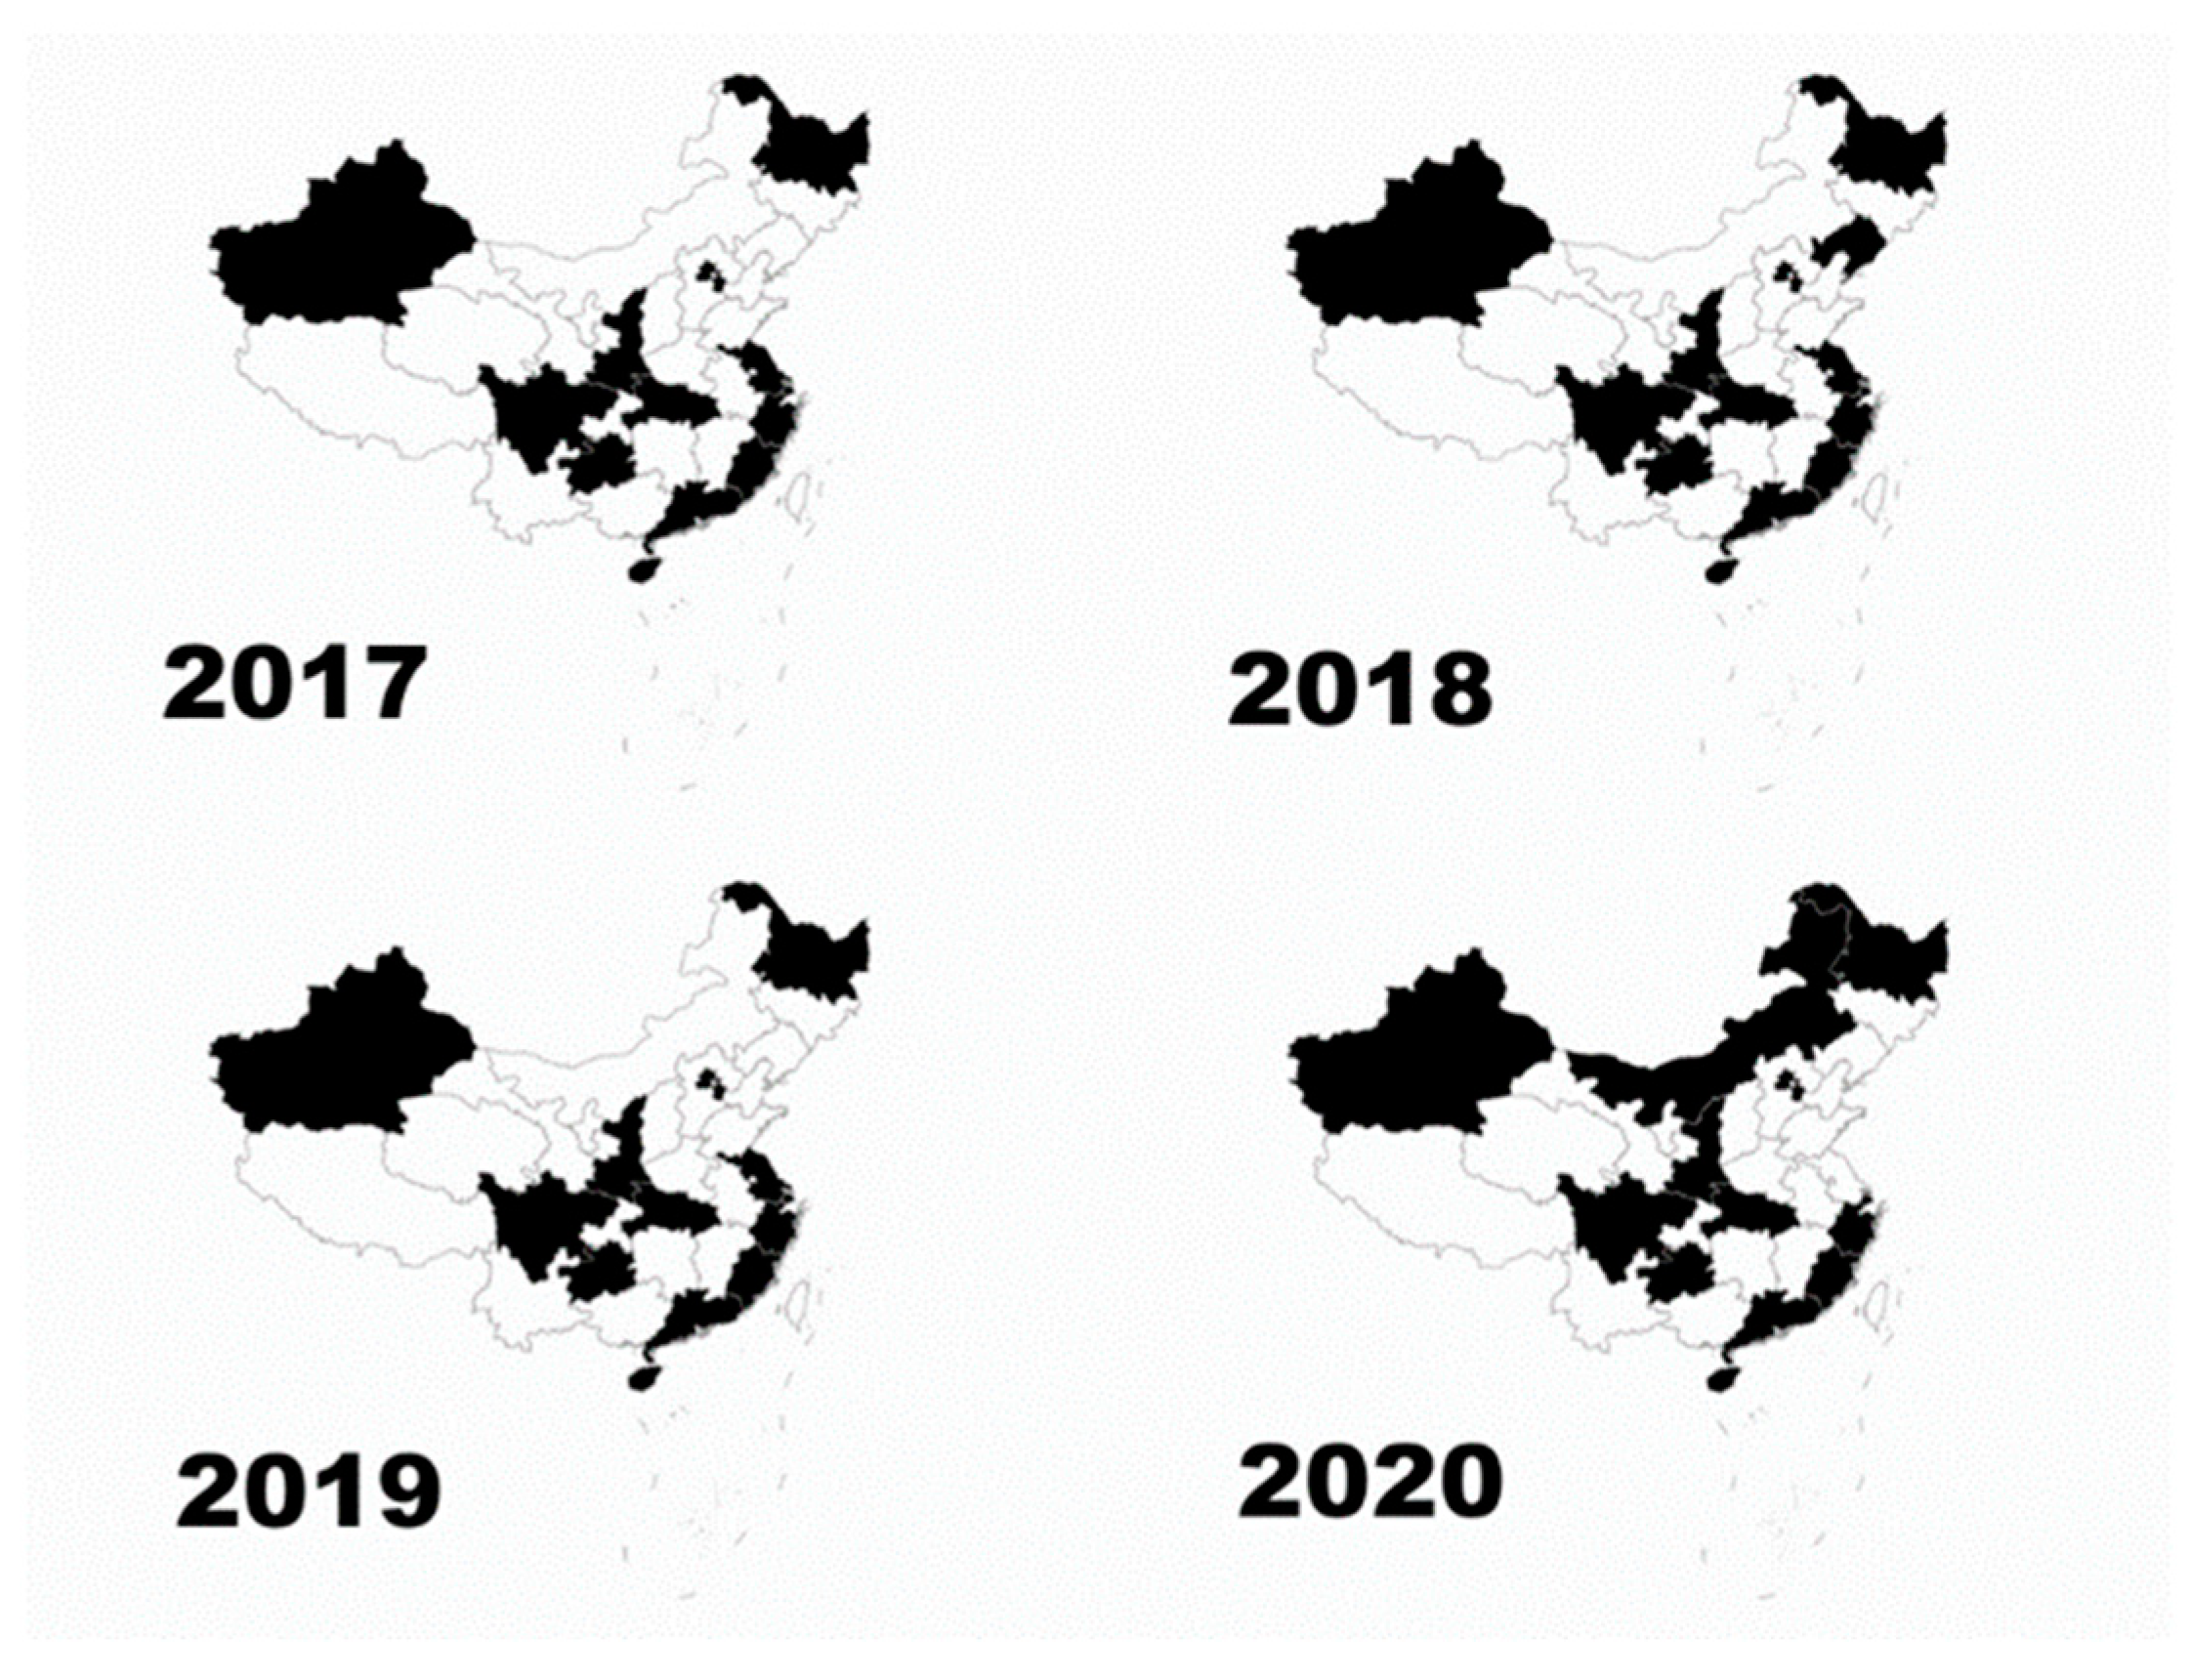
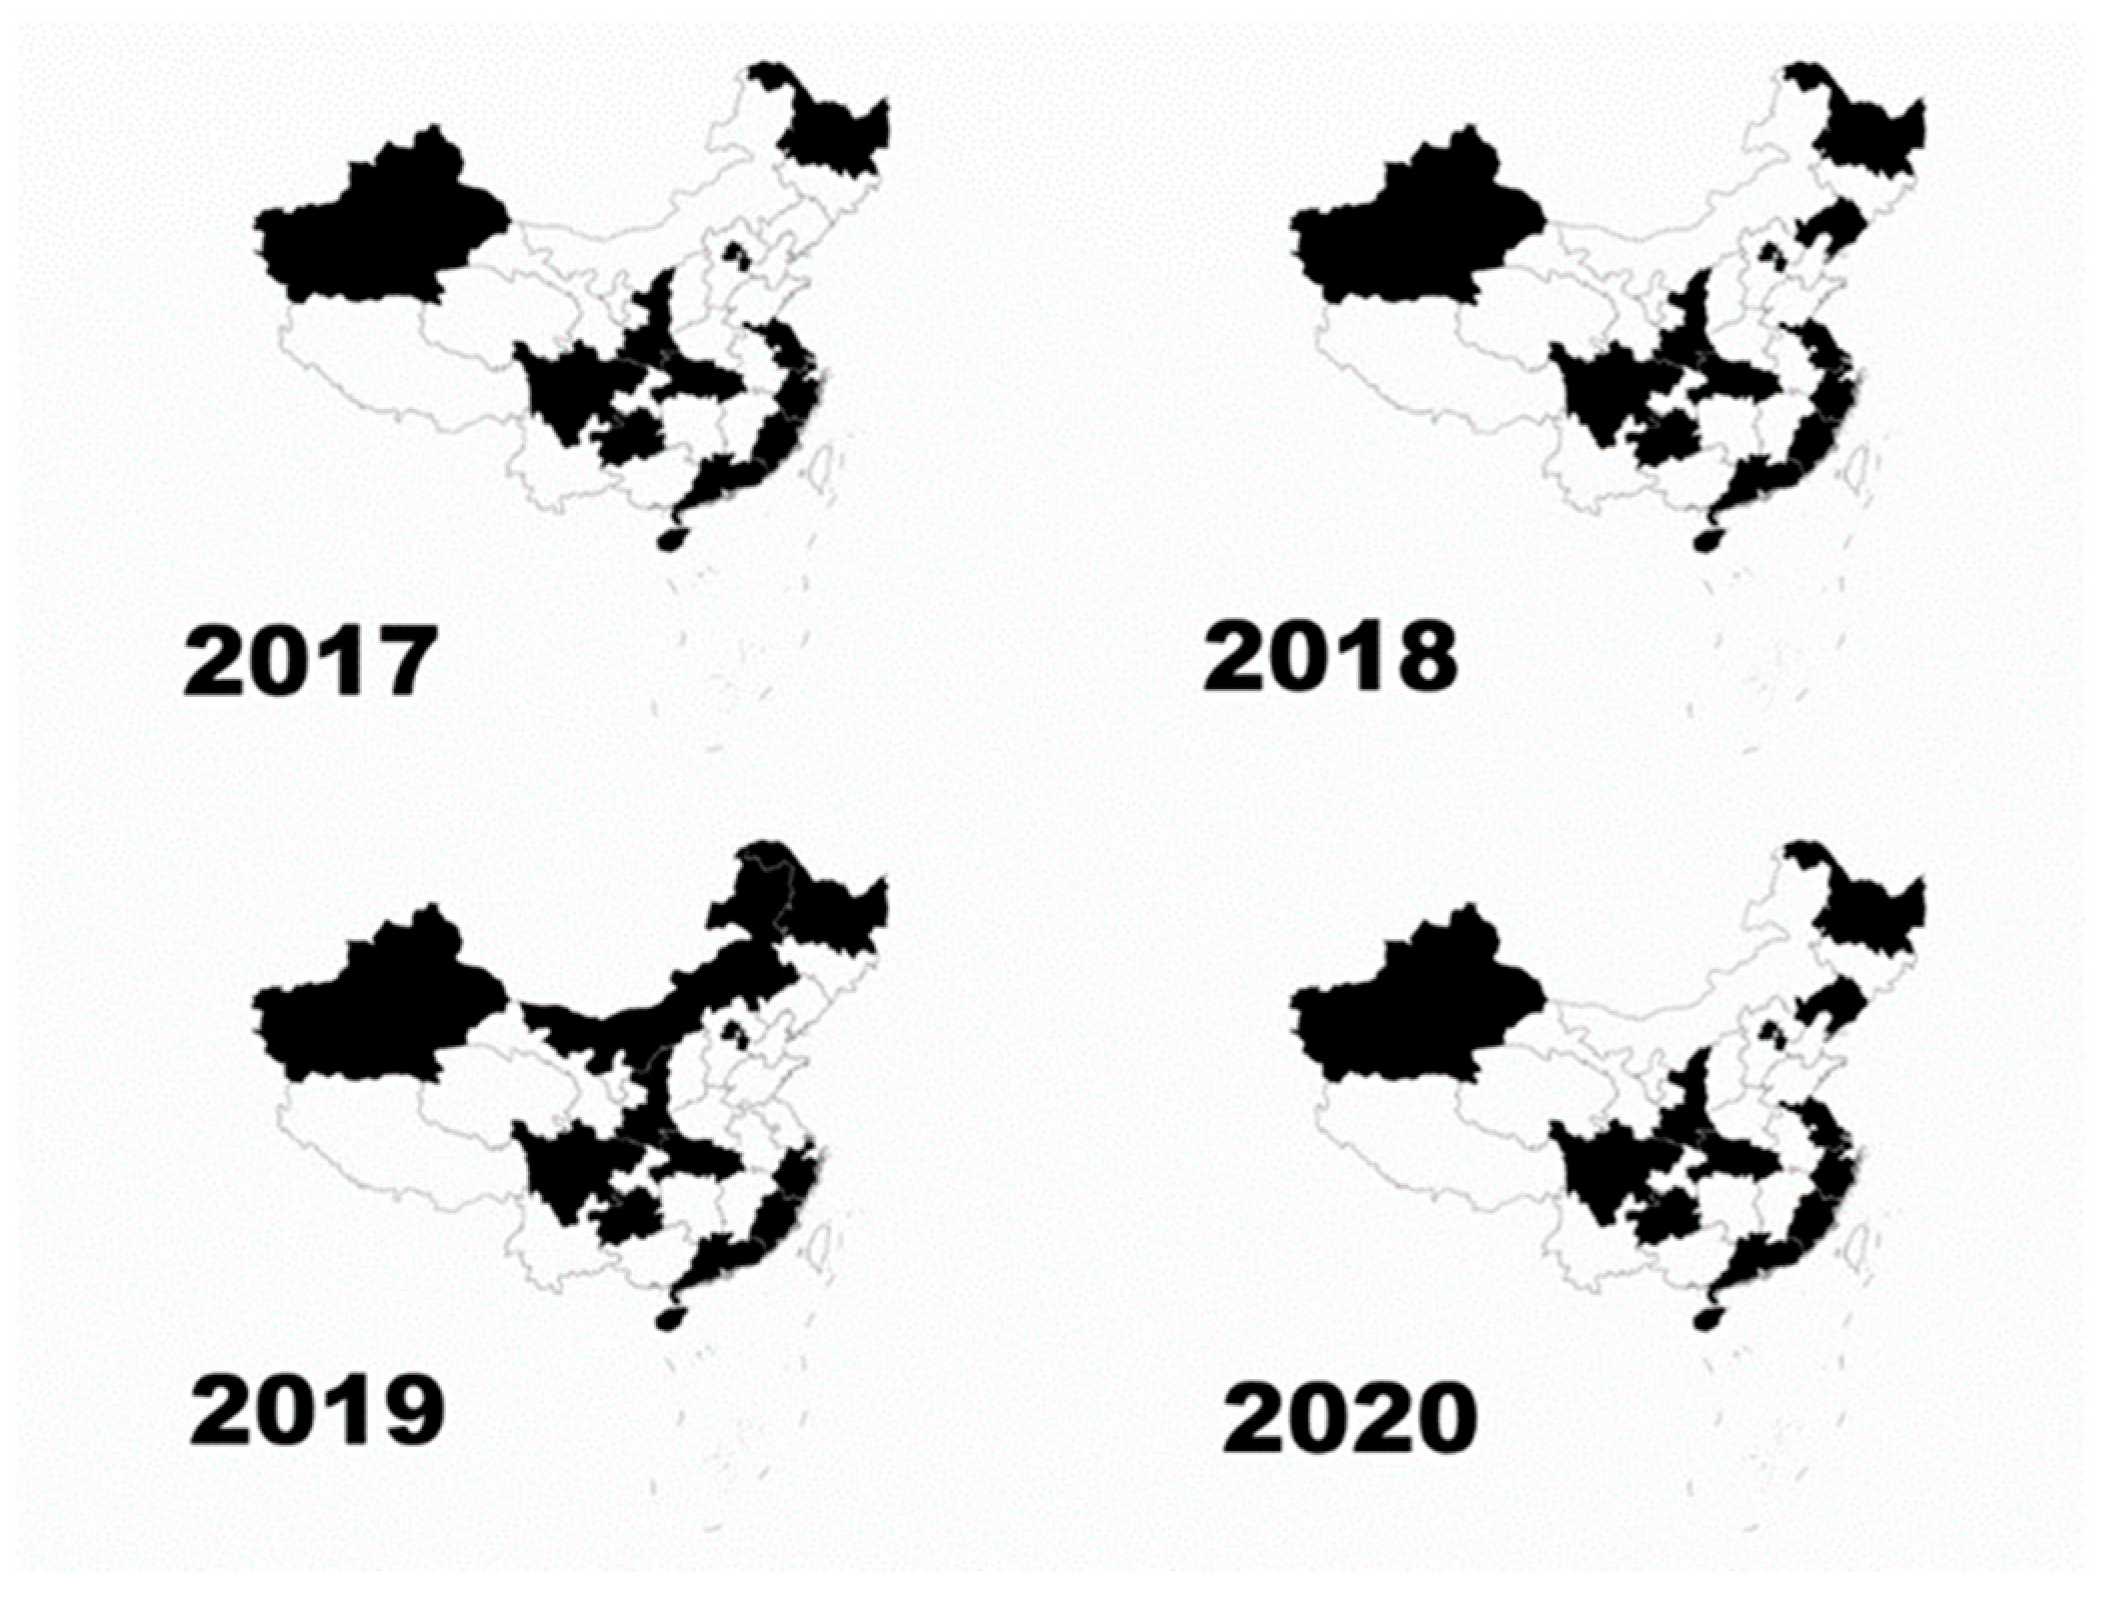
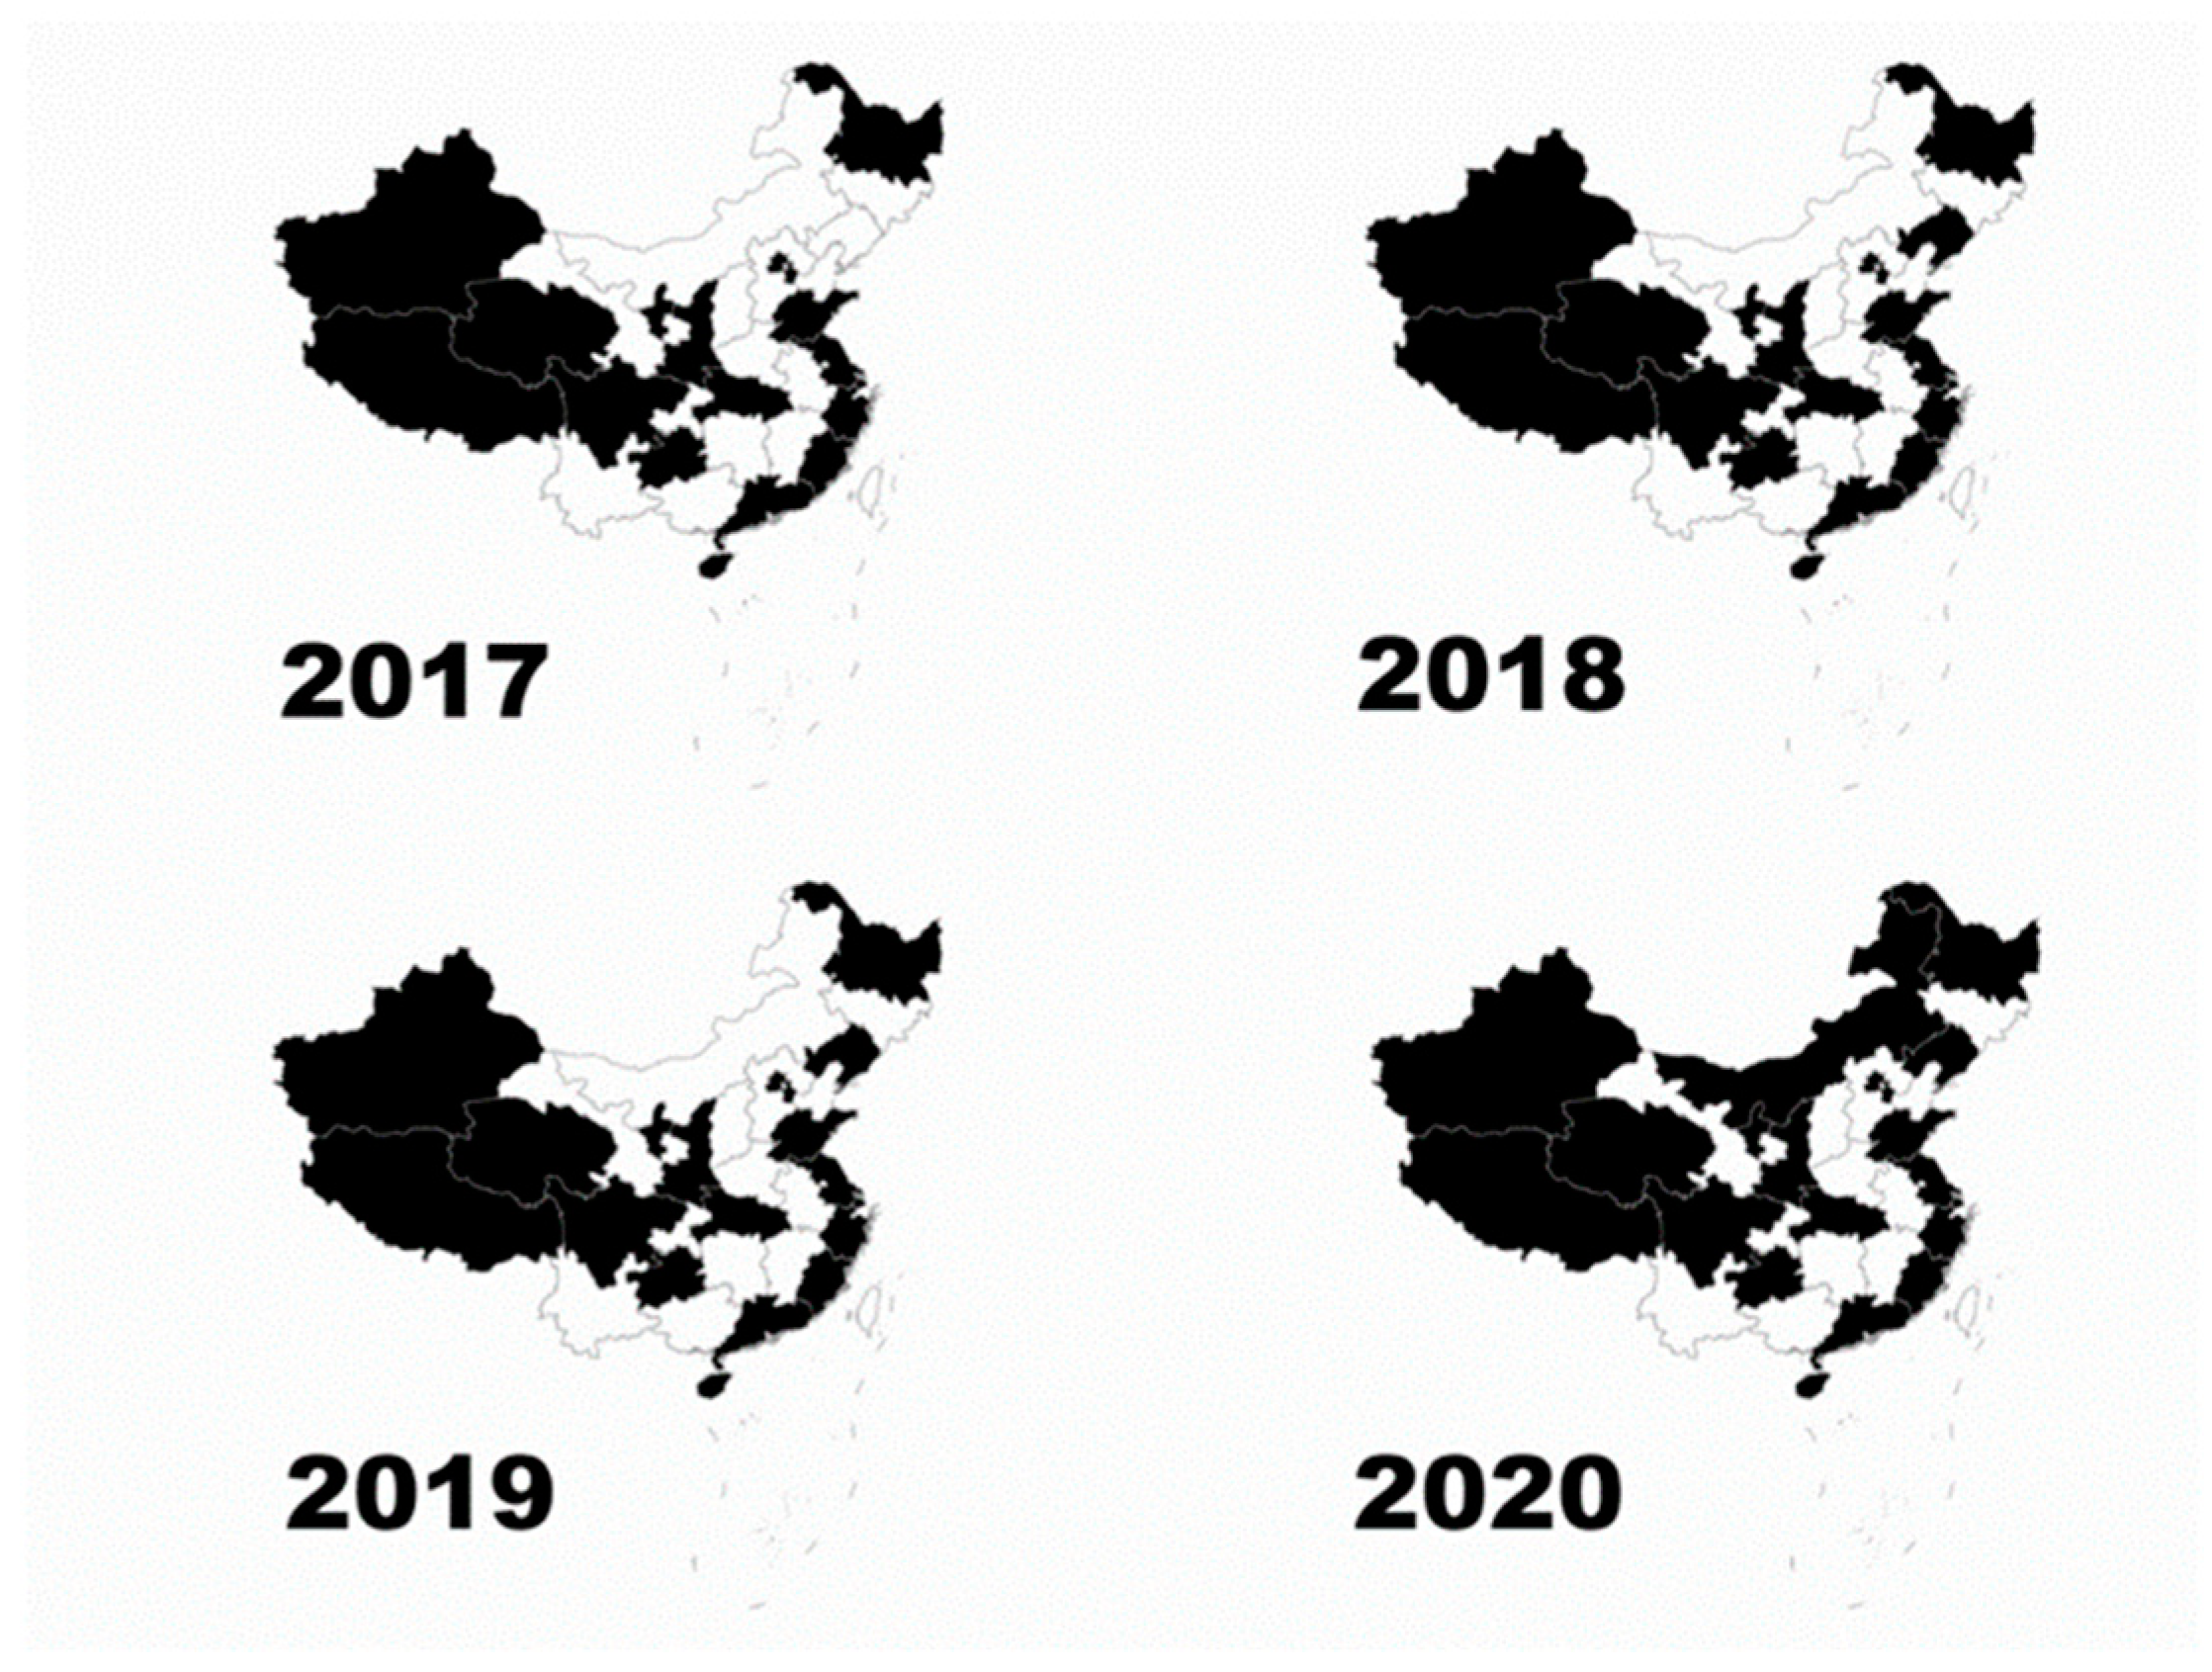
4.3. Study on the Change Trend of Efficiency of Agricultural Circular Economy

The CCR model of the circular economy in agriculture across China’s 31 provinces and cities, as previously calculated, is applicable only for efficiency comparison among these provinces and cities within the same period. CCR models across different periods are not directly comparable; for instance, efficiency values from 2017 cannot be compared directly to those from 2018. To study the changing trends in the efficiency of the circular economy in agriculture over different periods, the Malmquist index model must be employed. This paper continues to use the indicators and data applied in the construction of the CCR model for the circular economy in agriculture across China’s 31 provinces and cities. The DEARUN software was utilized to construct CCR–Malmquist adjacent reference models for three periods—2017–2018, 2018–2019, and 2019–2020—aiming to investigate the changing trends in the efficiency of the circular economy in agriculture across China’s 31 provinces and cities under the rural revitalization strategy.
The elements in the Malmquist index model include: “Effch”, which represents the change in technical efficiency; “Techch”, the change in technological progress; “Pech”, the change in pure technical efficiency; “Sech”, the change in scale efficiency; and “Tfpch”, the change in total factor productivity. A value greater than 1 in any of these indicators implies an improvement compared to the previous period. As can be seen from Table 8, all “Tfpch” values in the CCR–Malmquist index model across three periods from 2017 to 2020 exceed 1, indicating that the total factor productivity of the circular economy in agriculture across China’s 31 provinces and cities continuously improved during this period.

5. Discussion

5.1. Agri-Circular Economy Efficiency Is Significantly Affected by China’s Rural Revitalization Strategy

The Tobit model of Table 7 is plotted as a forest diagram in Figure 2.
The regression coefficient of degree of financial support for agriculture is 0.993, showing significance at the 0.05 level (z = 2.109, p = 0.035 < 0.05), indicating that degree of financial support for agriculture has a significant positive effect on the efficiency of the circular economy in agriculture. Jiao and Liu [51] confirmed a significant positive impact of fiscal expenditure on agricultural production efficiency in northeastern China through analysis of panel data from 1971 to 2007. Chen et al. [52] also showed that fiscal expenditure significantly positively affected the efficiency of Henan’s agricultural circular economy, following research on the province’s panel data from 2013 to 2019. Zhou et al. [53], in their study using the DEA method, suggested that the government should not only strengthen fund management but also expand the scale of fiscal support for agriculture. Wei et al. analyzed panel data from 30 provinces and cities from 2003 to 2011, and similarly concluded that fiscal expenditure supporting agricultural production and assisting agriculture had a significant positive effect on agricultural modernization [54].
The regression coefficient for the degree of energy support is −0.043, but it does not show significance (z = −0.427, p = 0.669 > 0.05), indicating that the degree of energy support does not impact the technical efficiency.
The regression coefficient for the degree of water support is −0.157, showing significance at the 0.05 level (z = −2.162, p = 0.031 < 0.05), indicating that the degree of water support has a significant negative effect on the technical efficiency. The rural revitalization strategy’s policy on water support is beneficial to the development of the agricultural circular economy in the long run. However, in the short term, a large amount of investment in water construction can directly crowd out some input resources. Therefore, the construction of agricultural water infrastructure is necessary, but its impact on agricultural economic efficiency is not necessarily positive. Yan et al. [55] showed that rural water resources in China face problems such as weak rural water infrastructure, uneven spatial and temporal distribution of rural water resources, and low investment efficiency, with the investment efficiency of China’s rural water supply decreasing by an average of 1.2% from 2011 to 2015. When Wang et al. [56] evaluated China’s agricultural water projects, they found that the benefits of the water construction investment scale in the eastern provinces were decreasing, while those in the western provinces were increasing. Lei et al. found that the supply efficiency of the national agricultural water facilities showed an overall declining trend, following analysis of panel data from 27 provinces and cities in China from 2009 to 2018 [57].
The regression coefficient for the degree of informatization is 0.111, but it does not show significance (z = 0.952, p = 0.341 > 0.05), indicating that the degree of informatization does not impact the technical efficiency.
The regression coefficient for the degree of agribusiness is -1.044, presenting significance at the 0.01 level (z = −2.860, p = 0.004 < 0.01), suggesting that the degree of agribusiness has a significant negative impact on technical efficiency. The variable of corporatization degree is used to examine whether the mode of agricultural production is shifting towards a more efficient, large-scale corporate model. It is generally believed that fewer and larger agricultural enterprises can improve efficiency. The independent variable reflecting the degree of agricultural corporatization in this Tobit model, which is the ratio of agricultural legal persons to the total number of legal persons, reasonably has a negative impact on the overall technical efficiency of the agricultural economy. Meena et al. found that the cost of transition from family-based to corporatized agriculture in India was higher [58]. Motes et al. argued that modern agriculture has shown a reverse Malthusian phenomenon of the land margin, with a continuous increase in food output, but this was due to the low production efficiency in these areas in the past [59]. Studies by Bojnec et al. on the overall technical efficiency of agriculture in Central and Eastern Europe also found that scaling up improved efficiency [60]. Wang et al. empirically demonstrated that the larger scale of production was key to enhancing productivity in China’s scaled agriculture [61]. In fact, expanding the scale of production on limited agricultural resources, such as arable land, often implies a reduction in the number of agricultural enterprises. Da-You et al. posited that the presence of leading enterprises was of significant importance to the process of agricultural industrialization in a region [62]. The Chinese government has repeatedly expressed its intention to support leading agricultural enterprises and encouraged small and medium-sized enterprises to merge into larger ones to enhance production efficiency.
The regression coefficient for the percentage of rural population is −0.665, showing significance at the 0.01 level (z = −4.608, p = 0.000 < 0.01), indicating that the proportion of the rural population has a significant negative impact on technical efficiency. An increase in the population would increase agricultural production input. To improve the efficiency of the agricultural circular economy, it is essential to enhance the quality of talents and release more human resources to society. As early as 1798, the Malthusian model proposed the negative relationship between population size and agricultural resources [15]. Kögel and Prskawetz argued that improving agricultural productivity can escape the Malthusian trap, but it requires institutional guidance to reduce fertility rates [63]. Bilsborrow believed that one of the key factors to improving agricultural productivity is the decline in the population growth rate [64].
In summary, the degree of financial support for agriculture has a significant positive impact on technical efficiency, while the degree of water support, the degree of agribusiness, and the percentage of rural population have a significant negative impact. However, the degree of energy support and the degree of informatization do not impact technical efficiency.

5.2. Technological Advances Promote the Efficiency of China’s Agricultural Circular Economy Year by Year

Both the DEA model and Tobit model indicate that the policies related to the rural revitalization strategy significantly affect the efficiency of the agricultural circular economy. What is the trend in the efficiency of the agricultural circular economy under the influence of these policies? The dependent variable in the Tobit regression model comes from the CCR model of agricultural circular economy efficiency, reflecting the relative situation of the agricultural circular economy efficiency of 31 provinces in the current year, and cannot be directly compared between different years. The CCR–Malmquist index model of China’s agricultural circular economy measured in this paper from 2017 to 2020 can directly reflect the change in efficiency. After analyzing statistics on the data in Table 8 to form Table 9, the total factor productivity change rates (Tfpch) for all three periods of 2017–2018, 2018–2019, and 2019–2020 for 31 provinces and cities were found to all be greater than 1, indicating that the efficiency of the agricultural circular economy in these 31 provinces and cities has improved during this period.
From Table 9, it is clear that the growth of the total factor productivity index (Tfpch) in the agricultural circular economy primarily results from the technological progress change index (Techch) for all three periods in all 31 provinces and cities being greater than 1. This suggests that the main driving force of growth stems from technological progress. However, some provinces and cities still have room for improvement in terms of the technical efficiency change index (Effch).
The same evidence can be found in the analysis based on the CCR model. Table 10 presents a comprehensive statistical breakdown of the efficiency and its decomposition of the agricultural circular economy in 31 provinces and cities from 2017 to 2020. Notably, the number of provinces and cities achieving a technological efficiency of 1 significantly surpasses those achieving a scale efficiency of 1, with a steady upward trend year by year. This conclusively demonstrates that the advancement in the efficiency of the agricultural circular economy over these years can be attributed to technological upgrades and optimization.

5.3. Reasonable Policies Support the Efficiency of Agricultural Circular Economy

In conjunction with further analysis using the Tobit regression model, we believe that a significant factor contributing to the enhancement of the agricultural circular economy’s efficiency is appropriate government fiscal support. The Tobit model indicates that the positive impact of the degree of financial support for agriculture on the overall technical efficiency of the agricultural circular economy is at the 5% level. The expenditure on agriculture, forestry, and water in all 31 provinces and cities has been increasing year by year, and its proportion in the general public budget expenditure at the provincial and municipal levels has also been steadily rising, as shown in Figure 3 and Figure 4.
The degree of water support from 2017 to 2020 is shown in Figure 5. During this period, the degree of water support was steady with a slight increase, not blindly pursuing scale, and did not excessively crowd out resources, affecting the efficiency of the agricultural circular economy.
The degree of agribusiness has a significant negative impact on the efficiency of the agricultural circular economy, and the development trend of socialization degree from 2017 to 2020, as shown in Figure 6. Compared with the number of corporate legal persons in all industries in China, the proportion of agricultural enterprises is decreasing year by year. On the one hand, the Chinese government has made it clear that it wishes to promote agricultural modernization, and on the other hand, the increase in the number of agricultural enterprises is limited. These two are not contradictory. Instead, they indicate that the government’s policy is more committed to the scaling up and technological upgrading of agricultural enterprises, rather than simply pursuing an increase in quantity. This has promoted the growth of the efficiency of the agricultural circular economy. In 2021, the Ministry of Agriculture and Rural Affairs specifically issued the “Opinions of the Ministry of Agriculture and Rural Affairs on Promoting the Growth and Strengthening of Leading Enterprises in Agricultural Industrialization”, which also confirms our research results.
The percentage of rural population also has a significantly negative impact on the efficiency of the agricultural circular economy. The changing trend of the percentage of rural population in China from 2017 to 2020 is as shown in Figure 7. The decreasing trend from 2017 to 2020 supports the improvement of the efficiency of the agricultural circular economy, indicating that the related policies of the rural revitalization strategy are more focused on improving the quality of agricultural talents to release more labor and improve efficiency.
In summary, the formulation and implementation of various policies under the rural revitalization strategy, considering the incompatibility of agricultural modernization and rural modernization, are quite rational. Combined with the analysis results of the DEA–Malmquist model, it can be seen that the annual increase in financial support does not blindly pursue the expansion of investment scale, but is mainly used for upgrades in agricultural technology, management level, rationality of asset structure, etc. Other variables with a negative impact are stable or declining, creating a favorable foundation for the improvement of the efficiency of the agricultural circular economy.

5.4. There Are Significant Differences between the Efficiency of Agricultural Circular Economy in 31 Provinces and Cities in China

As shown in Figure 8, the distribution of the overall technical efficiency of the agricultural circular economy in the 31 provinces and cities has been very stable over the past four years, with the number of provinces having an overall technical efficiency of 1 (i.e., DEA efficient) ranging between 14 and 15. Among these, 13 provinces and cities, including Beijing, Tianjin, Heilongjiang, Shanghai, Zhejiang, Fujian, Hubei, Guangdong, Hainan, Sichuan, Guizhou, Shaanxi, and Xinjiang, have maintained an overall technical efficiency of 1 (i.e., DEA efficient) for four consecutive years. This suggests that these provinces and cities have significantly higher levels of agricultural production technology, management level, resource utilization rate, etc., compared to other provinces and cities.
Additionally, due to geographical and climatic influences, agricultural production varies substantially across different regions. However, the 13 provinces and cities that have achieved DEA effectiveness, distributed across seven regions including South China, Central China, North China, East China, Northeast, Southwest, and Northwest China, somewhat indicate that the heterogeneity-induced errors among various DMUs in the DEA model are not significant. The model is thus deemed highly reliable, showing minimal influence from regional and climatic differences. Simultaneously, in the economically advanced eastern and southeastern coastal regions, the efficiency of the agricultural circular economy is generally higher.

5.5. There Is Room to Improve the Scale Efficiency of Agricultural Circular Economy

As shown in Figure 9, the distribution of scale efficiency in the agricultural circular economy across the 31 provinces and cities from 2017 to 2020 closely aligns with the overall efficiency distribution. The 13 provinces and cities of Beijing, Tianjin, Heilongjiang, Shanghai, Zhejiang, Fujian, Hubei, Guangdong, Hainan, Sichuan, Guizhou, Shaanxi, and Xinjiang have consistently achieved a scale efficiency of 1, indicating DEA effectiveness, for four consecutive years.
From 2017 to 2020, technical efficiency reached 1 in 18–21 of the 31 provinces and cities. The distribution, as illustrated in Figure 10, covers various regions in China, similar to the distribution of overall efficiency. This indicates that the primary driving force for the improvement in overall technical efficiency in China’s agricultural circular economy comes from the enhancement of technical efficiency.
In conclusion, there exists substantial room for improvement in the scale efficiency of the agricultural circular economy. Enhancing scale efficiency should be a key focus of future policy considerations.

6. Conclusions, Recommendations, and Shortcomings

6.1. Conclusions and Recommendations

1. From the results presented in Section 4.3, it can be observed that the overall trend of China’s agricultural circular economy efficiency has been increasing year by year around the implementation of the rural revitalization strategy in 2018. This indicates that the relevant policies are rational and can ensure the simultaneous realization of agricultural modernization and rural modernization. The future focus should be on implementing various policies for rural revitalization and actively researching how to transform policy investments into productivity.
2. Section 4.2 and Section 5.1 explicitly indicate that agricultural fiscal support has a significant positive impact on the efficiency of China’s agricultural circular economy. Future policies should aim to maintain the growth of agricultural fiscal expenditure.
3. Drawing on Section 4.1 and Section 5.5, the primary factor hindering the efficiency of the agricultural circular economy is inadequate scale efficiency. Provinces lagging in scale efficiency should adjust their input scales according to their specific circumstances, improve organizational management levels, resource utilization, etc., which can achieve an overall efficiency improvement at a relatively small cost.
4. From Section 4.1 and Section 5.5, it can also be inferred that the level of agricultural technology and management are robust safeguards for the enhancement of agricultural circular economy efficiency, and are important links in the rural revitalization strategy. Therefore, investment related to agricultural technology should be further strengthened.
5. Section 5.5′s graphical representation shows that provinces with higher comprehensive efficiency in the agricultural circular economy are highly stable. This suggests that these provinces have significant advantages in areas such as agricultural technological advancement and upgrade, as well as management level, offering lessons for other provinces.

6.2. Innovation Point

This paper presents the following innovative contributions:
  • The research exploring the correlation between the rural revitalization strategy and the efficiency of agricultural circular economy is a novel perspective.
  • The approach of extracting independent variables related to policy from the rural revitalization strategy represents an innovative method.
  • While most previous studies on the level of agricultural economy have focused on specific regions, investigating economic differences between these regions, the novelty of this paper lies in its national scope. It explores development trends and influential factors at the national level.

6.3. Shortcomings

1. There is considerable heterogeneity in agricultural production across different provinces in China. Some provinces have one harvest per year (such as in the Northeast), while others have three (such as Hainan). Some are predominantly involved in animal husbandry, while others focus mainly on crop farming. Climate and water resource variations also exist. In future research, there is a plan to eliminate the impact of this heterogeneity, with a preliminary idea of establishing an intermediate model to mitigate these differences. However, practical research has shown that even with the existence of heterogeneous factors, the final results are still relatively evenly distributed, which indicates that the validity of the model is assured, reflecting a macroscopic view of the agricultural circular economy.
2. Due to limitations in data acquisition, the model of agricultural circular economy efficiency still has some shortcomings. For instance, variables related to the environment, such as the emissions of waste, have not yet been introduced into the model.
3. There is a need for further refinement in the research. Both the Rural Revitalization Strategy and the agricultural circular economy are complex systems. When performing coupled analysis, it is necessary to further improve the granularity of the research. For example, a more in-depth analysis of the differentiated causes for the 31 provinces’ agriculture could be obtained through super-efficiency DEA models and slack analysis. The main objective of this study was to conduct a macroscopic analysis of the overall efficiency of China’s agricultural circular economy, and this part was not included.
4. Some influencing factors have not yet been included in the correlation analysis due to incomplete data acquisition. For instance, the impact of the Rural Revitalization Strategy’s efforts on healthcare, education, transportation, etc., on the agricultural circular economy has not been addressed in this research.

Supplementary Materials

The following supporting information can be downloaded at: https://www.mdpi.com/article/10.3390/agriculture13071454/s1, Table S1: 2017–2020 China’s 31 provinces and cities degree of financial support for agriculture Calculation result statistics; Table S2: 2017–2020 China’s 31 provinces and cities degree of agribusiness Calculation result statistics; Table S3: 2017–2020 China’s 31 provinces and cities percentage of rural population calculation result statistics; Table S4: 2017–2020 China’s 31 provinces and cities degree of energy support calculation result statistics; Table S5: 2017–2020 China’s 31 provinces and cities degree of water support calculation result statistics; Table S6: 2017–2020 China’s 31 provinces and cities degree of informatization calculation result statistics.

Author Contributions

Conceptualization, C.G.; methodology, R.Z.; software, R.Z.; validation, C.G.; formal analysis, C.G. and R.Z.; investigation, C.G., Y.Z. and R.Z.; resources, Y.Z.; data curation, C.G., Y.Z. and R.Z.; writing—original draft preparation, C.G.; writing—review and editing, Y.Z. and R.Z. All authors have read and agreed to the published version of the manuscript.

Funding

This research received no external funding.

Institutional Review Board Statement

Not applicable.

Data Availability Statement

The data used in this paper are from China National Bureau of Statistics, China Statistical Yearbook and China Ministry of Agriculture and Rural Affairs, China Rural Statistical Yearbook.

Conflicts of Interest

The authors declare no conflict of interest.

References

  1. The State Council of the People’s Republic of China. The Eleventh Five-Year Plan for National Economic and Social Development of the People’s Republic of China. 2006. Available online: https://www.gov.cn/gongbao/content/2006/content_268766.htm (accessed on 15 July 2023).
  2. Wu, H.Q.; Shi, Y.; Xia, Q.; Zhu, W.D. Recycling. Effectiveness of the policy of circular economy in China: A DEA-based analysis for the period of 11th five-year-plan. Resour. Conserv. Recycl. 2014, 83, 163–175. [Google Scholar] [CrossRef]
  3. Xin, Y.; Zhou, X.J. Development benefit evaluation of agricultural circular economy in China. J. South. Agric. 2013, 44, 1220–1224. [Google Scholar]
  4. Ul Haq, S.; Boz, I.; Shahbaz, P.; Yıldırım, Ç.J.E.S.; Research, P. Evaluating eco-efficiency and optimal levels of fertilizer use based on the social cost and social benefits in tea production. Environ. Sci. Pollut. Res. 2020, 27, 33008–33019. [Google Scholar] [CrossRef]
  5. Fan, Y.; Fang, C. Circular economy development in China-current situation, evaluation and policy implications. Environ. Impact Assess. Rev. 2020, 84, 106441. [Google Scholar] [CrossRef]
  6. Shahbaz, P.; Haq, S.u.; Boz, I. Linking climate change adaptation practices with farm technical efficiency and fertilizer use: A study of wheat–maize mix cropping zone of Punjab province, Pakistan. Environ. Sci. Pollut. Res. 2022, 29, 16925–16938. [Google Scholar] [CrossRef]
  7. The State Council of the People’s Republic of China. The Central Committee of the Communist Party of China and the State Council Opinions on Implementing the Rural Revitalization Strategy. 2018. Available online: https://www.gov.cn/gongbao/content/2018/content_5266232.htm (accessed on 15 July 2023).
  8. The National People’s Congress of the People’s Republic of China. The Budget Working Committee of the Standing Committee of the National People’s Congress, the National Committee on Finance and Economy of the National People’s Congress, the National People’s Congress Committee on Agriculture and Rural Affairs on the Fiscal Agricultural and Rural Funds Research Report on the Distribution and Utilization of Financial Agricultural and Rural Funds. 2021. Available online: http://www.npc.gov.cn/npc/c5871/202206/b157d2e15e0a4000ae33874d009d947f.shtml (accessed on 15 July 2023).
  9. People’s Daily Online. Subsidies of 175 Billion Yuan of Financial Strength to Help Promote Rural Revitalization across the Board. 2023. Available online: http://finance.people.com.cn/n1/2023/0408/c1004-32659855.html (accessed on 15 July 2023).
  10. Ministry of Transport of the People’s Republic of China. 2023. Available online: https://www.gov.cn/zhengce/2023-04/23/content_5752770.htm (accessed on 15 July 2023).
  11. The State Council of the People’s Republic of China. China to Improve Rural Infrastructure Amid Rural Revitalization Drive. 2023. Available online: http://english.www.gov.cn/premier/news/2018/03/05/content_281476067447206.htm (accessed on 15 July 2023).
  12. The State Council of the People’s Republic of China. Guiding Opinions of the State Council on Accelerating the Transformation and Upgrading of Mechanised Agriculture and Agricultural Machinery Equipment Industry. 2019. Available online: https://www.gov.cn/gongbao/content/2019/content_5355467.htm (accessed on 7 July 2023).
  13. The State Council of the People’s Republic of China. The State Council’s Decision on Issuing the “14th Five Year Plan” Promotion Notice on Agricultural and Rural Modernization Planning. Available online: https://www.gov.cn/gongbao/content/2022/content_5675948.htm (accessed on 15 July 2023).
  14. People’s Daily Online. Expand the Scope of Government Purchase Services and Improve the Level of Management Science Standardization. 2023. Available online: https://www.gov.cn/zhengce/202306/content_6885168.htm (accessed on 15 July 2023).
  15. Malthus, T. An Essay on the Principle of Population. 1798. Available online: https://la.utexas.edu/users/hcleaver/368/368MalthusPopCh10table.pdf (accessed on 15 July 2023).
  16. Scott, A.J. Industrialization and urbanization: A geographical agenda. Ann. Assoc. Am. Geogr. 1986, 76, 25–37. [Google Scholar] [CrossRef]
  17. Hubendick, B. Industrialization and Urbanization. In The Global Environment: Science, Technology and Management; Wiley-VCH: Hoboken, NJ, USA, 1997. [Google Scholar]
  18. Yang, D.T.; Zhu, X. Modernization of agriculture and long-term growth. J. Monet. Econ. 2013, 60, 367–382. [Google Scholar] [CrossRef] [Green Version]
  19. Hardeman, E.; Jochemsen, H. Are there ideological aspects to the modernization of agriculture? J. Agric. Environ. Ethic 2012, 25, 657–674. [Google Scholar] [CrossRef] [Green Version]
  20. Knickel, K.; Ashkenazy, A.; Chebach, T.C.; Parrot, N. Agricultural modernization and sustainable agriculture: Contradictions and complementarities. Int. J. Agric. Sustain. 2017, 15, 575–592. [Google Scholar] [CrossRef]
  21. Jiang, H.M.; Wang, Z.H. Empirical Analysis on the Relationship Among Industrialization, Urbanization and Agricultural Modernization in Jilin Province. Sci. Geogr. Sin. 2012, 32, 591–595. [Google Scholar]
  22. Yao, S.; Liu, Z. Determinants of Grain Production and Technical Efficiency in China. J. Agric. Econ. 2010, 49, 171–184. [Google Scholar] [CrossRef]
  23. de Jorge, J.; Suárez, C. Influence of R&D subsidies on efficiency: The case of Spanish manufacturing firms. Cuad. Econ. Dir. Empresa 2011, 14, 185–193. [Google Scholar]
  24. Yao, L.X.; Leng, N.M. An Analysis on the Incentive Effects of Fiscal Subsidies and Tax Incentives on the Innovation Efficiency of Strategic Emerging Industries. East China Econ. Manag. 2018, 32, 7. [Google Scholar] [CrossRef]
  25. Gao, Y.; Wen, T.; Wen, Y.; Wang, X. A spatial econometric study on effects of fiscal and financial supports for agriculture in China. Agric. Econ. 2013, 59, 315–332. [Google Scholar]
  26. Kumbhakar, S.C.; Lien, G. Impact of subsidies on farm productivity and efficiency. In The Economic Impact of Public Support to Agriculture. Studies in Productivity and Efficiency; Springer: New York, NY, USA, 2010; pp. 109–124. [Google Scholar]
  27. Guan, Z.; Lansink, A.O. The source of productivity growth in Dutch agriculture: A perspective from finance. Am. J. Agric. Econ. 2006, 88, 644–656. [Google Scholar]
  28. Charnes, A.; Cooper, W.W.; Rhodes, E. Measuring the efficiency of decision making units. Eur. J. Oper. Res. 1978, 2, 429–444. [Google Scholar] [CrossRef]
  29. Banker, R.D.; Charnes, A.; Cooper, W.W. Some models for estimating technical and scale inefficiencies in data envelopment analysis. Manag. Sci. 1984, 30, 1078–1092. [Google Scholar] [CrossRef] [Green Version]
  30. Zhao, X.; Ma, X.; Shang, Y.; Yang, Z.; Shahzad, U. Green economic growth and its inherent driving factors in Chinese cities: Based on the Metafrontier-global-SBM super-efficiency DEA model. Gondwana Res. 2022, 106, 315–328. [Google Scholar] [CrossRef]
  31. Streimikis, J.; Saraji, M.K. Green productivity and undesirable outputs in agriculture: A systematic review of DEA approach and policy recommendations. Econ. Res.-Ekon. Istraživanja 2022, 35, 819–853. [Google Scholar] [CrossRef]
  32. Andersen, P.; Petersen, N.C. A procedure for ranking efficient units in data envelopment analysis. Manag. Sci. 1993, 39, 1261–1264. [Google Scholar] [CrossRef]
  33. Zhao, X.; Mahendru, M.; Ma, X.; Rao, A.; Shang, Y. Impacts of environmental regulations on green economic growth in China: New guidelines regarding renewable energy and energy efficiency. Renew. Energy 2022, 187, 728–742. [Google Scholar] [CrossRef]
  34. Li, S.; Jahanshahloo, G.R.; Khodabakhshi, M. A super-efficiency model for ranking efficient units in data envelopment analysis. Appl. Math. Comput. 2007, 184, 638–648. [Google Scholar] [CrossRef]
  35. Zhang, Q.; Chen, W.; Ling, W. Tech-eco efficiency evaluation of hydrogen production industry under carbon dioxide emissions regulation in China. Int. J. Hydrogen Energy 2022, 47, 41183–41194. [Google Scholar] [CrossRef]
  36. Malmquist, S. Index numbers and indifference surfaces. Trab. Estad. 1953, 4, 209–242. [Google Scholar] [CrossRef]
  37. Caves, D.W.; Christensen, L.R.; Diewert, W.E. The economic theory of index numbers and the measurement of input, output, and productivity. Econometrica 1982, 50, 1393–1414. [Google Scholar] [CrossRef]
  38. Färe, R.; Grosskopf, S.; Lindgren, B.; Roos, P. Productivity changes in Swedish pharamacies 1980–1989: A non-parametric Malmquist approach. J. Prod. Anal. 1992, 3, 85–101. [Google Scholar] [CrossRef]
  39. Grifell-Tatjé, E.; Lovell, C. A note on the Malmquist productivity index. Econ. Lett. 1995, 47, 169–175. [Google Scholar] [CrossRef]
  40. Pastor, J.T.; Lovell, C.A.K. A global Malmquist productivity index. Econ. Lett. 2005, 88, 266–271. [Google Scholar] [CrossRef]
  41. Coelli, T.J.; Rao, D.S.P. Total factor productivity growth in agriculture: A Malmquist index analysis of 93 countries, 1980–2000. Agric. Econ. 2005, 32, 115–134. [Google Scholar] [CrossRef] [Green Version]
  42. Kortelainen, M. Dynamic environmental performance analysis: A Malmquist index approach. Ecol. Econ. 2008, 64, 701–715. [Google Scholar] [CrossRef]
  43. Baba, V. Methodological issues in modeling absence: A comparison of least squares and Tobit analyses. J. Appl. Psychol. 1990, 75, 428. [Google Scholar] [CrossRef]
  44. Tobin, J. Estimation of relationships for limited dependent variables. Econom. J. Econom. Soc. 1958, 26, 24–36. [Google Scholar] [CrossRef] [Green Version]
  45. Amore, M.D.; Murtinu, S. Tobit models in strategy research: Critical issues and applications. Glob. Strat. J. 2021, 11, 331–355. [Google Scholar] [CrossRef] [Green Version]
  46. Aldieri, L.; Gatto, A.; Vinci, C.P. Is there any room for renewable energy innovation in developing and transition economies? Data envelopment analysis of energy behaviour and resilience data. Resour. Conserv. Recycl. 2022, 186, 106587. [Google Scholar] [CrossRef]
  47. Shuai, S.; Fan, Z. Modeling the role of environmental regulations in regional green economy efficiency of China: Empirical evidence from super efficiency DEA-Tobit model. J. Environ. Manag. 2020, 261, 110227. [Google Scholar] [CrossRef]
  48. Dalei, N.N.; Joshi, J.M. Estimating technical efficiency of petroleum refineries using DEA and tobit model: An India perspective. Comput. Chem. Eng. 2020, 142, 107047. [Google Scholar] [CrossRef]
  49. Akaike, H. A new look at the statistical identification model. IEEE Trans. Autom. Control. 1974, 19, 716–723. [Google Scholar] [CrossRef]
  50. Schwarz, G. Estimating the dimension of a model. Ann. Stat. 1978, 6, 461–464. [Google Scholar] [CrossRef]
  51. Jiao, F.Y.; Liu, L.N. Contribution of fiscal expenditure on supporting agriculture to promoting agricultural economic growth—Empirical study based on Northeast panel data. In Proceedings of the 2009 International Conference on Management Science and Engineering, Moscow, Russia, 14–16 September 2009. [Google Scholar]
  52. Chen, S.; Yang, J.; Kang, X. Effect of Fiscal Expenditure for Supporting Agriculture on Agricultural Economic Efficiency in Central China—A Case Study of Henan Province. Agriculture 2023, 13, 822. [Google Scholar] [CrossRef]
  53. Zhou, H.M.; Li, M.X. Efficiency evaluation of fiscal expenditure on supporting agriculture in Hunan Province based on DEA model. Res. Agric. Mod. 2016, 37, 284–289. [Google Scholar]
  54. Li, W.; Ma, Y. Research on the Effects of Fiscal Expenditure for Agriculture on the Agricultural Modernization: Empirical Analysis Based on Dynamic Panel Data Model. J. Xi’an Univ. Financ. Econ. 2014, 3, 5–9. [Google Scholar] [CrossRef]
  55. Yan, J. Spatiotemporal analysis for investment efficiency of China’s rural water conservancy based on DEA model and Malmquist productivity index model. Sustain. Comput. Inform. Syst. 2019, 21, 56–71. [Google Scholar] [CrossRef]
  56. Wang, B.; Zhang, H.; Luo, W. Evaluation of operational efficiency of agricultural water conservancy projects in China based on inter-provincial panel data. J. Econ. Water Resour. 2019, 37, 59–66. [Google Scholar]
  57. Yu, L.; Yang, G. Supply Efficiency and Factors of Farmland Water Conservancy Facilities Based on Sbm-Malmquist-Tobit Model. Resour. Ind. 2022, 24, 77–89. [Google Scholar]
  58. Meena, T. Corporatization of Agriculture and Its Effect. 2016. Available online: https://www.readcube.com/articles/10.2139/ssrn.2823387 (accessed on 15 July 2023).
  59. Motes, W. Modern Agriculture and Its Benefits–Trends, Implications and Outlook. 2010. Available online: https://www.researchgate.net/publication/268178065_Modern_Agriculture_and_Its_Benefits_-_Trends_Implications_and_Outlook (accessed on 15 July 2023).
  60. Bojnec, Š.; Fertő, I.; Jámbor, A.; Tóth, J. Determinants of technical efficiency in agriculture in new EU member states from Central and Eastern Europe. Acta Oeconomica 2014, 64, 197–217. [Google Scholar] [CrossRef]
  61. Wang, Y.; Dong, F.; Xu, J. Production Efficiency of Scaled-up Agricultural Operations in China: An Empirical Analysis. In Proceedings of the 2018 Annual Meeting, Washington, DC, USA, 5–7 August 2018. [Google Scholar]
  62. Xu, D.; Sun, H. Leading Companies in Industrialization of Agriculture in Guizhou:Effect on Increasing Farmers’ Income. 2010. Available online: http://www.cqvip.com/qk/96372x/201003/33646595.html (accessed on 15 July 2023).
  63. Kögel, T.; Prskawetz, A. Agricultural productivity growth and escape from the Malthusian trap. J. Econ. Growth 2001, 6, 337–357. [Google Scholar] [CrossRef]
  64. Bilsborrow, R.E. Population pressures and agricultural development in developing countries: A conceptual framework and recent evidence. World Dev. 1987, 15, 183–203. [Google Scholar] [CrossRef]
Figure 1. Research process on the efficiency and influencing factors of agricultural circular economy.
Agriculture 13 01454 g001
Figure 2. Tobit model regression coefficient 95% CI forest plot.
Agriculture 13 01454 g002
Figure 3. Trends of expenditure for agriculture, forestry, and water conservancy in 31 provinces and cities in China, 2017–2020.
Agriculture 13 01454 g003
Figure 4. Trend of the degree of financial support for agriculture in 31 provinces and cities of China from 2017 to 2022.
Agriculture 13 01454 g004
Figure 5. Development trend of the degree of water support in 31 provinces and cities of China from 2017 to 2020.
Agriculture 13 01454 g005
Figure 6. Development trend of the degree of agribusiness in 31 provinces and cities in China from 2017 to 2020.
Agriculture 13 01454 g006
Figure 7. Development trend of percentage of rural population in 31 provinces and cities in China from 2017 to 2020.
Agriculture 13 01454 g007
Figure 8. 2017–2020 Distribution of provinces and cities in 31 Chinese provinces and municipalities where the overall technical efficiency of agricultural circular economy reaches DEA effectiveness.
Agriculture 13 01454 g008
Figure 9. 2017–2020 Distribution of provinces in 31 Chinese provinces where the scale efficiency of agricultural circular economy reaches DEA effectiveness.
Agriculture 13 01454 g009
Figure 10. 2017–2020 Distribution of provinces in 31 Chinese provinces where the pure technical efficiency of agricultural circular economy reaches DEA effectiveness.
Agriculture 13 01454 g010
Table 1. List of inputs and outputs.
Indicator CategoriesIndicators
Input indicatorsRural Population
Consumption of Chemical Fertilizers
Consumption of Pesticides
Consumption of Diesel Fuel
Sown area of crops
output indicatorsGross Output Value of Agriculture, Forestry, Animal Husbandry and Fishery and Related Indices
Per Capita Disposable Income of Rural Households by Region
Table 2. China’s 31 provinces and cities agricultural circular economy pure technical efficiency statistics.
vrste2017201820192020
Number of “1”18191921
Mean values0.9176760560.9271000490.9342944860.942051641
Beijing1111
Tianjin1111
Hebei0.7173958470.8007933310.7902254220.786663162
Shanxi0.6256526220.6234172070.6202941130.634481269
Inner Mongolia0.9810327380.9936193420.9910896591
Liaoning0.979851655111
Jilin0.6795331420.6744521660.6718927080.738799541
Heilongjiang1111
Shanghai1111
Jiangsu1111
Zhejiang1111
Anhui0.7098507020.7047383680.7175056510.712786742
Fujian1111
Jiangxi0.8231965310.8162297890.8393712980.826546699
Shandong1111
Henan0.8006464690.8011517490.8370542091
Hubei1111
Hunan0.9131055030.9062574360.9801118280.999582155
Guangdong1111
Guangxi0.9012499120.9330336750.9377754980.891603519
Hainan1111
Chongqing0.8965249440.8891278270.9139598510.943742014
Sichuan1111
Guizhou1111
Yunnan0.6854186990.8744191030.9433923580.958876921
Tibet1111
Shaanxi1111
Gansu0.7344989580.7228615280.7204564860.71051886
Qinghai1111
Ningxia1111
Xinjiang1111
Table 3. 2017–2020 China’s 31 provinces and cities agricultural circular economy scale efficiency statistics.
Scale2017201820192020
Number of “1”14151414
Mean values0.9608467320.9651549530.9615351530.959233546
Beijing1111
Tianjin1111
Hebei0.990316360.9563602190.9521350660.973404655
Shanxi0.9176047720.9198052250.9201422710.926550722
Inner Mongolia0.9741530060.9834598830.9837198051
Liaoning0.99919571410.9939757620.97716915
Jilin0.9716827120.997072850.9981504390.995625405
Heilongjiang1111
Shanghai1111
Jiangsu1110.98745086
Zhejiang1111
Anhui0.9986216120.9978032170.9817843670.978347235
Fujian1111
Jiangxi0.9954807570.9959068980.9885009450.998238031
Shandong0.8858009670.8968026980.851467530.834198369
Henan0.9095626340.9136041380.8842667450.776282684
Hubei1111
Hunan0.9896024810.995690940.9849819990.992456398
Guangdong1111
Guangxi0.9851974020.9992953530.9789098850.980587728
Hainan1111
Chongqing0.9441725350.9802213650.9942933880.999763172
Sichuan1111
Guizhou1111
Yunnan0.982508590.9999164760.9974963040.999888668
Tibet0.7343720970.7454661540.7397185290.729462273
Shaanxi1111
Gansu0.8299705860.8459790910.8662694870.89128308
Qinghai0.8013905510.8229068140.8398650760.830865163
Ningxia0.8766159270.8695122340.8519121570.864666337
Xinjiang1111
Table 4. 2017–2020 China’s 31 provinces and cities agricultural circular economy return of scale statistics.
Return of Scale2017201820192020
Number of “CRS”14161414
Number of “IRS”9887
Number of “DRS”87910
Table 5. 2017–2020 China’s 31 provinces and cities agricultural circular economy overall technical efficiency statistics.
crste2017201820192020
Number of “1”14151414
Mean values0.8824317460.895610.899270.90367
Beijing1111
Tianjin1111
Hebei0.7104488440.7658470.7524010.765742
Shanxi0.5741018320.5734220.5707590.587879
Inner Mongolia0.9556759910.9771850.9749551
Liaoning0.97906357410.9939760.977169
Jilin0.6602906070.6724780.670650.735568
Heilongjiang1111
Shanghai1111
Jiangsu1110.987451
Zhejiang1111
Anhui0.7088722520.703190.7044360.697353
Fujian1111
Jiangxi0.8194763060.8128890.8297190.82509
Shandong0.8858009670.8968030.8514680.834198
Henan0.7282381120.7319360.7401790.776283
Hubei1111
Hunan0.9036114720.9023520.9653930.992042
Guangdong1111
Guangxi0.8879090720.9323760.9179980.874295
Hainan1111
Chongqing0.8464742280.8715420.9087440.943519
Sichuan1111
Guizhou1111
Yunnan0.673429760.8743460.941030.95877
Tibet0.7343720970.7454660.7397190.729462
Shaanxi1111
Gansu0.6096125310.6115260.6241090.633273
Qinghai0.8013905510.8229070.8398650.830865
Ningxia0.8766159270.8695120.8519120.864666
Xinjiang1111
Table 6. Results of the Tobit model likelihood ratio test for factors influencing the efficiency of China’s agricultural circular economy.
Model−2 Times the Log-Likelihood ValueCardinalitydfpAIC BIC
Intercept distance−152.395
Final model−194.01741.62260−180.017−160.275
Table 7. Summary of Tobit model analysis results.
Regression Coefficient
Intercept distance1.179 ** (16.174)
Degree of financial support for agriculture0.993 * (2.109)
Degree of energy support−0.043 (−0.427)
Degree of water support−0.157 * (−2.162)
Degree of informatization0.111 (0.952)
Degree of agribusiness−1.044 ** (−2.860)
Percentage of rural population−0.665 ** (−4.608)
log(Sigma)−2.201 ** (−34.666)
Sample size124
McFadden R2−0.273
Dependent variable: crste
* p < 0.05, ** p < 0.01, z-values in parentheses.
Table 8. Summary of CCR–Malmquist adjacent reference index model of agricultural circular economy efficiency in 31 provinces and cities of China, 2017–2020.
PeriodDMUEffchTechchPechSechTfpch
2017–2018Beijing11.081556111.081556
2017–2018Tianjin11.075355111.075355
2017–2018Hebei1.0817441.0743941.1175420.9679671.162219
2017–2018Shanxi0.9928011.0517350.9979330.9948571.044163
2017–2018Inner Mongolia1.0185941.088791.0127491.0057721.109036
2017–2018Liaoning1.0237021.049661.0203731.0032621.074539
2017–2018Jilin1.0164231.0626990.9969481.0195341.080151
2017–2018Heilongjiang11.059278111.059278
2017–2018Shanghai11.089818111.089818
2017–2018Jiangsu11.031345111.031345
2017–2018Zhejiang11.065401111.065401
2017–2018Anhui0.9971671.0298340.9937511.0034381.026917
2017–2018Fujian11.073229111.073229
2017–2018Jiangxi0.9951821.0637310.992661.0025411.058606
2017–2018Shandong1.0136581.0446911.0136581.058959
2017–2018Henan1.0127381.0379781.0011691.0115551.051199
2017–2018Hubei11.028943111.028943
2017–2018Hunan1.000121.0396550.992891.0072821.039779
2017–2018Guangdong11.017633111.017633
2017–2018Guangxi1.0523591.0087341.0351341.016641.06155
2017–2018Hainan11.033159111.033159
2017–2018Chongqing1.0231351.0564930.9935061.0298231.080935
2017–2018Sichuan11.039342111.039342
2017–2018Guizhou11.102977111.102977
2017–2018Yunnan1.2924351.0538261.2739061.0145451.362002
2017–2018Tibet0.9921391.04888710.9921391.040642
2017–2018Shaanxi11.063093111.063093
2017–2018Gansu0.9994621.0733640.9870781.0125461.072787
2017–2018Qinghai1.0025751.05280111.0025751.055512
2017–2018Ningxia0.9789361.08731910.9789361.064416
2017–2018Xinjiang11.122112111.122112
2018–2019Beijing11.082752111.082752
2018–2019Tianjin11.055464111.055464
2018–2019Hebei0.9897061.1039490.9888951.000821.092585
2018–2019Shanxi0.9985361.0982151.0087360.9898891.096608
2018–2019Inner Mongolia0.9960031.0976310.9976850.9983141.093244
2018–2019Liaoning0.9996861.0931210.9996861.092777
2018–2019Jilin1.0041961.1088831.0032341.0009591.113536
2018–2019Heilongjiang11.109718111.109718
2018–2019Shanghai11.092227111.092227
2018–2019Jiangsu11.069138111.069138
2018–2019Zhejiang11.102197111.102197
2018–2019Anhui1.0126811.0972531.0223230.9905681.111167
2018–2019Fujian11.100032111.100032
2018–2019Jiangxi1.0252571.0944781.0308170.9946061.122122
2018–2019Shandong0.9676441.09654110.9676441.061061
2018–2019Henan1.0278511.0901471.0457540.9828811.120509
2018–2019Hubei11.090092111.090092
2018–2019Hunan1.0784621.08991.0808770.9977651.175415
2018–2019Guangdong11.12946111.12946
2018–2019Guangxi0.9909021.1100251.005640.9853451.099926
2018–2019Hainan11.103107111.103107
2018–2019Chongqing1.0392851.0831511.0290091.0099861.125702
2018–2019Sichuan11.090826111.090826
2018–2019Guizhou11.104277111.104277
2018–2019Yunnan1.0781331.079931.078880.9993081.164309
2018–2019Tibet0.9724911.07090510.9724911.041445
2018–2019Shaanxi11.084852111.084852
2018–2019Gansu1.0156981.0922551.0027471.0129151.1094
2018–2019Qinghai0.9938381.07564410.9938381.069016
2018–2019Ningxia0.96491.06722210.96491.029763
2018–2019Xinjiang11.064995111.064995
2019–2020Beijing11.03478111.03478
2019–2020Tianjin11.052888111.052888
2019–2020Hebei1.0230461.1060280.9963271.0268181.131518
2019–2020Shanxi1.0285211.1036851.029540.999011.135163
2019–2020Inner Mongolia1.0245481.1140291.0085891.0158221.141375
2019–2020Liaoning0.9907191.07822510.9907191.068218
2019–2020Jilin1.0982361.0774551.0975021.0006691.183301
2019–2020Heilongjiang11.105457111.105457
2019–2020Shanghai11.044847111.044847
2019–2020Jiangsu11.077465111.077465
2019–2020Zhejiang11.065462111.065462
2019–2020Anhui1.0019821.1024220.9952831.0067311.104607
2019–2020Fujian11.061432111.061432
2019–2020Jiangxi0.9946231.1153230.9868431.0078841.109325
2019–2020Shandong0.991691.09712410.991691.088007
2019–2020Henan1.0570241.1150721.1917050.8869851.178658
2019–2020Hubei11.11242111.11242
2019–2020Hunan1.0275481.1279121.0193461.0080461.158983
2019–2020Guangdong11.087595111.087595
2019–2020Guangxi0.9579421.1126370.9522541.0059741.065842
2019–2020Hainan11.066561111.066561
2019–2020Chongqing1.0384581.1023731.0314241.006821.144768
2019–2020Sichuan11.15826111.15826
2019–2020Guizhou11.124415111.124415
2019–2020Yunnan1.0146321.1335871.0163960.9982651.150174
2019–2020Tibet0.9752491.07665810.9752491.05001
2019–2020Shaanxi11.127938111.127938
2019–2020Gansu1.0065491.0983180.9906371.0160621.105511
2019–2020Qinghai0.9711361.08851810.9711361.057099
2019–2020Ningxia1.0043431.08984311.0043431.094576
2019–2020Xinjiang11.119021111.119021
Table 9. 2017–2020 China’s 31 provinces and cities agricultural circular economy CCR–Malmquist index model statistics.
2017–20182018–20192019–2020
Number of effch < 1696
Number of techch < 1000
Number of pech < 1725
Number of sech < 14137
Number of Tfpch > 1313131
Table 10. 2017–2020 China’s 31 provinces and cities agricultural circular economy efficiency and decomposition of the results of statistics.
2017201820192020
Number of crste’s value of 114151414
Mean value of crste0.8824320.8956060.8992680.903665
Number of vrste’s value of 118191921
Mean value of vrste0.9176760.92710.9342940.942052
Number of scale’s value of 114151414
Mean value of scale0.9608470.9651550.9615350.959234
Number of CRS14161414
Number of IRS9887
Number of DRS87910
Disclaimer/Publisher’s Note: The statements, opinions and data contained in all publications are solely those of the individual author(s) and contributor(s) and not of MDPI and/or the editor(s). MDPI and/or the editor(s) disclaim responsibility for any injury to people or property resulting from any ideas, methods, instructions or products referred to in the content.

