


Effect of Native Vegetative Barriers to Prevent Wind Erosion: A Sustainable Alternative for Quinoa (Chenopodium quinoa Willd.) Production
 ,
,  ,
,
Abstract
:1. Introduction
2. Materials and Methods
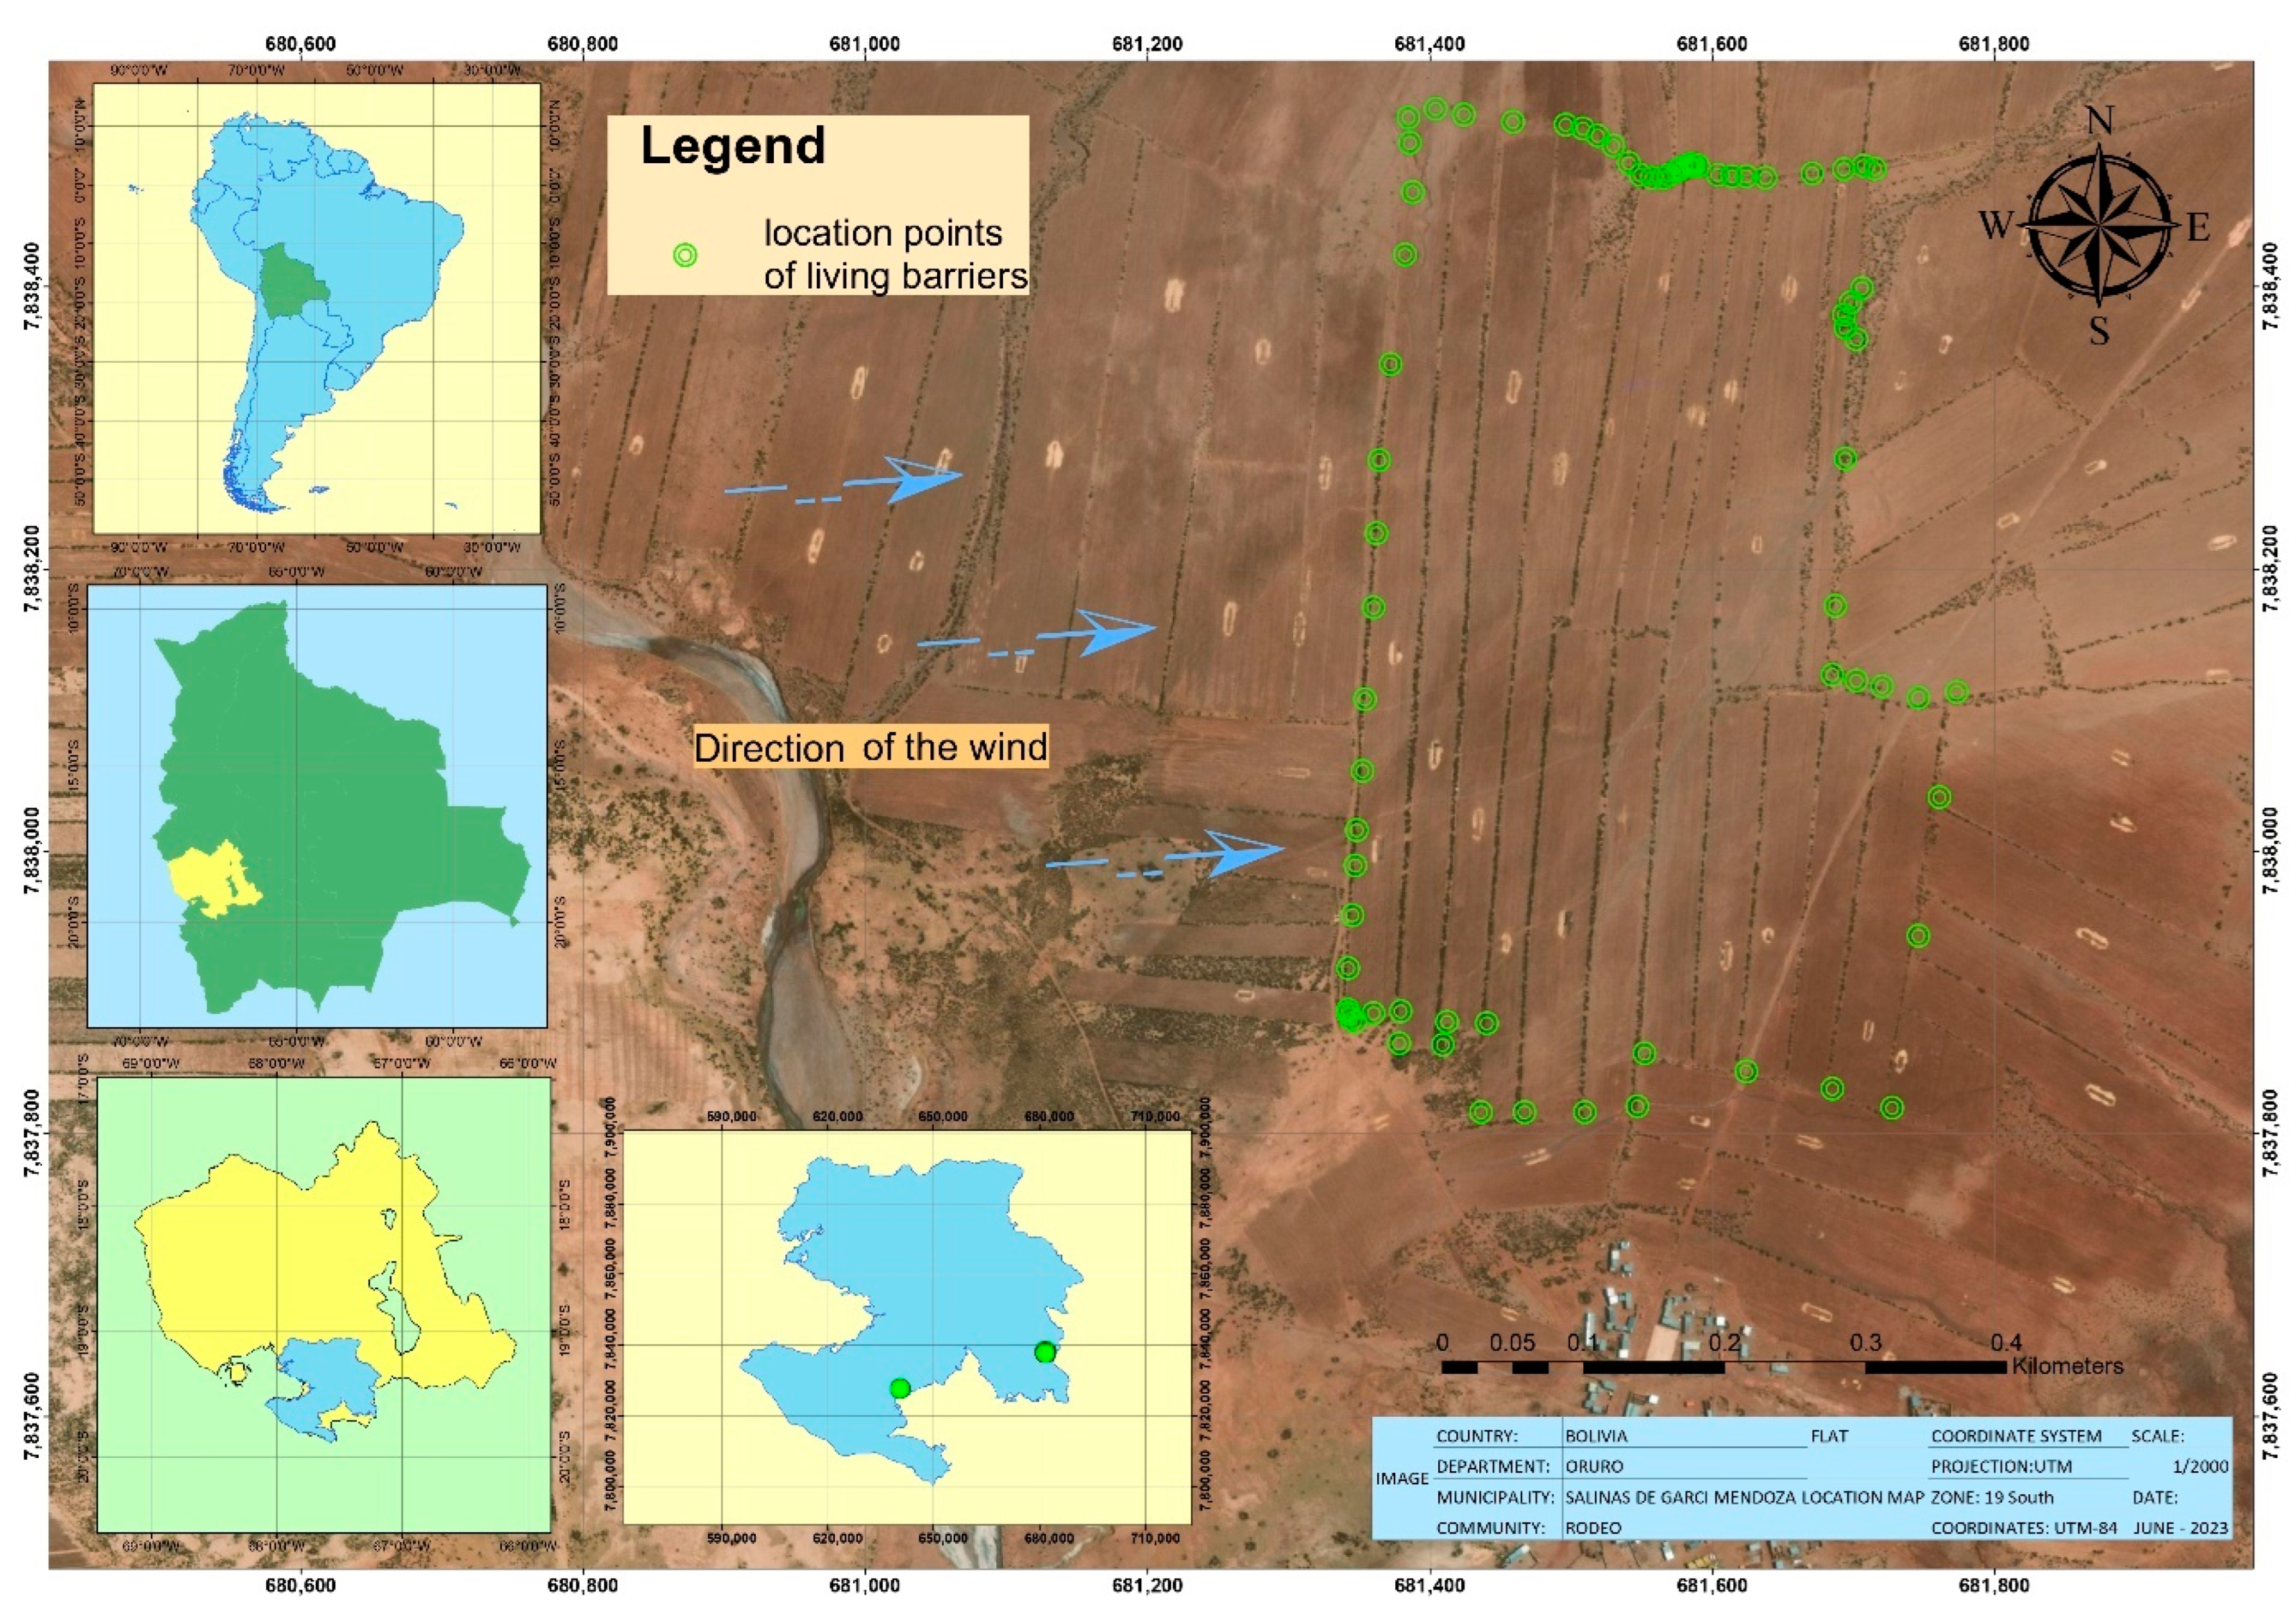
2.1. Study Area
2.2. Weather
2.3. Degree of Wind Erosion and Soil Moisture
2.4. Determination of Nutrient Content in Soil
2.5. Statistical Analysis
3. Results
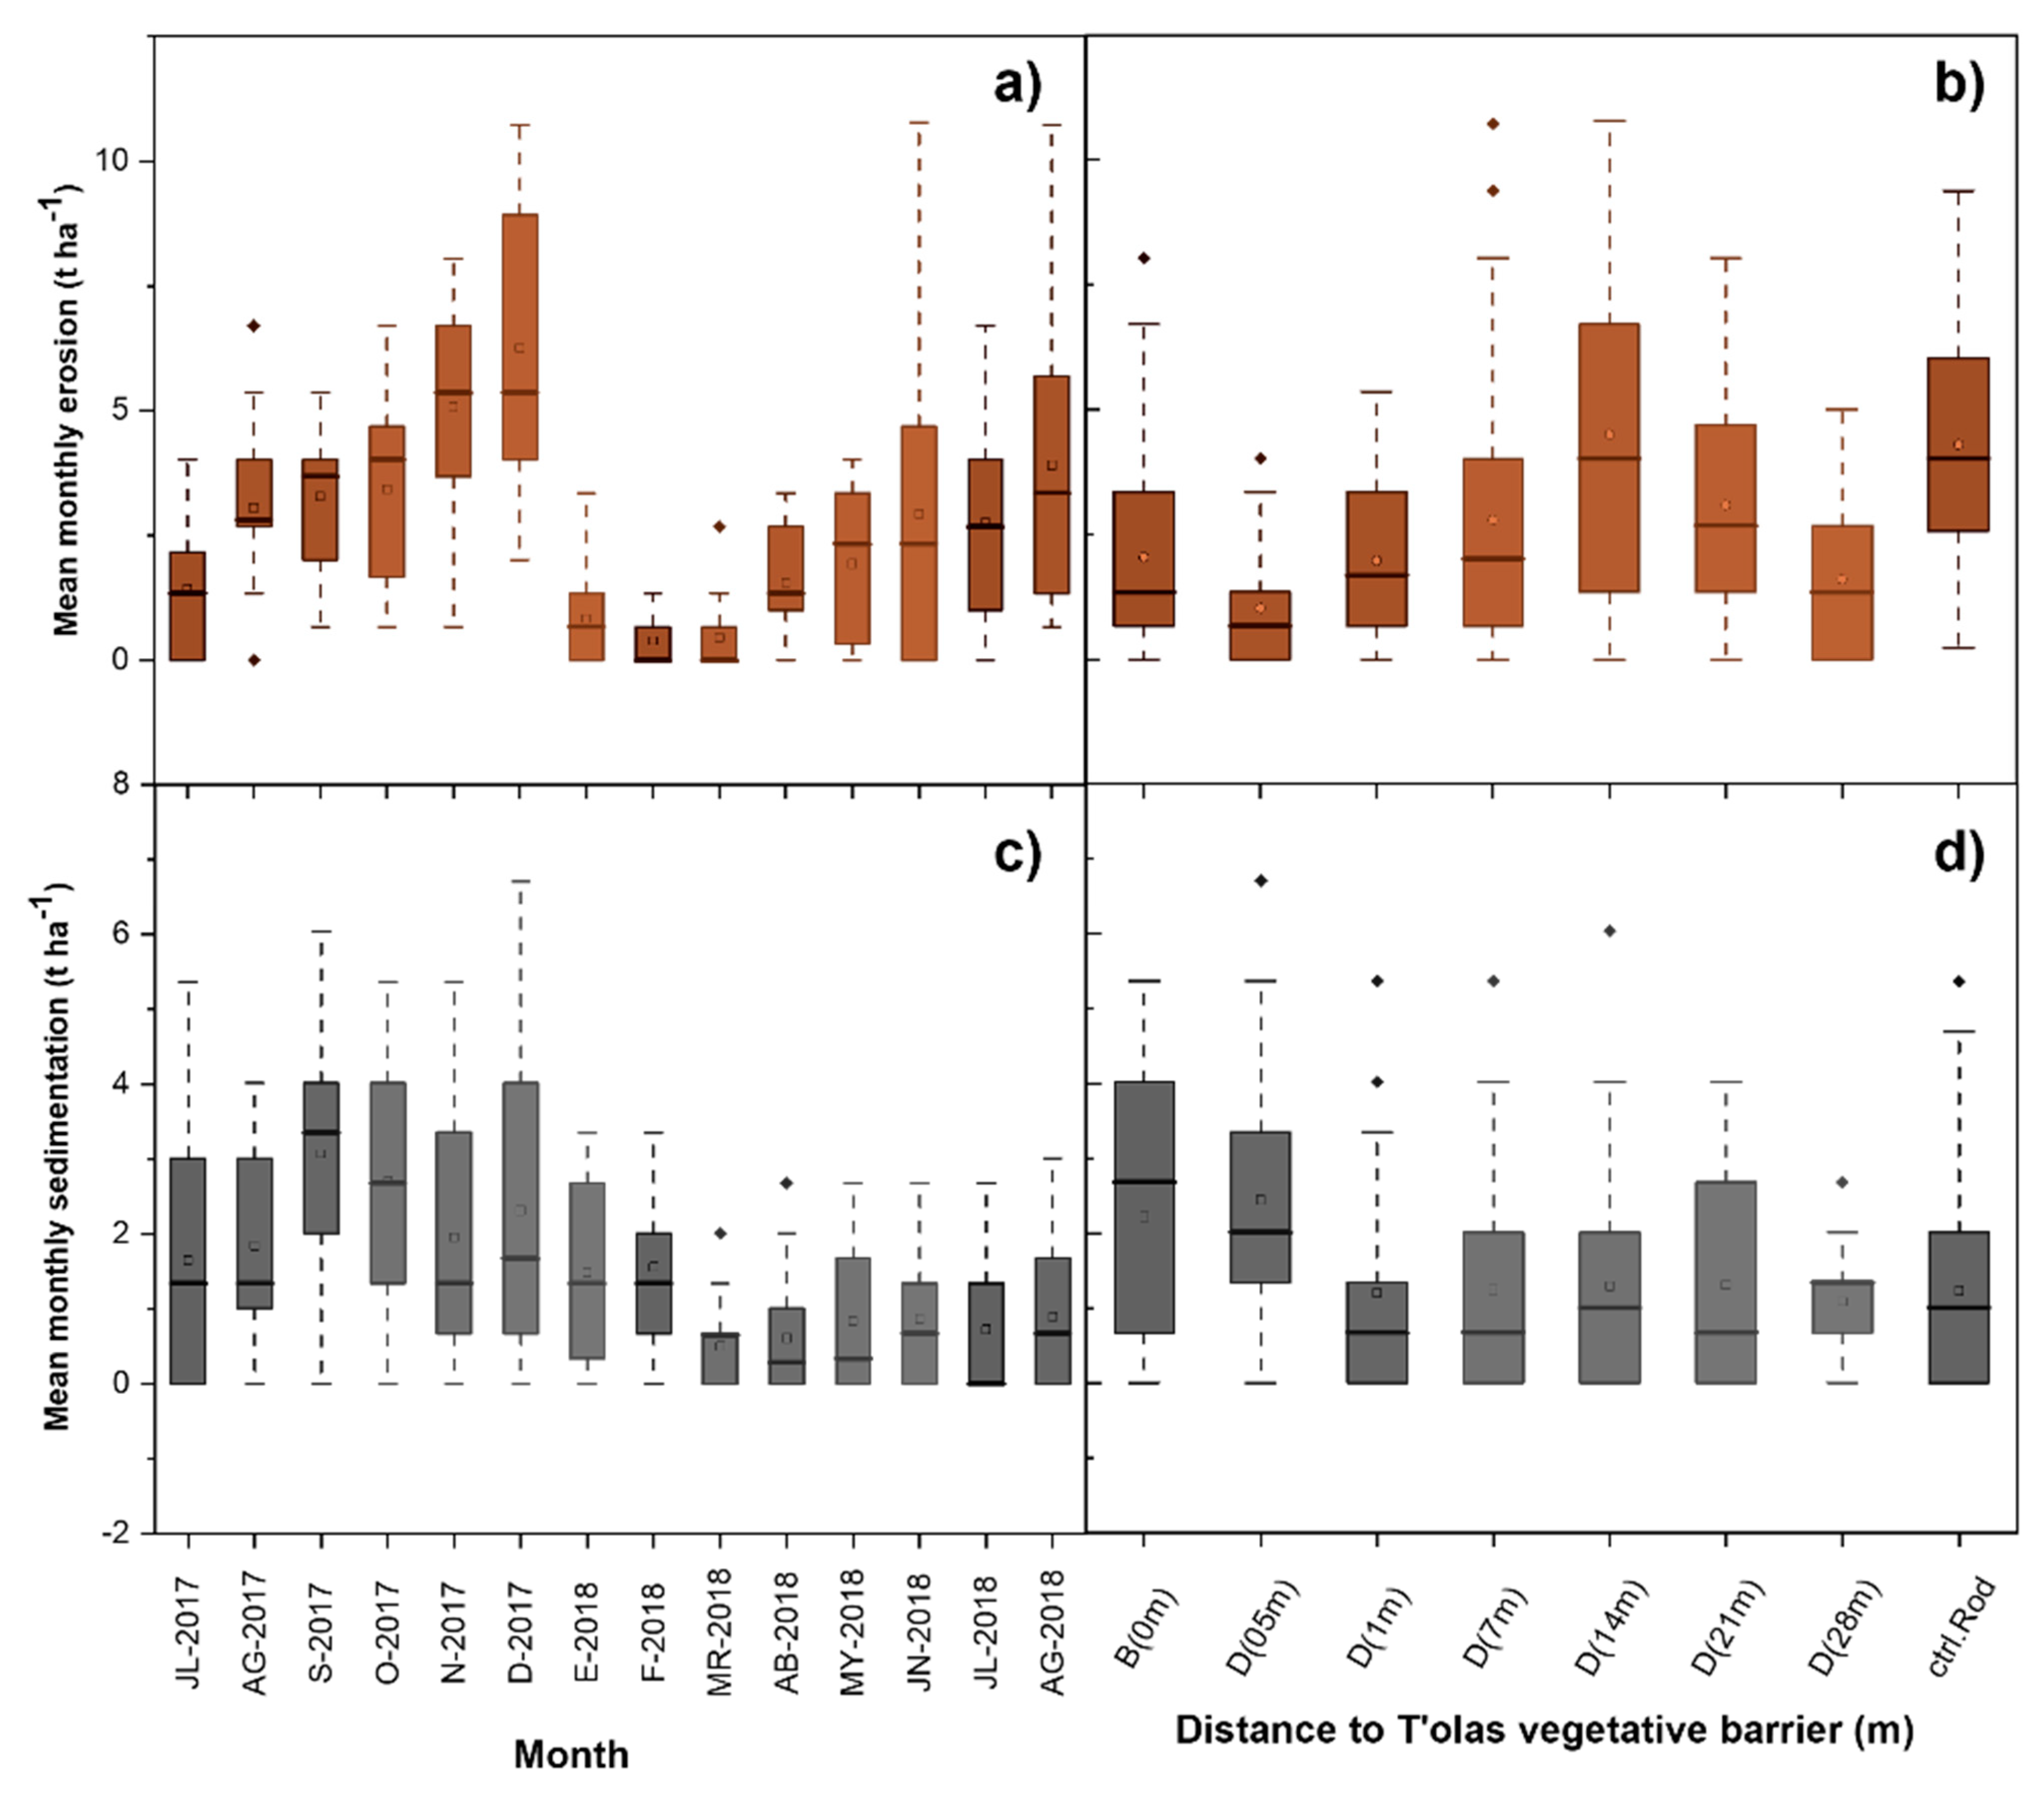
3.1. Average Erosion
3.2. Sedimentation
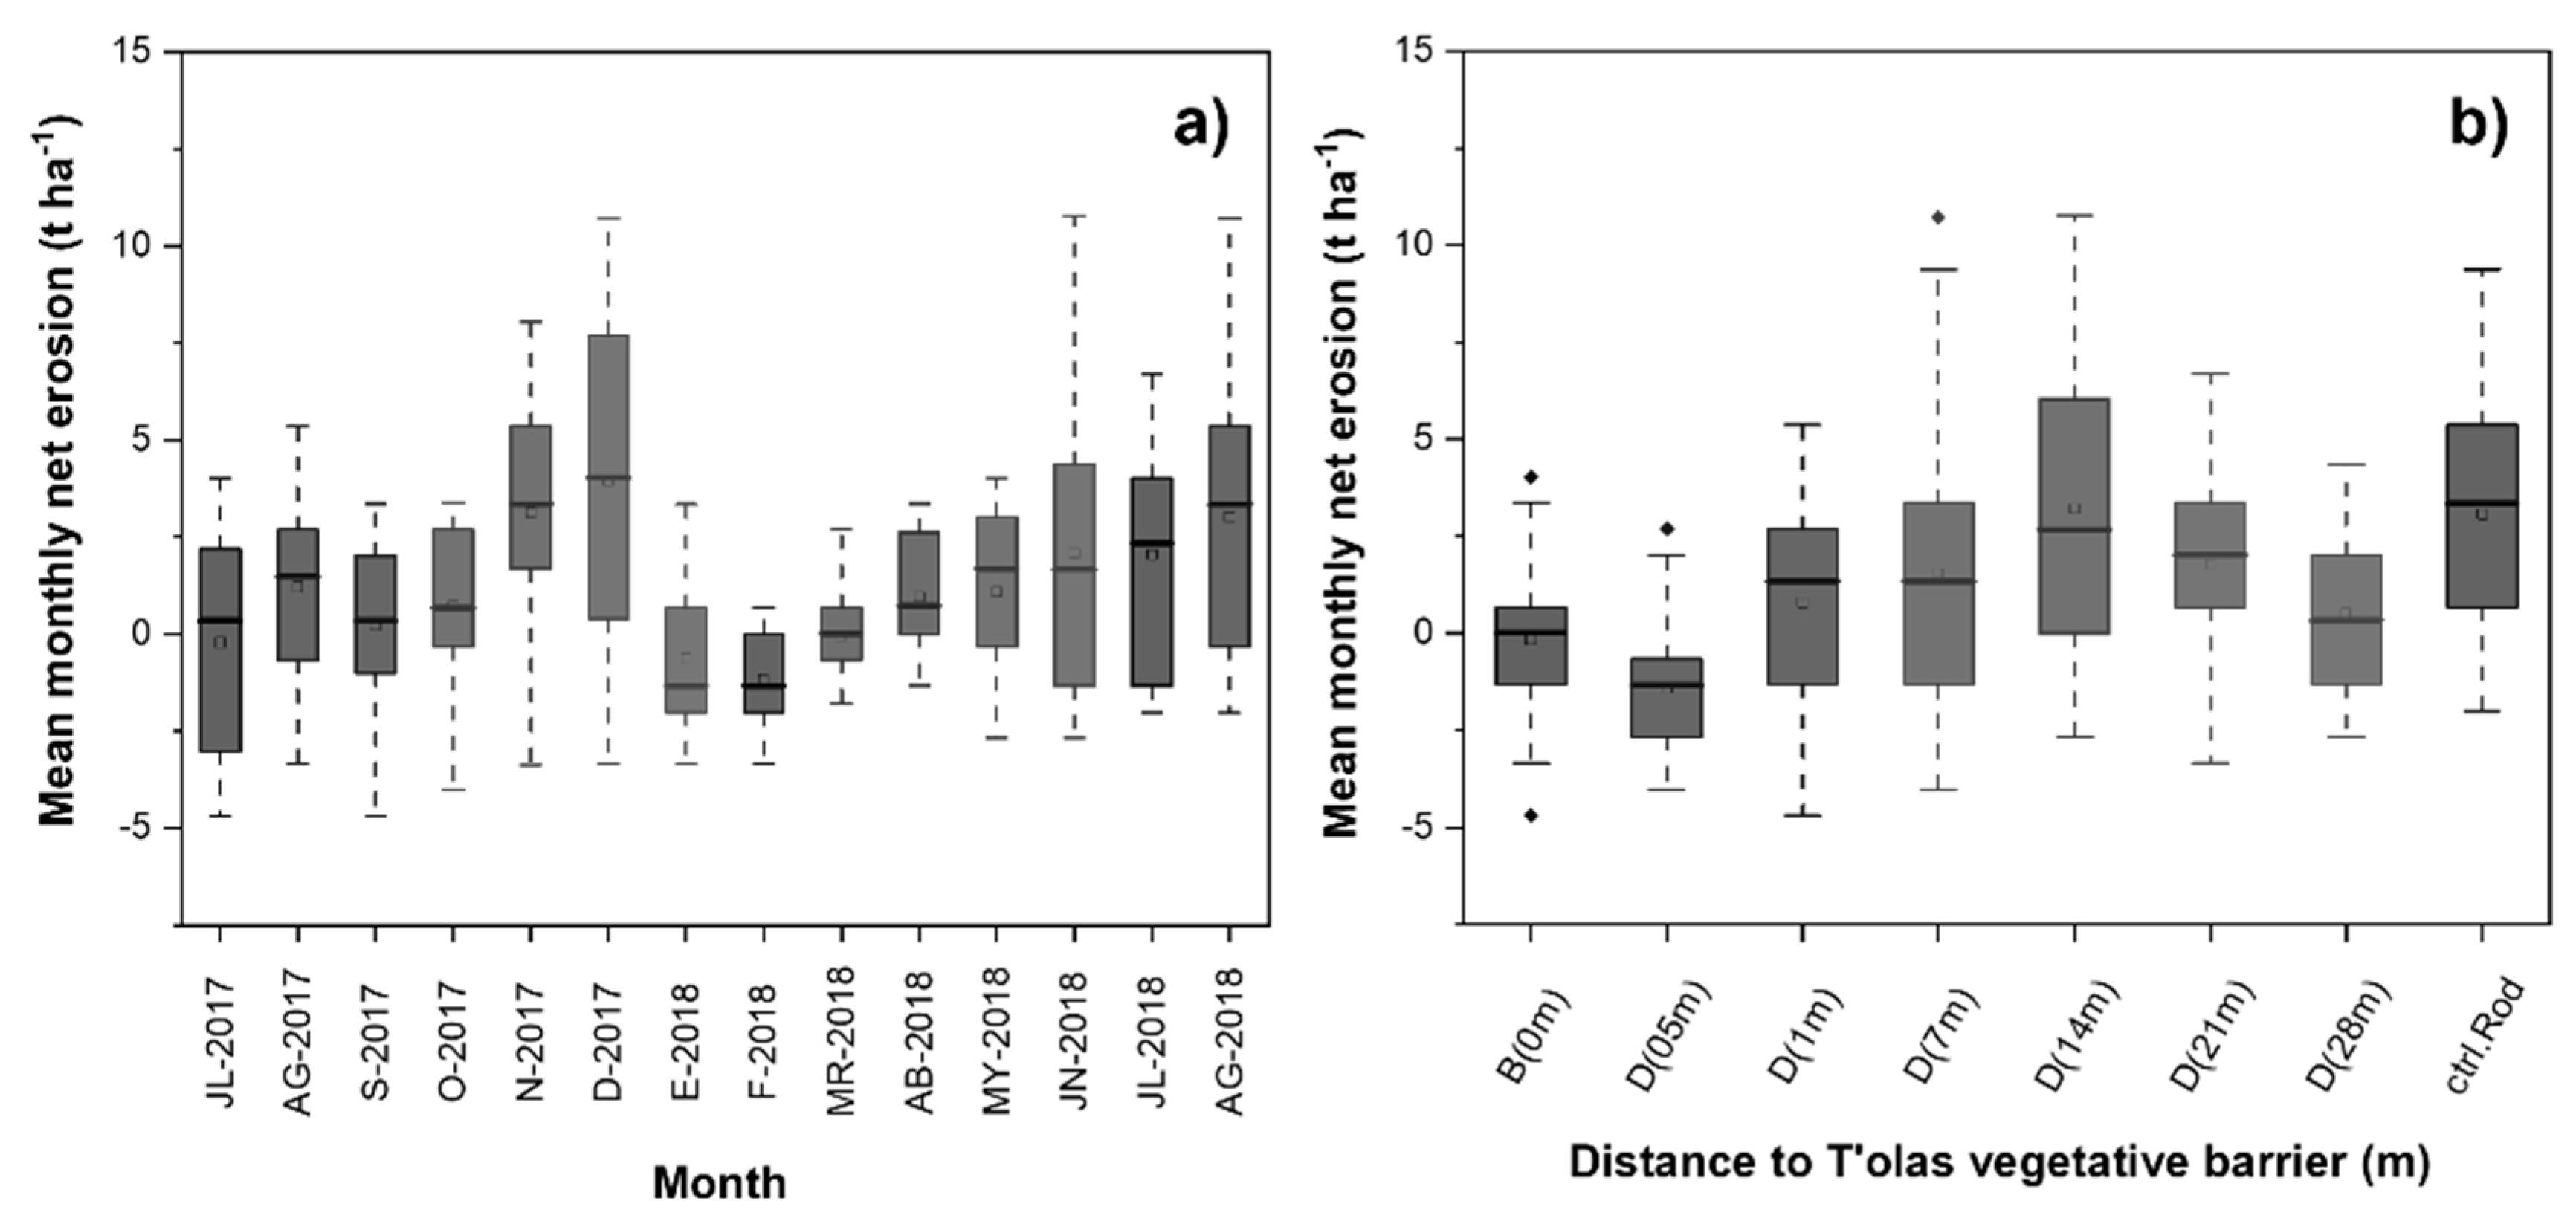
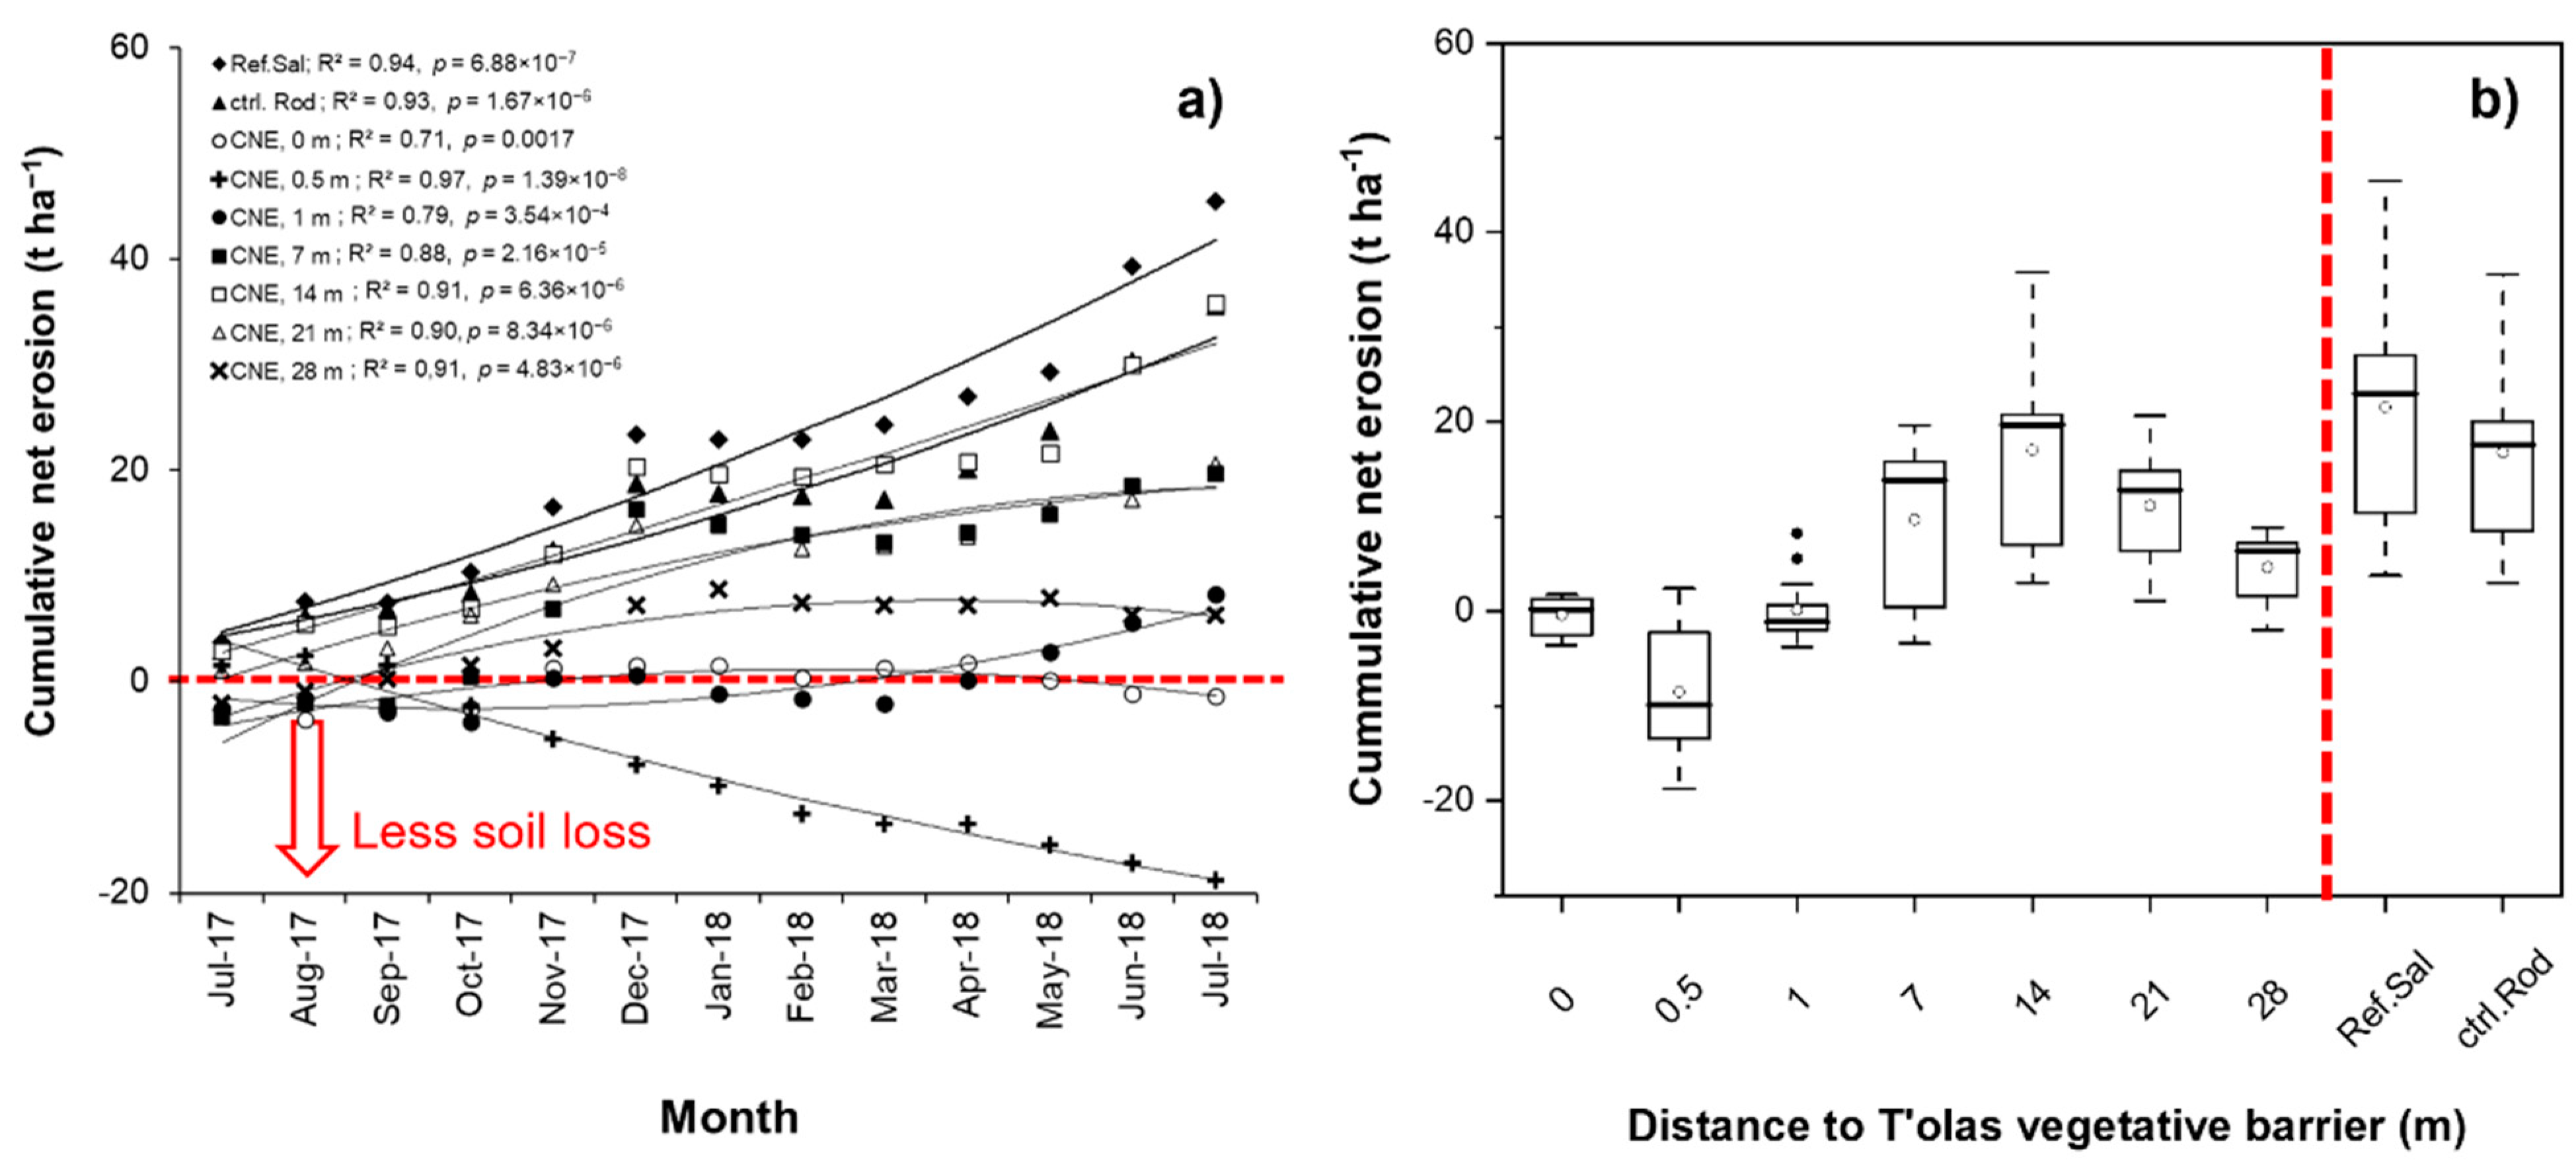
3.3. Net Erosion
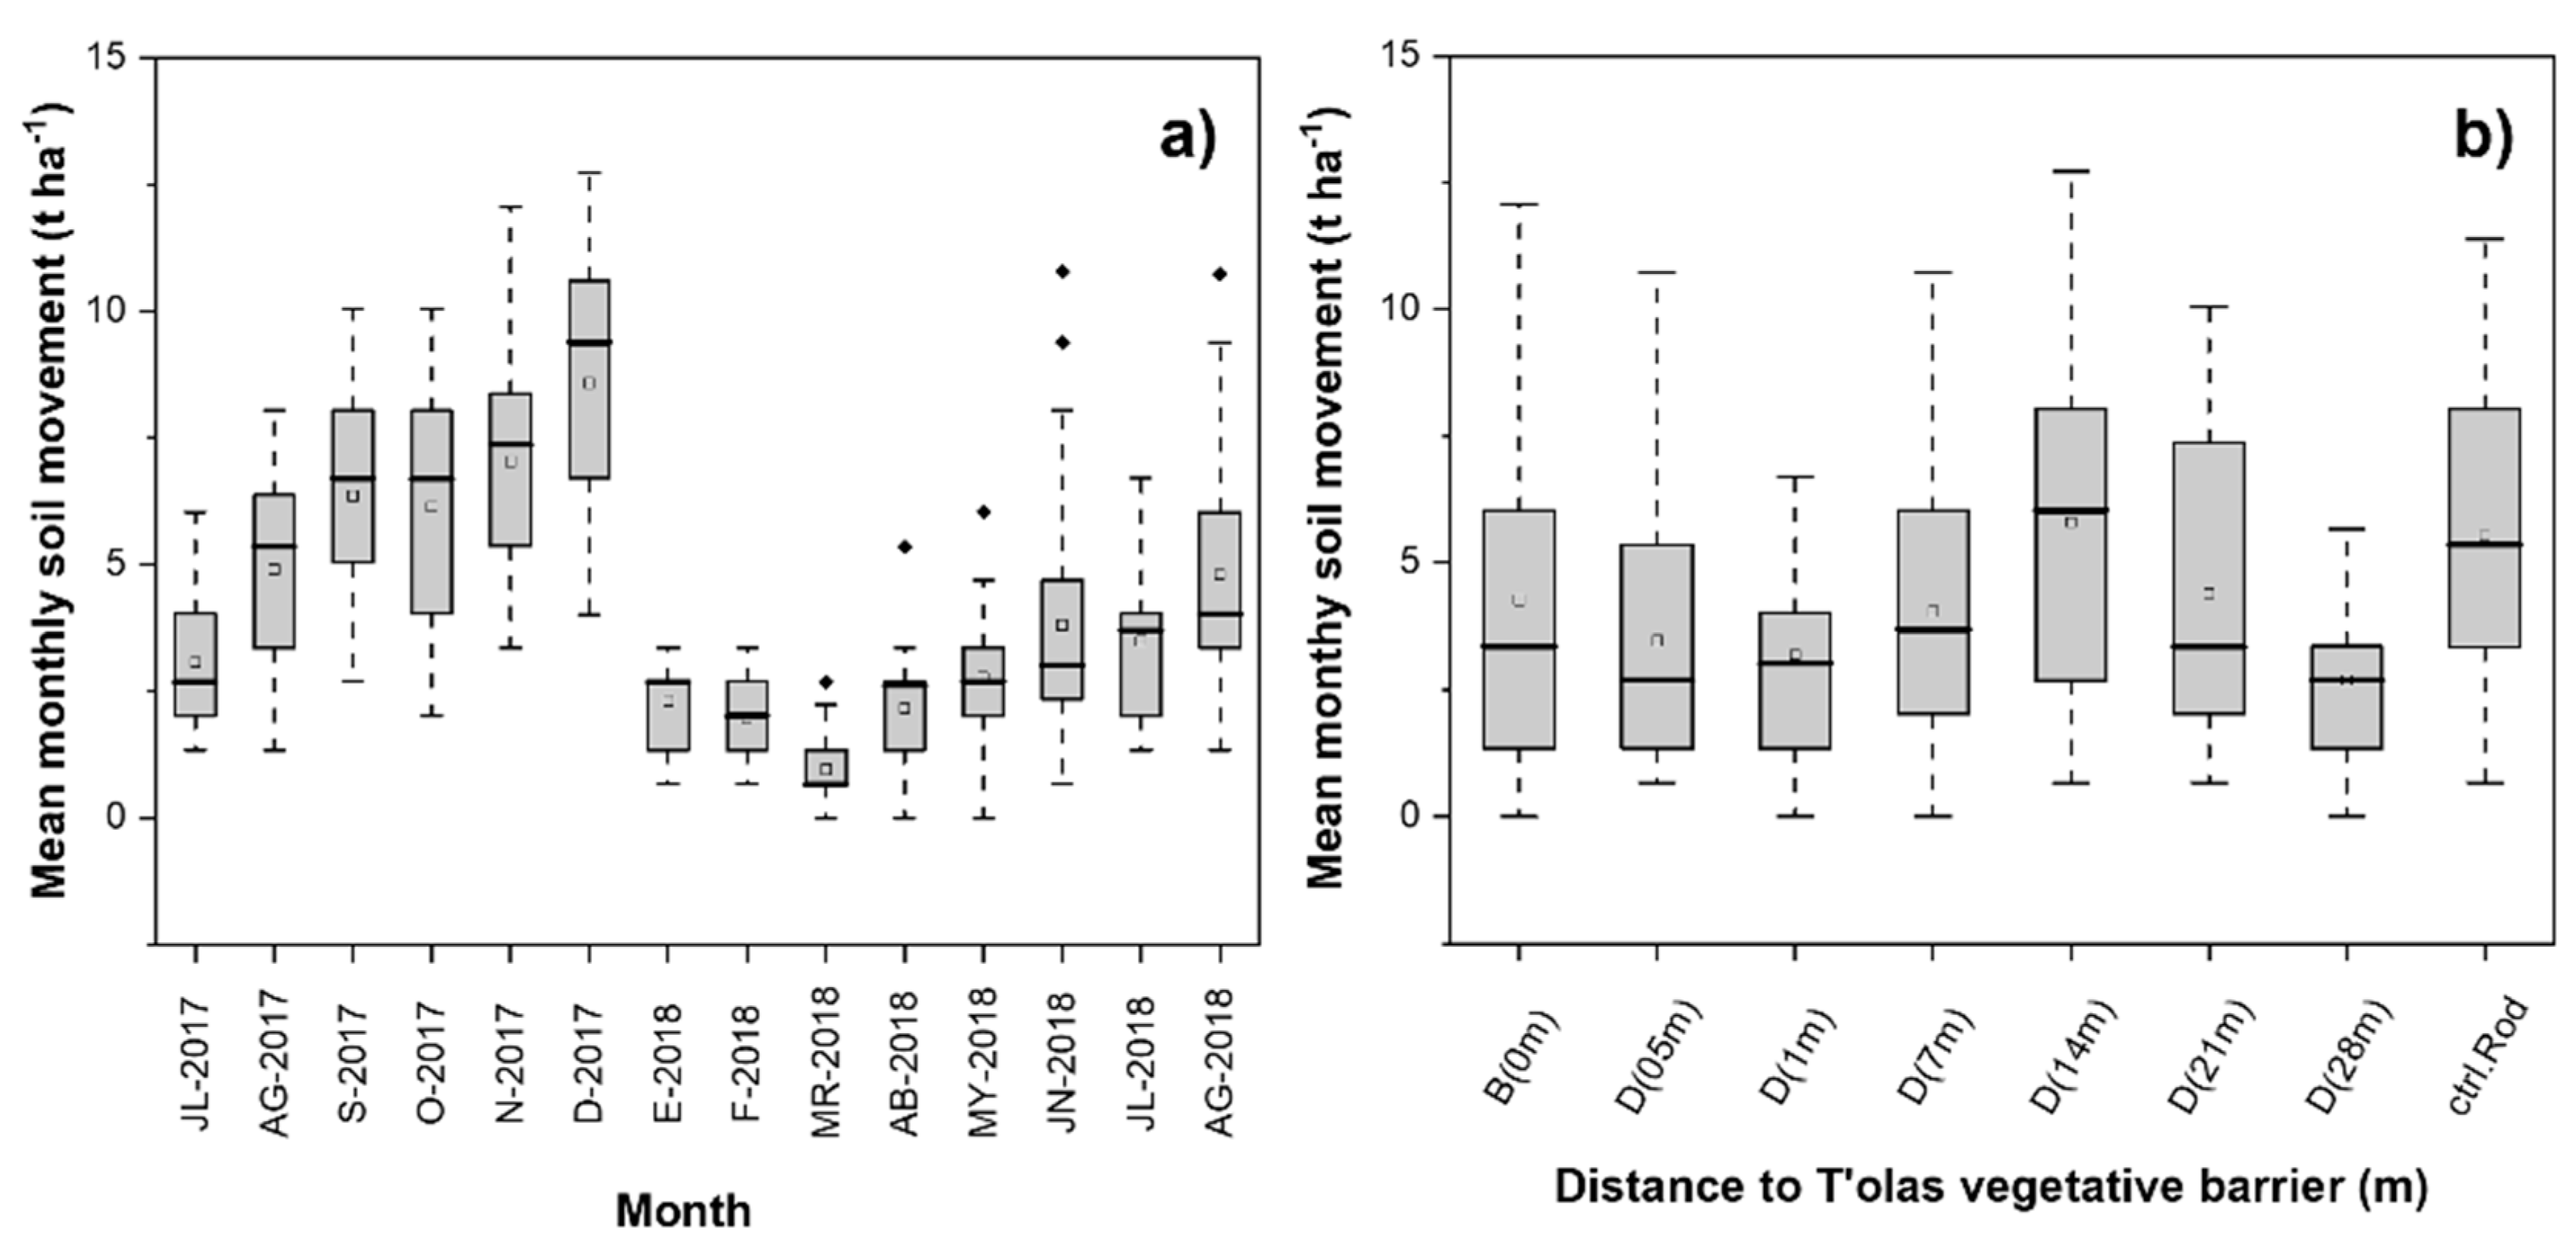
3.4. Movement of Soils
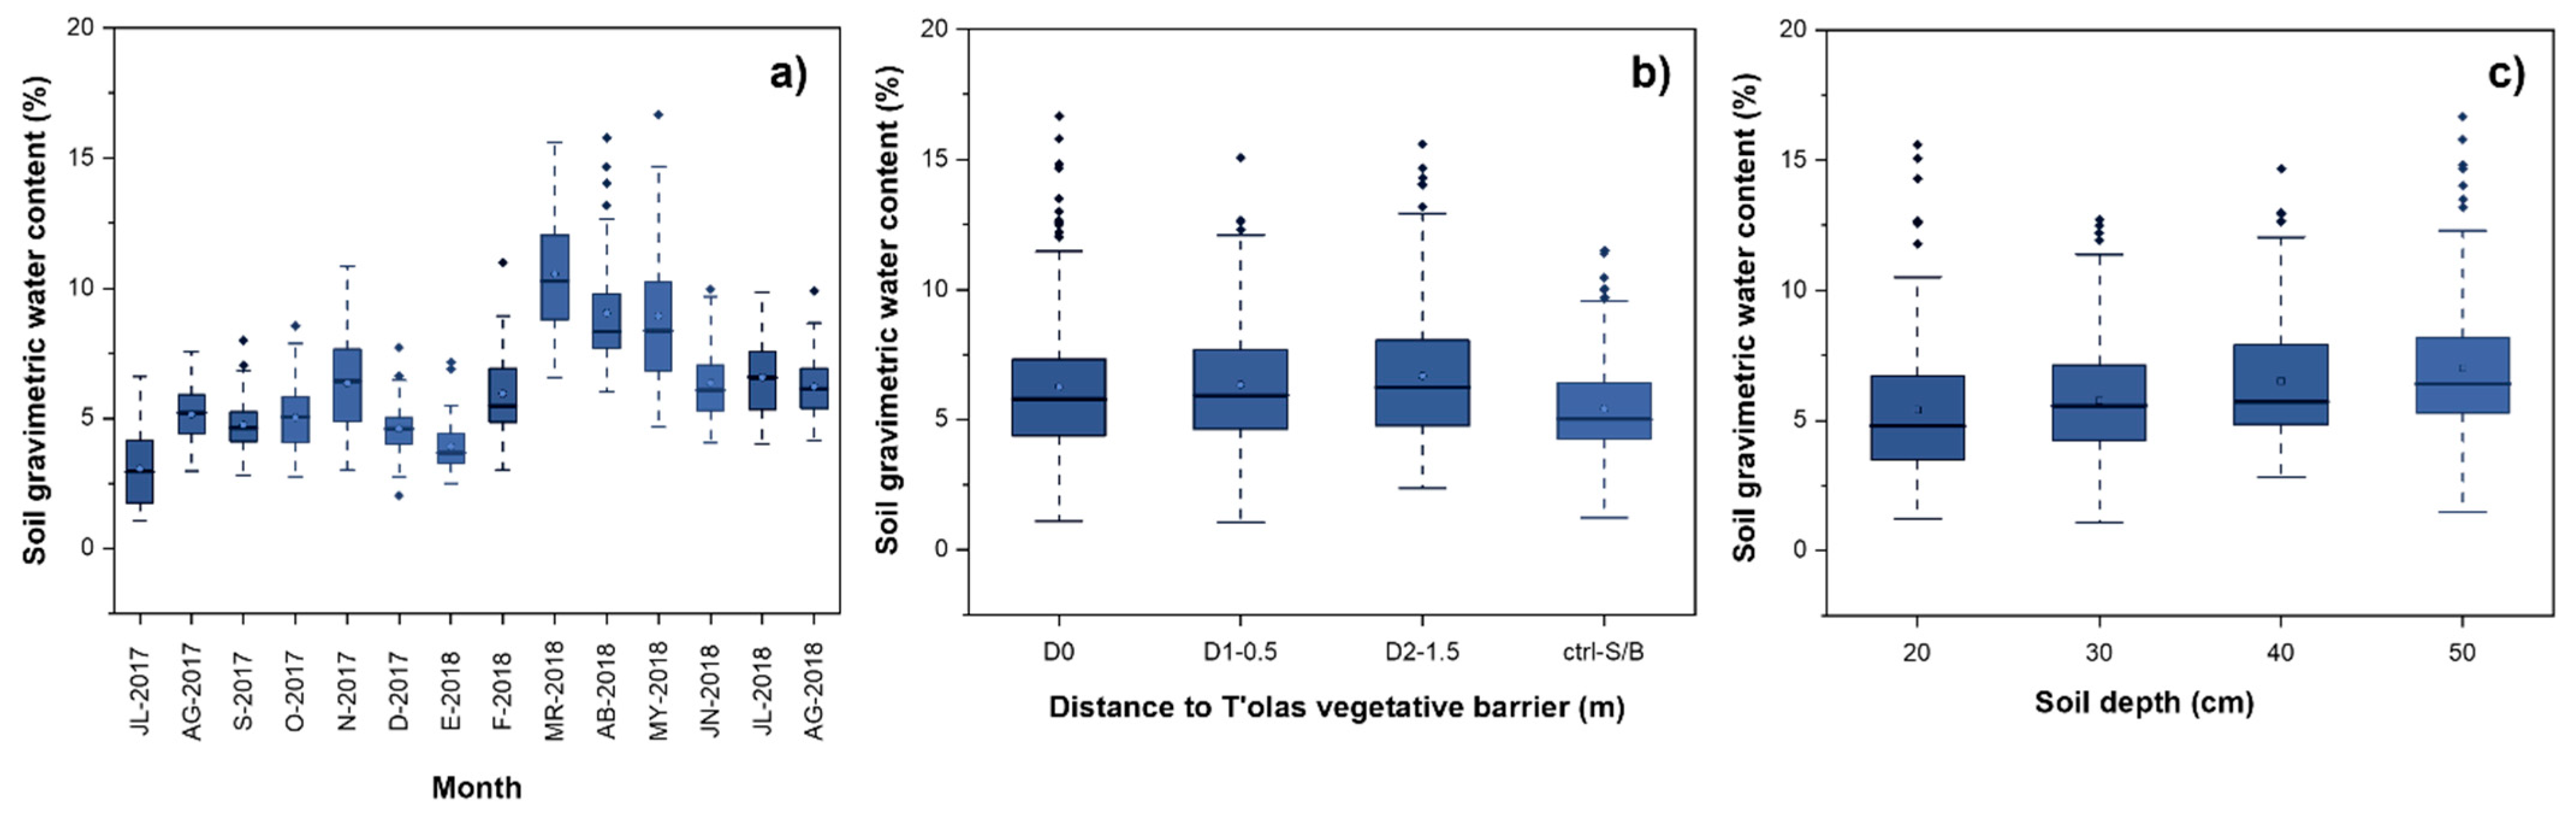
3.5. Soil Gravimetric Water Content
3.6. Nitrogen Contribution to the System Incorporating Wild Lupinus spp.
4. Discussion
5. Conclusions
Author Contributions
Funding
Institutional Review Board Statement
Data Availability Statement
Conflicts of Interest
References
- Navarro, G.; Maldonado, M. Geografía Ecológica de Bolivia. Vegetación y Ambientes Acuáticos; Centro de Ecología Simón I. Patiño-Departamento de Difusión: Santa Cruz de la Sierra, Bolivia, 2004; Volume 2, pp. 243–268. [Google Scholar]
- Coppus, R.; Imeson, A.C.; Sevink, J. Identification, distribution and characteristics of erosion sensitive areas in three different central Andean geo-ecosystems. Catena 2003, 51, 315–328. [Google Scholar] [CrossRef]
- Medrano, A.; Torrico, J. Consequences of quinoa production (Chenopodium quinoa Willd.) increased in the southern altiplano of Bolivia. J. Cienc. Tecnol. Agrar. 2009, 1, 117–123. [Google Scholar]
- Jacobsen, S.-E. The Situation for Quinoa and Its Production in Southern Bolivia: From Economic Success to Environmental Disaster. J. Agron. Crop Sci. 2011, 197, 390–399. [Google Scholar] [CrossRef]
- Gandarillas, A.; Rojas, W.; Bonifacio, A.; Ojeda, N. La Quinua en Bolivia: Perspectiva de la Fundación PROINPA. In Estado del Arte de la Quinua en el Mundo en 2013; Organización de las Naciones Unidas para la Alimentación y la Agricultura: Rome, Italy, 2014; p. 724. Available online: https://www.fao.org/3/a-i4042e.pdf (accessed on 12 December 2022).
- Alandia, G.; Rodriguez, J.P.; Jacobsen, S.-E.; Bazile, D.; Condori, B. Global expansion of quinoa and challenges for the Andean región. Glob. Food Secur. 2020, 26, 100429. [Google Scholar] [CrossRef]
- Soraide, D. La Quinua Real, Producción, Consume Interno y Mercado en el Altiplano sur de Bolivia. Texto: Estudio de Caso e Investigación, Carrera Ing; Agronómica, Facultad de Ciencias Agrícola y Pecuaria, UATF: Cochabamba, Bolivia, 2021; 34p. [Google Scholar]
- Joffre, R.; Acho, J. Expansión de la frontera agrícola y dinámica de la vegetación poscultivo en el sur del altiplano boliviano. In Proceedings of the III Congreso Mundial de la Quinua, Oruro, Bolivia, 16–19 March 2010; Libro resumen. pp. 16–19. [Google Scholar]
- Vallejos, P.; Navarro, Z.; Ayaviri, D. Medio Ambiente y Producción de Quinua. Estrategias de Adaptación a los Impactos del Cambio Climático; Fundacion Pieb: La Paz, Bolivia, 2011; p. 242. [Google Scholar]
- Winkel, T.; Cruz, P.; Del Castillo, C.; Gasselin, P.; Joffre, R.; Peredo, S.; Sáez, L.; Vassas-Toral, A.; Vieira-Pak, M. La (in)sostenibilidad de la quinua en el altiplano andino: ¿mito o realidad? In Proceedings of the V Congreso Mundial de la Quinoa, II Simposio Internacional de Granos Andinos, Jujuy, Argentina, 27–30 May 2015; pp. 27–30. [Google Scholar]
- Buksman, W.N.; Wesz, V.J. Mudanças agrárias e especialização produtiva no altiplano Sul da Bolívia. Rev. Campo-Territ. 2019, 13, 6–28. [Google Scholar] [CrossRef]
- Risi, J.; Rojas, W.; Pacheco, M. Producción y Mercado de la Quinua en Bolivia. Instituto Interamericano de Cooperación para la Agricultura—IICA; Texto de Consult: La Paz, Bolivia, 2015; 308p. [Google Scholar]
- FAOSTAT. Base de Datos Estadísticos de La FAO. 2020. Available online: http://faostat.fao.org/ (accessed on 22 October 2022).
- Instituto Nacional de Estadistica (INE). Estadísticas Económicas, Ministerio de Planificación del Desarrollo, Estado Plurinacional de Bolivia. 2022. Available online: https://www.ine.gob.bo/ (accessed on 15 December 2022).
- Andressen, R.; Monasterio, M.; Terceros, L.F. Regímenes climáticos del altiplano sur de Bolivia: Una región afectada por la desertificación. Rev. Geográfica Venez. 2007, 48, 11–32. [Google Scholar]
- Winkel, T. Para durar cambiemos: Paradojas y lecciones del éxito de la quinua. Informe científico final del proyecto EQUECO- Emergencia de la quinua en el comercio mundial: Consecuencias para la sostenibilidad social y agrícola en el altiplano boliviano. Cooperación Franco-Boliviana. ANR (Agencia Nacional de la Investigación, Francia). In Informe de Proyecto, ANR-06-PADD-011; CIRAD/CNRS/EHESS/INRA/IRD (coord.)/UM3: Montpellier, France, 2011; p. 92. [Google Scholar]
- Fairtrade International. Documento Explicativo de la Unidad de Criterios y Precios sobre el Criterio de Comercio Justo Fairtrade para Cereales. 2012. Available online: https://www.fairtrade.net/ (accessed on 14 November 2022).
- Bio Suisse—Normas Para el Cultivo, la Transformación y el Comercio de Productos Yema (Parte V—Extracto). 2022. Available online: https://www.bio-suisse.ch/de.html (accessed on 6 January 2023).
- Reglamento (CE) No 834/2007 del Consejo sobre producción y etiquetado de los productos ecológicos y por el que se deroga el Reglamento (CEE) no 2092/91. In Diario Oficial de la Unión Europea; European Commission: Brussels, Belgium, 2007.
- USDA-AMS National Organic Program. USDA Organic Standards 7 CFR 205, Reglamentos Orgánicos Estadounidenses, Actualizados al 3 de Diciembre de 2013. Available online: https://www.ecfr.gov/ (accessed on 21 February 2023).
- Estado Plurinacional de Bolivia. LEY 3525 Regulación y Promoción de la Producción Agropecuaria y Forestal no Maderable Ecológica. Gaceta Oficial. 2006. Available online: https://www2.congreso.gob.pe/sicr/cendocbib/con4_uibd.nsf/6B5CF71BD9A307DB05257C13005FFCC0/$FILE/ley_3525_Bolivia.pdf (accessed on 13 July 2023).
- Liuhto, M.; Mercado, G.; Aruquipa, R. El cambio climático sobre la producción de quinua en el altiplano boliviano y la capacidad de adaptación de los agricultores. Rev. Investig. Innovación Agropecu. Recur. Nat. 2016, 3, 166–178. [Google Scholar]
- Gene, S.M.; Hoekstra, P.F.; Hannam, C.; White, M.; Truman, C.; Hanson, M.L.; Prosser, R.S. The role of vegetated buffers in agriculture and their regulation across Canada and the United States. J. Environ. Manag. 2019, 243, 12–21. [Google Scholar] [CrossRef]
- Frankl, A.; De Boever, M.; Bodyn, J.; Buysens, S.; Rosseel, L.; Deprez, S.; Bielders, C.; Dégre, A.; Stokes, A. Report on the effectiveness of vegetative barriers to regulate simulated fluxes of runoff and sediment in open agricultural landscapes (Flanders, Belgium). Land Degrad. Dev. 2021, 32, 4445–4449. [Google Scholar] [CrossRef]
- Richet, J.; Ouvry, J.; Saunier, M. The role of vegetative barriers such as fascines and dense shrub hedges in catchment management to reduce runoff and erosion effects: Experimental evidence of efficiency, and conditions of use. Ecol. Eng. 2017, 103, 455–469. [Google Scholar] [CrossRef]
- Ou, Y.; Rousseau, A.N.; Yan, B.; Wang, L.; Zhang, Y. Grass barriers for mitigating diffuse pollution within a source water area—A case study of Northeast China. Agric. Water Manag. 2021, 243, 106461. [Google Scholar] [CrossRef]
- Barrientos, E.; Carevic, F.; Delatorre, J. La sustentabilidad del altiplano sur de Bolivia y su relación con la ampliación de superficies de cultivo de quinua. Rev. Idesia 2017, 35, 7–15. [Google Scholar] [CrossRef]
- Hudson, N. Medición sobre el terreno de la erosión del suelo y de la escorrentía. In Boletín de Suelos de la FAO; FAO: Rome, Italy, 1997; 147p. [Google Scholar]
- González, H.; Cantú, I.; Ramírez, R.; Gómez, M.; Pando, M.; López, J. Potencial hídrico xilemático en cuatro especies arbustivas nativas del noreste de México. Revista Chapingo. Ser. Cienc. For. Ambiente 2011, 17, 97–109. [Google Scholar] [CrossRef]
- Alvarez, R.; Steinbach, H.S.; Bauschen, B.; Enjalbert, J.N. ¿Cuántas Submuestras de Suelo Hay Que Tomar para Caracterizar la Fertilidad de un Lote en la Pampa Ondulada? Documento Facultad de Agronomía UBA Argentina. 2012. Available online: https://fertilizar.org.ar/wp-content/uploads/2008/03/4.pdf (accessed on 21 January 2023).
- Sadzawka, A.; Carrasco, M.; Mora, M.; Flores, H.; Neaman, A. Métodos de Análisis Recomendado para Los Suelos de Chile; Centro Regional de Investigación La Platina: Buin, Chile, 2006; 163p. [Google Scholar]
- IBM Corp. IBM SPSS Statistics for Windows; Version 28.0; IBM Corp.: Armonk, NY, USA, 2021. [Google Scholar]
- OriginPro. OriginLab Corporation; OriginPro: Northampton, MA, USA, 2019. [Google Scholar]
- Miranda, R.; Calderon, S.; Cadena, F. Erosión Eólica En Zonas Productoras de Quinua En El Altiplano Boliviano. Rev. CINTEX 2016, 21, 71–84. Available online: https://revistas.pascualbravo.edu.co/index.php/cintex/article/view/18 (accessed on 11 December 2022).
- SISMET-SENAMHI Bolivia. Base de Datos Meteorológicos de Bolivia. 2021. Available online: https://www.senamhi.gob.bo/sismet (accessed on 25 June 2022).
- Cossio, J. Agricultura de conservación con un enfoque de manejo sostenible en el Altiplano sur. Rev. Hábitat 2008, 75, 44–49. Available online: http://www.lidema.org.bo/ (accessed on 17 June 2022).
- Gutierrez, Z.; Ordoñez, C. Monitoreo de la erosión eólica y profundidad de humedad del suelo en la campaña agrícola 2001–2012 en diez municipios productores de Quinua Real. In Experiencias y Logros en Desarrollo Social y Tecnológico del Programa Complejo Quinua Altiplano Sur de Bolivia; Fundacion FAUTAPO COMPASUR: Oruro, Bolivia, 2013; Volume 1, pp. 61–75. [Google Scholar]
- Orsag, C.; Vladimir, L.P.; Lucy, P.Y.; Olga, A.; Castro, R.E. Evaluación de la fertilidad de los suelos para a producción sostenible de quinua. Rev. Tinkazos 2013, 16, 89–112. [Google Scholar]
- Rojas, W.; Risi, J.; Bonifacio, A.; Gandarillas, H. El Cultivo de la Quinua en Bolivia. In Producción y Mercado de la Quinua en Bolivia; Risi, J., Rojas, W., Pacheco, M., Eds.; Instituto Interamericano de Cooperación para la Agricultura—IICA: La Paz, Bolivia, 2015. [Google Scholar]
- Fundación Tierra. Auge y Caída de la Quinua. Cambios Territoriales en la Marka Salinas. 13/5.000; Documento Elaborado en Coordinación IPAS-Fundación Tierra y el Departamento de Agricultura de la FCAN-UTO; Fundacion Tierra: La Paz, Bolivia, 2021; 59p, Available online: https://www.ftierra.org/ (accessed on 9 July 2022).
- Del Barco-Gamarra, M.; Foladori, G.; Soto-Esquivel, R. Insustentabilidad de la producción de quinua en Bolivia. Estudios Sociales. Rev. Aliment. Contemp. Desarro. Reg. 2019, 29, 1–26. [Google Scholar] [CrossRef]
- Medrano, E.; Torrico, J.; Fortanelli, J. Anáalisis de la sostenibilidad de la producción de quinua (Chenopodium quinoa Willd.) en el Intersalar Boliviano. Rev. Cienc. 2011, 2, 303–312. [Google Scholar]
- Winkel, T.; Bertero, H.; Bommel, P.; Bourliaud, J.; Chevarría, M.; Cortés, G.; Gasselin, P.; Geerts, S.; Joffre, R.; Léger, F.; et al. The sustainability of quinoa production in southern Bolivia: From misrepresentations to questionable solutions. Comments on S. Jacobsen (2011), J. Agron. Crop Sci. 197: 390399. J. Agron. Crop Sci. 2012, 398, 314–319. [Google Scholar] [CrossRef] [Green Version]
- Van Pelt, R.S. Erosion by Wind: Environmental Effects. In Encyclopedia of Soil Science, 2nd ed.; Hatfield, J.L., Sauer, T.J., Eds.; Taylor and Francis: London, UK, 2011. [Google Scholar] [CrossRef]
- Cárdenas, J.E.; Urquizo, O.V.; Cárdenas, M.I.; Fernández, R.; Orzag, V. Degradación de suelos y tipología de productores para la sostenibilidad del cultivo de quinua (Chenopodium quinoa Wild) en el intersalar del departamento de Oruro. Rev. Apthapi 2015, 1, 58–68. [Google Scholar]
- Vargas, M.; Sandy, A. Tecnologías de manejo de suelos agrícolas en la región del intersalar del altiplano boliviano (No. IICA P30-1). Rev. IICA 2017, 1, 23–34. [Google Scholar]
- Cárdenas, J.; Choque, W. Fertilidad, Uso y Manejo de Suelos en la Zona del Intersalar, Departamentos de: Oruro y Potosí; Fundación FAUTAPO, Programa Quinua Altiplano: Tarija, Bolivia, 2008; 113p. [Google Scholar]
- Tintaya, J.C. Evaluación del Efecto de Niveles de Abonamiento Orgánico Sobre la Respuesta del Cultivo de la Quinua (Chenopodium quinoa Willd) Bajo Condiciones de Riego Deficitario en el Altiplano. Sur. Thesis, Universidad Mayor de San Andrés, La Paz, Bolivia, 2011. Available online: http://repositorio.umsa.bo/xmlui/handle/123456789/7323 (accessed on 25 November 2022).
- Cárdenas-Castillo, J.E.; Delatorre-Herrera, J.; Bascuñán-Godoy, L.; Rodriguez, J.P. Quinoa (Chenopodium quinoa Wild.) Seed Yield and Efficiency in Soils Deficient of Nitrogen in the Bolivian Altiplano: An Analytical Review. Plants 2021, 10, 2479. [Google Scholar] [CrossRef] [PubMed]
- Peri, P.L.; Lasagno, R.G.; Chartier, M.; Roig, F.; Rosas, Y.M.; Pastur, G.M. Soil erosion rates and nutrient loss in rangelands of Southern Patagonia. In Imperiled: The Encyclopedia of Conservation; Elsevier: Amsterdam, The Netherlands, 2021; pp. 102–110. ISBN 9780124095489. [Google Scholar] [CrossRef]
- Alandia, G.; Calderon, S.; Condori, B.; Jacobsen, S. Quantification of Wind Erosion under Four Different Types of Vegetation Cover in Quinoa Fields of the Southern Bolivian Highlands; Universidad de Wageningen: Wageningen, The Netherlands, 2014. [Google Scholar]
- Wu, X.; Fan, J.; Sun, L.; Zhang, H.; Xu, Y.; Yao, Y.; Chi, W. Wind erosion and its ecological effects on soil in the northern piedmont of the Yinshan Mountains. Ecol. Indic. 2021, 128, 107825. [Google Scholar] [CrossRef]


| Latitude: 20°28′20″ S | Longitude: 66°49′53″ O | Altitude: 3669 masl | ||||||
|---|---|---|---|---|---|---|---|---|
| Temperature °C | Rainfall mm | Wind Speed km h−1 | ||||||
| Month | Year | Mean | Maximum | Minimum | Thermal Oscillation | Mean | Maximum | |
| July | 2017 | 2.3 | 14.4 | −9.8 | 24.2 | 0 | NW 8.4 | N 29.7 |
| August | 2017 | 3.1 | 15.1 | −8.9 | 24 | 0 | NW 12.1 | NW 74.1 |
| September | 2017 | 7.3 | 16.8 | −2.1 | 18.9 | 0 | NW 12.2 | NW 44.5 |
| October | 2017 | 8.8 | 19.1 | −1.4 | 20.5 | 0 | NW 13.9 | NW 44.5 |
| November | 2017 | 10.6 | 21.2 | 0 | 21.2 | 0.8 | NW 9.1 | NW 29.7 |
| December | 2017 | 13.9 | 22.1 | 5.8 | 16.3 | 24 | NW 14.7 | S 44.5 |
| January | 2018 | 13.8 | 21.1 | 6.5 | 14.6 | 57.2 | NW 9.8 | NW 44.5 |
| February | 2018 | 12.7 | 19.2 | 6.3 | 12.9 | 63.3 | NW 11.5 | SE 29.7 |
| March | 2018 | 12.3 | 19.8 | 4.9 | 14.9 | 17.5 | NW 9.0 | NW 22.2 |
| April | 2018 | 9.8 | 19.5 | 0.1 | 19.4 | 0 | NW 8.6 | NW 29.7 |
| May | 2018 | 4 | 15 | −7 | 22 | 0 | NW 6.3 | NW 22.2 |
| June | 2018 | 2.9 | 12 | −6.1 | 18.1 | 5.8 | NW 11.9 | N 29.7 |
| July | 2018 | 4.2 | 13.6 | −5.1 | 18.7 | 7 | NA | NA |
| August | 2018 | 3.1 | 13.2 | −7 | 20.2 | 14 | NW 8.8 | NW 22.2 |
| Mean | 7.8 | 17.3 | −1.7 | 19.0 | ||||
| Total | 189.6 | |||||||
| Location | Clay | Silt | Sand | Texture | pH | EC | OM | Nt | P |
|---|---|---|---|---|---|---|---|---|---|
| % | (1:2.5) | dS m−1 | % | mg kg−1 | |||||
| B-Rodeo | 13 | 26 | 61 | FA | 8.0 | 0.616 | 0.46 | 0.046 | 6.4 |
| 0.5-B-Rodeo | 11 | 40 | 49 | F | 7.9 | 0.833 | 0.54 | 0.046 | 5.9 |
| 1.5-B-Rodeo | 13 | 38 | 49 | F | 8.0 | 0.389 | 0.24 | 0.018 | 1.9 |
| Ref.Sal | 4 | 9 | 87 | A | 7.7 | 0.105 | 0.31 | 0.032 | 3.7 |
| Treatment Location | Total Nitrogen (Nt) | Ammonium Nitrogen | Nitrogen Nitrates | Rhizobium spp. | Total Bacteria |
|---|---|---|---|---|---|
| Percentage | mg kg−1 | mg kg−1 | cfu g−1 Soil | ||
| Ref.Sal | 0.031 | 5.6 | 1.4 | 2.3 × 10³ | 8.5 × 10⁵ |
| Soils + lupino1 | 0.053 | 2.8 | 2.8 | --------- | --------- |
| Soils + lupino2 | 0.056 | 2.8 | 8.4 | 8.8 × 10⁴ | 2.3 × 10⁷ |
Disclaimer/Publisher’s Note: The statements, opinions and data contained in all publications are solely those of the individual author(s) and contributor(s) and not of MDPI and/or the editor(s). MDPI and/or the editor(s) disclaim responsibility for any injury to people or property resulting from any ideas, methods, instructions or products referred to in the content. |
© 2023 by the authors. Licensee MDPI, Basel, Switzerland. This article is an open access article distributed under the terms and conditions of the Creative Commons Attribution (CC BY) license (https://creativecommons.org/licenses/by/4.0/).
Share and Cite
Barrientos-Pérez, E.; Carevic-Vergara, F.S.; Rodriguez, J.P.; Arenas-Charlín, J.; Delatorre-Herrera, J. Effect of Native Vegetative Barriers to Prevent Wind Erosion: A Sustainable Alternative for Quinoa (Chenopodium quinoa Willd.) Production. Agriculture 2023, 13, 1432. https://doi.org/10.3390/agriculture13071432
Barrientos-Pérez E, Carevic-Vergara FS, Rodriguez JP, Arenas-Charlín J, Delatorre-Herrera J. Effect of Native Vegetative Barriers to Prevent Wind Erosion: A Sustainable Alternative for Quinoa (Chenopodium quinoa Willd.) Production. Agriculture. 2023; 13(7):1432. https://doi.org/10.3390/agriculture13071432
Chicago/Turabian StyleBarrientos-Pérez, Ermindo, Felipe S. Carevic-Vergara, Juan Pablo Rodriguez, Jorge Arenas-Charlín, and José Delatorre-Herrera. 2023. "Effect of Native Vegetative Barriers to Prevent Wind Erosion: A Sustainable Alternative for Quinoa (Chenopodium quinoa Willd.) Production" Agriculture 13, no. 7: 1432. https://doi.org/10.3390/agriculture13071432