Article

Evaluation of the Genetic Diversity of Greek Garlic (Allium sativum L.) Accessions Using DNA Markers and Association with Phenotypic and Chemical Variation

by
Charikleia Papaioannou
1,2,
Georgia Fassou
3,
Spyridon A. Petropoulos
4,
Fotini N. Lamari
5,
Penelope J. Bebeli
6 and
Vasileios Papasotiropoulos
1,*
1
Department of Agriculture, University of Patras, Nea Ktiria, 30200 Messolonghi, Greece
2
Laboratory of Genetics, Department of Biology, University of Patras, University Campus Rion, 26504 Patras, Greece
3
Laboratory of Botany, Division of Plant Biology, Department of Biology, University of Patras, University Campus Rion, 26504 Patras, Greece
4
Laboratory of Vegetable Production, Department of Agriculture Crop Production and Rural Environment, University of Thessaly, Fytokou, 38446 Volos, Greece
5
Laboratory of Pharmacognosy & Chemistry of Natural Products, Department of Pharmacy, University of Patras, University Campus Rion, 26504 Patras, Greece
6
Laboratory of Plant Breeding and Biometry, Department of Crop Science, Agricultural University of Athens, Iera Odos 75, 11855 Athens, Greece
*
Author to whom correspondence should be addressed.
Agriculture 2023, 13(7), 1408; https://doi.org/10.3390/agriculture13071408
Submission received: 29 May 2023 / Revised: 9 July 2023 / Accepted: 14 July 2023 / Published: 15 July 2023

Abstract

:
The genetic diversity of 27 garlic accessions (local varieties/landraces) was investigated using five simple sequence repeat (SSR) and six inter-simple sequence repeat (ISSR) markers. The SSR genotyping revealed 26 different alleles, while 84 polymorphic bands were produced using the ISSR markers. The average polymorphism information content (PIC) was 0.471 and 0.465 for the SSR and the ISSR markers, respectively. Compared to ISSRs, SSR markers revealed a higher level of redundancy, indicating potential duplicates among the accessions. The analysis of molecular variance (AMOVA) based on both marker systems showed that most of the molecular diversity was attributable to differences within accessions, rather than among them. UPGMA, STRUCTURE, and Principal Coordinate Analysis (PCoA) based on the SSRs produced similar clustering results, although not in agreement with those produced by the ISSR markers. Fisher’s exact tests and multinomial logistic regression analyses identified significant associations between the chemical compounds, the morphological traits of the bulb, and specific SSR and ISSR loci. Our results provide a molecular basis for understanding the genetic diversity of Greek garlic landraces, which could be useful for the conservation and sustainable management of this crop. Potential markers fostering the selection of genotypes in garlic breeding have also been revealed.

1. Introduction

Garlic (Allium sativum L.) is a bulbous perennial crop cultivated in different temperate and subtropical climates all over the world [1,2]. It belongs to the genus Allium, which includes almost 1008 species distributed in 15 subgenera and more than 70 sections [3,4]. Within the Alliaceae family, garlic is the most widely consumed bulb after onion [5]. The total world production for garlic reached 28,204,854.32 metric tons in 2021, with China being the largest producer, accounting for nearly 73% of total world production at 20,513,385.83 tons. In Greece, garlic is cultivated in approximately 780 ha with a total production of 8230 tons (http://fao.org/faostat/, accessed on 28 April 2023).
A. sativum was domesticated long ago; with references to its use as a vegetable, condiment, and medicinal plant dating back to ancient Egypt and India 5000 years ago, garlic is one of the oldest known crops [4]. Central Asia is considered as garlic’s primary center of origin, from where it spread to Southeastern Asia, Egypt, and the Mediterranean region [6,7]. Regarding garlic’s ancestry, the most recent theory is that A. longicuspis Regel is either the closest wild relative or the wild progenitor of cultivated garlic, although there is some debate over it [6,8].
Throughout history, garlic has been recognized as a crop of great importance in many aspects, especially those related to its significant medicinal properties [9,10]. Garlic consumption confers many health benefits, as it is a good source of vitamins, metals, saponins, flavonoids, organic acids, and various organosulfur compounds originating from alliin that is metabolized to allicin by the enzyme alliinase. Allicin and other sulfoxides may encounter many transformations resulting in various organosulfur volatiles, responsible for garlic’s medicinal properties, as well as its flavor and aroma [9,11,12]. Garlic has been proven beneficial for the prevention and treatment of cardiovascular and other metabolic diseases, and it stimulates the immune system, while it also possesses antifungal, antibacterial, antigenotoxic, antiviral, and antispasmodic properties [10,12,13].
Garlic is a diploid (2n = 2x = 16) sterile species, which is primarily propagated asexually via its bulblets (e.g., cloves) due to obligate apomixis [14,15]. Despite the existence of a few fertile wild genotypes, most of the germplasm collections worldwide comprise nonflowering plants and thus clonal selection is the method of choice in garlic breeding [4,5].
Garlic exhibits wide biodiversity, environmental adaptation capacity, and phenotypic plasticity, resulting in the establishment of diverse ecotypes in various areas of cultivation [16,17,18]. This variation in domesticated garlic is primarily due to spontaneous mutations arising throughout the history of large-scale cultivation [19,20,21], but also due to variability inherited from its wild ancestor [14]. Clonal propagation is thought to have caused a genetic bottleneck, accounting for the narrow genetic base observed in this crop. On the other hand, clonal lineages within this species exhibit high levels of diversity in several phenotypic characteristics and valuable agronomic traits, such as stress and drought tolerance [14,19,22,23].
A wealth of variability, primarily related to the crop’s morphological and genetic characteristics, chemical composition, and nutritional value, exists in germplasm accessions, particularly local landraces that are still cultivated by farmers either for trade or for their own consumption [24,25]. Since variation is essential for breeding, genetic research on germplasm accessions and landraces is necessary to understand the nature of variation and to ensure their effective use for breeding new varieties [18,23,26,27].
So far, variation assessment of garlic germplasm collections has revealed a significant amount of diversity in morphological, agronomic, and chemical traits, e.g., [2,26,28,29,30,31,32]. Recently, garlic genotypes from different areas of Greece were evaluated for their chemical composition, quality, and bulb morphology [33]. In a more comprehensive survey, Polyzos et al. [34] examined the phenotypic diversity of thirty-four (34) Greek garlic accessions, using morphological descriptors and agronomic traits, while Avgeri et al. [11] determined their levels of organosulfur compounds, pyruvate, total sugars, total phenolics, and antioxidant properties. All these studies revealed remarkable diversity, demonstrating the need for the valorization of Greek garlic genotypes and their importance for conservation and breeding.
Traditionally, morphological characters are used to assess garlic diversity. However, since morphological characters are affected by environmental conditions, they may not mirror the available genetic diversity [26,35]. Molecular markers are considered a dynamic tool for the identification, characterization, and assessment of genetic diversity, since they are less affected by age, the physiological condition of samples, and the environment [1,36]. So far, numerous types of markers have been used in garlic for germplasm identification, crop improvement, and genetic diversity evaluation, such as amplified fragment length polymorphisms (AFLPs) [16,37,38,39], random amplified polymorphic DNA (RAPD) [14,40,41], sequence-related amplified polymorphisms (SRAPs) [5,42], insertions–deletions (InDels) [39], inter-simple sequence repeats (ISSRs) [1,18,22], and simple sequence repeats (SSRs) [2,15,17,35,43,44,45]. Among these types of markers, SSRs became very popular since they are typically codominant, reproducible, highly polymorphic, and cross-species transferable [17,26], while ISSRs are broadly used in genetic studies as they are informative, reliable, and efficient in laboratory usage [18,28].
In this study, we evaluated the genetic diversity of a Greek garlic collection comprising 27 local varieties, also known as landraces, using SSR and ISSR markers. Moreover, in an attempt made to identify potential markers associated with variations in the chemical composition and the morphological characters of the bulb, we investigated possible significant associations between the SSR and the ISSR loci from this study and the characters recorded by Avgeri et al. [11] and Polyzos et al. [34] for the same cultivars. Our research, combined with the studies of Petropoulos et al. [33], Polyzos et al. [34], and Avgeri et al. [11], provides for the first time a comprehensive overview on the genetic and phenotypic variation, the chemical composition, and the nutritional value of Greek garlic landraces. Our results will further contribute to the effective management and conservation of garlic genetic resources, also highlighting their value for potential utilization in breeding programs.

2. Materials and Methods

2.1. Plant Material

Twenty-seven accessions (local varieties/landraces) were examined in the present study. The Allium schoenoprasum accession (AS29) was also included as an outgroup. The accessions studied, were those planted in the experimental field of Kavasila, Ilia Regional Unit (37°52′ Ν, 21°17′ Ε), and cultivated using standard cultivation methods for garlic in the area, as described by Polyzos et al. [34]. Table 1 shows the collection sites and the geographical coordinates of the garlic accessions used in this study.

2.2. DNA Extraction and Amplification

Using a sterile mortar and pestle, 100 mg of dried leaf tissue from five (5) individual plants per accession was ground to a fine powder under liquid nitrogen. Extraction proceeded using the CTAB (cetyltrimethylammonium bromide) method [46]. Purified DNA quality evaluation and quantification was performed spectrophotometrically and via agarose gel electrophoresis.

2.3. SSR Analysis

For PCR (polymerase chain reaction) amplification, several SSR primer pairs developed by Cunha et al. [43] and Lee et al. [47] were initially screened. Among them, five, which were amplified correctly in all accessions, were finally used (Table 2). PCR amplifications were carried out in 15 μL reactions containing 20 ng template DNA, 0.2 μM forward and reverse primers, 1.5 mM MgCl2, 0.2mM dNTPs, 1× Taq buffer, and 1 U of KAPA Taq DNA Polymerase (Kapa Biosystems, Inc., Woburn, MA, USA). PCR conditions consisted of an initial denaturation step at 94 °C for 3 min followed by 35 cycles of 30 s at 95 °C, 40 s at 48–57 °C (see Table 2), and 40 s at 72 °C, with a final extension step of 5 min at 72 °C.
Following PCR amplification, quality and quantity assessment of all PCR products was performed spectrophotometrically and via agarose gel electrophoresis to determine the quantity required as a template in capillary electrophoresis for fragment analysis. Our results showed that the size of the PCR products corresponded well to the allele sizes given by Cunha et al. [43] and Lee et al. [47] for the loci studied.
Fluorescent-labeled PCR products were separated on a SeqStudio™ Genetic Analyzer (Applied Biosystems™, Waltham, MA, USA), using 5′-labeled forward primers (Table 2) and the GeneScan™ 500 LIZ™ (Applied Biosystems™, Waltham, MA, USA) as an internal size standard. Alleles were sized with GeneMapper™ version 6.1 Analysis software (Applied Biosystems™, Waltham, MA, USA).

2.4. ISSR Analysis

To identify ISSR markers with optimal polymorphism and reproducibility, an initial screening was conducted using multiple markers from the University of British Columbia UBC primer set #9 (Vancouver, BC, Canada). Six ISSR markers were eventually chosen for population genotyping (Table 3).
PCR amplifications of the DNA fragments were carried out in 20 μL reactions containing 20 ng template DNA, 0.2 μM forward and reverse primers, 3.5 mM MgCl2, 6 mM dNTPs, 1× Taq buffer, and 1 U of KAPA Taq DNA polymerase (Kapa Biosystems, Inc., Woburn, MA, USA). PCR conditions comprised an initial denaturation step at 95 °C for 4 min followed by 35 cycles of 45 s at 94 °C, 45 s at 51 °C, and 2 min at 72 °C, with a final extension step of 5 min at 72 °C.
The PCR products were separated via 2% agarose gel electrophoresis and visualized using the GelDoc XR+ Documentation System (Bio-Rad, Hercules, CA, USA). The primers that could generate clear and polymorphic bands were selected for further analysis.

2.5. Statistical Analysis

2.5.1. SSR Markers

SSR analysis was performed with POPGENE version 1.32 (University of Alberta, Edmonton, AB, Canada) [48] and Cervus version 3.0.7 (Field Genetics, London, UK) [49]. For each SSR locus, the following parameters were calculated: total (Na) and effective (Ne) number of alleles, gene flow (Nm), Shannon’s Information index (I), observed and expected homozygosity (Obs. Ho, Exp. Ho) and heterozygosity (Obs. He, Exp. He), polymorphic information content (PIC) as described by Botstein et al. [50], and fixation index (Fst). Principal coordinate analysis (PCoA), based on the allele table, was conducted using GenAlEx version 6.5 software (Australian National University, Canberra, Australia) [51]. Afterwards, a binary data matrix (a present allele was assigned a value of 1 and an absent one was assigned 0) was constructed, based on the allele table, and processed using FreeTree version 0.9.1.50 software (Charles University, Prague, Czechia) [52] to produce a genetic distance matrix using the Nei and Li/Dice similarity index [53]. An UPGMA (unweighted pair group method using arithmetic averages) dendrogram was constructed using the similarity estimates. Visualization of the dendrogram was made using FigTree version 1.4.4 (Institute of Evolutionary Biology, University of Edinburgh, Edinburgh, UK) [54].
To assess the genetic structure of the garlic accessions, we used STRUCTURE version 2.3.4 (Stanford University, Stanford, CA, USA) [55]. To estimate the best cluster fit, we ran STRUCTURE with K from 1 to 28 (equal to the number of populations plus the outgroup), with 10 iterations of each K. The burn-in period was set to 100,000 interactions followed by 100,000 additional Markov chain Monte Carlo (MCMC) interactions. The ΔK method by Evanno et al. [56] was used to identify the most likely number of clusters (K) using STRUCTURE HARVESTER version 0.6.94 (University of California, Los Angeles, CA, USA) [57]. According to Remington et al. [58], the assignment of accessions to genetic groups relies on maximum membership probability. To obtain a consensus barplot for the interactions performed, the CLUMPAK platform (Tel Aviv University, Tel Aviv, Israel) [59] was used.
Finally, analysis of molecular variance (AMOVA) was performed with 999 permutations (α = 0.05) using GenAlEx version 6.5 software (Australian National University, Canberra, Australia).

2.5.2. ISSR Markers

For the ISSR markers, only bright and discernible fragments ranging from 400 to 2700 bp were included in the analysis. Each amplicon at a specific position on the gel was considered as a homologous locus. Each locus was scored as 1 for presence and 0 for absence to generate a binary matrix for all the accessions analyzed. GenAlEx version 6.5 software (Australian National University, Canberra, Australia) was used to perform a principal coordinate analysis (PCoA), based on Nei’s genetic distance (GD). Moreover, an UPGMA dendrogram was also constructed, using the Nei and Li/Dice similarity estimates given by FreeTree version 0.9.1.50 software (Charles University, Prague, Czechia). PIC values were estimated as described by Botstein et al. [50].
A Mantel test was conducted using GenAlEx version 6.5 software (Australian National University, Canberra, Australia), with 999 permutations, for the comparison of the matrices constructed from the SSR and the ISSR data analysis. Finally, analysis of molecular variance (AMOVA) was performed with 999 permutations (α = 0.05) using GenAlEx version 6.5 software (Australian National University, Canberra, Australia).

2.5.3. Association Analysis

In this study, we also examined whether any significant association exists between the molecular markers (112 SSR and ISSR loci in total) and the chemical content, as well as between the molecular markers and the morphological traits of the bulb (34 chemical and morphological variables in total), which were previously recorded by Avgeri at al. [11] and Polyzos et al. [34] for the same accessions. For this purpose, the quantitative characters (concentration of the chemical compounds) were treated as categorical through dividing their range into three groups (low, moderate, and high) and appointing two cut points to define each group. Initially, Fisher’s exact test was performed to reveal statistically significant nonrandom associations. The loci which revealed statistically significant associations were used as independent variables for the subsequent logistic regression. Statistical analysis was performed using IBM SPSS Statistics version 28 software (IBM, SPSS Inc., Chicago, IL, USA) [60].

3. Results

3.1. Genetic Relationships Based on the SSR Markers

All the SSR markers tested were polymorphic in all the accessions studied. PCR amplification revealed four (Asa24, GB-AS-076, GB-AS-102) to nine (Asa08) alleles for each SSR locus, totaling 26 different alleles, with an average (Na) of 5.2 alleles per locus. Some of the alleles, e.g., Asa24-141, can be used as diagnostic for identification purposes. The average number of effective alleles (Ne) was 2.460, ranging from 1.157 (GB-AS-102) to 3.609 (Asa10), while the Shannon’s information index (I) ranged from 0.332 (GB-AS-102) to 1.548 (Asa08) with an average of 1.013. The estimated gene flow (Nm) ranged from 0.038 for GB-AS-102 to 0.936 for GB-AS-076 (mean 0.251), while the average PIC number was 0.471, ranging from 0.133 (GB-AS-102) to 0.683 (Asa10). All SSR markers except GB-AS-102 were informative (PIC ≥ 0.4).
Ranges for observed (Obs. He) and expected heterozygosity (Exp. He) were 0.036–0.893 and 0.136–0.726, respectively. Finally, for all the SSR markers, the Fis index was negative, while Fst ranged from 0.211 (GB-AS-076) to 0.868 (GB-AS-102) with a mean value of 0.5 (Table 4).
Pairwise genetic distance [61] values (D) among the garlic accessions ranged from 0 to 2.538 (Table S1). Zero genetic distance values were estimated in several pairwise combinations, implying genetic identity among garlic accessions, at least for the loci studied. 17 out of 27 accessions had identical SSR genotype with at least one other accession. The genetically most distant accession was AS29 (A. schoenoprasum) (Dmax = 2.538 from both AS04 and AS30 accessions); however, when we examined only A. sativum accessions, the highest value was calculated between both AS04 and AS08 with AS06 (D = 2.079).
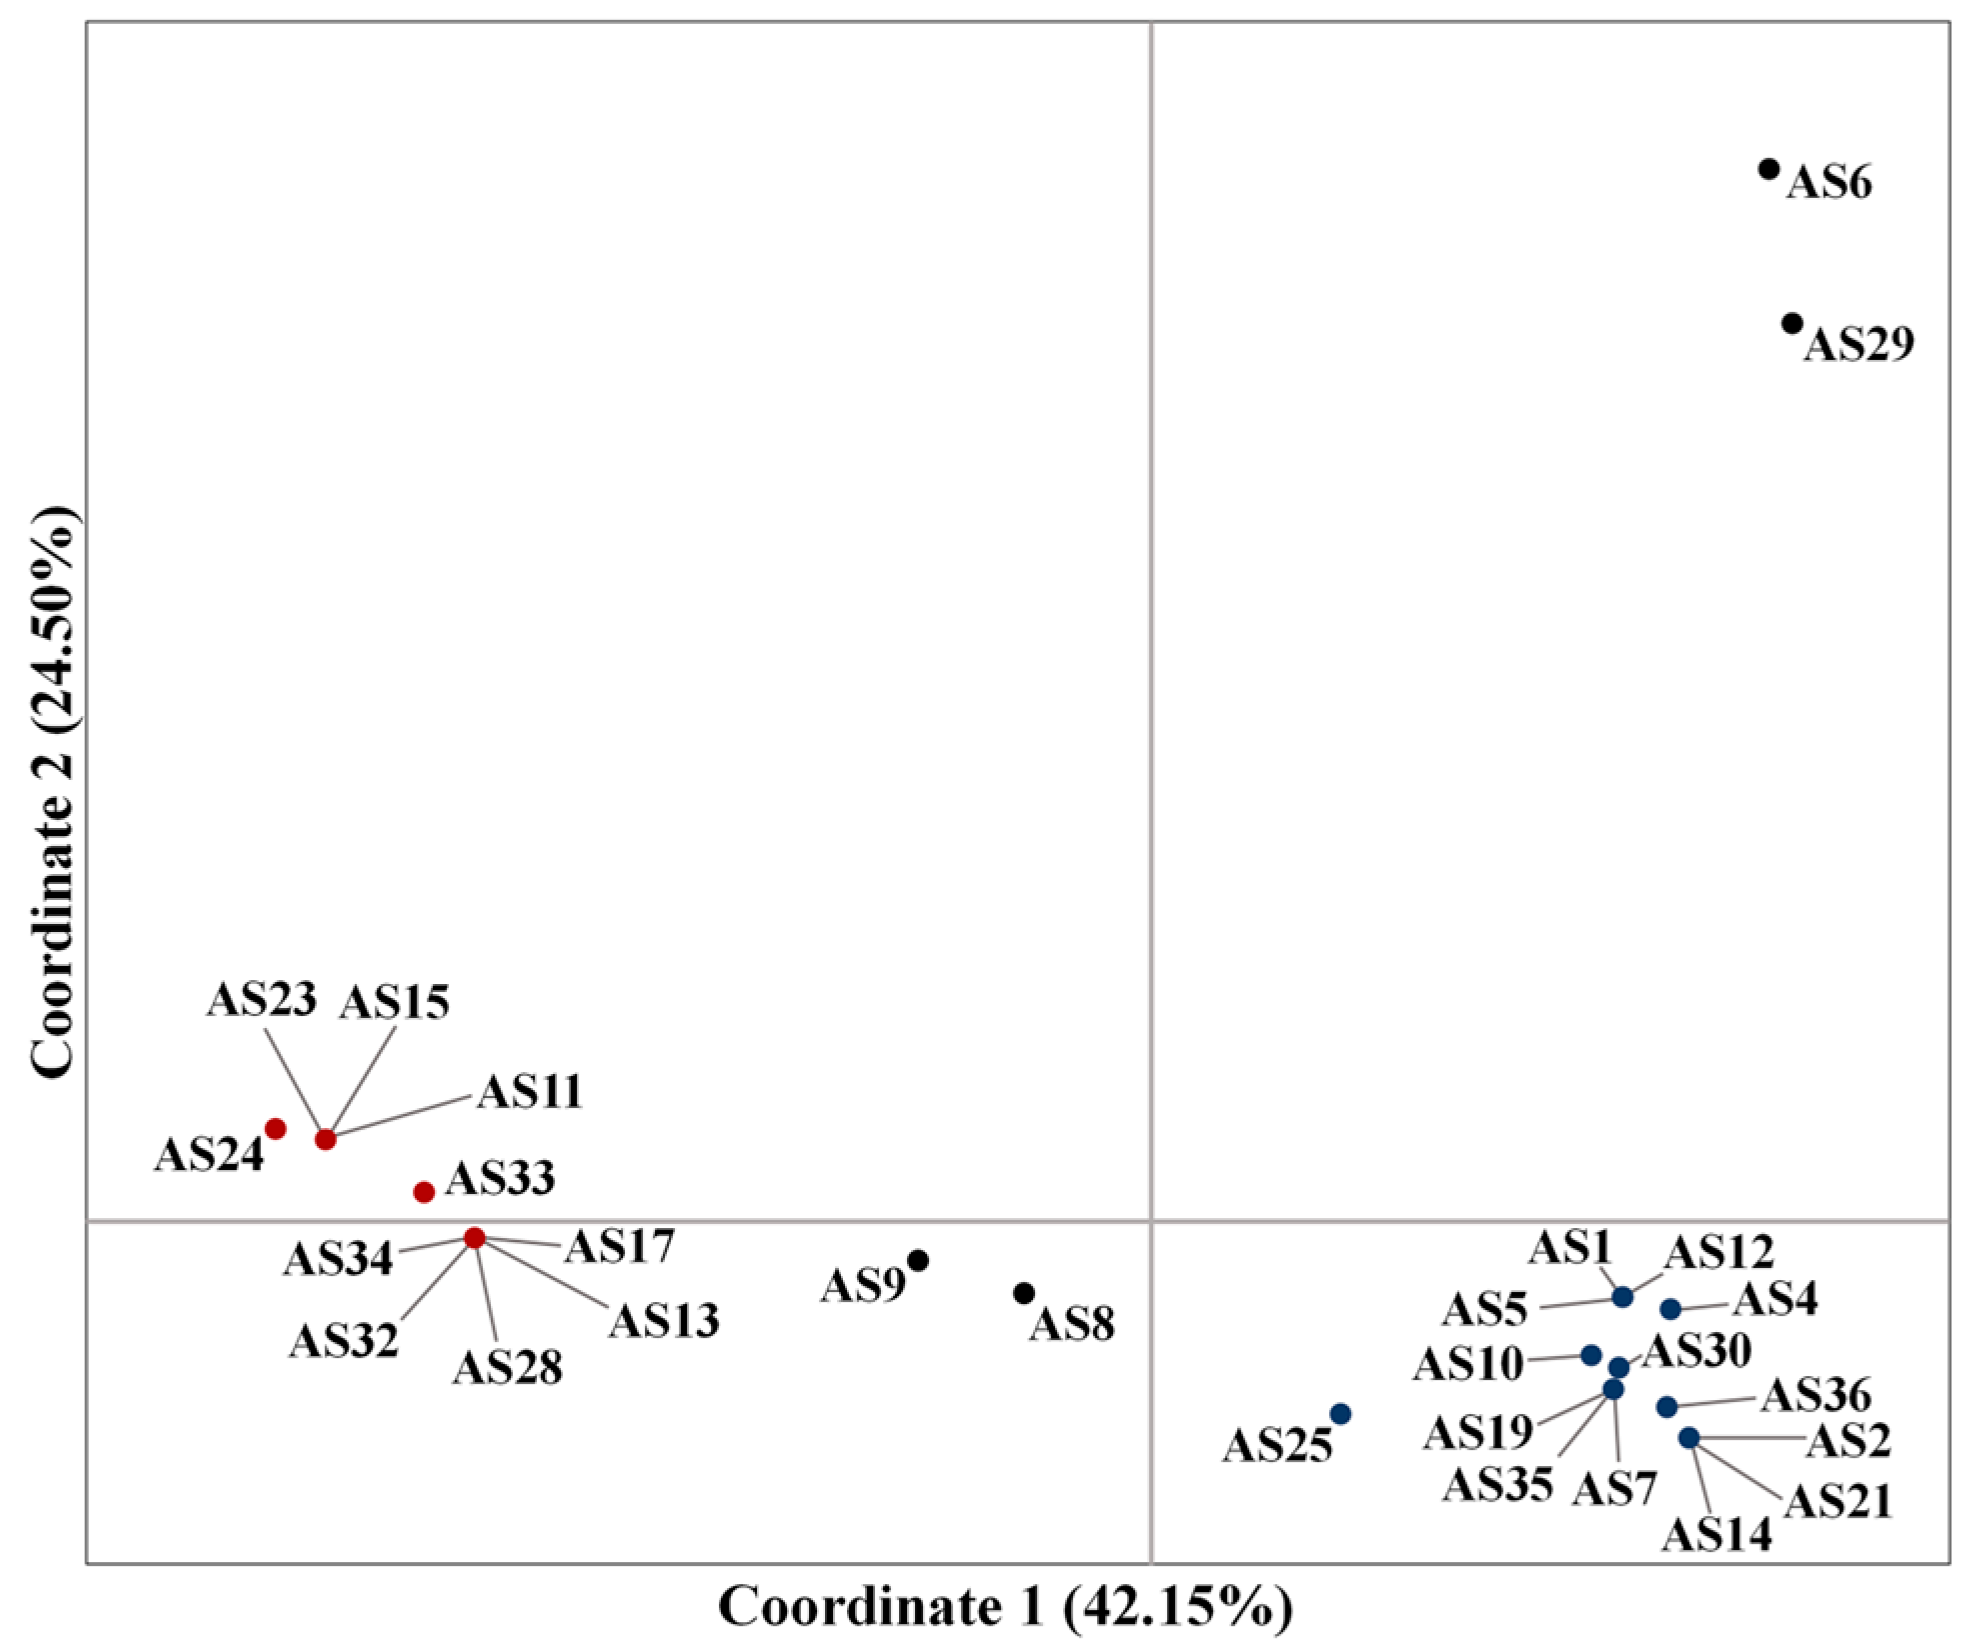
For the clarification of the genetic relationships among the 27 garlic genotypes studied, a principal coordinate analysis (PCoA) was performed (Figure 1), including the A. schoenoprasum accession (AS29). In the principal coordinate analysis (PCoA), the percentage of variation explained by the first three axes was 83.57%. The first axis explained 42.15%, while the second and third axes explained 24.50% and 16.92%, respectively. There was a clear separation of the AS6 and AS29 accessions from the rest. All other genotypes were assigned into two distinct groups. The first group comprised accessions AS1, AS2, AS4, AS5, AS7, AS10, AS12, AS14, AS19, AS21, AS25, AS30, AS35, and AS36, while the second comprised accessions AS11, AS13, AS15, AS17, AS23, AS24, AS28, AS32, AS33, and AS34. Finally, the accessions AS8 and AS9 were placed in between the two groups, with AS8 being closer to the first group of accessions and AS9 closer to the second group of accessions.
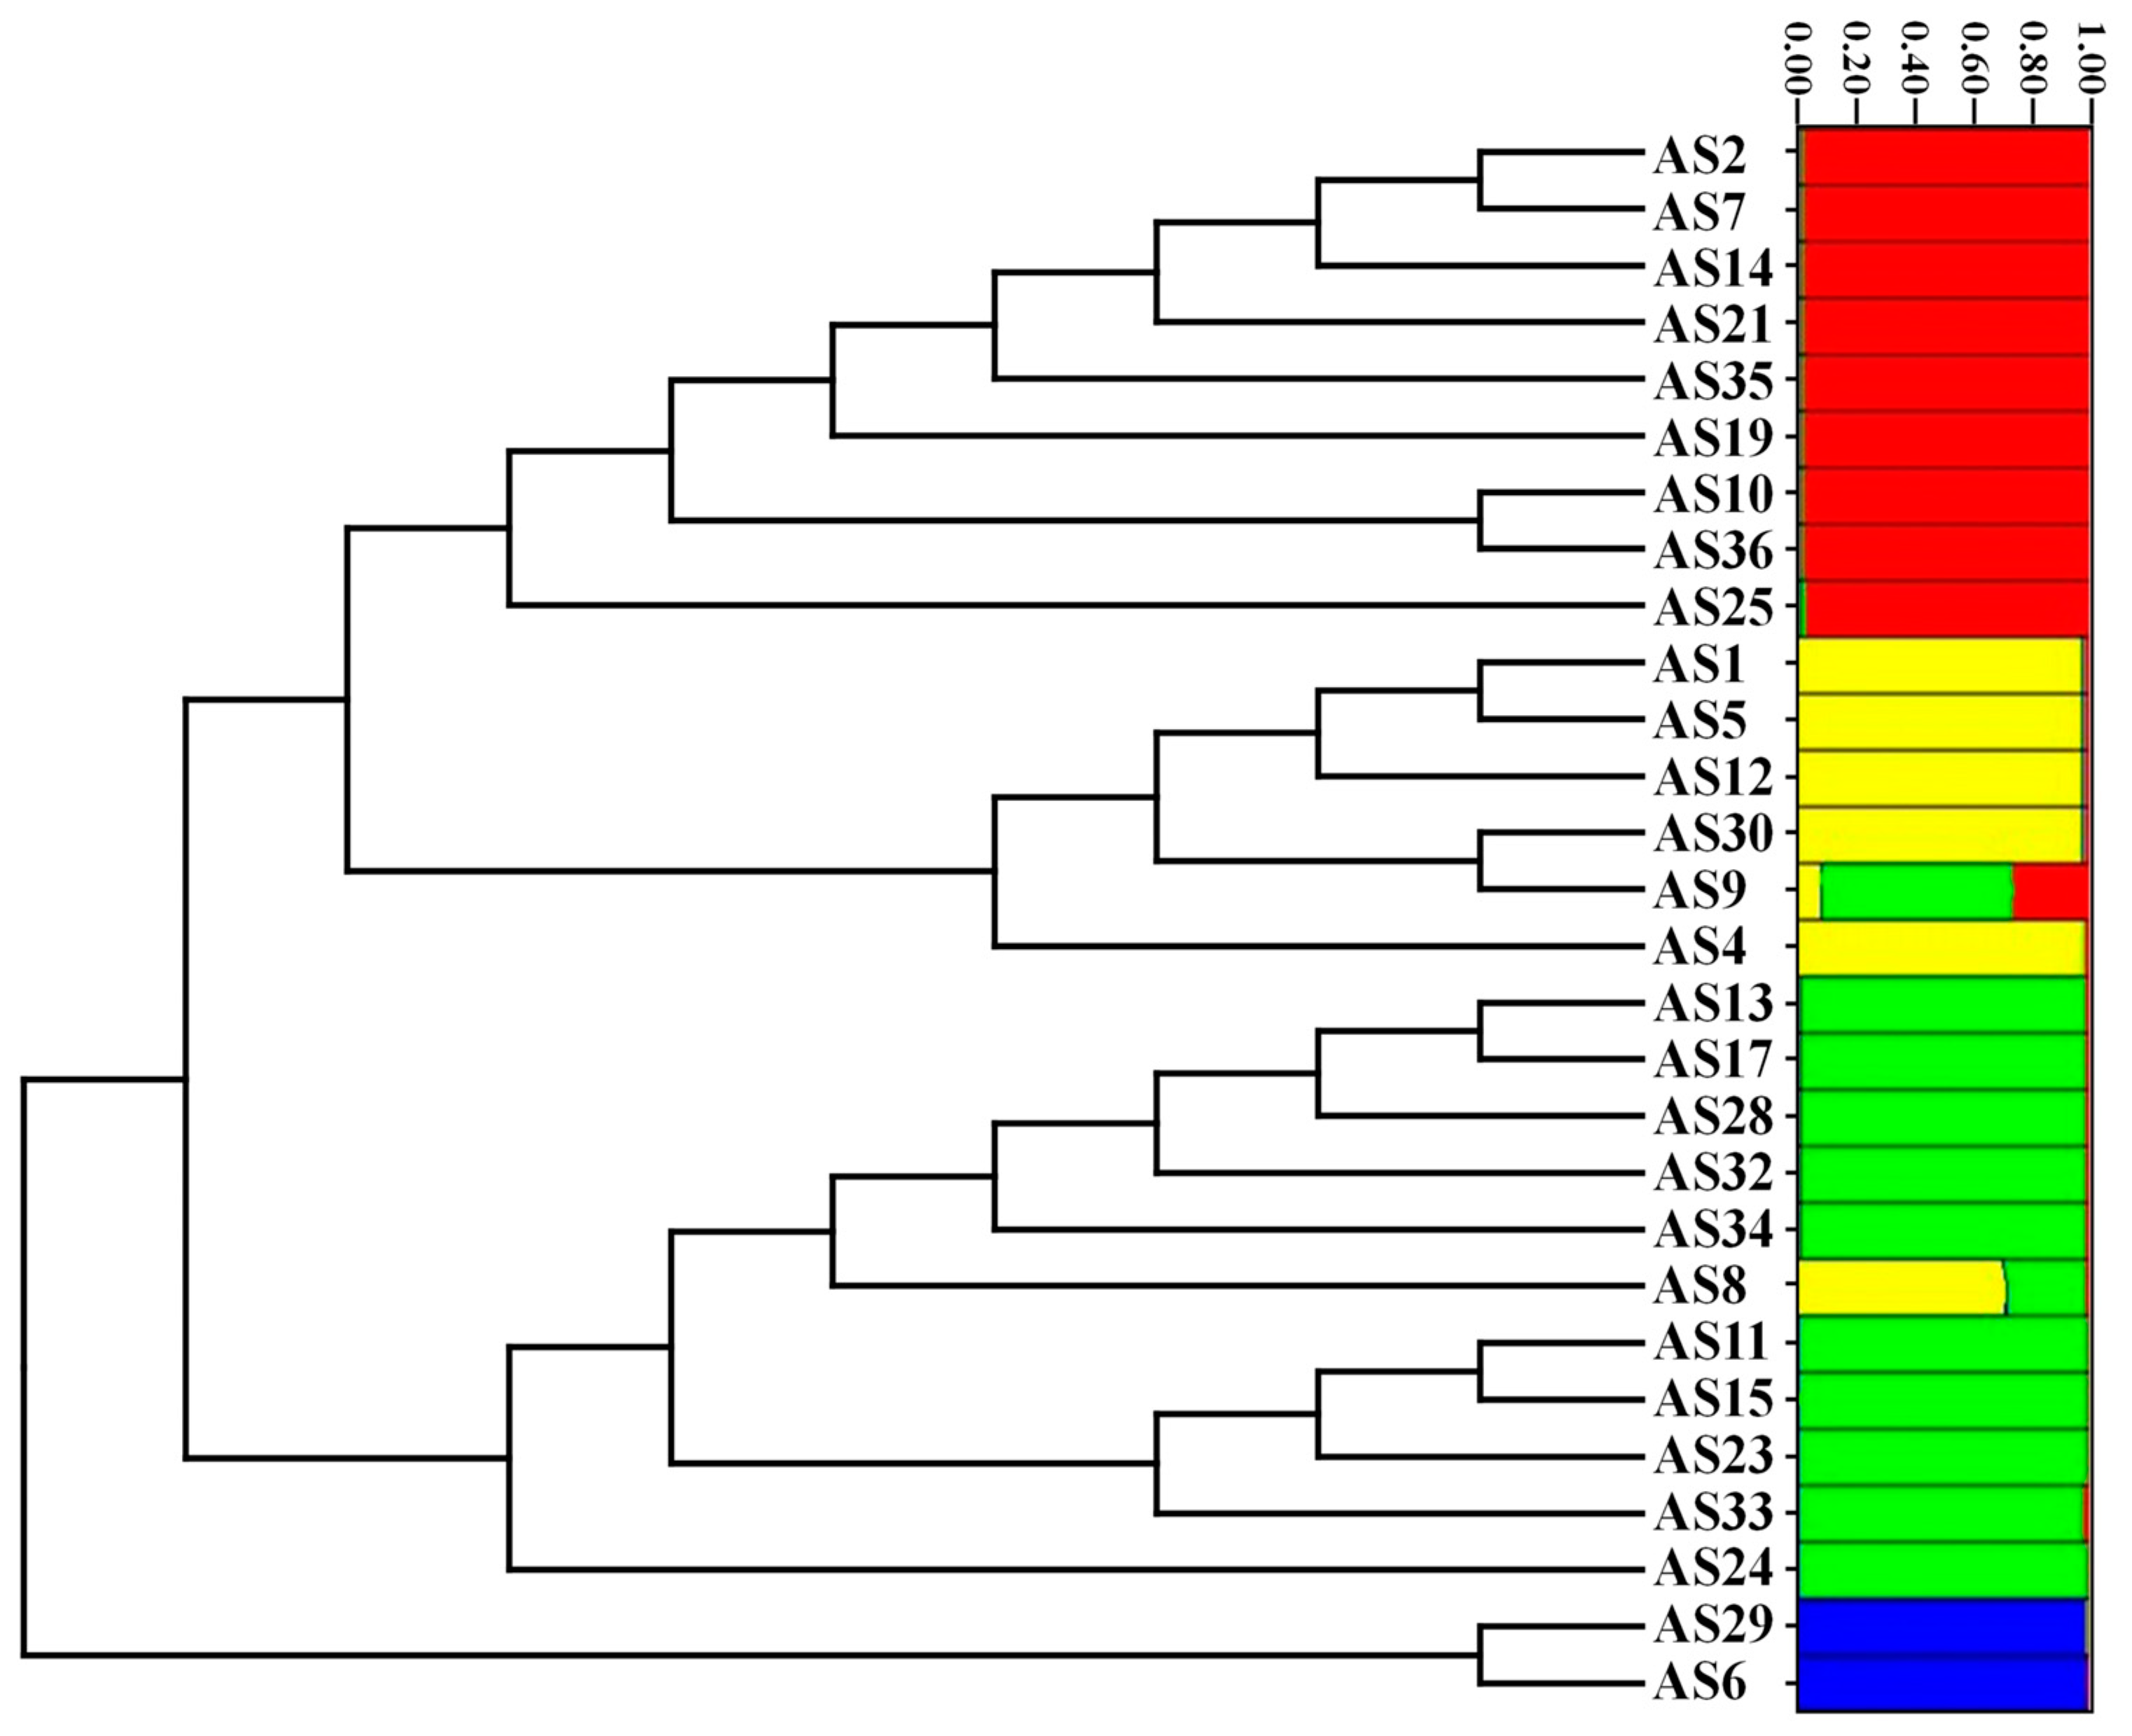
The UPGMA similarity dendrogram, based on Nei and Li/Dice similarity index, showed that the 27 accessions, and the outgroup (A. schoenoprasum), were classified into three different clusters (Figure 2), and for the most part, it is congruent with PCoA. The first cluster comprised accessions AS6 and AS29; the second cluster comprised accessions AS8, AS11, AS13, AS15, AS17, AS23, AS24, AS28, AS32, AS33, and AS34; while the third one comprised accessions AS1, AS2, AS4, AS5, AS7, AS9, AS10, AS12, AS14, AS19, AS21, AS25, AS30, AS35, and AS36.
The maximum peak was calculated using STRUCTURE HARVESTER v0.6.94 at K = 4, with CLUMPAK (Tel Aviv University, Tel Aviv, Israel) supporting the peak of 10 out of 10 STRUCTURE runs. This suggests the existence of four different genetic clusters for the garlic accessions under study. The accessions AS6 and AS29 formed one cluster supporting their clear distinction from the rest. The second cluster contained AS2, AS7, AS10, AS14, AS19, AS21, AS25, AS35, and AS36, the third AS11, AS13, AS15, AS17, AS23, AS24, AS28, AS32, AS33, and AS34, while the accessions AS1, AS4, AS5, AS12, and AS30 formed the fourth cluster. Finally, the AS8 and AS9 accessions were distributed in more than one cluster.
Analysis of molecular variance (AMOVA) revealed that 34% of the overall molecular diversity was attributed to variations among accessions, while the rest (66%) was within them (Table 5).

3.2. Genetic Relationships Based on ISSR Analysis

Six ISSR primers were used to screen the 27 garlic accessions and the A. schoenoprasum and to estimate the genetic diversity among them. A total of 84 clear and stable polymorphic bands were generated with an average of 14 bands for each primer; all bands were found to be polymorphic among the garlic landraces studied, whereas some of those bands can be used as diagnostic to discriminate among the accessions studied. Among the primers utilized, UBC-811 produced the most abundant number of bands (19), while UBC-880 exhibited the lowest band count (7).
The PIC values for the six ISSR primers ranged from 0.370 to 0.500 with a mean value of 0.465. The binary matrix generated from the ISSR banding profiles corresponded to eighty-four different loci. All calculated Nei’s genetic distances (GDs) were used to perform a PCoA. From the PcoA, the first three axes explained 67.87% of the total variation (the first, second and third axes explained 31.92%, 21.52%, and 14.44%, respectively). These values were due to the low levels of polymorphism exhibited by the specific ISSR markers. Consequently, the garlic accessions were scattered throughout the plot, not forming any visible groups, as expected from the coordinate values (Figure S1), reducing the resolution power of those markers.
The UPGMA similarity dendrogram, based on Nei and Li/Dice similarity index, classified the 27 accessions, and the A. schoenoprasum accession (outgroup), into six clusters (Figure S2). The first cluster comprised the A. schoenoprasum accession (AS29), the second cluster comprised the accession AS6, and the third one comprised the accession AS36. The fourth cluster comprised the accession AS11 and the fifth one comprised the accessions AS2, AS9, AS28, AS32, AS33, and AS34.
Lastly, the sixth cluster was further divided into two subclusters. The first subcluster comprised accessions AS19, AS21, AS23, AS24, AS25, and AS35, while the second, accessions AS1, AS4, AS5, AS7, AS8, AS10, AS12, AS13, AS14, AS15, AS17, and AS30. Although the UPGMA dendrogram had some similarities with the PCoA, they were not totally in agreement.
The AMOVA revealed 79% of the total molecular diversity within and 21% among the Greek garlic landraces (data not presented).
Based on the Mantel test, a relatively low correlation was observed between the SSR and the ISSR data (r = 0.474, p < 0.01, 999 permutations).

3.3. Association of SSR Loci with Chemical Compounds and Bulb Morphological Traits

Fisher’s exact tests revealed many SSR and ISSR loci being significantly associated with the chemical compounds [11] as well as the morphological traits of the bulb [35] for the same accessions (Tables S2 and S3).
The statistically significant associations were further evaluated using logistic regression analysis. The statistically significant correlations (p < 0.05), which were identified using Fisher’s exact test and multinomial logistic regression analysis, between the SSR and ISSR loci, the chemical compounds, and the morphological traits of the bulb are presented in Table 6.

4. Discussion

Although most garlic varieties are asexually propagated, significant morphological differences exist within and among them, mainly due to varying environmental conditions, thus creating obstacles in their identification and conservation [17,35]. Assessing the levels of genetic variation existing within garlic accessions is beneficial for phenotypic identification and core germplasm construction. Moreover, the evaluation of genetic diversity and the estimation of the degree of relatedness between accessions are critical steps for garlic selection and for breeding purposes [62].
In this study, using SSR and ISSR markers, we aimed to molecularly characterize and assess the genetic diversity and structure of a garlic collection comprising 27 accessions collected from different regions of Greece. These accessions have been previously investigated in terms of phenotypic diversity as well as chemical content by Polyzos et al. [34] and Avgeri et al. [11], respectively.
SSRs are considered ideal DNA markers due to their stability and reproducibility [26]; thus, they have been widely used to assess genetic diversity in local garlic collections [2,15,17,26,35,43,44,45]. The SSR markers used in this study revealed a mean PIC value of 0.471, which is lower than the PIC values reported by Cuhna et al. [43,44], which were 0.518 and 0.500, respectively. The PIC value revealed in this study is also lower than the mean PICs of 0.72 and 0.60 reported by Chen et al. [26] and Ipek et al. [63], but higher than those reported by Li et al. [17] (0.37) and Barboza et al. [31] (0.38) in Korean and Argentinian accessions, respectively.
Compared to SSRs, ISSR markers revealed a similar mean PIC value (0.47), which was higher than the PIC value (0.19) reported by Kıraç et al. [22] in Turkish accessions, but significantly lower than those reported by Chen et al. [27] (0.72) and Rakesh Sharma et al. [27] (0.65) for Chinese and Indian collections, respectively.
Differences in the mean PIC values observed among various genetic diversity studies are attributed to several factors, such as the number and type of SSR markers, e.g., EST-SSRs or genomic, their distribution and abundance in the genome, the number and geographic location of the accessions, the population size, and the genetic variation existing in the germplasm resources analyzed [17,31].
Other estimated parameters, such as observed (Obs. He) and expected heterozygosity (Exp. He), Shannon’s Information index (I), number of alleles per locus (Na), and effective number of alleles (Ne) (Table 4), reflected comparative levels of genetic variation between ours and other previously characterized garlic germplasm collections, e.g., [15,31,44]. It should also be noted that the values of Obs. Ho > Exp. He, as observed for the SSR loci studies, except for Asa10 and GB-AS-102, and the negative values of fixation index (Fis) indicate an excess of heterozygotes and the absence of null alleles in the garlic collection, as expected in vegetatively propagated species [44].
DNA markers can be effectively used to resolve issues in the nomenclature of accessions and reveal possible redundancies in a germplasm collection. Identification of potential duplicates is not only of paramount importance to identify genuine variability for breeding purposes, but also helps to reduce the maintenance costs and to secure the authenticity of the accessions [17,64]. In our study, zero genetic distance values were observed in various pairwise comparisons, indicating genetically identical accessions for the loci analyzed. Furthermore, 63% of the accessions (17 out of 27) shared the same SSR genotype with at least one other accession and only one genotype (AS6) had a unique genotype revealing some private alleles. This fact may reflect a high level of redundancy and existence of duplicates in the garlic collection studied, although the same observation appeared less frequently in the ISSR screening. High levels of redundancy have also been observed in other garlic collections with potential duplicates reaching up to 50% of the collection [31,35,44,63].
The genetic similarity among accessions revealed in our study does not correlate with the levels of phenotypic and chemical variation observed for the same collection by Polyzos et al. [34] and Avgeri et al. [11]. Most of the accessions analyzed in this study are phenotypically distinct with respect to morphological, compositional (e.g., considering the content of bulb phytochemicals), and agronomic traits. In garlic, clonal propagation accounts for the narrow genetic base observed in this crop. As a result, meiotic recombination is missing, and gene exchange and genetic introgression are at low frequency [19,22,23]. Unlike other seed crops, the bulbs, seedlings, and stems of garlic are targeted harvesting organs, harvested before flowering and seeding, leading also to the narrow genetic base. On the other hand, garlic exhibits wide phenotypic diversity in different ecological areas of cultivation due to naturally occurring mutations and also soil type, environmental parameters, and cultural techniques, which eventually lead to a great number of cultivars [21]. This discrepancy between phenotypic and genetic data may arise because either the farmers tend to exchange their garlic varieties and thus generate confusion in garlic nomenclature through naming the same local variety/landrace with different names or vice versa [17,39], or it could be due to epigenetic phenomena which also cause significant phenotypic variation in garlic lines cultivated in the same region for an extended period [15,65,66].
The distribution of genetic variation in the garlic accessions based on the SSR markers, as examined via AMOVA analysis, indicated that 34% of the total molecular diversity was attributable to differences among accessions, while the rest (66%), within them. A similar trend was also observed for the ISSR data. These findings agree with the results of Zhao et al. [67], Cuhna et al. [44], Kumar et al. [45], Poljuha et al. [15], and Li et al. [17], who also detected higher levels of variation within the accessions rather than among them. Nevertheless, this pattern contradicts the hypothesis of genetic erosion and possibly indicates the presence of genetic structures due to ancestral sexual reproduction, followed by independent domestication history [15,17]. The presence of higher levels of molecular diversity within garlic accessions rather than among them is a result not only found in our study, but also in many others, and is usually attributed to the lack of sexual propagation but also to human-mediated gene flow, which leads to a substantial amount of variation that can be attributed to differences within the accessions rather than among them [65]. Generally, landraces typically exhibit varying degrees of variability, which can be assessed through measuring different traits. Within a landrace, some traits can express high variability and therefore cannot be used as discrimination characters. On the other hand, several traits within a landrace are uniform and can be used for identification [68]. Moreover, since an Fst value greater than 0.15 is considered significant in differentiating populations [69], the value observed in our study (0.51) implies a considerable degree of differentiation among the accessions studied, especially when combined with low levels of gene flow.
Assessment of the genetic diversity and population structure of germplasm collections facilitates crop breeding, allowing the more efficient use of genetic resources and management of genetic variation. In our study, in the SSR data analysis, both STRUCTURE results (optimal K = 4) including A. schoenoprasum coincided with the UPGMA similarity dendrogram, based on the Nei and Li/Dice similarity index, indicating convergent results to the garlic accessions’ genetic relatedness. Moreover, the PCoA was for the most part concordant to both STRUCTURE and clustering analyses for the SSR data. The number of subpopulations (K) revealed using STRUCTURE was also in agreement with that found by other studies of garlic germplasm collections [31,39].
In the present study, we did not find any association between genetic clustering and the geographical origin/collection site of the garlic accessions. The same has also been reported by Garcia-Lampasona et al. [37,70], Volk et al. [16], Morales et al. [71], and Barboza et al. [31], whereas other studies reported a moderate level of correlation between genetic clustering based on SSR markers and geographical origin [35,45,67,72]. This lack of correlation may be due to various factors, such as the exchange of genetic materials without keeping track of their geographical origin information, the introduction of cultivars with the same origin to various regions using different names, the accumulation of different somatic mutations due to different selective pressures when the same clone is cultivated for a long time in different environments, etc. [31,39,44].
In an attempt made to unpack the degree of association and reveal potential molecular markers related to important traits, we examined if any association exists between the molecular data and the chemical composition [11], as well as between the molecular data and the morphological traits of the bulb [34], for the same accessions. For this reason, Fisher’s exact tests were initially employed and then we conducted for the genetic loci exhibiting significant associations (p < 0.05), a multinomial logistic regression analysis to further explore their relationships with the specific traits studied.
The multinomial logistic regression is suitable for MAS breeding programs and GWAS studies [73,74]; thus, the markers which present significant correlation with important traits, either chemical or morphological, are potentially good candidates to be utilized for the selection of promising progeny in breeding programs. We found significant associations between specific loci and certain chemical compounds (i.e., allyl-prop-1-enyl disulfide, methyl allyl disulfide, and pyruvate), as well as the morphological characters of the bulb (i.e., BDC, BPCTB, BPRD, SBB, SMB). For example, a positive association was revealed between Asa10-Locus 4 and pyruvate. Pyruvate has been utilized to indirectly assess the presence of allicin in fresh raw garlic, since it is produced as a by-product during the conversion of alliin into allicin [75]. Additionally, previous studies have shown a positive correlation between pyruvate levels and both flavor intensity (pungency) [76] and antiplatelet activity [77]. Avgeri et al. [11] have observed significant variability in pyruvate levels, with a nearly 15-fold difference between the genotypes possessing the lowest and highest concentrations. This suggests that molecular markers could foster the identification of mild and pungent garlic genotypes, as well as genotypes with high functional properties, to facilitate their selection in future breeding programs.

5. Conclusions

Molecular markers were used to characterize the genetic diversity of 27 garlic accessions/landraces from Greece. SSR and ISSR markers revealed significant levels of diversity (the greatest amount of it was distributed within the accessions rather than among them) indicating the possible presence of genetic structures. Our results also confirm previous studies regarding the existence of redundancy in garlic germplasm collections. Nearly identical clustering results were obtained using UPGMA, STRUCTURE, and PCoA clustering analyses based on SSR data. However, the results obtained using the SSR markers were incongruent with those obtained by the ISSR analysis.
Finally, significant associations were detected between specific chemical compounds, the morphological traits of the bulb and genetic loci. Studies assessing genetic diversity are important to improve management and conservation of agrobiodiversity and to facilitate and accelerate breeding programs. The results of our study will aid the exploitation of this valuable genetic resource for future crop improvement through identifying potential markers related to bulb traits and important chemical compounds of the secondary metabolism. These breeding objectives, together with fertility restoration and pathogen protection, are important breeding targets for elite cultivar development [4] strategies and for the preservation and utilization of the Greek garlic germplasm collection.

Supplementary Materials

The following supporting information can be downloaded at: https://www.mdpi.com/article/10.3390/agriculture13071408/s1, Figure S1: Principal coordinate analysis (PCoA) of the 27 garlic accessions, plus the A. schoenoprasum accession (AS29) based on the ISSR data; Figure S2: UPGMA dendrogram of the accessions studied, based on the ISSR data, revealed the formation of six clusters, with the A. schoenoprasum (AS29) accession being the most distant; Table S1: Pairwise genetic distance values among the garlic accessions, including A. schoenoprasum (AS29) accession; Table S2: Fisher’s exact test contingency table showing statistically significant correlations (p < 0.05) between the SSR loci, and the morphological and chemical traits examined. SSR loci in bold are these for which significant correlation values have been observed in the logistic regression analysis too; Table S3: Fisher’s exact test contingency table showing statistically significant correlations (p < 0.05) between the ISSR loci, and the morphological and chemical traits examined. ΙSSR loci in bold are these for which significant correlation values have been observed in the logistic regression analysis too.

Author Contributions

Conceptualization, S.A.P., F.N.L., P.J.B. and V.P.; methodology, V.P.; validation, C.P. and G.F.; formal analysis, V.P., C.P. and G.F.; investigation, V.P., C.P. and G.F.; resources, S.A.P., P.J.B., F.N.L. and V.P.; writing—original draft preparation, V.P., C.P. and G.F.; writing—review and editing, C.P., S.A.P., F.N.L., P.J.B. and V.P.; visualization, C.P.; supervision, V.P.; funding acquisition, S.A.P., F.N.L., P.J.B. and V.P. All authors have read and agreed to the published version of the manuscript.

Funding

This research received no external funding.

Institutional Review Board Statement

Not applicable.

Data Availability Statement

Not applicable.

Acknowledgments

We would like to thank Nikolaos Polyzos for his valuable help with DNA extraction of the samples.

Conflicts of Interest

The authors declare no conflict of interest.

References

  1. Elsharkawy, G.A.; Hegazi, H.H.; Azab, E.; Gobouri, A.A.; Sayed, S.A. Assessment of Genetic Diversity among Egyptian Garlic Landraces Based on Morphological Characteristics and ISSR Markers. Eur. J. Hortic. Sci. 2021, 86, 579–589. [Google Scholar] [CrossRef]
  2. Karakan, F.Y. Relationship between Volatile Sulfur Compounds, Mineral Content, Morphological and Molecular Characterization of Local Garlic Genotypes. Bangladesh J. Bot. 2022, 51, 147–155. [Google Scholar] [CrossRef]
  3. Friesen, N.; Smirnov, S.V.; Shmakov, A.I.; Herden, T.; Oyuntsetseg, B.; Hurka, H. Allium Species of Section Rhizomatosa, Early Members of the Central Asian Steppe Vegetation. Flora Morphol. Distrib. Funct. Ecol. Plants 2020, 263, 151536. [Google Scholar] [CrossRef]
  4. Parreño, R.; Rodríguez-Alcocer, E.; Martínez-Guardiola, C.; Carrasco, L.; Castillo, P.; Arbona, V.; Jover-Gil, S.; Candela, H. Turning Garlic into a Modern Crop: State of the Art and Perspectives. Plants 2023, 12, 1212. [Google Scholar] [CrossRef]
  5. Benke, A.P.; Krishna, R.; Mahajan, V.; Ansari, W.A.; Gupta, A.J.; Khar, A.; Shelke, P.; Thangasamy, A.; Shabeer, T.P.A.; Singh, M.; et al. Genetic Diversity of Indian Garlic Core Germplasm Using Agro-Biochemical Traits and SRAP Markers. Saudi J. Biol. Sci. 2021, 28, 4833–4844. [Google Scholar] [CrossRef]
  6. Etoh, T.; Simon, P.W. Diversity, Fertility and Seed Production of Garlic. In Allium Crop Sciences: Recent Advances; Rabinowitch, H.D., Currah, L., Eds.; CABI Publishing: Wallingford, UK, 2002; pp. 101–117. ISBN 9780851995106. [Google Scholar]
  7. Shaaf, S.; Sharma, R.; Kilian, B.; Walther, A.; Özkan, H.; Karami, E.; Mohammadi, B. Genetic Structure and Eco-Geographical Adaptation of Garlic Landraces (Allium sativum L.) in Iran. Genet. Resour. Crop. Evol. 2014, 61, 1565–1580. [Google Scholar] [CrossRef]
  8. Fritsch, R.M.; Friesen, N. Evolution, Domestication and Taxonomy. In Allium Crop Science: Recent Advances; Rabinowitch, H., Currah, L., Eds.; CABI Publishing: Wallingford, UK, 2002; pp. 5–30. ISBN 9780851995106. [Google Scholar]
  9. Abe, K.; Hori, Y.; Myoda, T. Volatile Compounds of Fresh and Processed Garlic (Review). Exp. Ther. Med. 2019, 19, 1585–1593. [Google Scholar] [CrossRef] [PubMed] [Green Version]
  10. Fesseha, H.; Goa, E. Therapeutic Value of Garlic (Allium sativum): A Review. Adv. Food Technol. Nutr. Sci.-Open J. 2019, 5, 107–117. [Google Scholar] [CrossRef]
  11. Avgeri, I.; Zeliou, K.; Petropoulos, S.A.; Bebeli, P.J.; Papasotiropoulos, V.; Lamari, F.N. Variability in Bulb Organosulfur Compounds, Sugars, Phenolics, and Pyruvate among Greek Garlic Genotypes: Association with Antioxidant Properties. Antioxidants 2020, 9, 967. [Google Scholar] [CrossRef]
  12. Batiha, G.E.S.; Beshbishy, A.M.; Wasef, L.G.; Elewa, Y.H.A.; Al-Sagan, A.A.; El-Hack, M.E.A.; Taha, A.E.; Abd-Elhakim, Y.M.; Devkota, H.P. Chemical Constituents and Pharmacological Activities of Garlic (Allium sativum L.): A Review. Nutrients 2020, 12, 872. [Google Scholar] [CrossRef] [Green Version]
  13. Morales-González, J.A.; Madrigal-Bujaidar, E.; Sánchez-Gutiérrez, M.; Izquierdo-Vega, J.A.; Del Carmen Valadez-Vega, M.; Álvarez-González, I.; Morales-González, Á.; Madrigal-Santillán, E. Garlic (Allium sativum L.): A Brief Review of Its Antigenotoxic Effects. Foods 2019, 8, 343. [Google Scholar] [CrossRef] [Green Version]
  14. Bradley, K.F.; Rieger, M.A.; Collins, G.G. Classification of Australian Garlic Cultivars by DNA Fingerprinting. Aust. J. Exp. Agric. 1996, 36, 613–618. [Google Scholar] [CrossRef]
  15. Poljuha, D.; Franić, M.; Kralj, I.; Weber, T.; Šatović, Z.; Ban, D.; Toth, N.; Dumičić, G.; Kereša, S.; da Cunha, C.P.; et al. Genetic Diversity and Structure Analysis of Croatian Garlic Collection Assessed by SSR Markers. Folia Hortic. 2021, 33, 157–171. [Google Scholar] [CrossRef]
  16. Volk, G.M.; Henk, A.D.; Richards, C.M. Genetic Diversity among U.S. Garlic Clones as Detected Using AFLP Methods. J. Am. Soc. Hortic. Sci. Jashs 2004, 129, 559–569. [Google Scholar] [CrossRef] [Green Version]
  17. Li, X.; Qiao, L.; Chen, B.; Zheng, Y.; Zhi, C.; Zhang, S.; Pan, Y.; Cheng, Z. SSR Markers Development and Their Application in Genetic Diversity Evaluation of Garlic (Allium sativum) Germplasm. Plant Divers 2022, 44, 481–491. [Google Scholar] [CrossRef] [PubMed]
  18. Shen, X.; Sun, X.; Cao, M.; Zhang, Y.; Hang, Y.; Chen, M. Molecular Markers for Authentification of Allium sativum L. Cultivar ‘Taicangbaisuan’ and Genetic Relationships among 9 Chinese Garlic Cultivars. Genet. Resour. Crop Evol. 2021, 68, 1961–1970. [Google Scholar] [CrossRef]
  19. Panthee, D.R.; Kc, R.B.; Regmi, H.N.; Subedi, P.P.; Bhattarai, S.; Dhakal, J. Diversity Analysis of Garlic (Allium sativum L.) Germplasms Available in Nepal Based on Morphological Characters. Genet. Resour. Crop Evol. 2006, 53, 205–212. [Google Scholar] [CrossRef]
  20. Ovesná, J.; Leišová-Svobodová, L.; Kučera, L. Microsatellite Analysis Indicates the Specific Genetic Basis of Czech Bolting Garlic. Czech J. Genet. Plant Breed. 2014, 50, 226–234. [Google Scholar] [CrossRef] [Green Version]
  21. Hoogerheide, E.S.S.; Azevedo Filho, J.A.; Vencovsky, R.; Zucchi, M.I.; Zago, B.W.; Pinheiro, J.B. Genetic Variability of Garlic Accessions as Revealed by Agro-Morphological Traits Evaluated under Different Environments. Genet. Mol. Res. 2017, 16, gmr16029612. [Google Scholar] [CrossRef]
  22. Kıraç, H.; Dalda Şekerci, A.; Coşkun, Ö.F.; Gülşen, O. Morphological and Molecular Characterization of Garlic (Allium sativum L.) Genotypes Sampled from Turkey. Genet. Resour. Crop Evol. 2022, 69, 1833–1841. [Google Scholar] [CrossRef]
  23. Stavělíková, H. Morphological Characteristics of Garlic (Allium sativum L.) Genetic Resources Collection–Information. Hortic. Sci. 2008, 35, 130–135. [Google Scholar] [CrossRef] [Green Version]
  24. Hirata, S.; Abdelrahman, M.; Yamauchi, N.; Shigyo, M. Diversity Evaluation Based on Morphological, Physiological and Isozyme Variation in Genetic Resources of Garlic (Allium sativum L.) Collected Worldwide. Genes Genet. Syst. 2016, 91, 161–173. [Google Scholar] [CrossRef] [Green Version]
  25. Bonasia, A.; Conversa, G.; Lazzizera, C.; Loizzo, P.; Gambacorta, G.; Elia, A. Evaluation of Garlic Landraces from Foggia Province (Puglia Region; Italy). Foods 2020, 9, 850. [Google Scholar] [CrossRef]
  26. Chen, S.; Chen, W.; Shen, X.; Yang, Y.; Qi, F.; Liu, Y.; Meng, H. Analysis of the Genetic Diversity of Garlic (Allium sativum L.) by Simple Sequence Repeat and Inter Simple Sequence Repeat Analysis and Agro-Morphological Traits. Biochem. Syst. Ecol. 2014, 55, 260–267. [Google Scholar] [CrossRef]
  27. Rakesh Sharma, V.; Malik, S.; Kumar, M.; Sirohi, A.; Nagaraju, K. Assessment of Genetic Diversity in Garlic (Allium sativum L.) Genotypes Based on ISSR Markers. Plant Arch. 2016, 16, 88–95. [Google Scholar]
  28. Mohammadi, B.; Khodadadi, M.; Karami, E.; Shaaf, S. Variation in Agro-Morphological Characters in Iranian Garlic Landraces. Int. J. Veg. Sci. 2014, 20, 202–215. [Google Scholar] [CrossRef]
  29. Wang, H.; Li, X.; Shen, D.; Oiu, Y.; Song, J. Diversity Evaluation of Morphological Traits and Allicin Content in Garlic (Allium sativum L.) from China. Euphytica 2014, 198, 243–254. [Google Scholar] [CrossRef]
  30. Yebirzaf, Y.; Belete, N.; Tegibew, W.; Yohaness, G.; Abayneh, M.; Kassahun, Y. Collection and Characterization of Garlic (Allium sativm L.) Germplasm for Growth and Bulb Yield at Debre Markos, Ethiopia. J. Hortic. For. 2018, 10, 17–26. [Google Scholar] [CrossRef] [Green Version]
  31. Barboza, K.; Salinas, M.C.; Acuña, C.V.; Bannoud, F.; Beretta, V.; García-Lampasona, S.; Burba, J.L.; Galmarini, C.R.; Cavagnaro, P.F. Assessment of Genetic Diversity and Population Structure in a Garlic (Allium sativum L.) Germplasm Collection Varying in Bulb Content of Pyruvate, Phenolics, and Solids. Sci. Hortic. 2020, 261, 108900. [Google Scholar] [CrossRef]
  32. Benke, A.P.; Khar, A.; Mahajan, V.; Gupta, A.; Singh, M. Study on Dispersion of Genetic Variation among Indian Garlic Ecotypes Using Agro Morphological Traits. Indian J. Genet. Plant Breed. 2020, 80, 94–102. [Google Scholar] [CrossRef]
  33. Petropoulos, S.A.; Fernandes, Â.; Ntatsi, G.; Petrotos, K.; Barros, L.; Ferreira, I.C.F.R. Nutritional Value, Chemical Characterization and Bulb Morphology of Greek Garlic Landraces. Molecules 2018, 23, 319. [Google Scholar] [CrossRef] [PubMed] [Green Version]
  34. Polyzos, N.; Papasotiropoulos, V.; Lamari, F.N.; Petropoulos, S.A.; Bebeli, P.J. Phenotypic Characterization and Quality Traits of Greek Garlic (Allium sativum L.) Germplasm Cultivated at Two Different Locations. Genet. Resour. Crop Evol. 2019, 66, 1671–1689. [Google Scholar] [CrossRef]
  35. Ma, K.H.; Kwag, J.G.; Zhao, W.; Dixit, A.; Lee, G.A.; Kim, H.H.; Chung, I.M.; Kim, N.S.; Lee, J.S.; Ji, J.J.; et al. Isolation and Characteristics of Eight Novel Polymorphic Microsatellite Loci from the Genome of Garlic (Allium sativum L.). Sci. Hortic. 2009, 122, 355–361. [Google Scholar] [CrossRef]
  36. Kaushik, S.; Kumar, M.; Prakash, S.; Kumar, V.; Singh, M.K.; Singh, B.; Malik, S.; Singh, K. Study of Genetic Diversity in Garlic (Allium sativum L.) by Using Morphological Characters. Progress. Agric. 2016, 16, 204. [Google Scholar] [CrossRef]
  37. García Lampasona, S.; Martínez, L.; Burba, J.L. Genetic diversity among selected Argentinean garlic clones (Allium sativum L.) using AFLP (Amplified Fragment Length Polymorphism). Euphytica 2003, 132, 115–119. [Google Scholar] [CrossRef]
  38. Ipek, M.; Ipek, A.; Simon, P.W. Molecular Characterization of Kastamonu Garlic: An Economically Important Garlic Clone in Turkey. Sci. Hortic. 2008, 115, 203–208. [Google Scholar] [CrossRef]
  39. Wang, H.; Li, X.; Liu, X.; Oiu, Y.; Song, J.; Zhang, X. Genetic Diversity of Garlic (Allium sativum L.) Germplasm from China by Fluorescent-Based AFLP, SSR and InDel Markers. Plant Breed. 2016, 135, 743–750. [Google Scholar] [CrossRef]
  40. Ipek, M.; Ipek, A.; Simon, P.W. Rapid Characterization of Garlic Clones with Locus-Specific DNA Markers. Turk. J. Agric. For. 2008, 32, 357–362. [Google Scholar]
  41. Mukherjee, A.; Sikdar, B.; Ghosh, B.; Banerjee, A.; Ghosh, E.; Bhattacharya, M.; Roy, S.C. RAPD and ISSR Analysis of Some Economically Important Species, Varieties, and Cultivars of the Genus Allium (Alliaceae). Turk. J. Botany 2013, 37, 605–618. [Google Scholar] [CrossRef]
  42. Chen, S.; Zhou, J.; Chen, Q.; Chang, Y.; Du, J.; Meng, H. Analysis of the Genetic Diversity of Garlic (Allium sativum L.) Germplasm by SRAP. Biochem. Syst. Ecol. 2013, 50, 139–146. [Google Scholar] [CrossRef]
  43. Cunha, C.P.; Hoogerheide, E.S.S.; Zucchi, M.I.; Monteiro, M.; Pinheiro, J.B. New Microsatellite Markers for Garlic, Allium sativum (Alliaceae). Am. J. Bot. 2012, 99, e17–e19. [Google Scholar] [CrossRef]
  44. da Cunha, C.P.; Resende, F.V.; Zucchi, M.I.; Pinheiro, J.B. SSR-Based Genetic Diversity and Structure of Garlic Accessions from Brazil. Genetica 2014, 142, 419–431. [Google Scholar] [CrossRef] [PubMed]
  45. Kumar, M.; Rakesh Sharma, V.; Kumar, V.; Sirohi, U.; Chaudhary, V.; Sharma, S.; Saripalli, G.; Naresh, R.K.; Yadav, H.K.; Sharma, S. Genetic Diversity and Population Structure Analysis of Indian Garlic (Allium sativum L.) Collection Using SSR Markers. Physiol. Mol. Biol. Plants 2019, 25, 377–386. [Google Scholar] [CrossRef] [PubMed]
  46. Doyle, J.J.; Doyle, J.L. A Rapid Total DNA Preparation Procedure for Fresh Plant Tissue. Focus 1990, 12, 13–15. [Google Scholar]
  47. Lee, G.A.; Kwon, S.J.; Park, Y.J.; Lee, M.C.; Kim, H.H.; Lee, J.S.; Lee, S.Y.; Gwag, J.G.; Kim, C.K.; Ma, K.H. Cross-Amplification of SSR Markers Developed from Allium sativum to Other Allium Species. Sci. Hortic. 2011, 128, 401–407. [Google Scholar] [CrossRef]
  48. Yeh, F.; Yang, R.; Boyle, T.; Ye, Z.; Mao, J. POPGENE, the User-Friendly Shareware for Population Genetic Analysis. Mol. Biol. Biotechnol. Cent. Univ. Alta. Can. 1997, 10, 295–301. [Google Scholar]
  49. Kalinowski, S.T.; Taper, M.L.; Marshall, T.C. Revising How the Computer Program CERVUS Accommodates Genotyping Error Increases Success in Paternity Assignment. Mol. Ecol. 2007, 16, 1099–1106. [Google Scholar] [CrossRef]
  50. Botstein, D.; White, R.L.; Skolnick, M.; Davis4, R.W. Construction of a genetic linkage map in man using restriction fragment length polymorphisms. Am. J. Hum. Genet. 1980, 32, 314–331. [Google Scholar]
  51. Peakall, R.; Smouse, P.E. GenALEx 6.5: Genetic Analysis in Excel. Population Genetic Software for Teaching and Research-an Update. Bioinformatics 2012, 28, 2537–2539. [Google Scholar] [CrossRef] [Green Version]
  52. Hampl, V.; Pavlíček, A.; Flegr, J. Construction and Bootstrap Analysis of DNA Fingerprinting-Based Phylogenetic Trees with the Freeware Program FreeTree: Application to Trichomonad Parasites. Int. J. Syst. Evol. Microbiol. 2001, 51, 731–735. [Google Scholar] [CrossRef]
  53. Nei, M.; Li, W.-H. Mathematical model for studying genetic variation in terms of restriction endonucleases. Proc. Natl. Acad. Sci. USA 1979, 76, 5269–5273. [Google Scholar] [CrossRef]
  54. Rambaut, A. FigTree v1.3.1; Institute of Evolutionary Biology, University of Edinburgh: Edinburgh, Scotland, 2010; Available online: http://tree.bio.ed.ac.uk/software/figtree/ (accessed on 12 March 2023).
  55. Prichard, J.K.; Stephens, M.; Donnelly, P. Inference of Population Structure Using Multilocus Genotype Data. Genetics 2000, 155, 945–959. [Google Scholar] [CrossRef] [PubMed]
  56. Evanno, G.; Regnaut, S.; Goudet, J. Detecting the Number of Clusters of Individuals Using the Software STRUCTURE: A Simulation Study. Mol. Ecol. 2005, 14, 2611–2620. [Google Scholar] [CrossRef] [PubMed] [Green Version]
  57. Earl, D.A.; vonHoldt, B.M. Structure Harvester: A Website and Program for Visualizing STRUCTURE Output and Implementing the Evanno Method. Conserv. Genet. Resour. 2012, 4, 359–361. [Google Scholar] [CrossRef]
  58. Remington, D.L.; Thornsberry, J.M.; Matsuoka, Y.; Wilson, L.M.; Whitt, S.R.; Doebley, J.; Kresovich, S.; Goodman, M.M.; Buckler, E.S., IV. Structure of Linkage Disequilibrium and Phenotypic Associations in the Maize Genome. Proc. Natl. Acad. Sci. USA 2001, 98, 11479–11484. [Google Scholar] [CrossRef]
  59. Kopelman, N.M.; Mayzel, J.; Jakobsson, M.; Rosenberg, N.A.; Mayrose, I. CLUMPAK: A Program for Identifying Clustering Modes and Packaging Population Structure Inferences across K. Mol. Ecol. Resour. 2015, 15, 1179–1191. [Google Scholar] [CrossRef] [Green Version]
  60. IBM Corp. IBM SPSS Statistics for Macintosh, Version 28.0; IBM Corp: Armonk, NY, USA, 2021. [Google Scholar]
  61. Nei, M. Genetic Distance between Populations. Am. Nat. 1972, 106, 283–292. [Google Scholar] [CrossRef]
  62. Figliuolo, G.; Candido, V.; Logozzo, G.; Miccolis, V.; Zeuli, P.L.S. Genetic Evaluation of Cultivated Garlic Germplasm (Allium sativum L. and A. ampeloprasum L.). Euphytica 2001, 121, 325–334. [Google Scholar] [CrossRef]
  63. Ipek, M.; Sahin, N.; Ipek, A.; Cansev, A.; Simon, P.W. Development and Validation of New SSR Markers from Expressed Regions in the Garlic Genome. Sci. Agric. 2015, 72, 41–46. [Google Scholar] [CrossRef] [Green Version]
  64. Egea, L.A.; Mérida-García, R.; Kilian, A.; Hernandez, P.; Dorado, G. Assessment of Genetic Diversity and Structure of Large Garlic (Allium sativum) Germplasm Bank, by Diversity Arrays Technology “Genotyping-by-Sequencing” Platform (DArTseq). Front. Genet. 2017, 8, 98. [Google Scholar] [CrossRef] [Green Version]
  65. Gimenez, M.D.; Yañez-Santos, A.M.; Paz, R.C.; Quiroga, M.P.; Marfil, C.F.; Conci, V.C.; García-Lampasona, S.C. Assessment of genetic and epigenetic changes in virus-free garlic (Allium sativum L.) plants obtained by meristem culture followed by in vitro propagation. Plant Cell Rep. 2016, 35, 129–141. [Google Scholar] [CrossRef]
  66. Gimenez, M.D.; García-Lampasona, S. Before-after analysis of genetic and epigenetic markers in garlic: A 13-year experiment. Sci. Hortic. 2018, 240, 23–28. [Google Scholar] [CrossRef]
  67. Zhao, W.G.; Chung, J.W.; Lee, G.A.; Ma, K.H.; Kim, H.H.; Kim, K.T.; Chung, I.M.; Lee, J.K.; Kim, N.S.; Kim, S.M.; et al. Molecular Genetic Diversity and Population Structure of a Selected Core Set in Garlic and Its Relatives Using Novel SSR Markers. Plant Breed. 2011, 130, 46–54. [Google Scholar] [CrossRef]
  68. Lazaridi, E.; Ntatsi, G.; Savvas, D.; Bebeli, P.J. Diversity in cowpea (Vigna unguiculata (L.) Walp.) local populations from Greece. Genet. Resour. Crop Evol. 2017, 64, 1529–1551. [Google Scholar] [CrossRef]
  69. Frankham, R. Do Island Populations Have Less Genetic Variation than Mainland Populations? Heredity 1997, 78, 311–327. [Google Scholar] [CrossRef] [PubMed] [Green Version]
  70. García-Lampasona, S.; Asprelli, P.; Burba, J.L. Genetic Analysis of a Garlic (Allium sativum L.) Germplasm Collection from Argentina. Sci. Hortic. 2012, 138, 183–189. [Google Scholar] [CrossRef]
  71. Morales, R.G.F.; Resende, J.T.V.; Resende, F.V.; Delatorre, C.A.; Figueiredo, A.S.T.; Da-Silva, P.R. Genetic Divergence among Brazilian Garlic Cultivars Based on Morphological Characters and AFLP Markers. Genet. Mol. Res. 2013, 12, 270–281. [Google Scholar] [CrossRef]
  72. Gomes Viana, J.P.; de Pires, C.J.; Bajay, M.M.; dos Santos Valente, S.E.; Pinheiro, J.B.; Zucchi, M.I.; de Almeida Lopes, Â.C.; Ferreira Gomes, R.L. Do the Importations of Crop Products Affect the Genetic Diversity from Landraces? A Study Case in Garlic (Allium sativum L.). Genet. Resour. Crop Evol. 2021, 68, 1199–1211. [Google Scholar] [CrossRef]
  73. Longmei, N.; Gill, G.K.; Zaidi, P.H.; Kumar, R.; Nair, S.K.; Hindu, V.; Vinayan, M.T.; Vikal, Y. Genome Wide Association Mapping for Heat Tolerance in Sub-Tropical Maize. BMC Genom. 2021, 22, 154. [Google Scholar] [CrossRef]
  74. Ghomi, K.; Rabiei, B.; Sabouri, H.; Alamdari, E.G. Association between SSR Markers and Phenologic Plus Agronomic Traits in Barley (Hordeum valgare L.) Under Cold Stress Conditions. Plant Mol. Biol. Report. 2023, 41, 164–184. [Google Scholar] [CrossRef]
  75. González, R.E.; Burba, J.L.; Camargo, A.B. A Physiological Indicator to Estimate Allicin Content in Garlic during Storage. J. Food Biochem. 2013, 37, 449–455. [Google Scholar] [CrossRef]
  76. Wall, M.M.; Corgan, J.N. Relationship between Pyruvate Analysis and Flavor Perception for Onion Pungency Determination. HortScience 1992, 27, 1029–1030. [Google Scholar] [CrossRef] [Green Version]
  77. Cavagnaro, P.F.; Camargo, A.; Galmarini, C.R.; Simon, P.W. Effect of Cooking on Garlic (Allium sativum L.) Antiplatelet Activity and Thiosulfinates Content. J. Agric. Food Chem. 2007, 55, 1280–1288. [Google Scholar] [CrossRef] [PubMed]
Figure 1. Principal coordinate analysis (PCoA) of the 27 garlic accessions, as well as the Allium schoenoprasum accession (AS29). The Y and X axes represent the two main coordinate axes, and the percentage values of the coordinate axes represent interpretations of the differences in sample composition. The closer the two sample points are, the more similar their genetic composition. The first and second groups formed are represented by blue and red dots respectively.
Agriculture 13 01408 g001
Figure 2. UPGMA dendrogram of the accessions studied, based on the SSR data, revealed the formation of three distinct clusters, with the A. schoenoprasum (AS29) and AS6 accessions being the most distant; the genetic structure of garlic accessions as revealed using STRUCTURE is also presented.
Agriculture 13 01408 g002
Table 1. Collection sites and the geographical coordinates of the garlic accessions studied.
AccessionsCollection SitePrefectureLatitudeLongitudeAltitude (m)
AS1Agios PetrosLefkada38°40′ Ν20°36′ Ε328
AS2Nea Vyssa (market)Evros41°35′ Ν26°32′ Ε31
AS4PolichniMessinia37°16′ N21°56′ Ε432
AS5ΚaryaLefkada38°45′ Ν20°38′ Ε510
AS6KatounaLefkada38°46′ N20°42′ Ε165
AS7TripoliArkadia37°30′ N22°22′ Ε662
AS8ManasiLefkada38°41′ Ν20°36′ Ε557
AS9VrysoulaIoannina39°40′ Ν20°32′ Ε220
AS10Trachy, Skyros IslandEvia38°57′ Ν24°30′ Ε10
AS11TsourekiMessinia37°19′ Ν21°57′ Ε467
AS12Κefalonia (market)Kefalonia38°17′ Ν20°31′ Ε500
AS13AndaniaMessinia37°15′ Ν21°59′ Ε85
AS14KomotiniRodopi41°05′ Ν25°24′ Ε42
AS15AltomiraMessinia36°58′ Ν22°13′ Ε827
AS17Mavriki(i)Arkadia37°23′ Ν22°27′ Ε950
AS19LithovouniArkadia37°28′ Ν22°27′ Ε676
AS21Stadio TripoleosArkadia37°27′ N22°26′ Ε675
AS23KakaletriMessinia37°24′ Ν22°55′ Ε607
AS24DermatianikaLakonia36°54′ Ν23°02′ Ε35
AS25Mesa Vouni, Andros IslandCyclades37°47′ Ν24°55′ Ε585
AS28KitriesMessinia36°55′ Ν22°08′ Ε3
AS30Agios TheodorosKefalonia38°11′ Ν20°28′ Ε2
AS32Megali MantineiaMessinia36°57′ Ν22°09′ Ε207
AS33Kato DoloiMessinia36°93′ Ν22°17′ Ε315
AS34Milos IslandCyclades36°40′ Ν24°23′ Ε153
AS35ManthureaArkadia37°24′ Ν22°23′ Ε750
AS36Mavriki(ii)Arkadia37°23′ Ν22°27′ Ε950
Table 2. Primer information, labelling, and annealing temperatures of the primer pairs used.
SSRRepeat MotifForward PrimerLabellingReverse PrimerTm (°C)
Asa08 1(GT)8TGATTGAAACGAATCCCACA5′ FAMGGGGGTTACCTGAACCTGTTA54
Asa10 1(AC)7TTGTTGTTCTGCCATTTT5′ HEXGATCTAAGCCGAGAGAAA48
Asa24 1(GT)4(GT)3(GT)5TTGTTGTGCCGAGTTCCATA5′ FAMCAGCAATTTACCAAAGCCAAG57
GB-AS-076 2(GA)7CGGCGGGTTTAGTGATTT5′ HEXTTCGTTGGGTTCGATTTG52
GB-AS-102 2(AAAT)3AATCATCTTCGGGCCACT5′ TAMCCTAGAACGAGTGTGAAGGG52
1 Primer pairs from Cunha et al. [43]; 2 Primer pairs from Lee et al. [47].
Table 3. Primers used for the ISSR analysis; primers’ sequences; annealing temperatures; number and range of bands scored; polymorphism information content (PIC) for each primer used.
Primer IDPrimer Sequence (5′–3′)Tm (°C)No of Bands ScoredRange (bp)PIC
UBC-811(GA)8C51 °C19590–18750.500
UBC-812(GA)8A51 °C16400–27000.371
UBC-818(CA)8G51 °C18490–18000.499
UBC-826(AC)8C51 °C14650–27000.456
UBC-846(CA)8RT51 °C10680–13000.500
UBC-880(GGAGA)351 °C7550–13900.499
Table 4. Diversity statistics of the studied SSR markers for all the Allium accessions, including number of alleles (Na), number of effective alleles (Ne), estimated gene flow (Nm), Shannon’s Information index (I), polymorphic information content (PIC), observed homozygosity (Obs. Ho), expected homozygosity (Exp. Ho), observed heterozygosity (Obs. He), expected heterozygosity (Exp. He), and fixation index (Fst).
LocusNaNeNmIPICObs. Ho Exp. HoObs. HeExp. HeFst
Asa0893.3580.3171.5480.6690.2140.2950.7860.7050.440
Asa1053.6090.0791.4360.6830.6300.2740.3700.7260.759
Asa2441.8730.3380.8070.3980.4640.5320.5360.4680.425
GB-AS-07642.3020.9360.9410.4700.1070.4320.8930.5680.211
GB-AS-10241.1570.0380.3320.1330.9640.8640.0360.1360.868
Mean5.22.4600.2511.0130.4710.4760.4800.5240.5200.500
Table 5. Analysis of molecular variance (AMOVA) of the genetic diversity among and within the 27 garlic accessions using five SSR markers.
SourcedfSSMSEst. Var.%
Among Pops27183.0366.7790.67834%
Among Indiv1120.0000.0000.0000%
Within Indiv140182.5001.3041.30466%
Total279365.536 1.981100%
Table 6. Statistically significant correlations (p < 0.05) between the SSR loci and the morphological and chemical traits, obtained using both Fisher’s exact tests and logistic regression analyses.
Genotype TraitFisher’s Exact Test (p)Logistic Regression (p)
SSR
Asa08-Locus 7Allylprop1enyldisulfide0.0370.037
Asa10-Locus 4Pyruvate0.0360.05
Asa10-Locus 2Bulb position of root disc (BPRD)<0.0010.024
Asa10-Locus 5Shape of bulb base (SBB)0.0060.045
Asa10-Locus 20.0020.024
ISSR
811-Locus 84H-1,2,3-trithiine0.0410.007
826-Locus 11Anthocyanin stripes on clove scales (ASCS) 0.0030.05
812-Locus 14Bulb compactness of cloves (BCC)0.0040.006
818-Locus 9Bulb position of root disc (BPRD) 0.0500.05
846-Locus 6Bulb structure type (BST) 0.0100.008
880-Locus 2Carbohydrates0.0080.032
811-Locus 3Diallyl trisulfide (DATS)0.0250.02
811-Locus 2Number of cloves per compound bulb (NC/B) 0.0100.01
818-Locus 180.0340.035
811-Locus 6Total Identified Organosulfur Compounds (OS)0.0150.039
826-Locus 60.0090.039
826-Locus 9Shape of bulb base (SBB) 0.0370.016
846-Locus 60.0070.03
826-Locus 9Shape of Mature Bulb (SMB)0.0180.07
846-Locus 50.0060.019
812-Locus 5Total soluble solids (TSS) content (oBrix)0.0080.027
818-Locus 11Anthocyanin stripes on dry external scales of bulb (ASBDES)0.0420.036
846-Locus 60.0500.012
Disclaimer/Publisher’s Note: The statements, opinions and data contained in all publications are solely those of the individual author(s) and contributor(s) and not of MDPI and/or the editor(s). MDPI and/or the editor(s) disclaim responsibility for any injury to people or property resulting from any ideas, methods, instructions or products referred to in the content.

