

Do Pesticide Retailers’ Recommendations Aggravate Pesticide Overuse? Evidence from Rural China


Abstract
:1. Introduction
2. Theoretical Analysis and Methodology
2.1. Theoretical Analysis
2.2. Endogenous Switching Probit Model
2.3. Data
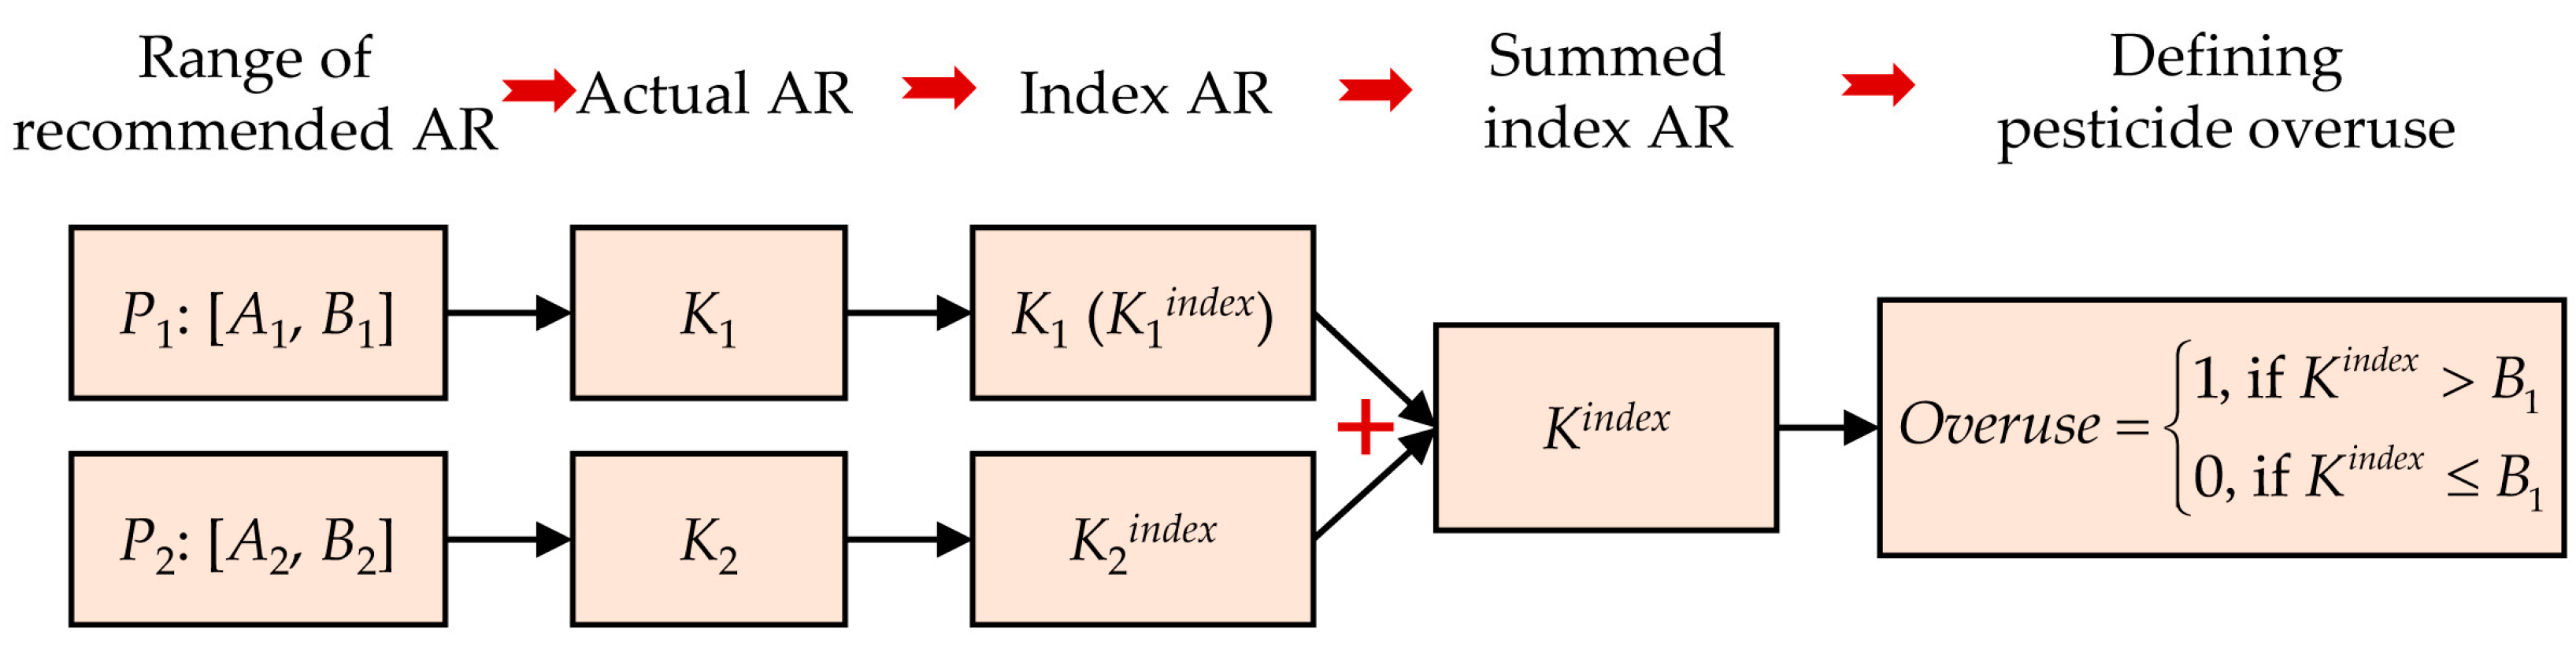
2.4. Measuring Pesticide Overuse
2.5. Descriptive Statistics
3. Results and Discussion
3.1. Determinants of Obtaining Information from Pesticide Retailers
3.2. Effect of Pesticide Retailers’ Recommendations on Pesticide Overuse
3.3. Other Factors Influencing Pesticide Overuse
4. Robustness Check
5. Conclusions and Policy Implications
Supplementary Materials
Author Contributions
Funding
Data Availability Statement
Conflicts of Interest
References
- Rola, A.C.; Pingali, P.L. Pesticides, Rice Productivity, and Farmers’ Health: An Economic Assessment; International Rice Research Institute: Manila, Philippines, 1993. [Google Scholar]
- Sun, S.; Zhang, C.; Hu, R. Determinants and overuse of pesticides in grain production: A comparison of rice, maize, and wheat in China. China Agric. Econ. Rev. 2020, 12, 367–379. [Google Scholar] [CrossRef]
- FAOSTAT. Pesticides; Food and Agriculture Organization: Rome, Italy, 2023. [Google Scholar]
- Cai, J.; Xiong, J.; Hong, Y.; Hu, R. Pesticide overuse in apple production and its socioeconomic determinants: Evidence from Shaanxi and Shandong provinces, China. J. Clean. Prod. 2021, 315, 128179. [Google Scholar] [CrossRef]
- Huang, Y.; Luo, X.; Tang, L.; Yu, W. The power of habit: Does production experience lead to pesticide overuse? Environ. Sci. Pollut. Res. 2020, 27, 25287–25296. [Google Scholar] [CrossRef] [PubMed]
- Yang, M.; Zhao, X.; Meng, T. What are the driving factors of pesticide overuse in vegetable production? Evidence from Chinese farmers. China Agric. Econ. Rev. 2019, 11, 672–687. [Google Scholar] [CrossRef]
- Huang, C.; Zhao, D.; Fan, X.; Liu, C.; Zhao, G. Landscape dynamics facilitated non-point source pollution control and regional water security of the Three Gorges Reservoir area, China. Environ. Impact Assess. Rev. 2022, 92, 106696. [Google Scholar] [CrossRef]
- Pan, D.; Zhang, N.; Kong, F. Does it matter who gives information? The impact of information sources on farmers’ pesticide use in China. J. Asian Econ. 2021, 76, 101345. [Google Scholar] [CrossRef]
- Dasgupta, S.; Meisner, C.M.; Huq, M. Health Effects and Pesticide Perception as Determinants of Pesticide Use: Evidence from Bangladesh, World Bank Policy Research Working Paper 3776; World Bank Publications: Herndon, VA, USA, 2005. [Google Scholar]
- Sookhtanlou, M.; Allahyari, M.S.; Surujlal, J. Health risk of potato farmers exposed to overuse of chemical pesticides in Iran. Saf. Health Work. 2022, 13, 23–31. [Google Scholar] [CrossRef]
- Nitzko, S.; Bahrs, E.; Spiller, A. Pesticide residues in food and drinking water from the consumer’s perspective: The relevance of maximum residue levels and product-specific differences. Sustain. Prod. Consump. 2022, 30, 787–798. [Google Scholar] [CrossRef]
- Zhang, C.; Hu, R.; Shi, G.; Jin, Y.; Robson, M.G.; Huang, X. Overuse or underuse? An observation of pesticide use in China. Sci. Total Environ. 2015, 538, 1–6. [Google Scholar] [CrossRef]
- Zhang, M.; Zeiss, M.R.; Geng, S. Agricultural pesticide use and food safety: California’s model. J. Integr. Agric. 2015, 14, 2340–2357. [Google Scholar] [CrossRef]
- Barres, B.; Micoud, A.; Corio-Costet, M.F. Trends and challenges in pesticide resistance detection. Trends Plant Sci. 2016, 21, 834–853. [Google Scholar]
- Sun, S.; Hu, R.; Zhang, C. Pest control practices, information sources, and correct pesticide use: Evidence from rice production in China. Ecol. Indic. 2021, 129, 107895. [Google Scholar] [CrossRef]
- Ma, W.; Zheng, H. Heterogeneous impacts of information technology adoption on pesticide and fertilizer expenditures: Evidence from wheat farmers in China. Aust. J. Agric. Resour. Econ. 2022, 66, 72–92. [Google Scholar] [CrossRef]
- Grovermann, C.; Schreinemachers, P.; Berger, T. Quantifying pesticide overuse from farmer and societal points of view: An application to Thailand. Crop. Prot. 2013, 53, 161–168. [Google Scholar] [CrossRef]
- Hou, L.; Liu, P.; Huang, J.; Deng, X. The influence of risk preferences, knowledge, land consolidation, and landscape diversification on pesticide use. Agric. Econ. 2020, 51, 759–776. [Google Scholar] [CrossRef]
- Liu, E.M.; Huang, J. Risk preferences and pesticide use by cotton farmers in China. J. Dev. Econ. 2013, 103, 202–215. [Google Scholar] [CrossRef] [Green Version]
- Zhou, L.; Zhang, F.; Zhou, S.; Turvey, C.G. The peer effect of training on farmers’ pesticides application: A spatial econometric approach. China Agric. Econ. Rev. 2020, 12, 481–505. [Google Scholar] [CrossRef]
- Chen, R.; Huang, J.; Qiao, F. Farmers’ knowledge on pest management and pesticide use in Bt cotton production in China. China Econ. Rev. 2013, 27, 15–24. [Google Scholar] [CrossRef]
- Sun, S.; Hu, R.; Zhang, C. Effects of technological information sources on rice farmers’ pesticide overuse and underuse behavior. World Agric. 2021, 8, 97–109. [Google Scholar]
- Jin, S.; Bluemling, B.; Mol, A.P.J. Information, trust and pesticide overuse: Interactions between retailers and cotton farmers in China. NJAS Wageningen J. Life Sci. 2015, 72–73, 23–32. [Google Scholar] [CrossRef] [Green Version]
- Sun, S.; Hu, R.; Zhang, C.; Shi, G. Do farmers misuse pesticides in crop production in China? Evidence from a farm household survey. Pest Manag. Sci. 2019, 75, 2133–2141. [Google Scholar] [CrossRef]
- Sun, Y.; Hu, R.; Zhang, C. Does the adoption of complex fertilizers contribute to fertilizer overuse? Evidence from rice production in China. J. Clean. Prod. 2019, 219, 677–685. [Google Scholar] [CrossRef]
- Ullah, A.; Arshad, M.; Kächele, H.; Khan, A.; Mahmood, N.; Müller, K. Information asymmetry, input markets, adoption of innovations and agricultural land use in Khyber Pakhtunkhwa, Pakistan. Land Use Policy 2020, 90, 104261. [Google Scholar] [CrossRef]
- Babu, S.C.; Huang, J.; Venkatesh, P.; Zhang, Y. A comparative analysis of agricultural research and extension reforms in China and India. China Agric. Econ. Rev. 2015, 7, 541–572. [Google Scholar] [CrossRef]
- Gao, Y.; Zhao, D.; Yu, L.; Yang, H. Influence of a new agricultural technology extension mode on farmers’ technology adoption behavior in China. J. Rural Stud. 2020, 76, 173–183. [Google Scholar] [CrossRef]
- Li, Z.; Hu, R.; Zhang, C.; Xiong, Y.; Chen, K. Governmental regulation induced pesticide retailers to provide more accurate advice on pesticide use to farmers in China. Pest Manag. Sci. 2022, 78, 184–192. [Google Scholar] [CrossRef]
- Yang, X.; Wang, F.; Meng, L.; Zhang, W.; Fan, L.; Geissen, V.; Ritsema, C.J. Farmer and retailer knowledge and awareness of the risks from pesticide use: A case study in the Wei River catchment, China. Sci. Total Environ. 2014, 497–498, 172–179. [Google Scholar] [CrossRef]
- Xu, R.; Kuang, R.; Pay, E.; Dou, H.; de Snoo, G.R. Factors contributing to overuse of pesticides in western China. Environ. Sci. 2008, 5, 235–249. [Google Scholar] [CrossRef] [Green Version]
- Li, Z.; Zhang, C.; Sun, S.; Hu, R. Pesticide sales and application behavior of pesticide shopkeepers under dual identities. China Soft Sci. 2023, 2, 95–103. [Google Scholar]
- Li, Z.; Zhang, C.; Hu, R.; Chen, K. Fertilizer and pesticide retailers’ technology service to farmers and its effect. China Soft Sci. 2021, 11, 36–44. [Google Scholar]
- Alam, S.A.; Wolff, H. Do pesticide sellers make farmers sick? Health, information, and adoption of technology in Bangladesh. J. Agric. Resour. Econ. 2016, 41, 62–80. [Google Scholar]
- Chen, H.; Zhou, H.; Sun, D. Effects of information transmission on pesticide application behavior of farmers and rice yield. J. Agrotech. Econ. 2017, 12, 23–31. [Google Scholar]
- Sexton, S.E.; Lei, Z.; Zilberman, D. The economics of pesticides and pest control. Int. Rev. Environ. Resour. Econ. 2007, 1, 271–326. [Google Scholar] [CrossRef] [Green Version]
- Tang, L.; Luo, X. Can agricultural insurance encourage farmers to apply biological pesticides? Evidence from rural China. Food Policy 2021, 105, 102174. [Google Scholar] [CrossRef]
- Lokshin, M.; Sajaia, Z. Impact of interventions on discrete outcomes: Maximum likelihood estimation of the binary choice models with binary endogenous regressors. Stata J. 2011, 11, 368–385. [Google Scholar] [CrossRef] [Green Version]
- Li, C.; Ma, W.; Mishra, A.K.; Gao, L. Access to credit and farmland rental market participation: Evidence from rural China. China Econ. Rev. 2020, 63, 101523. [Google Scholar] [CrossRef]
- Ma, W.; Renwick, A.; Nie, P.; Tang, J.; Cai, R. Off-farm work, smartphone use, and household income: Evidence from rural China. China Econ. Rev. 2018, 52, 80–94. [Google Scholar] [CrossRef]
- Han, S.; Vytlacil, E.J. Identification in a generalization of bivariate probit models with dummy endogenous regressors. J. Econ. 2017, 199, 63–73. [Google Scholar] [CrossRef]
- Zhu, X.; Hu, R.; Zhang, C.; Shi, G. Does Internet use improve technical efficiency? Evidence from apple production in China. Technol. Forecast. Soc. Chang. 2021, 166, 120662. [Google Scholar] [CrossRef]
- Liu, M.; Min, S.; Ma, W.; Liu, T. The adoption and impact of e-commerce in rural China: Application of an endogenous switching regression model. J. Rural. Stud. 2021, 83, 106–116. [Google Scholar] [CrossRef]
- Shiferaw, B.; Kassie, M.; Jaleta, M.; Yirga, C. Adoption of improved wheat varieties and impacts on household food security in Ethiopia. Food Policy 2014, 44, 272–284. [Google Scholar] [CrossRef]
- Ayuya, O.I.; Gido, E.O.; Bett, H.K.; Lagat, J.K.; Kahi, A.K.; Bauer, S. Effect of certified organic production systems on poverty among smallholder farmers: Empirical evidence from Kenya. World Dev. 2015, 67, 27–37. [Google Scholar] [CrossRef]
- Zhang, C.; Lin, Y.; Hu, R.; Shi, G.; Xin, J.; Chen, K.; Meng, Y. Heterogeneous effects of information provision on fertilizer use in China’s rice production. Environ. Dev. Sustain. 2023. [Google Scholar] [CrossRef]
- Hao, J.; Bijman, J.; Gardebroek, C.; Heerink, N.; Heijman, W.; Huo, X. Cooperative membership and farmers’ choice of marketing channels—Evidence from apple farmers in Shaanxi and Shandong Provinces, China. Food Policy 2018, 74, 53–64. [Google Scholar] [CrossRef]
- Haile, K.K.; Nillesen, E.; Tirivayi, N. Impact of formal climate risk transfer mechanisms on risk-aversion: Empirical evidence from rural Ethiopia. World Dev. 2020, 130, 104930. [Google Scholar] [CrossRef] [Green Version]
- Atreya, K. Pesticide use knowledge and practices: A gender differences in Nepal. Environ. Res. 2007, 104, 305–311. [Google Scholar] [CrossRef]
- Wang, W.; Jin, J.; He, R.; Gong, H. Gender differences in pesticide use knowledge, risk awareness and practices in Chinese farmers. Sci. Total Environ. 2017, 590–591, 22–28. [Google Scholar] [CrossRef] [PubMed]
- Bhandari, G.; Atreya, K.; Yang, X.M.; Fan, L.; Geissen, V. Factors affecting pesticide safety behaviour: The perceptions of Nepalese farmers and retailers. Sci. Total. Environ. 2018, 631–632, 1560–1571. [Google Scholar] [CrossRef]
- Caffaro, F.; Micheletti Cremasco, M.M.; Roccato, M.; Cavallo, E. Drivers of farmers’ intention to adopt technological innovations in Italy: The role of information sources, perceived usefulness, and perceived ease of use. J. Rural Stud. 2020, 76, 264–271. [Google Scholar] [CrossRef]
- Feng, S.; Han, Y.; Qiu, H. Does crop insurance reduce pesticide usage? Evidence from China. China Econ. Rev. 2021, 69, 101679. [Google Scholar] [CrossRef]
- Roodman, D. Fitting fully observed recursive mixed-process models with cmp. Stata J. 2011, 11, 159–206. [Google Scholar] [CrossRef] [Green Version]
- Melesse, W.E.; Berihun, E.; Baylie, F.; Kenubih, D. The role of public policy in debt level choices among small-scale manufacturing enterprises in Ethiopia: Conditional mixed process approach. Heliyon 2021, 7, e08548. [Google Scholar] [CrossRef] [PubMed]
- Sun, D.; Rickaille, M.; Xu, Z. Determinants and impacts of outsourcing pest and disease management: Evidence from China’s rice production. China Agric. Econ. Rev. 2018, 10, 443–461. [Google Scholar] [CrossRef]
- Ji, C.; Guo, H.; Jin, S.; Yang, J. Outsourcing agricultural production: Evidence from rice farmers in Zhejiang Province. PLoS ONE 2017, 12, e0170861. [Google Scholar] [CrossRef] [PubMed] [Green Version]
- Schreinemachers, P.; Grovermann, C.; Praneetvatakul, S.; Heng, P.; Nguyen, T.T.L.; Buntong, B.; Le, N.T.; Pinn, T. How much is too much? Quantifying pesticide overuse in vegetable production in Southeast Asia. J. Clean. Prod. 2020, 244, 118738. [Google Scholar] [CrossRef]


| Variable | Definition | Mean (SD) |
|---|---|---|
| Pesticide retailers’ recommendations | 1 if a farmer obtains information from pesticide retailers, 0 otherwise | 0.29 (0.45) |
| Male | 1 if a farmer is male, 0 otherwise | 0.90 (0.29) |
| Age | Age of farmer (years) | 57.13 (9.62) |
| Education | Years of schooling of a farmer (years) | 6.64 (3.27) |
| Village leader | 1 if a farmer is a village leader, 0 otherwise | 0.10 (0.30) |
| Technology training | 1 if a farmer participates in technology training, 0 otherwise | 0.24 (0.43) |
| Total rice sown area | Total sown size of rice (ha) | 2.01 (11.14) |
| Late-season rice | 1 if a farmer sows in late season, 0 otherwise | 0.48 (0.50) |
| Hybrid rice | 1 if a farmer adopts hybrid varieties, 0 otherwise | 0.47 (0.50) |
| Pesticide price | Average price of active ingredients (CNY/kg) | 133.93 (126.37) |
| Instrumental variable | Proportion of a farmer’s neighbors obtaining information from pesticide retailers at the village level (%) | 29.03 (14.45) |
| Number of farmers | 1084 |
| Variable | Farmers Obtaining Information from Pesticide Retailers | Farmers not Obtaining Information from Pesticide Retailers | Mean Differences |
|---|---|---|---|
| Male (1 = yes, 0 = no) | 0.91 (0.28) | 0.90 (0.30) | 0.01 |
| Age (years) | 58.11 (9.75) | 56.72 (9.55) | 1.38 ** |
| Education (years) | 5.99 (3.36) | 6.91 (3.20) | −0.92 *** |
| Village leader (1 = yes, 0 = no) | 0.06 (0.24) | 0.11 (0.32) | −0.05 ** |
| Technology training (1 = yes, 0 = no) | 0.14 (0.35) | 0.29 (0.45) | −0.15 *** |
| Total rice sown area (ha) | 1.04 (3.46) | 2.40 (13.03) | −1.36 * |
| Late-season rice (1 = yes, 0 = no) | 0.47 (0.50) | 0.48 (0.50) | 0.01 |
| Hybrid rice (1 = yes, 0 = no) | 0.49 (0.50) | 0.47 (0.50) | 0.03 |
| Pesticide price (RMB/kg) | 136.53 (130.98) | 132.86 (124.5) | 3.67 |
| Instrumental variable (%) | 32.59 (15.11) | 27.57 (13.91) | 5.02 *** |
| Number of farmers | 316 | 768 |
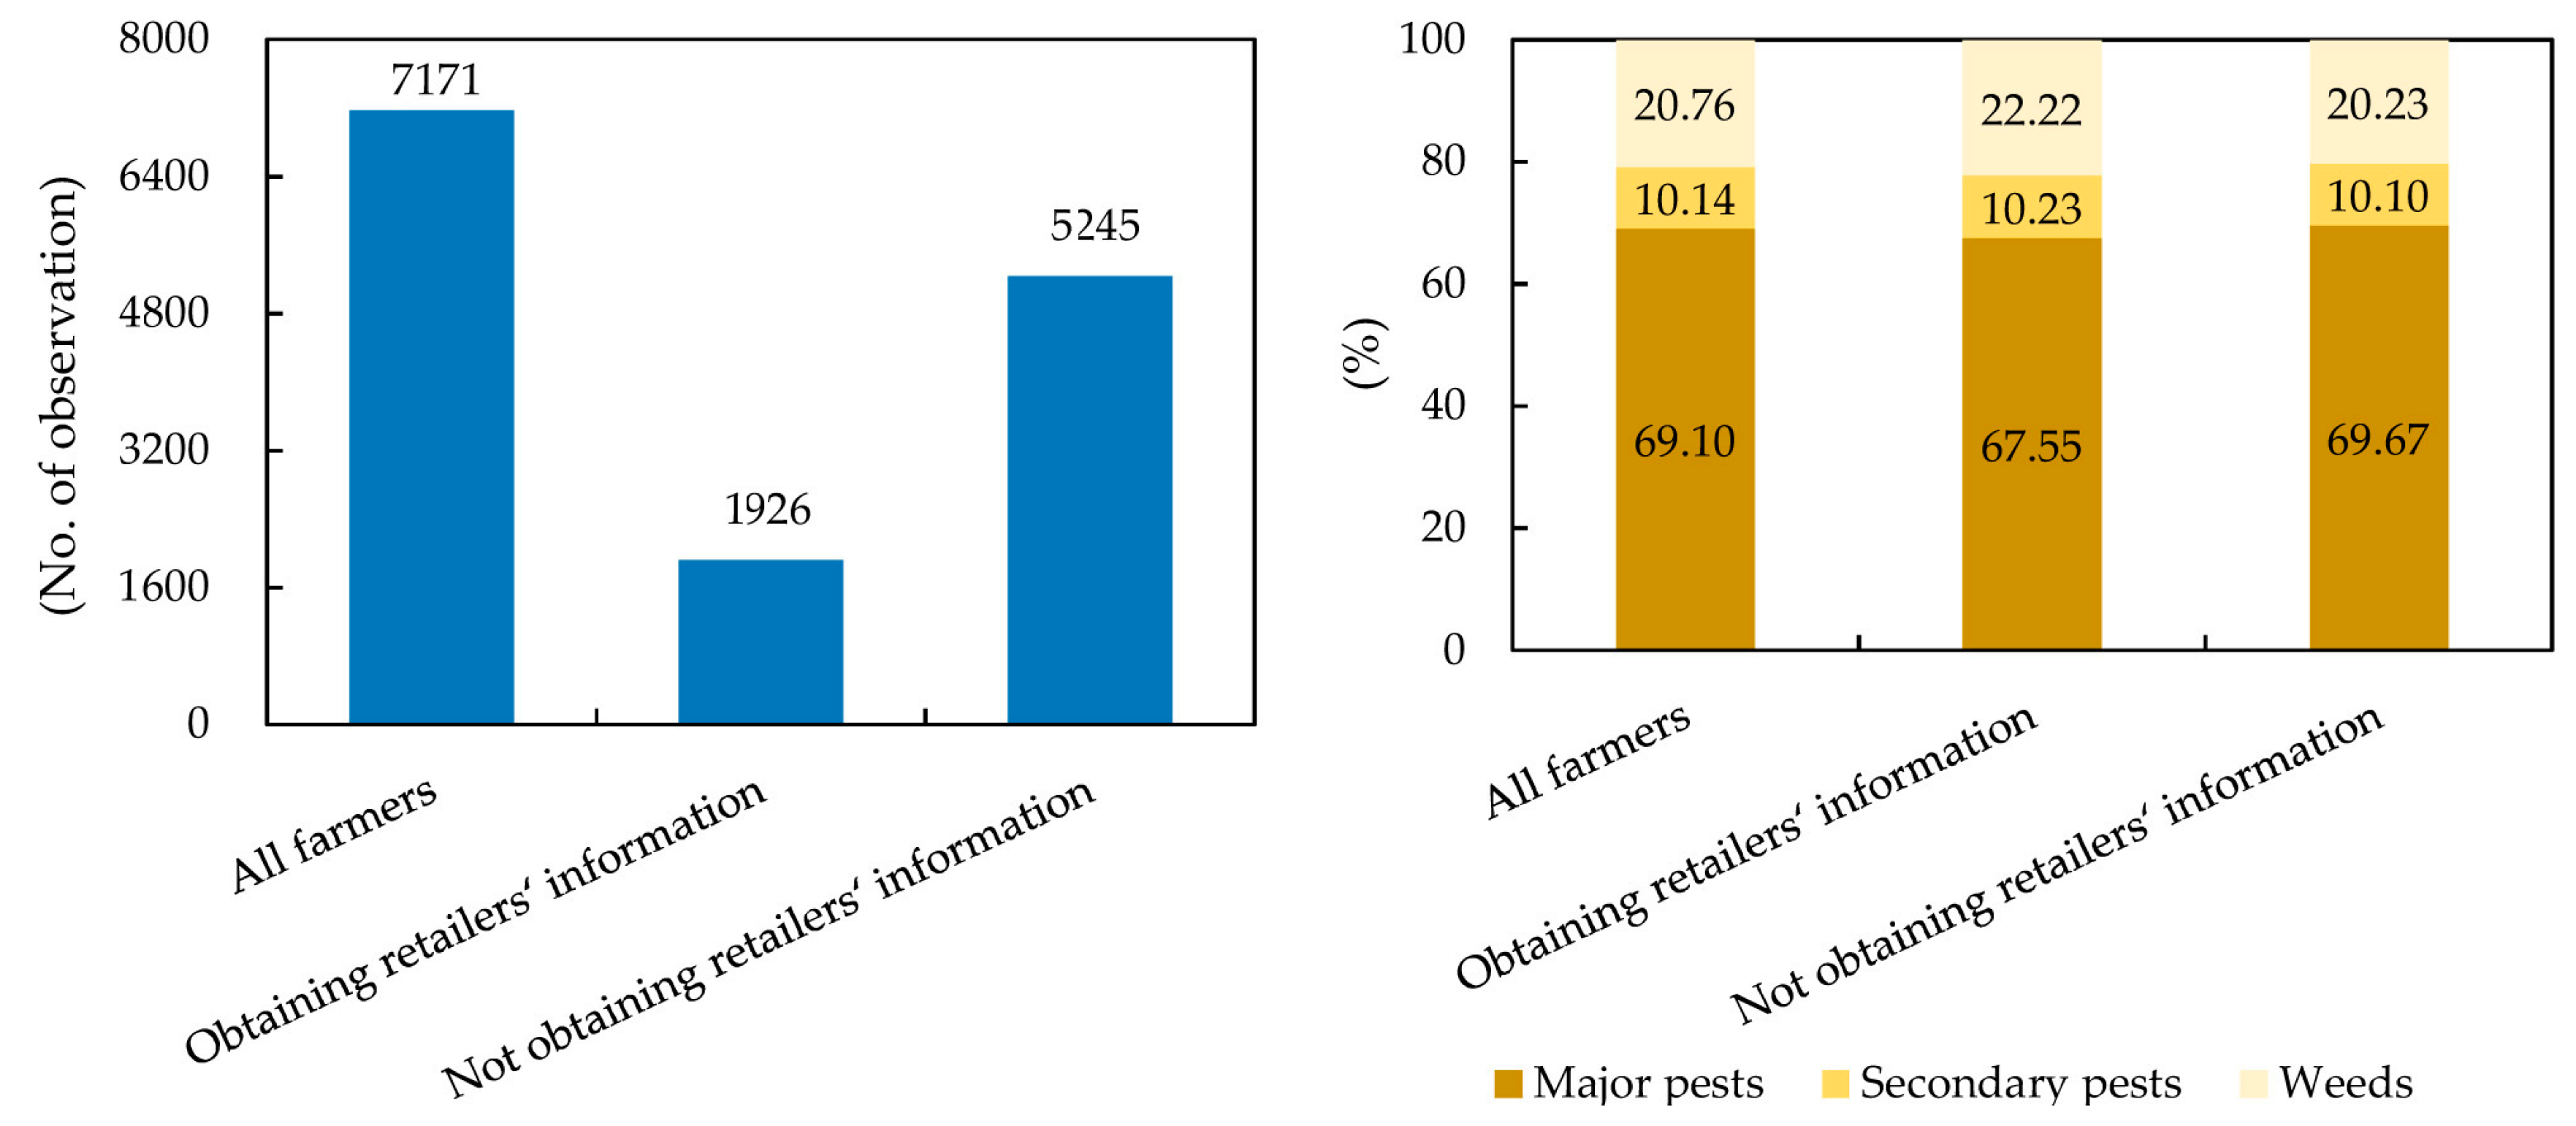
| Pest Category | All Farmers | Farmers Obtaining Information from Pesticide Retailers | Farmers Not Obtaining Information from Pesticide Retailers | Mean Differences |
|---|---|---|---|---|
| All pests | 54.43 | 56.49 (0.50) | 53.67 (0.50) | 2.82 ** |
| Major pests | 58.49 | 62.18 (0.49) | 57.17 (0.49) | 5.01 *** |
| Secondary pests | 55.02 | 59.39 (0.49) | 53.40 (0.50) | 5.99 |
| Weeds | 40.63 | 37.85 (0.49) | 41.75 (0.49) | −3.90 |
| Variable | Selection Equation | Outcome Equation (Pesticide Overuse) | |
|---|---|---|---|
| Farmers Obtaining Information from Pesticide Retailers | Farmers Not Obtaining Information from Pesticide Retailers | ||
| Male | 0.227 *** | 0.250 ** | 0.028 |
| (0.060) | (0.127) | (0.054) | |
| Age | 0.001 | 0.000 | 0.002 |
| (0.002) | (0.003) | (0.002) | |
| Education | −0.033 *** | −0.017 | 0.016 *** |
| (0.006) | (0.013) | (0.005) | |
| Village leader | −0.384 *** | 0.268 ** | 0.109 ** |
| (0.062) | (0.126) | (0.051) | |
| Technology training | −0.393 *** | 0.235 ** | 0.026 |
| (0.043) | (0.100) | (0.037) | |
| Total rice sown area | −0.013 *** | −0.001 | 0.004 *** |
| (0.003) | (0.007) | (0.001) | |
| Late-season rice | −0.237 *** | 0.031 | 0.268 *** |
| (0.039) | (0.078) | (0.038) | |
| Hybrid rice | 0.220 *** | −0.021 | −0.064 ** |
| (0.037) | (0.078) | (0.035) | |
| Pesticide price | 0.000 ** | 0.000 | −0.001*** |
| (0.000) | (0.000) | (0.000) | |
| Major pests | −0.004 | 0.101 | 0.104 ** |
| (0.054) | (0.089) | (0.051) | |
| Weeds | 0.053 | −0.421 *** | −0.244 *** |
| (0.062) | (0.111) | (0.059) | |
| Instrumental variable | 0.006 *** | ||
| (0.001) | |||
| Constant | −1.095 *** | 0.643 | −0.276 * |
| (0.159) | (0.429) | (0.147) | |
| District dummy | Controlled | Controlled | Controlled |
| ρ1 | −0.586 *** | ||
| (0.207) | |||
| ρ0 | −0.976 *** | ||
| (0.026) | |||
| Wald test of indep. eqns. (ρ1 = ρ0) | chi2(2) = 19.84 Prob > chi2 = 0.0000 | ||
| Observations | 7171 | ||
| Pest Categary | ATT | ATU |
|---|---|---|
| All pests | 0.565 *** (0.133) | 0.336 *** (0.091) |
| Major pests | 0.621 *** (0.090) | 0.330 *** (0.092) |
| Secondary pests | 0.593 *** (0.079) | 0.361 *** (0.081) |
| Weeds | 0.383 *** (0.097) | 0.348 *** (0.088) |
| Variable | Selection Equation | Outcome Equation (Pesticide Overuse) |
|---|---|---|
| Pesticide retailers’ recommendations | 1.115 *** | |
| (0.161) | ||
| Male | 0.239 *** | 0.111 ** |
| (0.060) | (0.056) | |
| Age | 0.002 | 0.004 ** |
| (0.002) | (0.002) | |
| Education | −0.032 *** | 0.005 |
| (0.006) | (0.006) | |
| Village leader | −0.366 *** | 0.103 ** |
| (0.062) | (0.051) | |
| Technology training | −0.375 *** | 0.010 |
| (0.043) | (0.045) | |
| Total rice sown area | −0.013 *** | 0.003 ** |
| (0.003) | (0.001) | |
| Late-season rice | −0.230 *** | 0.199 *** |
| (0.040) | (0.037) | |
| Hybrid rice | 0.208 *** | −0.004 |
| (0.037) | (0.040) | |
| Pesticide price | 0.000 *** | −0.001 *** |
| (0.000) | (0.000) | |
| Major pests | −0.022 | 0.098 ** |
| (0.055) | (0.048) | |
| Weeds | 0.038 | −0.320 *** |
| (0.063) | (0.057) | |
| Instrumental variable | 0.007 *** | |
| (0.001) | ||
| Constant | −1.163 *** | −0.382 *** |
| (0.161) | (0.139) | |
| District dummy | Controlled | Controlled |
| atanhrho_12 | −0.807 *** | |
| (0.191) | ||
| Observations | 7171 | |
| Variable | Selection Equation | Outcome Equation (Log of Index Application Rate) |
|---|---|---|
| Pesticide retailer recommendation | 0.829 *** | |
| (0.230) | ||
| Male | 0.295 *** | −0.258 *** |
| (0.089) | (0.083) | |
| Age | 0.003 | 0.001 |
| (0.003) | (0.003) | |
| Education | −0.044 *** | −0.001 |
| (0.008) | (0.008) | |
| Village leader | −0.267 *** | 0.106 |
| (0.085) | (0.074) | |
| Technology training | −0.291 *** | −0.119 ** |
| (0.060) | (0.057) | |
| Total rice sown area | −0.018 *** | 0.002 |
| (0.005) | (0.002) | |
| Late-season rice | −0.328 *** | −0.057 |
| (0.054) | (0.059) | |
| Hybrid rice | 0.166 *** | −0.008 |
| (0.051) | (0.051) | |
| Pesticide price | 0.001 *** | −0.003 *** |
| (0.000) | (0.000) | |
| Major pests | −0.055 | −0.051 |
| (0.075) | (0.071) | |
| Weeds | 0.002 | 0.139 |
| (0.092) | (0.087) | |
| Instrumental variable | 0.008 *** | |
| (0.002) | ||
| Constant | −1.304 *** | 7.303 *** |
| (0.236) | (0.216) | |
| District dummy | Controlled | Controlled |
| atanhrho_12 | −0.368 *** | |
| (0.109) | ||
| Observations | 7171 | |
Disclaimer/Publisher’s Note: The statements, opinions and data contained in all publications are solely those of the individual author(s) and contributor(s) and not of MDPI and/or the editor(s). MDPI and/or the editor(s) disclaim responsibility for any injury to people or property resulting from any ideas, methods, instructions or products referred to in the content. |
© 2023 by the authors. Licensee MDPI, Basel, Switzerland. This article is an open access article distributed under the terms and conditions of the Creative Commons Attribution (CC BY) license (https://creativecommons.org/licenses/by/4.0/).
Share and Cite
Sun, S.; Zhang, C.; Hu, R.; Liu, J. Do Pesticide Retailers’ Recommendations Aggravate Pesticide Overuse? Evidence from Rural China. Agriculture 2023, 13, 1301. https://doi.org/10.3390/agriculture13071301
Sun S, Zhang C, Hu R, Liu J. Do Pesticide Retailers’ Recommendations Aggravate Pesticide Overuse? Evidence from Rural China. Agriculture. 2023; 13(7):1301. https://doi.org/10.3390/agriculture13071301
Chicago/Turabian StyleSun, Shengyang, Chao Zhang, Ruifa Hu, and Jian Liu. 2023. "Do Pesticide Retailers’ Recommendations Aggravate Pesticide Overuse? Evidence from Rural China" Agriculture 13, no. 7: 1301. https://doi.org/10.3390/agriculture13071301