Article

Theoretical Calculations and Experimental Studies of Power Loss in Dual-Clutch Transmission of Agricultural Tractors

1
Tractor Advanced Development Group, LS Mtron, Anyang 14118, Republic of Korea
2
Department of Biosystems Engineering, Seoul National University, 1 Gwanak-ro, Gwanak-gu, Seoul 08826, Republic of Korea
3
Department of Smart Industrial Machinery, Korea Institute of Machinery & Materials, Daejeon 34103, Republic of Korea
*
Author to whom correspondence should be addressed.
Agriculture 2023, 13(6), 1225; https://doi.org/10.3390/agriculture13061225
Submission received: 20 May 2023 / Revised: 5 June 2023 / Accepted: 9 June 2023 / Published: 10 June 2023
(This article belongs to the Special Issue Soil Mechanical Systems and Related Farming Machinery)

Abstract

:
Recent carbon neutrality policies have led to active research in the agricultural tractor sector to replace internal combustion engines, making it imperative to minimize power losses to improve efficiency. Dual-clutch transmissions (DCTs) have been employed in agricultural tractors primarily due to their short shift time and smooth shift feel. However, DCTs have a relatively large number of components and complex structures owing to spatial constraints, making it challenging to predict power losses. Therefore, to predict DCT power losses, this study defined oil churning by considering the structural characteristics and oil circulation and comparing and analyzing the theoretical calculation and test results of power losses at different oil levels. Power loss was calculated based on ISO standards and fluid viscosity theory, and tests were performed to verify. We calculated power losses based on the defined oil churning of a DCT in agricultural tractors and confirmed that their consistency in test results improved when reflecting the lubrication state, considering the structural features and oil circulation. In addition, the factors contributing to power loss under low- and high-speed conditions were analyzed by calculating the power loss for each component.

1. Introduction

Agricultural tractors perform various farming tasks using the vehicle’s rotational power or traction, such as plowing, transportation, and rotary work. Traditionally, diesel engines, particularly with manual transmissions, have been widely used owing to their high torque characteristics relative to engine output. Recently, demand for improved driver convenience and work efficiency, as well as technological pressure to replace fossil fuels in the agricultural tractor sector due to carbon neutrality policies, has been increasing.
Prominent alternative power sources for agricultural tractors being discussed include hydrogen fuel cells, batteries, and biodiesel. Research on small electrically driven tractors using batteries and motors, and studies exploring the technical and economic feasibility of small farms, are actively underway [1,2,3]. Other studies have proposed new energy management strategies for applying hybrid systems, comprising fuel cells and battery packs, to agricultural tractors [4,5]. Moreover, energy, economic, and environmental life-cycle assessment analyses have been conducted for applying biodiesel fuel to agricultural tractors [6]. However, alternative power sources generate less energy per unit volume and mass compared to diesel [7,8]. Consequently, when using alternative power sources, the continuous working time is reduced, making power losses in transmission systems an even more critical issue owing to their direct impact on production efficiency.
Furthermore, researchers are actively studying automatic transmission systems in response to market demand for improved driver convenience and work efficiency [9,10,11,12]. Automated transmissions (ATs) allow drivers to operate without a gear lever and can improve transmission productivity via the selection of the optimal gear ratio for farming tasks through control algorithms. Dual-clutch transmissions (DCTs), a type of AT, use two clutches responsible for even and odd gear steps in power transmission. Considering DCTs preselect the target gear shift stage and engage the clutch when shifting, they have a short shift time with no power interruption, resulting in a smooth shifting experience. However, due to the increased number of mechanical components needed to select even and odd gears—such as wet multi-plate clutches—and the complex supporting structures for components owing to spatial constraints within the transmission, power losses in the transmission must be considered.
Research on power loss in transmissions has been conducted primarily at the component level. Many studies have investigated the drag torque caused by oil viscosity between friction surfaces to calculate the power loss of wet multi-plate clutches [13,14]. The shear stress caused by oil viscosity between the ring and cone was considered for calculating the power loss of synchronizers, friction coefficients obtained through testing were proposed to predict bearing power loss [15,16]. In addition, research comparing analytical models and test results has been conducted to predict the power loss caused by oil churning in gears [17,18]. Moreover, researchers have conducted studies to calculate the power loss due to gear load transfer and conducted experimental verifications [19,20].
Power loss research on DCTs has primarily been conducted in the automotive sector, predicting power loss through theoretical predictions and experimental verifications [21,22]. Additionally, research considering power loss in transmissions has also been conducted in the agricultural tractor sector. The efficiency and energy consumption of tractor transmissions have been examined primarily in relation to operating conditions using vehicle tests [23,24]. Studies have also been conducted to predict transmission efficiency by examining the power loss generated by each component of agricultural DCTs through theoretical calculations [25].
Considering policy reasons driven by carbon neutrality requirements and consumer demand, a systematic study on the power transmission efficiency of agricultural transmissions is necessary. However, research on the efficiency of tractors has focused primarily on vehicle-level experimental verification, while no studies have examined the contribution of each component to the total power loss and compared theoretical calculations with actual test results. Moreover, the oil-churning state of the mechanical components must be defined to accurately predict the power loss of a transmission system. However, in transmissions such as the DCT—which has many components and circulates oil through hydraulic systems—oil levels change locally; hence, the structural characteristics must be considered. Moreover, studies on efficiency considering oil level changes due to the structural characteristics of agricultural DCTs remain insufficient.
Accordingly, this study compared the theoretical predictions of power loss in a DCT applied to agricultural tractors with power loss measurements obtained through laboratory tests. Considering the oil circulation for DCT lubrication, two power loss models, which considered the average oil level and oil circulation, respectively, were proposed, with theoretical predictions performed for each case. We used the ISO standard and viscosity fluid theory to calculate the power loss of components making up the transmission and constructed a measurement system using a 3-axis dynamometer to measure them. The power losses considering oil circulation and the average oil level were compared and the test results were analyzed.

2. Materials and Methods

2.1. DCTs for Agricultural Tractors

In this study, a 24-speed full-power shift DCT for 100-kW agricultural tractors was applied to 5-ton tractors (without attachments) and shifted by alternately engaging the left and right odd and even shaft clutches. This DCT comprises three parts—input, even, and odd shafts—which is relatively more components than other transmissions.
As shown in Figure 1, the target DCT comprises 64 shafts, 58 gears, 95 bearings, 5 clutches, 14 synchronizers, and 2 dog clutches, and includes 2 rear axle brakes and 1 parking brake within the transmission. However, the transmission system is assembled by dividing it into sections because it is challenging to arrange the numerous components that make up the DCT in a single case. Each section has a partition wall supported by housing and bearings, with empty spaces being left to allow free oil movement when designing the partition wall. However, the rear partition wall has a relatively thick wall and a narrow space to support the amplified load of the gear train, hindering oil circulation and isolating the space. Nonetheless, these spaces can be divided into three cells based on the partition walls isolating them.
Figure 1 shows the structure and oil level of the DCT used in this study. The DCT is divided into three cells based on the partition walls supporting the rear part of the power transmission system: the front cell, where gears of the forward/reverse shift and main shift parts are arranged; the mid cell, where gears of the range shift and 4WD parts are arranged; and the rear cell, where the spiral bevel gear connected to the rear axle and PTO (power take-off) gears are arranged. As shown in Figure 1a, the transmission oil level is maintained at the height of the rear axle center.
The oil in agricultural tractors simultaneously performs the roles of lubrication for the components and hydraulic fluid for the hydraulic system. The transmission oil is churned by the immersed rotating components and circulated by the hydraulic system simultaneously. Therefore, the oil levels in each cell are dynamic and differ considerably. The DCT used in this study has an intake line at the bottom to supply oil to the hydraulic system. Moreover, to secure a stable oil supply flow when driving on a slope, forward/reverse and dual clutches are used, which forcibly supply oil from the front cell—where relatively more flow is discharged—to the mid cell through a pump. Figure 1b shows an oil-level application model reflecting the partition walls and oil circulation of the hydraulic system.
Theoretical power-loss predictions were performed for Case I, considering the average oil level of the transmission, and for Case II, considering the partition walls and hydraulic system, both verified through testing.

2.2. Power Loss Calculations

The ISO TR 14179-1 standard and drag torque due to viscous fluid were considered to calculate the power loss caused by the components making up the powertrain, with gears, bearings, shafts, clutches, and brakes considered for these calculations [26,27].
The total power loss can be expressed as the sum of fundamental, load-dependent, and speed-dependent power losses. The fundamental power loss is the power consumed to drive the tractor, a representative example being the power loss of the pump used to drive the hydraulic line. The measured fundamental power loss was 3.0 kW, applied equally to all gear steps. The load-dependent power loss occurs in the friction surfaces under load, resulting in a corresponding load-dependent power loss of gears and bearings. Speed-dependent power loss is the power loss due to motion resistance when components of the power transmission system rotate, implying that the power loss due to drag is caused by the oil applied for lubrication and cooling. For speed-dependent power loss, the power loss of clutches, bearings, gears, shafts, and brakes was considered. The total power loss ( P L ) of the power transmission system can be calculated using Equation (1), with the factors considered for each power loss shown in Table 1.
P L = P H P + P G L + P G S + P B L + P B S + P S + P C L + P B R

2.2.1. Power Losses of the Gear and Shaft

The load-dependent power loss of the gear ( P G L ) can be expressed as follows:
P G L = f m T 1 n 1 c o s   2 β 9549 M
where f m denotes the mesh coefficient of friction (determined by the pitch line speed, lubricating oil viscosity, load size, and gear size), and M denotes the mesh mechanical advantage (a coefficient influenced by the gear size, pressure angle, and gear step).
The speed-dependent power loss of the gear ( P G S ) and speed-dependent power loss of the shaft ( P S ) can be expressed as the sum of power losses owing to the outer diameter ( P G W 1 ), lateral part ( P G W 2 ), and tooth surface ( P G W 3 ). P G W 1 , P G W 2 , and P G W 3 can be calculated using Equations (3)–(5), respectively, as follows:
P G W 1 = 7.37 f g ν n 3 D 4.7 L A g 10 26
P G W 2 = 1.474 f g ν n 3 D 5.7 A g 10 26
P G W 3 = 7.37 f g ν n 3 D 4.7 F ( R f tan β ) A g 10 26
where R f denotes the roughness factor (which is influenced by the transverse module).

2.2.2. Power Loss of the Bearing

The load-dependent power loss of the bearing ( P B L ) can be expressed as follows:
P B L = ( M 1 + M 2 ) n 9549
where M 1 denotes the bearing-load-dependent torque (calculated using the load rating of the bearing, dynamic load, coefficient of friction, and bearing size) and M 2 denotes the cylindrical-roller-bearing axial-load-dependent moment (determined by the friction coefficient of the lubrication surface, axial bearing load, and bearing size).
The speed-dependent power loss of the bearing ( P B S ) can be expressed as follows:
P B S = ( M 0 + M 3 ) n 9549
where M 0 denotes the load-independent frictional moment (influenced by the dynamic viscosity coefficient, dip factor, rotation speed, and size), and M 3 is the frictional moment of seals (a factor influenced by the size and type of the bearing).

2.2.3. Power Loss of the Clutch and Brake

Clutch drag torque occurs owing to the shear stress caused by the viscosity of the lubricating oil between the friction surfaces. The clutch power loss can be calculated by correcting the drag torque based on the supplied flow area, while the drag torque can be calculated using Equation (8) [27]. The oil is supplied from the shaft center, causing a ruptured section where the oil flow breaks into mist and steam. As a result, three flow sections are generated— T f a , T r a , and T m ; their relationships are expressed in Equations (9)–(11). The oil used was ISO VG 46; in addition, oil viscosity properties of 46 cSt at 40 °C and 6.7 cSt at 100 °C were considered. The viscosity of the lubricating oil in the mist state can be assumed to be 1/10 of the oil viscosity.
T C L = ( 1 r a g ) · ( T f a + T r a + T m )
T f a = π μ Δ ω N 2 h · ( r c 4 r i 4 )
T r a = π μ Δ ω N h · Φ · ( r o 2 r c 2 )
T m = 2 π μ m i s t Δ ω N h · [ ( r o 4 r c 4 ) 4 Φ 2 · ( r o 2 r c 2 ) ]
The power loss of the clutch ( P C L ) considering the drag torque of each section can be expressed as follows:
P C L = T C L Δ n 2 π 60 × 1000
Similarly, the power loss of the brake ( P B ), which occurs owing to the shear stress caused by the fluid viscosity, can be expressed as follows:
P B = ( 1 r a g ) N μ α h ( 2 π n 60 ) 2 [ r o 4 4 r i 4 4 ] 1 1000

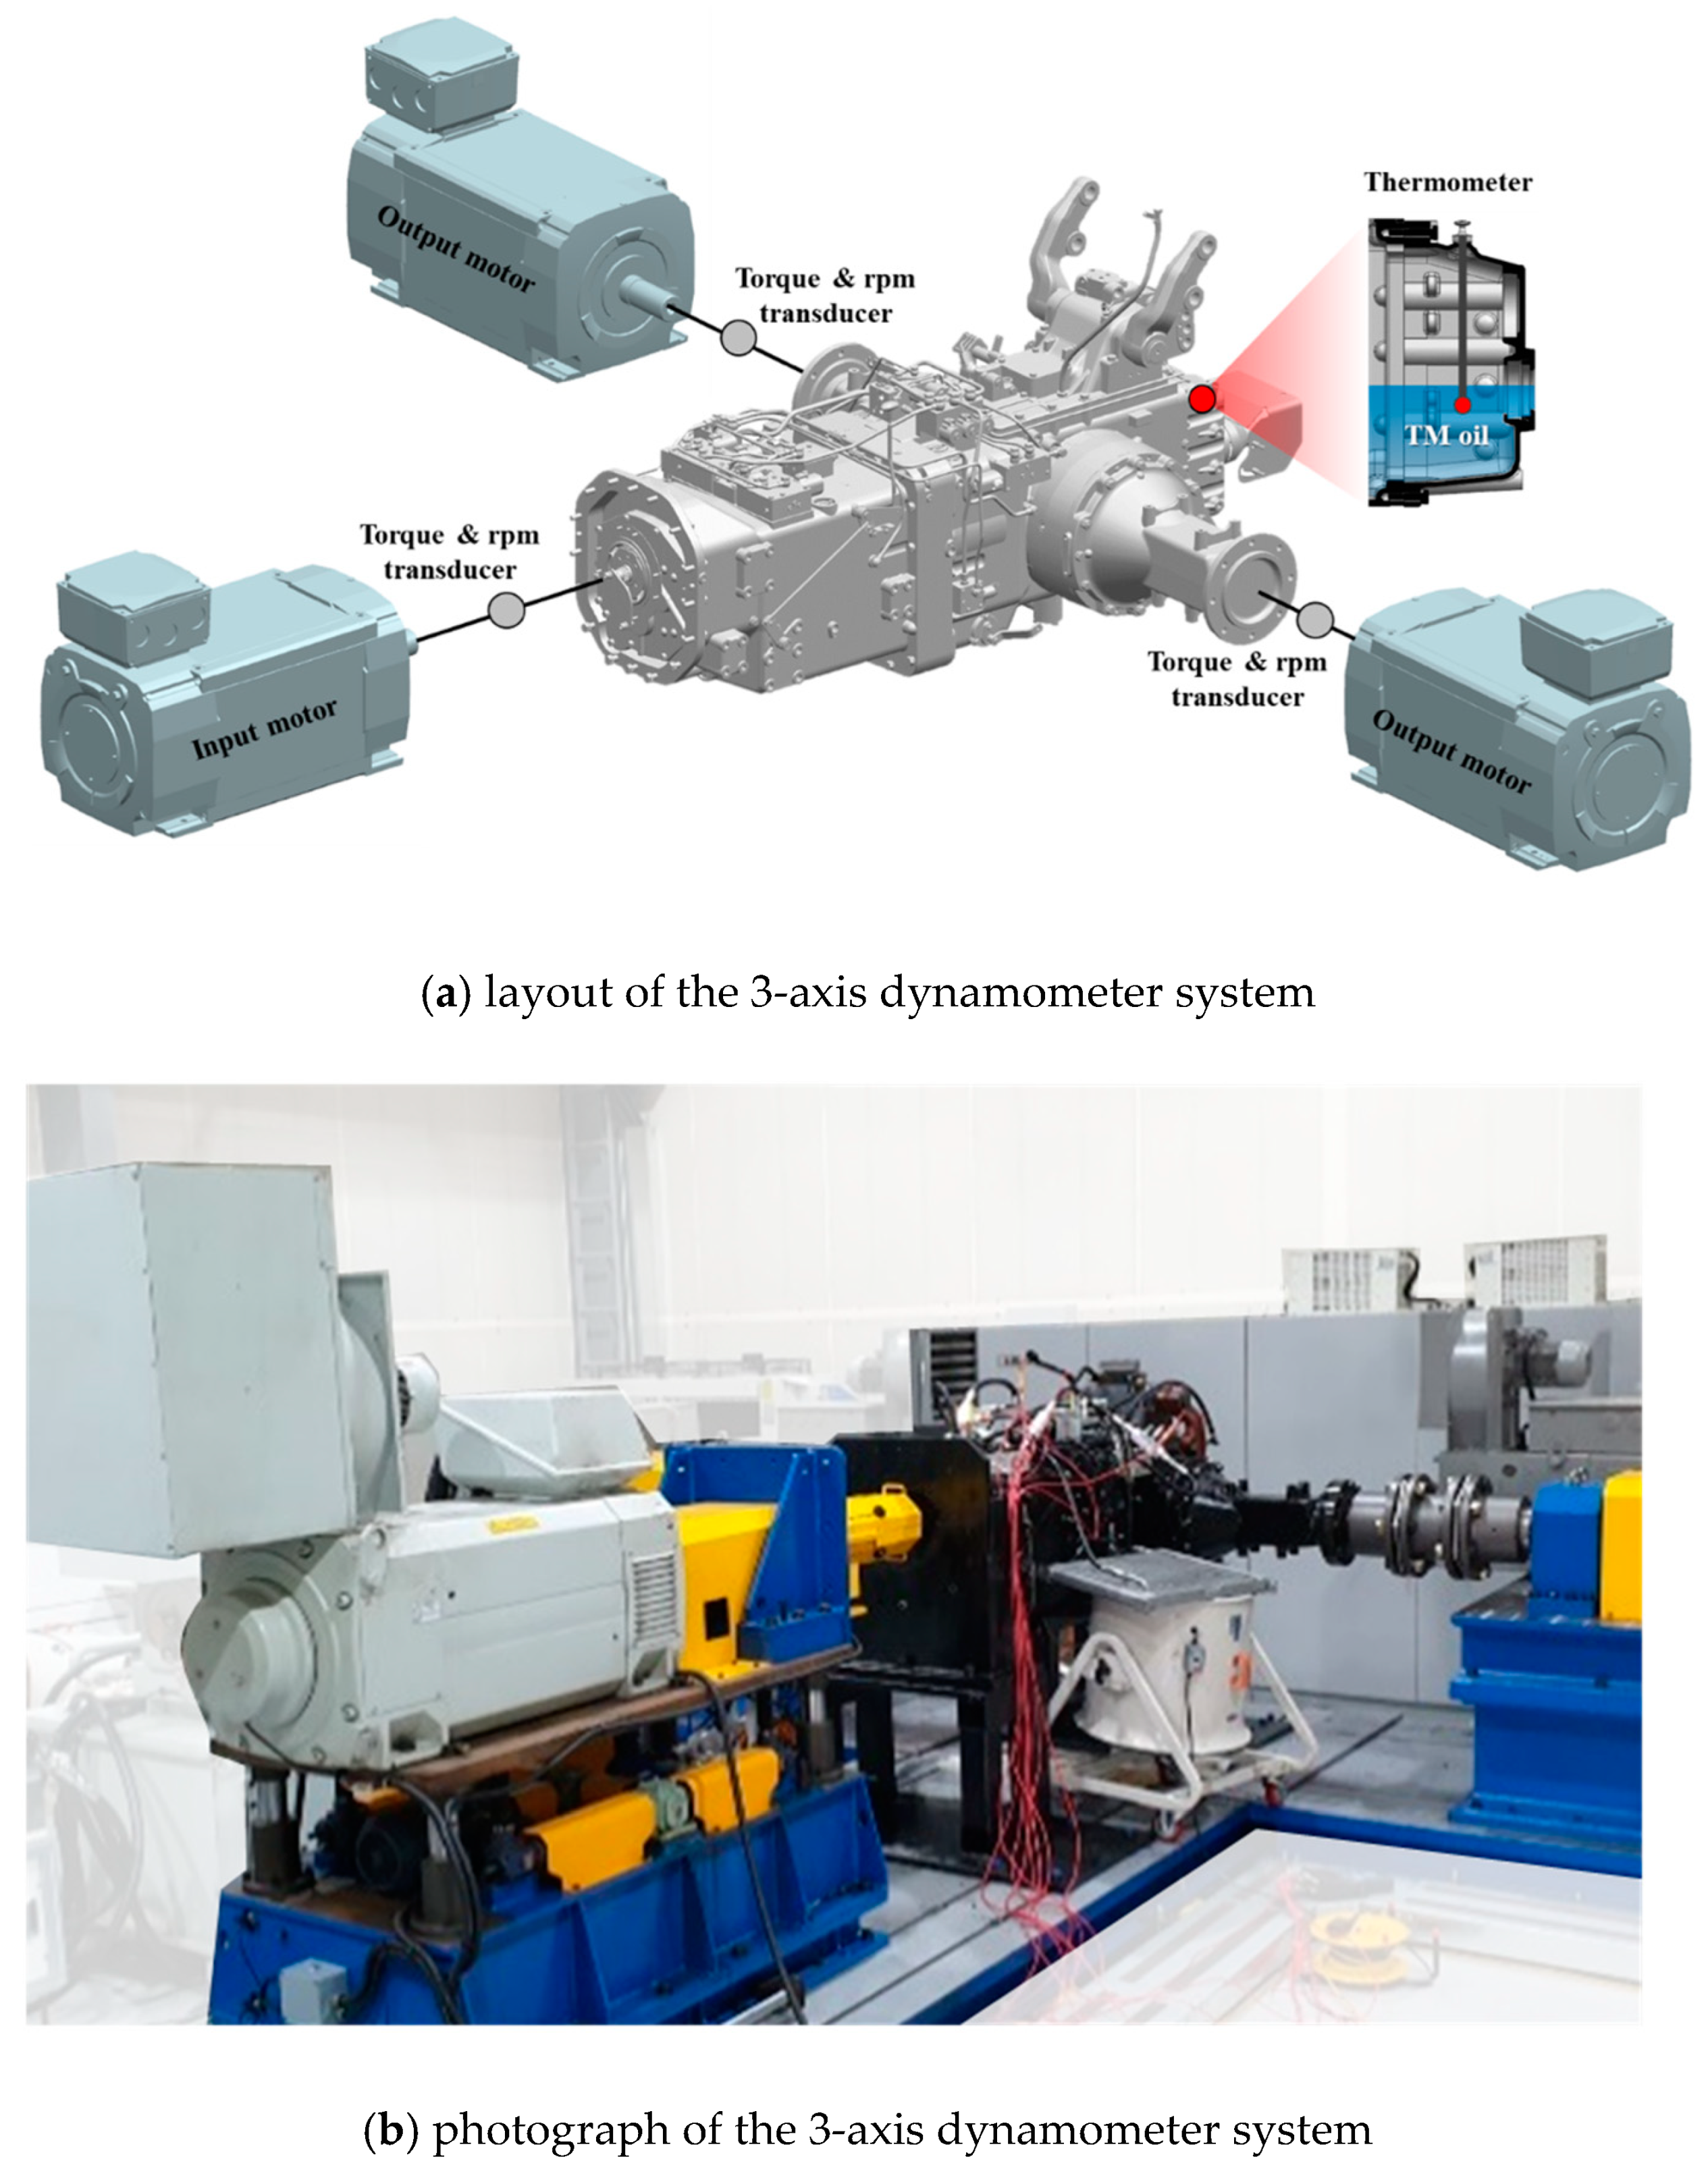
2.3. Power Loss Measurement of DCT

Figure 2 shows the system constructed for power loss measurement using a 3-axis dynamometer to control the rotation speed and torque. Sensors for measuring the rotation speed and torque are installed at the connection between the motor and the transmission to measure the input and output power. The input speed to the transmission is controlled at the input section, while the load applied to the transmission is controlled by controlling the torque at the output section. Additionally, a thermometer is installed inside the transmission system to monitor the oil temperature during the test. The test procedure is as follows. The speed of the input motor is slowly increased over 120 s from 0 to 2200 rpm. When the speed reaches 2200 rpm, the torque of the output motor is increased by 200 Nm to reach the target load level. While maintaining the target load for 1 min, the torque and rotation speed of the input and output sections are measured by the sensor. The oil temperature is maintained in the range of 50 to 90 °C, which is the normal operating temperature of the tractor. Motor and sensor specifications are shown in Table 2.
For the test, the input rotation speed was set to the engine’s rated rotation speed of 2200 rpm across all gear steps. The torque level applied to the transmission was determined separately for the two sections. In the max. traction force range, traction force was determined using the vehicle weight, with the engine’s output not fully utilized. In the rated engine power range, the engine’s rated output could be used, with the output torque of the rear axle decreasing as the vehicle speed increased. Figure 3 shows the test conditions, applying the wheel torque, vehicle speed, and input power at the rated rotation speed of the engine for the tractor used in this study. Tests were conducted in gear steps 2nd–24th, with the load conditions for each point shown in Figure 3.

3. Results

3.1. Theoretical Power Loss Calculations

Figure 4 shows the theoretical calculation results of the power loss based on the equations presented in Section 2.1. The horizontal axis represents the vehicle speed at the engine’s rated rotation speed for each gear step. For Case I and Case II, the total power loss can be calculated by adding the power loss of the DCT components, with power losses of less than 1 kW being combined and represented as a single item.
The components comprising the largest portion of overall power loss are the gears and bearings. Most of the load-dependent power loss occurs owing to the gears, the largest power loss occurring at 5.5 km/h for Cases I and II of 4.51 and 4.50 kW, respectively. As the vehicle speed increases at gear steps above 12 km/h, the speed-dependent power loss of the gears and bearings increases proportionally. Furthermore, the speed-dependent power loss of the gears and bearings is the highest at the top gear step of 40.2 km/h. In Case I, the speed-dependent power loss of the gears and bearings is 9.1 and 9.2 kW, respectively, while in Case II, it is 25.8 and 15.9 kW, respectively. The highest power loss occurs at the top speed of 40.2 km/h for both Cases I and II, with total power losses of 28.8 and 53.8 kW, respectively. This is because the speed-dependent power loss of each component is calculated to be higher in high-speed gear steps for Case II compared to Case I.
Figure 5 shows the power transmission efficiency calculated for Cases I and II. The power transmission efficiency for Cases I and II tends to increase as the vehicle speed increases in the max. traction force range (0–5.5 km/h) owing to the contribution of fundamental and load-dependent power losses relative to the total power. In the rated engine power range (5.5–40.2 km/h), the efficiency is maintained up to a speed of 11.1 km/h, but drops sharply as the speed increases in high-speed gear steps above 12.9 km/h. The maximum efficiency is 86.6% at 9.7 km/h for Case I and 87.6% at 7.3 km/h for Case II, while the minimum efficiency is calculated to be 70.4% for Case I and 44.7% for Case II at 40.2 km/h.

3.2. Experimental Studies of Power Loss

Figure 6 shows the measurement results of power loss for each gear step of the DCT obtained through lab tests.
As the vehicle speed increases, the power loss of the transmission tends to increase. The power loss is lowest at 1.8 km/h (10.16 kW), and highest at 40.2 km/h (60.06 kW). Conversely, at lower gear steps with low vehicle speeds, the efficiency increases as the speed increases, it being highest at 5.5 km/h (83.2%). At gear steps with vehicle speeds above 5.5 km/h, the efficiency tends to decrease as the speed increases, the efficiency being the lowest at 40.2 km/h (37.2%).

4. Discussion

Comparison between Theoretical Calculations and Experimental Studies

Figure 7 compares the theoretical calculations and experimental studies of the power losses for Cases I and II. The tendency for power loss to increase as vehicle speed increased is the same for both Cases I and II, but the absolute level of power loss differs more as the speed increases.
As shown in Figure 7a, in Case I the theoretical calculations tend to be higher than the test results. However, as the speed increases in the high-speed gear steps, the measured power loss increases; at 40.2 km/h, the measured power loss is 60.06 kW, while the calculated total power loss is 28.80 kW, the error being as much as 31.26 kW.
As shown in Figure 7b, in Case II the load-dependent power loss is similar to that of Case I, where the speed-dependent power loss increases rapidly with the vehicle speed. The maximum power loss is 47.21 kW at 40.2 km/h, and the total power loss is 53.79 kW, exhibiting an error of 12.85 kW compared to the experimentally measured power loss of 60.06 kW. That is, the power loss error in high-speed gear steps is smaller than that of Case I.
To analyze the effects of the oil level on load-dependent and speed-dependent power losses, the theoretical calculation results for the power loss in Cases I and II were compared, as shown in Figure 8.
Figure 8a shows the comparison of load-dependent power losses for Cases I and II, which are similar regardless of the oil levels. The load-dependent power loss is the highest at 5.5 km/h, corresponding to the fastest gear step in the max. traction force range for agricultural tractors.
Figure 8b compares the speed-dependent power losses for Cases I and II. For both cases, the speed-dependent power loss tends to increase with vehicle speed. However, a local peak value is evident at 3.6 km/h owing to the considerable influence of temperature on the speed-dependent power loss. In the tests of 3.1 km/h and 3.6 km/h, the oil temperatures were 69.3 °C and 50.7 °C, respectively, showing a difference of 18.6 °C. As a result of calculating viscosity by the ASTM D341 method, the kinematic viscosity of the oil is 33.2 cSt and 63.61 cSt, respectively, for the tests of 3.1 km/h and 3.6 km/h. As the viscosity increases, it can be seen that the drag torque increases and results in a larger speed-dependent power loss.
According to the results shown in Figure 8b, at vehicle speeds below approximately 11.1 km/h, the power loss in Case I is greater; conversely, at speeds above 14.8 km/h, the power loss in Case II is greater. The differences in power loss between Cases I and II in each speed range are related to the structural features of the DCT used in the study.
The DCT used in the study comprises a gear train made up of 58 gears to implement 24 gear shift stages. The gears in the forward/reverse and main shift parts—including the dual clutches—are in the front cell, while gears in the range shift part are in the mid cell. The vehicle speed range for the primary work of agricultural tractors is defined by the range shift part, the transmission used in this study being divided into 0–4.1 km/h (low-speed range), 4.7–12.9 km/h (mid-speed range), and 14.8–40.2 km/h (high-speed range) depending on the applicable gear ratio. Consequently, the gears in the range shift part have larger gear ratio differences than other gears, the speed deviation of idle gears that do not transmit power also being greater.
Figure 9 shows the average rotation speed and distribution of gears in the front and mid cells at the engine’s rated rotation speed. The gears in the front cell—which are closer to the engine—determine the forward/reverse direction and perform the role of primary reduction in the engine’s rotation speed. Consequently, their average rotation speed and deviation are similar. Therefore, the speed-dependent power loss of the gears in the front cell is not greatly affected by the vehicle speed.
By contrast, the rotation speed of the gears in the mid cell is similar to or lower than that of the gears in the front cell in the 1.8–12.9 km/h vehicle-speed range, the average rotation speed and deviation increasing sharply at speeds above 14.8 km/h compared to the gears in the front cell.
The rotation speed of the gears in the mid cell is more greatly influenced by driving speed than those in the front cell. Therefore, the speed-dependent power loss of the gears in the mid cell is affected by the driving speed, showing a similar tendency to the results shown in Figure 7b, where the speed-dependent power loss increases sharply at speeds above 14.8 km/h. Consequently, speed-dependent power loss has a greater impact on the components located in the front cell at low-speed gear steps and the mid cell at high-speed gear steps.
As in Case II of Figure 7b, when the oil level in the front cell is lowered and the oil level in the mid cell is raised, the speed-dependent power loss in the front cell decreases, reducing the total power loss at low speeds. Owing to the increased influence of speed-dependent power loss in the mid cell, the total power loss at high speeds increases. This trend is consistent with the test results, where power loss decreases at low speeds and increases sharply at high speeds.
Through this study, it was confirmed that the error between the theoretical calculation and the measured value of power loss was reduced by considering the oil level change caused by the oil circulation of the transmission. Therefore, in order to improve the efficiency of the transmission, the rotation speed of the internal components and the oil lubrication condition must be considered together. For example, gears with high rotation speeds should be located in positions that are not submerged in oil. Rotating components that are inevitably immersed in oil need to be designed with a small outer diameter and width to minimize power loss.

5. Conclusions

In this study, we calculated the power loss of an agricultural tractor DCT using the ISO standard and viscous fluid theory and measured the power loss of the DCT for each gear step using a 3-axis dynamometer measurement system. The calculated power loss and measurement results were compared and analyzed with the calculation results reflecting the oil levels considering the characteristics of the agricultural tractor DCT reviewed. The results of this study can be summarized as follows:
  • We calculated the power loss for each gear shift stage of a DCT applied to agricultural tractors using the ISO standard and the viscous fluid theory. The components accounting for the largest portion of the total power loss were the gears and bearings, with the efficiency calculated to be highest at 5.5 km/h, the fastest speed in the max. traction force range.
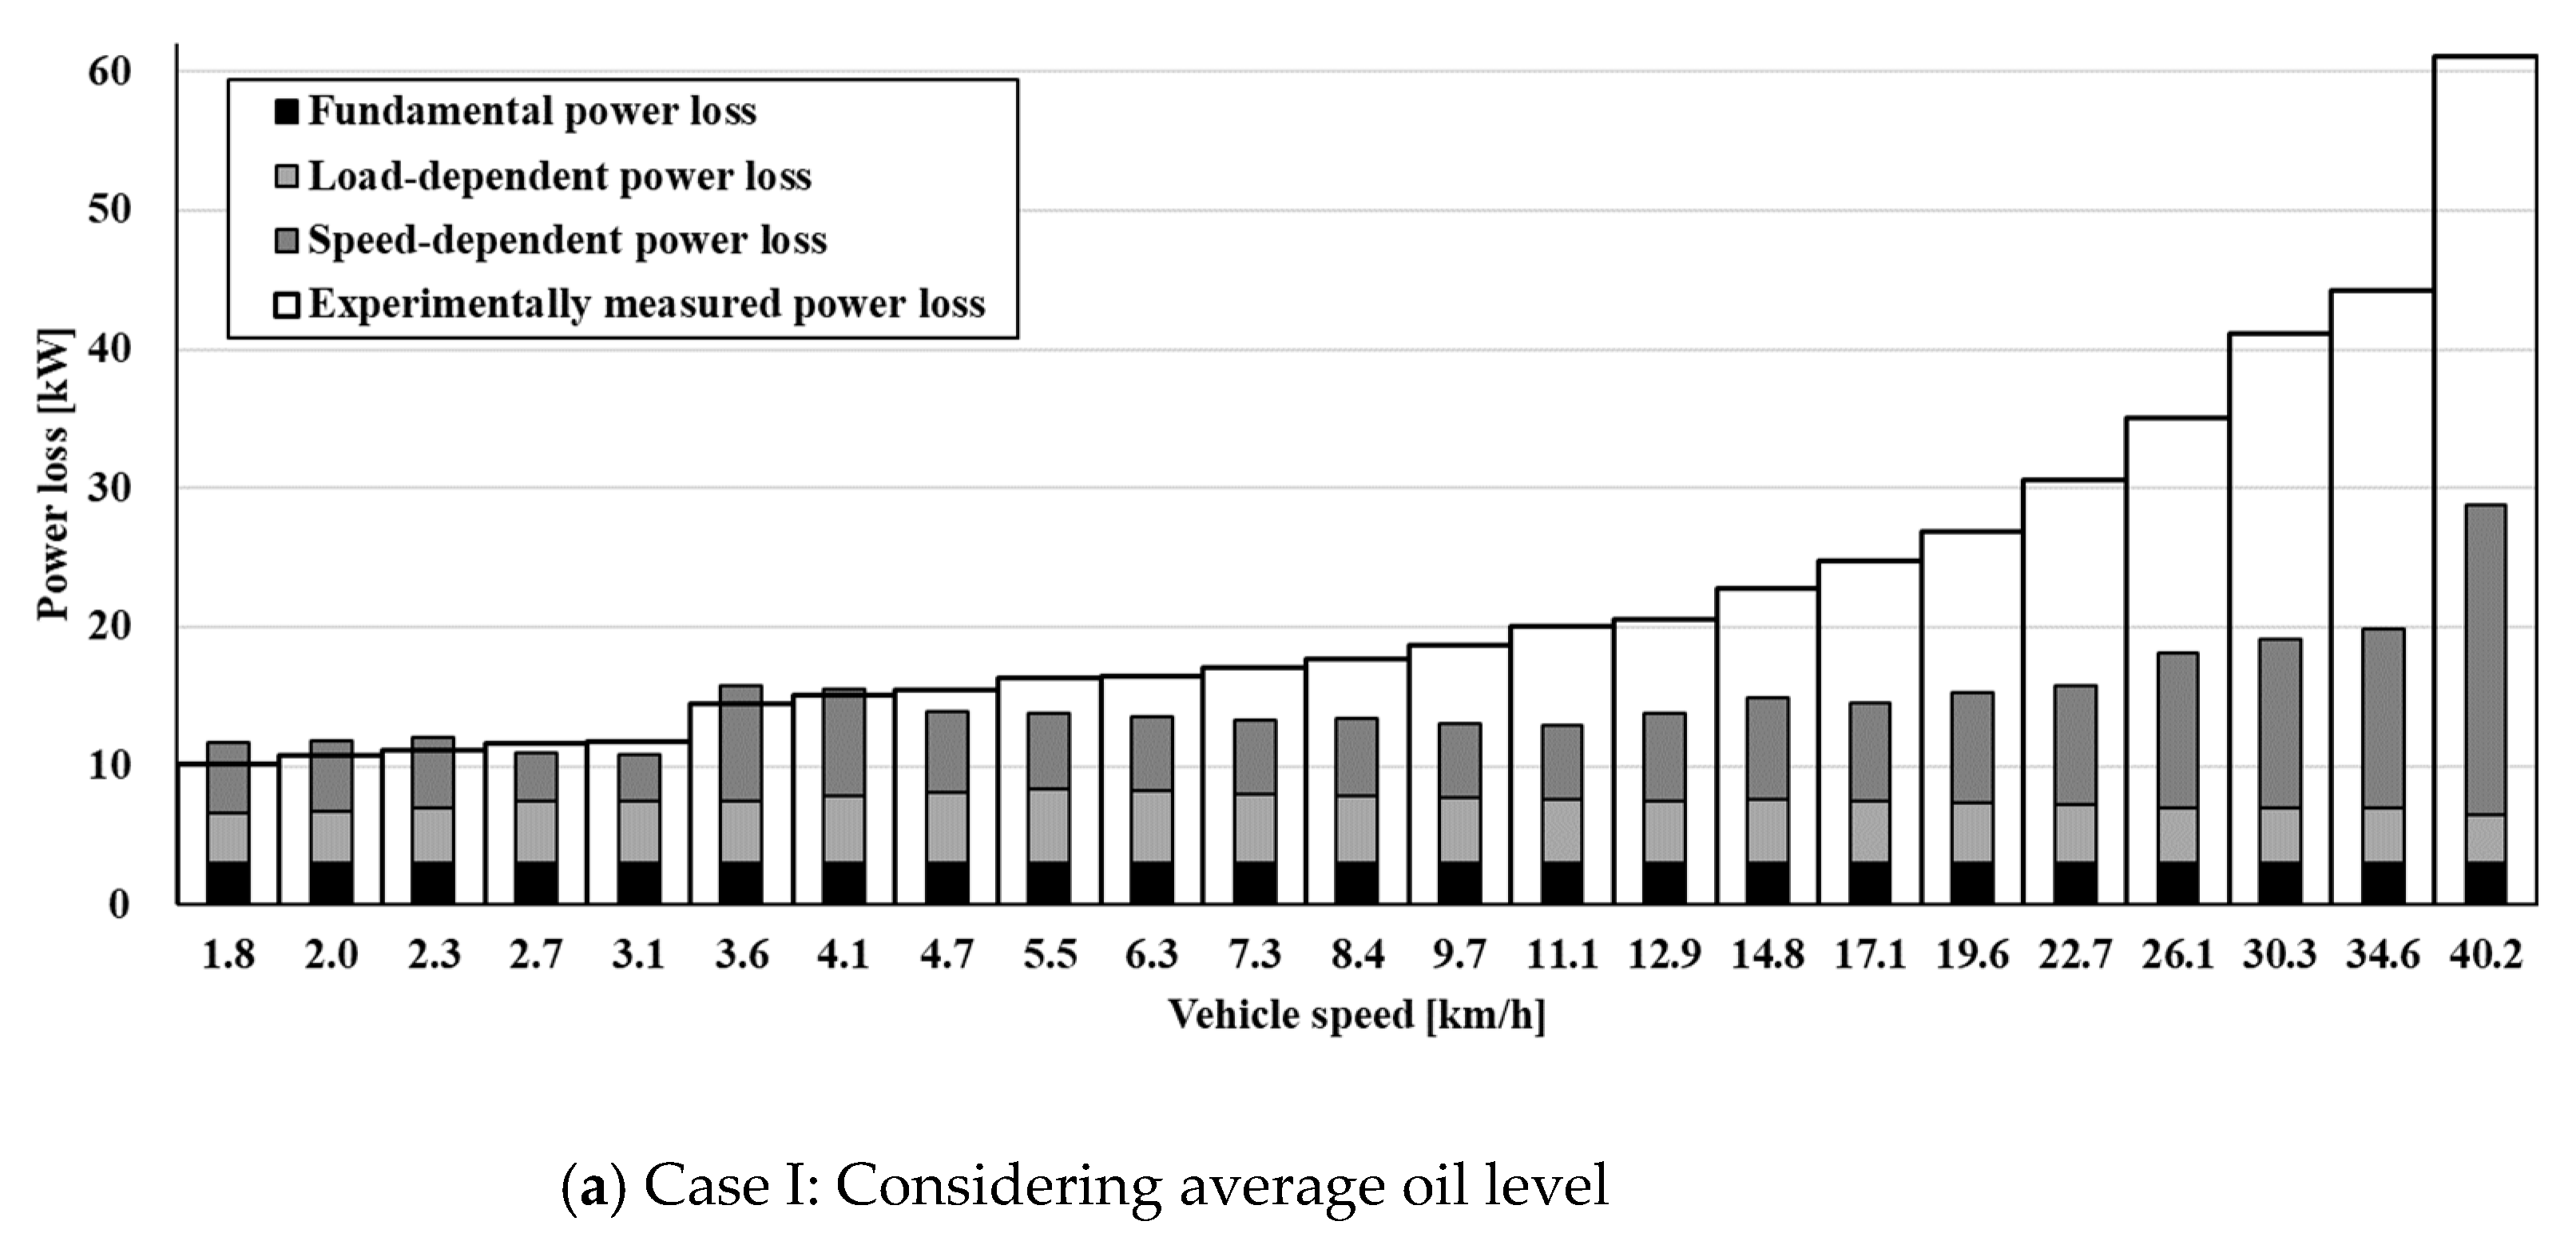
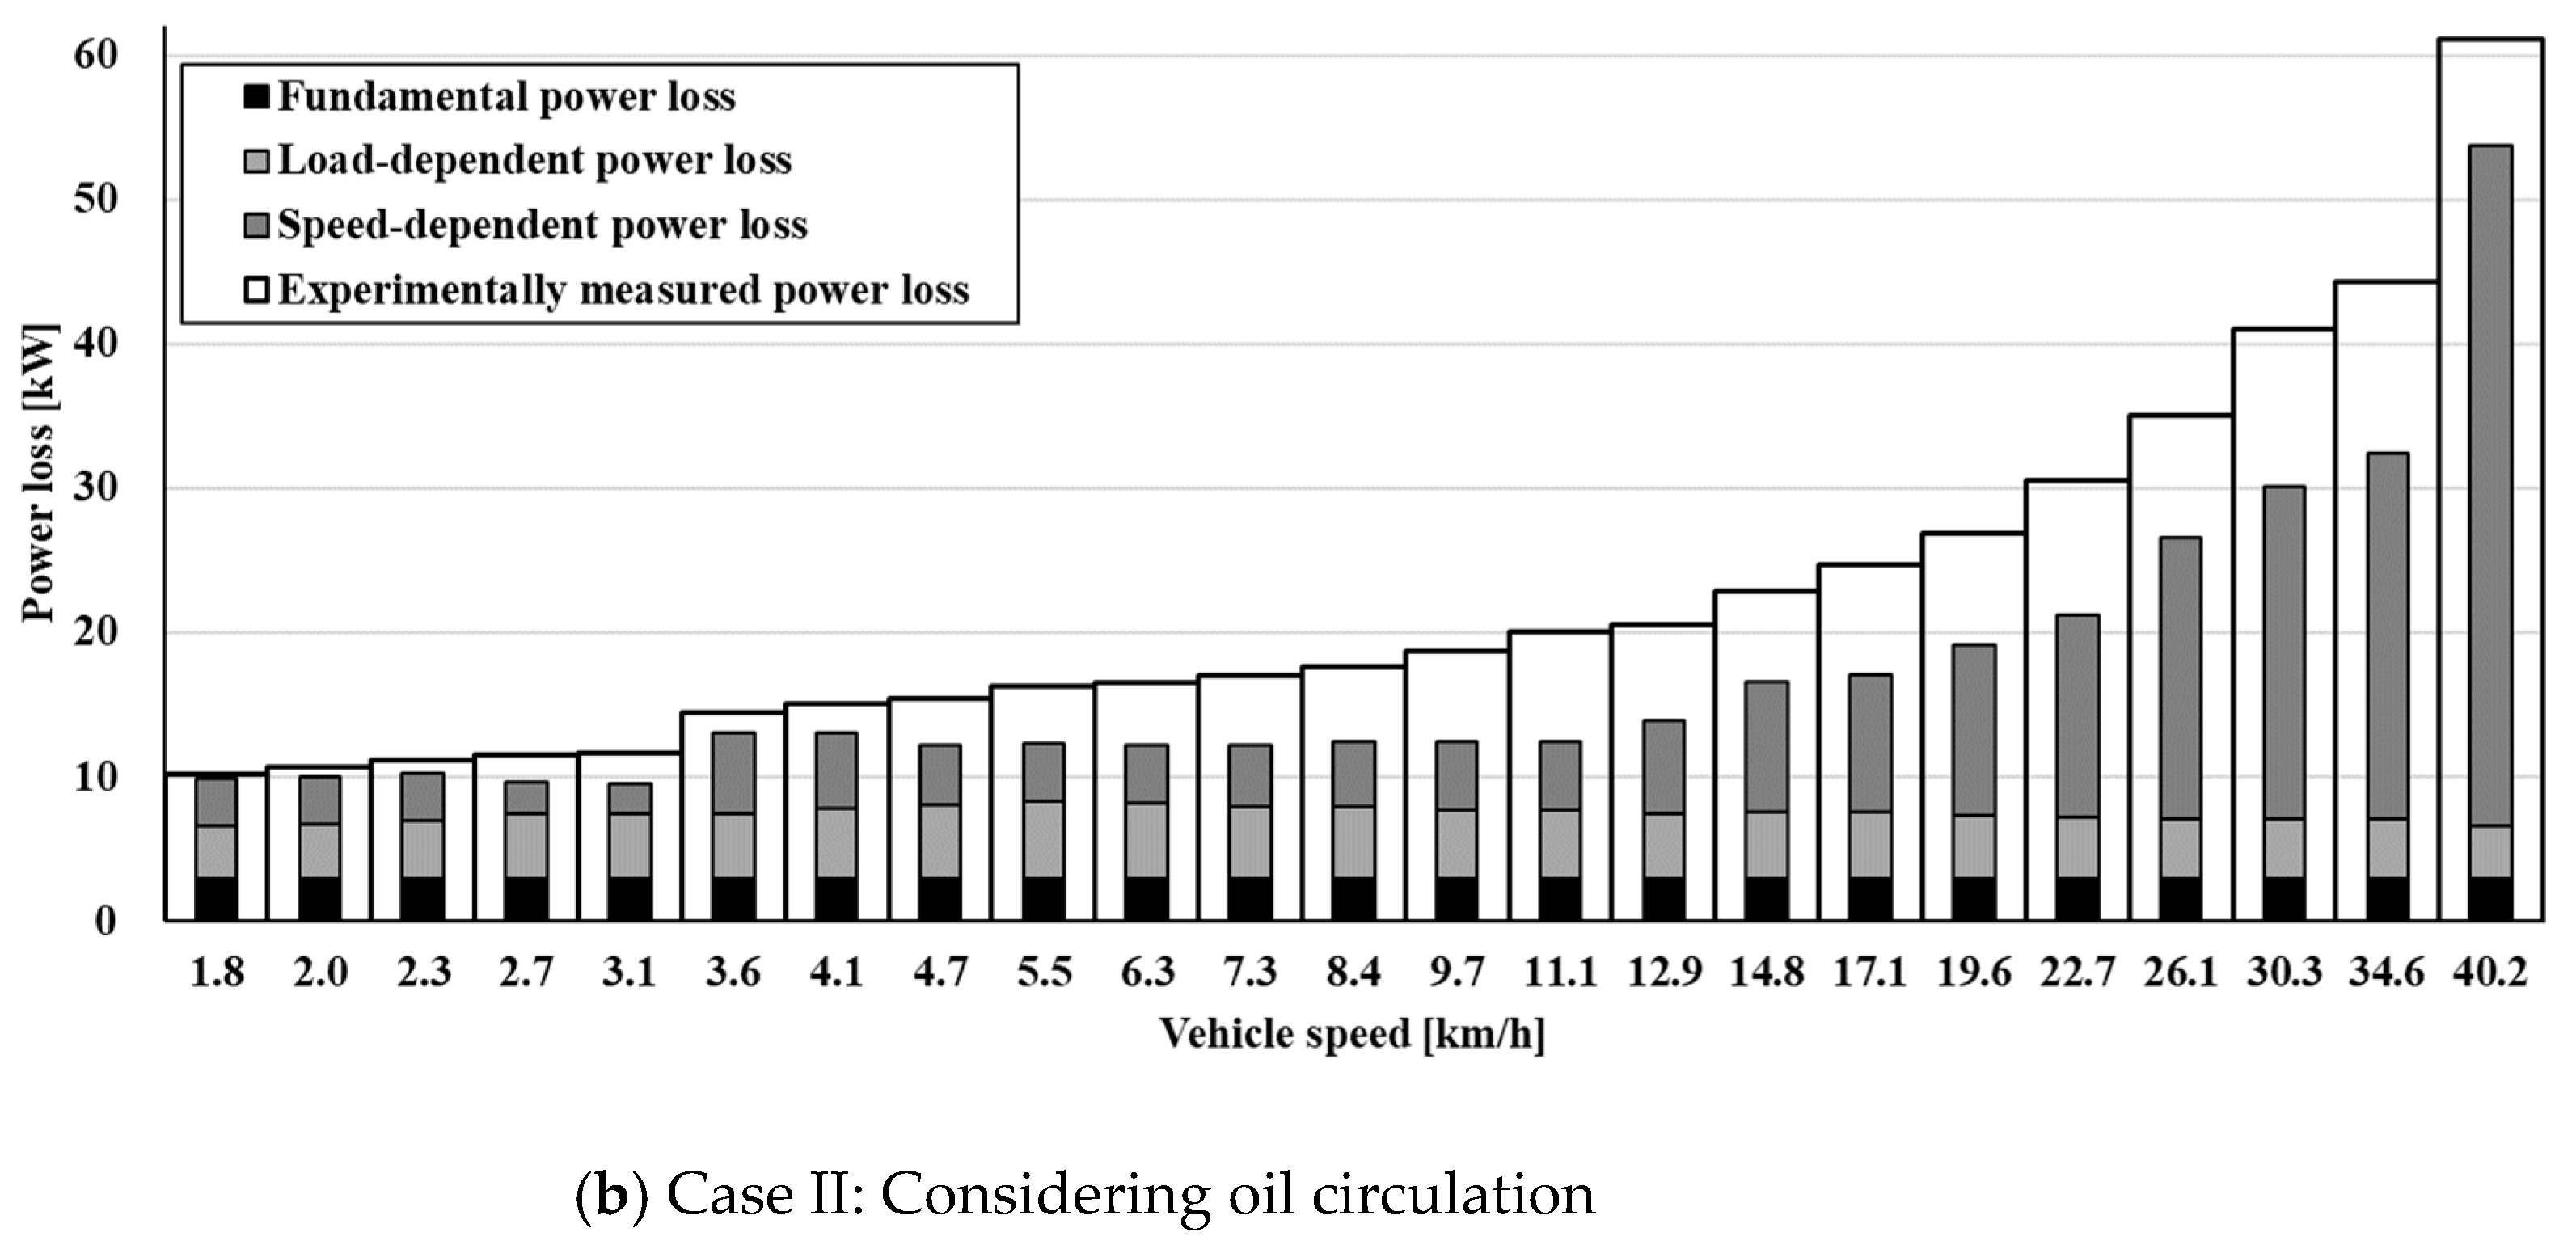
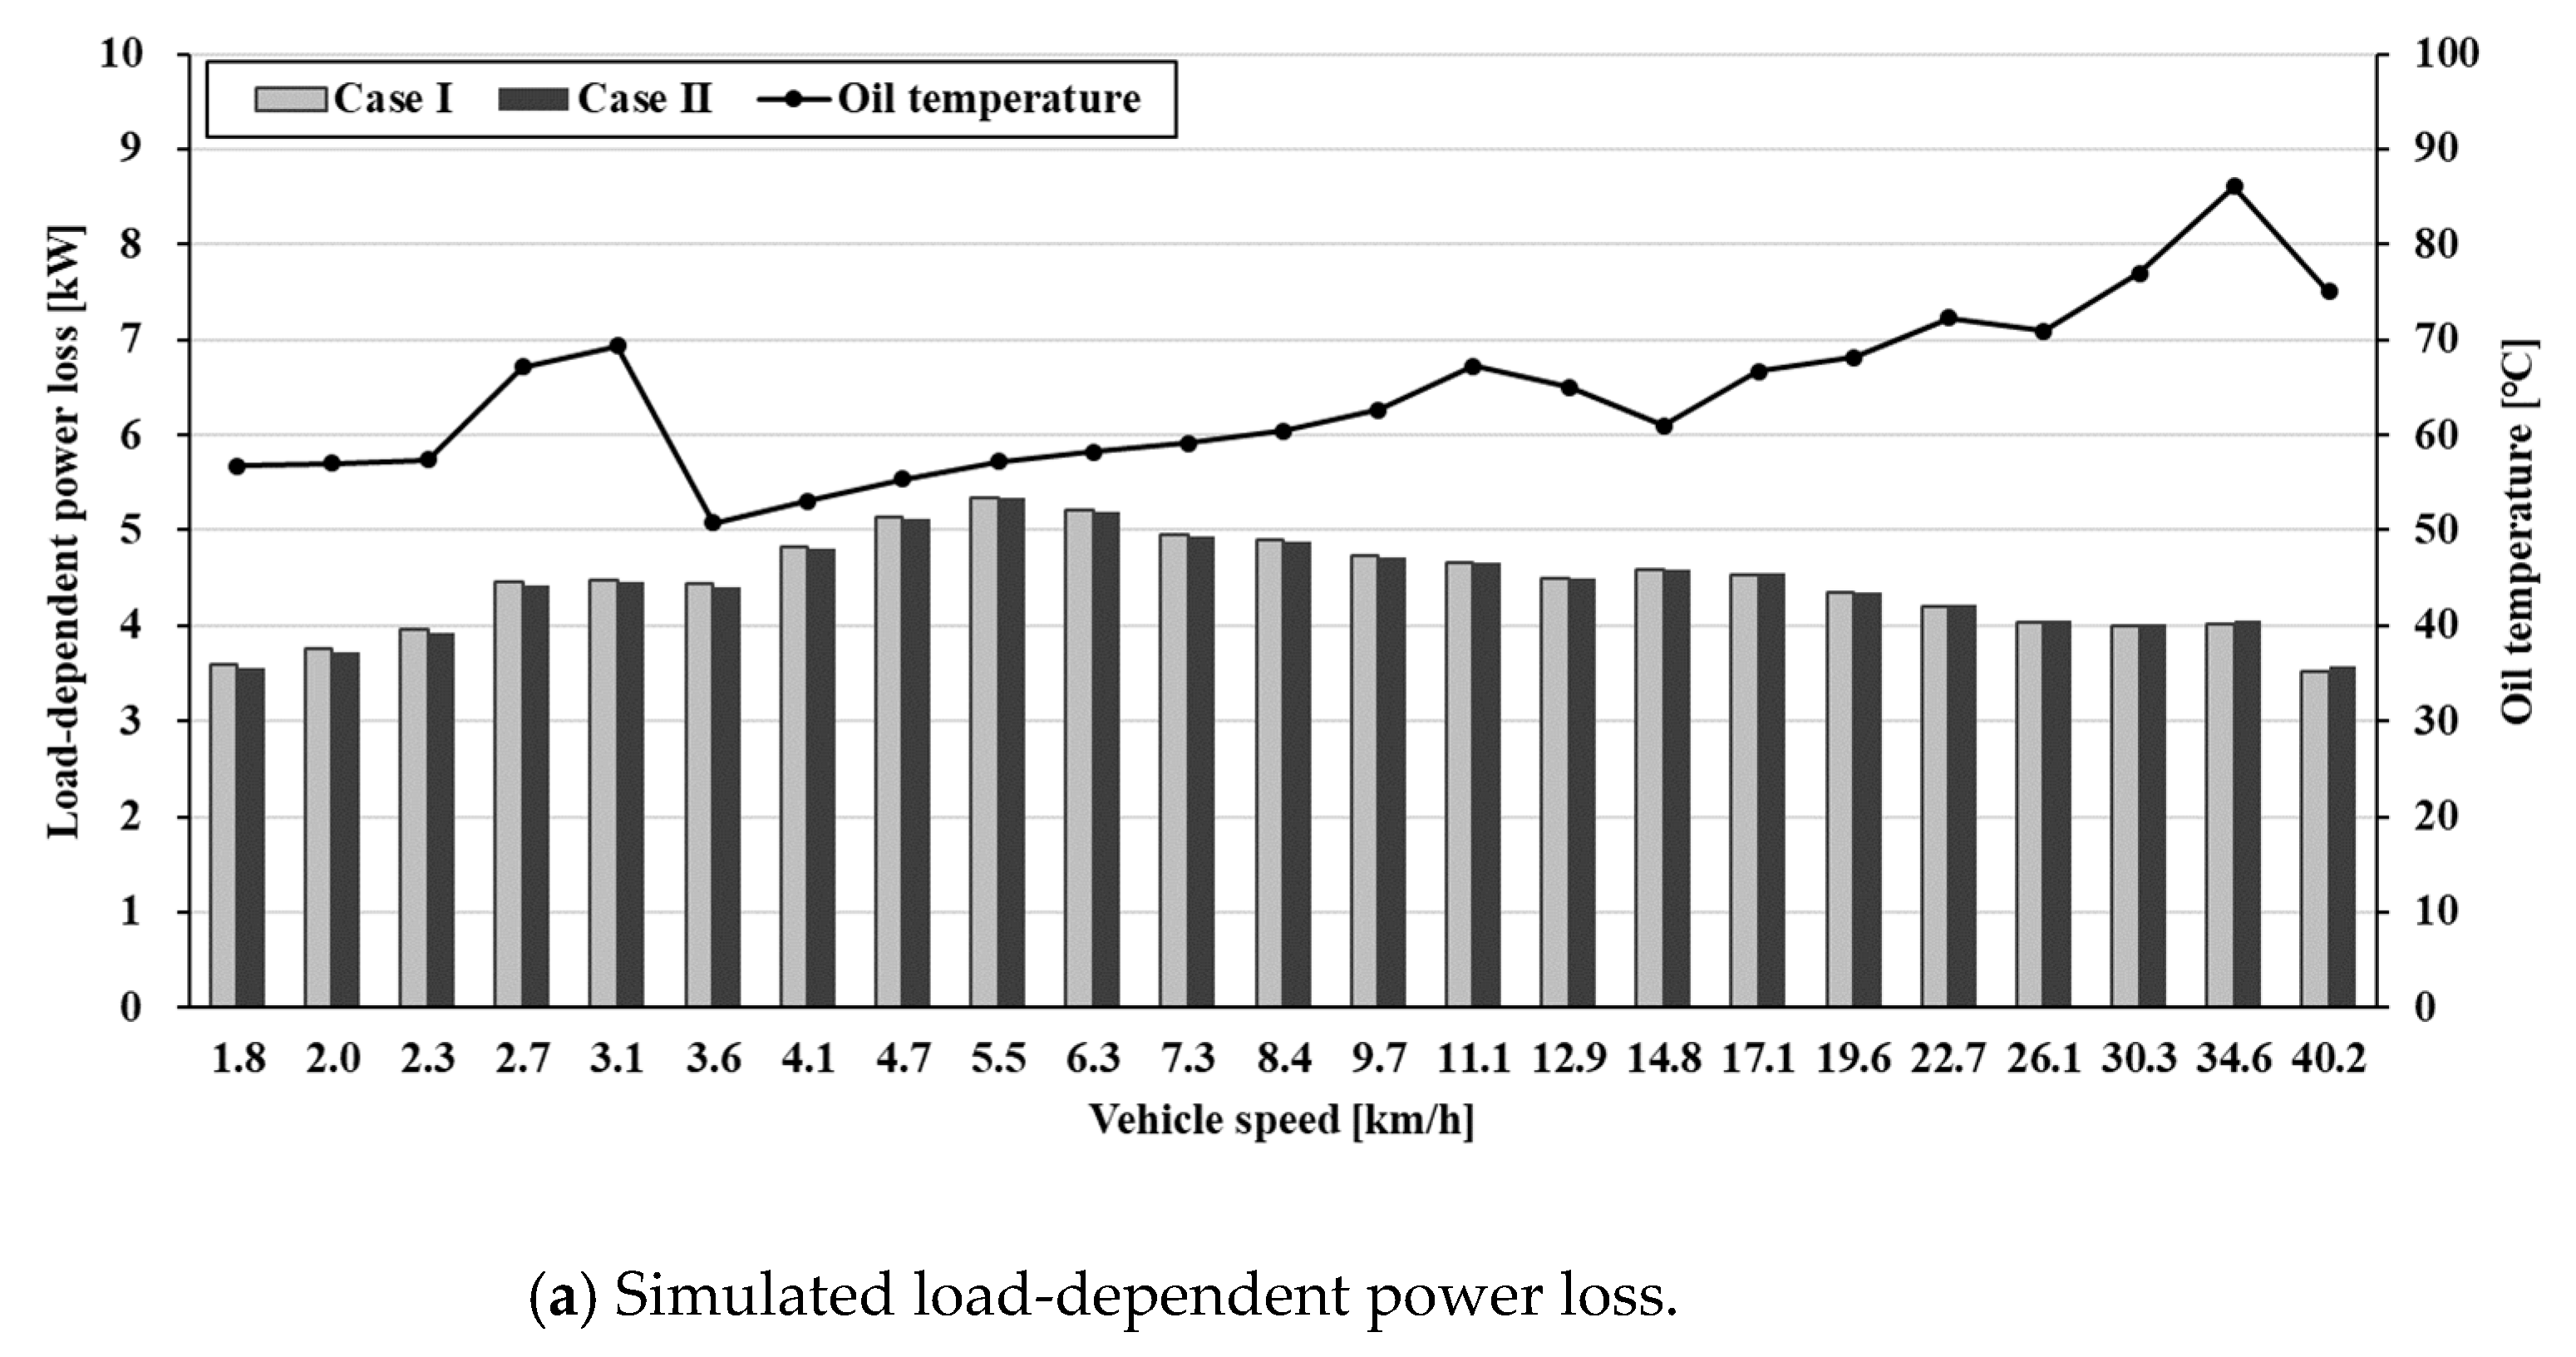
  • We confirmed that the theoretical calculation results of power loss in Case II were more consistent with the test results compared to Case I. Additionally, while the load-dependent power loss was not significantly affected by the oil level, the speed-dependent power loss was affected by the locally varying oil level owing to oil circulation.
  • The transmission components closer to the engine exhibited smaller speed deviations for each gear step, while the gears of the transmission components closer to the output shaft exhibited greater rotation speed and speed deviation between gears at higher gear steps. Owing to these driving characteristics, when the oil level in the cell closer to the output shaft rose, the power loss was lower at low-speed gear shift stages, while it increased sharply at high-speed gear steps.
  • Thus, we confirmed that, to predict the efficiency of agricultural transmissions, the oil level reflecting the transmission structure characteristics, oil circulation, and the operating characteristics of the transmission component—such as rotation speed and deviation—must be considered.

Author Contributions

Conceptualization, H.-J.A. and C.C.; methodology, H.-J.A. and S.-C.K.; investigation, Y.-J.P.; writing—original draft preparation, H.-J.A. and S.-C.K.; writing—review and editing, C.C. All authors have read and agreed to the published version of the manuscript.

Funding

This work was supported by the Technology Innovation Program (Development of common type dual-clutch transmission system and standardized control platform, No. 20011428), funded by the Ministry of Trade, Industry & Energy, Republic of Korea.

Institutional Review Board Statement

Not applicable.

Data Availability Statement

Not applicable.

Conflicts of Interest

The authors declare no conflict of interest.

Nomenclature

P L Total power loss, kW
P H P Fundamental power loss of the hydraulic pump, kW
P G L Load-dependent power loss of the gear, kW
P G S Speed-dependent power loss of the gear, kW
P B L Load-dependent power loss of the bearing, kW
P B S Speed-dependent power loss of the bearing, kW
P S Speed-dependent power loss of the shaft, kW
P C L Speed-dependent power loss of the clutch, kW
P B R Speed-dependent power loss of the brake, kW
f m Mesh coefficient of friction
M Mesh mechanical advantage
T 1 Pinion torque, Nm
n 1 Pinion rotation speed, rpm
β Operating helix angle/mean spiral angle, degrees
P G W 1 Gear windage and churning losses associated with smooth outside diameters, kW
P G W 2 Gear windage and churning losses associated with smooth sides of the disc, kW
P G W 3 Gear windage and churning losses associated with tooth surfaces, kW
f g Gear dip factor
ν Kinematic oil viscosity, m2/s
n Rotating speed, rpm
L Length of element for gearing windage and churning, mm
A g Arrangement constant
F Total face width, mm
R f Roughness factor for gear teeth
M 0 Load-independent frictional moment, Nm
M 1 Bearing load-dependent torque, Nm
M 2 Cylindrical roller bearing axial load-dependent moment, Nm
M 3 Frictional moment of seals, Nm
T C L Clutch torque loss, Nm
r a g Percentage value of the groove area to the friction material area
T f a Torque loss due to oil film in continuous section, Nm
T r a Torque loss due to oil film in ruptured section, Nm
T m Torque loss due to mist in ruptured section, Nm
r c Critical radius, m
r i Inner radius of the disk, m
r o Outer radius of the disk, m
N Number of friction surfaces
μ Fluid absolute viscosity, Pa⋅s
μ m i s Absolute viscosity of mist, Pa⋅s
Δ ω Difference in clutch rotation speed, rad/s
h Clearance between plate and disc, m
Φ Critical radius square, m2
α Angle of the area of brake caliper, rad

References

  1. Ueka, Y.; Yamashita, J.; Sato, K.; Doi, Y. Study on the development of the electric tractor: Specifications and traveling and tilling performance of a prototype electric tractor. Eng. Agric. Environ. Food 2013, 6, 160–164. [Google Scholar] [CrossRef]
  2. Vogt, H.H.; de Melo, R.R.; Daher, S.; Schmuelling, B.; Antunes, F.L.M.; dos Santos, P.A.; Albiero, D. Electric tractor system for family farming: Increased autonomy and economic feasibility for an energy transition. J. Energy Storage 2021, 40, 102744. [Google Scholar] [CrossRef]
  3. Moreda, G.P.; Muñoz-García, M.A.; Barreiro, P.J. High voltage electrification of tractor and agricultural machinery—A review. Energy Convers. Manag. 2016, 115, 117–131. [Google Scholar] [CrossRef]
  4. Martini, V.; Mocera, F.; Somà, A. Numerical Investigation of a Fuel Cell-Powered Agricultural Tractor. Energies 2022, 15, 8818. [Google Scholar] [CrossRef]
  5. Yang, H.; Sun, Y.; Xia, C.; Zhang, H. Research on Energy Management Strategy of Fuel Cell Electric Tractor Based on Multi-Algorithm Fusion and Optimization. Energies 2022, 15, 6389. [Google Scholar] [CrossRef]
  6. Hosseinzadeh-bandbafha, H.; Rafiee, S.; Ghobadian, B.; Mohammadi, P. Exergetic, economic, and environmental life cycle assessment analyses of a heavy-duty tractor diesel engine fueled with diesel–biodiesel-bioethanol blends. Energy Convers. Manag. 2021, 241, 114300. [Google Scholar] [CrossRef]
  7. Madovi, O.; Hoffrichter, A.; Little, N.; Foster, S.N.; Isaac, R. Feasibility of hydrogen fuel cell technology for railway intercity services: A case study for the Piedmont in North Carolina. Railw. Eng. Sci. 2021, 29, 258–270. [Google Scholar] [CrossRef]
  8. Bergthorson, J.M. Recyclable metal fuels for clean and compact zero-carbon power. Prog. Energy Combust. Sci. 2018, 68, 169–196. [Google Scholar] [CrossRef]
  9. Kim, W.-S.; Kim, Y.-J.; Kim, Y.-S.; Baek, S.-M.; Baek, S.-Y.; Lee, D.-H.; Nam, K.-C.; Kim, T.-B.; Lee, H.-J. Development of Control System for Automated Manual Transmission of 45-kW Agricultural Tractor. Appl. Sci. 2020, 10, 2930. [Google Scholar] [CrossRef] [Green Version]
  10. Kim, J.; Lee, H. Motor position control algorithm for an automated manual transmission of the agricultural tractor. Proc. Inst. Mech. Eng. Part C J. Mech. Eng. Sci. 2015, 229, 3341–3349. [Google Scholar] [CrossRef]
  11. Brenninger, M.M. Fendt Vario CVT in Agricultural Tractors. SAE Tech. Pap. 2007. [CrossRef]
  12. Tanelli, M.; Panzani, G.; Savaresi, S.M.; Pirola, C. Transmission control for power-shift agricultural tractors: Design and end-of-line automatic tuning. Mechatronics 2011, 21, 285–297. [Google Scholar] [CrossRef]
  13. Pahlovy, S.A.; Mahmud, S.F.; Kubota, M.; Ogawa, M.; Takakura, N. Prediction of Drag Torque in a Disengaged Wet Clutch of Automatic Transmission by Analytical Modeling. Tribol. Online 2016, 11, 121–129. [Google Scholar] [CrossRef] [Green Version]
  14. Yuan, Y.; Liu, E.A.; Hill, J.; Zou, Q. An Improved Hydrodynamic Model for Open Wet Transmission Clutches. J. Fluids Eng. 2007, 129, 333–337. [Google Scholar] [CrossRef]
  15. Shen, Y.; Liu, Z.; Rinderknecht, S. Modelling of Power Losses of Transmission Synchronizers in Neutral Position. SAE Tech. Pap. 2018. [CrossRef]
  16. Fernandes, C.M.; Marques, P.M.; Martins, R.C.; Seabra, J.H. Gearbox power loss. Part I: Losses in rolling bearings. Tribol. Int. 2015, 88, 298–308. [Google Scholar] [CrossRef]
  17. Seetharaman, S.; Kahraman, A.; Moorhead, M.D.; Petry-Johnson, T.T. Oil Churning Power Losses of a Gear Pair: Experiments and Model Validation. J. Tribol. 2009, 131, 022202. [Google Scholar] [CrossRef]
  18. Hu, X.; Jiang, Y.; Luo, C.; Feng, L.; Dai, Y. Churning power losses of a gearbox with spiral bevel geared transmission. Tribol. Int. 2019, 129, 398–406. [Google Scholar] [CrossRef]
  19. Diab, Y.; Ville, F.; Velex, P. Prediction of Power Losses Due to Tooth Friction in Gears. Tribol. Trans. 2006, 49, 260–270. [Google Scholar] [CrossRef]
  20. Fernandes, C.M.; Marques, P.M.; Martins, R.C.; Seabra, J.H. Gearbox power loss. Part II: Friction losses in gears. Tribol. Int. 2015, 88, 309–316. [Google Scholar] [CrossRef]
  21. Vacca, F.; De Pinto, S.; Karci, A.E.H.; Gruber, P.; Viotto, F.; Cavallino, C.; Rossi, J.; Sorniotti, A. On the Energy Efficiency of Dual Clutch Transmissions and Automated Manual Transmissions. Energies 2017, 10, 1562. [Google Scholar] [CrossRef] [Green Version]
  22. Habermehl, C.; Jacobs, G.; Neumann, S. A modeling method for gear transmission efficiency in transient operating conditions. Mech. Mach. Theory 2020, 153. [Google Scholar] [CrossRef]
  23. Strapasson, L.; Zimmermann, G.G.; Jasper, S.P.; Savi, D.; Sobenko, L.R. Energy efficiency of agricultural tractors equipped with continuously variable and full powershift transmission systems. Eng. Agrícola 2022, 42. [Google Scholar] [CrossRef]
  24. Molari, G.; Sedoni, E. Experimental evaluation of power losses in a power-shift agricultural tractor transmission. Biosyst. Eng. 2008, 100, 177–183. [Google Scholar] [CrossRef]
  25. Moon, S.P.; Moon, S.G.; Kim, J.S.; Sohn, J.H.; Kim, Y.J.; Kim, S.C. Transmission efficiency of dual-clutch transmission in agricultural tractors. J. Drive Control 2022, 19, 43–50. [Google Scholar]
  26. ISO/TR 14179-1; Gears-Thermal Capacity-Part 1: Rating Gear Drives with Thermal Equilibrium at 95 °C Sump Temperature. International Standard: Geneva, Switzerland, 2001.
  27. Park, K.; Kang, M.; Lee, J.; Son, W.C.; Harianto, J.; Kahraman, A. Development of an Analysis Program to Predict Efficiency of Automotive Power Transmission and Its Applications. SAE Tech. Pap. 2018. [CrossRef]
Figure 1. Oil levels of a dual-clutch transmission (DCT) in full-power shift.
Agriculture 13 01225 g001
Figure 2. Power loss measurement system.
Agriculture 13 01225 g002
Figure 3. Input load conditions for experimental studies.
Agriculture 13 01225 g003
Figure 4. Theoretical calculation results of the power losses.
Agriculture 13 01225 g004
Figure 5. Power transmission efficiencies obtained by theoretical calculation.
Agriculture 13 01225 g005
Figure 6. Power loss measurement results of the DCT.
Agriculture 13 01225 g006
Figure 7. Comparison between calculations and measurements of the power loss.
Agriculture 13 01225 g007aAgriculture 13 01225 g007b
Figure 8. Power loss analysis results.
Agriculture 13 01225 g008aAgriculture 13 01225 g008b
Figure 9. Rotation speed variation of each gear step.
Agriculture 13 01225 g009
Table 1. Composition of the total power loss.
Power LossComponent
Fundamental power loss Hydraulic   pump   [ P H P ]
Load-dependent power loss Gear   [ P G L ] ,   Bearing   [ P B L ]
Speed-dependent power loss Gear   [ P G S ] ,   Bearing   [ P B S ] ,   Clutch   [ P C L ] ,
Shaft   [ P S ] ,   Brake   [ P B R ]
Table 2. Specifications of sensor and motor applied to 3-axis dynamometer.
ComponentSpecifications
Input motorRated voltage: 360 V, rated speed: 3090 rpm, rated power: 282 kW
Output motorRated voltage: 360 V, rated speed: 1800 rpm, rated power: 246 kW
Torque and rpm sensorNominal torque: 30 kNm, nominal rotational speed: 4000 rpm
Magnetic rotational speed measuring system: 1024 pulses/revolution
Disclaimer/Publisher’s Note: The statements, opinions and data contained in all publications are solely those of the individual author(s) and contributor(s) and not of MDPI and/or the editor(s). MDPI and/or the editor(s) disclaim responsibility for any injury to people or property resulting from any ideas, methods, instructions or products referred to in the content.

