Article

Improvement in Wheat Productivity with Integrated Management of Beneficial Microbes along with Organic and Inorganic Phosphorus Sources

1
Department of Agronomy, The University of Agriculture, Peshawar 25130, Pakistan
2
Department of Soil and Environmental Sciences, The University of Agriculture, Peshawar 25130, Pakistan
*
Author to whom correspondence should be addressed.
Agriculture 2023, 13(6), 1118; https://doi.org/10.3390/agriculture13061118
Submission received: 1 May 2023 / Revised: 22 May 2023 / Accepted: 23 May 2023 / Published: 25 May 2023
(This article belongs to the Special Issue Beneficial Microorganisms and Crop Production)

Abstract

:
Phosphorus (P) unavailability in agricultural soils is a primary cause of the poor development and yield of field crops in arid and semiarid regions. The primary goal of this research project was to investigate the influence of integrated management of beneficial microbes or biofertilizers (BF), organic P-fertilizers, and inorganic P-fertilizers on wheat productivity in a wheat–maize cropping system. Field experiments were carried out during the two consecutive seasons of 2020/2021 (Y1) and 2021/2022 (Y2) according to the two-factorial randomized complete block design with three replications. Factor one consisted of twenty-one treatments of organic and inorganic P-fertilizer combinations, while factor two consisted of two different BF (PSB and Bioaab). One overall control where no P or BF was applied was also included in each replication for comparison. The experiment consisted of six treatments of sole P sources (sheep manure (SM), cattle manure (CM), legume residues (LR), non-legume residues (NLR), single super phosphate (SSP) and rock phosphate (RP)), each applied at a rate of 90 kg P ha−1. Different combinations of organic and inorganic P sources (giving 15 treatments) were applied at a rate of 50% P from each source (i.e., 45 kg P ha−1 applied from different sources in combination). The results revealed that the combined application of SSP+SM produced a significantly higher number of grains spike−1 (23.9%), spikes m−2 (4.5%), and grain yield (40.9%) over the control. Application of PSB produced the maximum number of grains spike−1 (23.9%), spikes m−2 (4.5%), thousand-grain weight (8.3%), grain yield (40.9%), and biological yield (17%) in the wheat crop as compared to Bioaab. It was concluded from the two-year study that integrated use of organic P-fertilizers (animal manures) plus inorganic P-fertilizer (SSP) along with PSB ranked first in terms of higher wheat productivity in a wheat–maize cropping system.

1. Introduction

Wheat (Triticum aestivum L.) is a staple cereal crop that fulfills the basic nutritional requirements of people worldwide [1]. It is a reliable supply of both human food and animal feed. Pakistan total area under wheat cultivation was 8,825,000 hectares with a total production of 24.946 million tons, while in Khyber Pakhtunkhwa total production was 1.260 million tons from an area of 0.732 million hectares [2]. Despite having appropriate climatic condition for wheat production, the achieved yield is still quite low when compared to other countries.
Phosphorus (P) is an essential nutrient required for plant growth [3,4]. Chemical fertilizers are the primary source of P, which promotes crop growth and development [5,6]. When P fertilizer is applied, the soil is able to rapidly and effectively absorb a significant quantity of P from the soil solution. When P is adsorbed, it becomes unavailable to plants. When P is applied to the soil, only a small portion is taken up by plants; the rest is either permanently or temporarily fixed in forms with variable plant availability [7,8]. Soils with high pH and Ca content reduce P availability to plants [9,10,11]. Phosphate fertilizer can only move three to five centimeters in soil. Pakistan’s soils are alkaline and predominantly calcareous, and P fixation is a major issue in these soils.
Biofertilizers contain the living cells of various beneficial microorganisms. When these microorganisms are applied to a seed, plant, or soil, they colonize the rhizosphere or the interior of the plant. This helps the plant develop by converting essential nutrients (especially P) into a form that it can utilize easily [12,13]. Biofertilizers contain beneficial microorganisms that enhance plant growth and protect them from pests and diseases [12]. PSB are bacteria that aid in transforming solid P into a simple and soluble form [13]. According to Marimuthu et al. [14], they help make more P available in the soil by degrading organic P and making synthetic P more soluble. According to Timofeeva et al. [15], soil microbes that can break down complex compounds into simpler ones are crucial.
Plants are fed with both inorganic and organic nutrient sources [16]. Organic sources improve soil organic matter and increase nutrient availability to plants [17]. When synthetic sources of P are mixed with natural sources (organic manures), the soil P mobilization and availability to plants are enhanced [15]. P is solubilized and rendered accessible to plants by promoting microbial activity and producing organic acids in rhizospheres [18]. FYM and PM are common organic manure substitutes for commercial fertilizers used in crop production [19]. Animal wastes such as sheep dung, poultry manure, and cattle manure are produced in large quantities in Pakistan each year and distributed on agricultural land. According to estimates, FYM can provide around 1.5 million tons of fertilizers for our country’s agriculture.
Organic manures have a long-lasting residual impact on the soil because they release nutrients gradually [20]. After being substantially depleted by intensive farming techniques, the soil’s fertility can be restored through adequate organic fertilization [21]. Organic manure has more of the major necessary nutrients (N, P and K) in plant-usable forms, and it also contains these minerals in greater proportions. However, commercial fertilizers are widely used in farming communities in place of organic manures due to their broad availability. According to [22], the main disadvantages of chemical fertilizers are their high cost, unavailability, and constant release of chemicals into the environment (nitrogen in the case of denitrification and phosphorus in the case of eutrophication). As a result, the use of chemical fertilizers destroys the land while also hurting the ecology [23]. To address these concerns, environmentally friendly and sustainable farming practices, including integrated nutrient management (INM), are required, which can only be accomplished by combining the use of chemical, organic, and biofertilizers.
Phosphate-solubilizing bacteria (PSB) have been shown to be active in the conversion of insoluble phosphate into soluble primary and secondary orthophosphate ions, and biological P provision is a viable option. Soil microorganisms’ ability to provide phosphates to the soil for plant growth is particularly promising [24,25]. PSB can improve plant growth by solubilizing phosphates that have accumulated [17]. They are found in soil, albeit not in sufficient quantities in a plant’s rhizosphere. To benefit from phosphate solubilization for increased plant production, plants must be infected with a target microbe at a concentration greater than that present in soil [26]. As a result, multiple studies have found that PSB inoculation boosted the growth, yield, and P uptake in a variety of crops [27]. The release of low-molecular-weight organic acids such as carboxylic acid, gluconic acid, 2-kitogluconic acid, and glyoxylic acid lowers the pH of the rhizosphere, causing bound forms of phosphate such as Ca3 (PO4)2 in calcareous soils to dissociate via their hydroxyl and carboxyl groups [28]. On a global scale, researchers are looking at the ability of microbial inoculants to mobilize immobilized P and so boost a plant’s capacity for absorbing P. Phosphate-solubilizing bacteria can increase P solubility by increasing the rate of hydrolytic cleavage and freeing bound organic phosphates [28,29].
Low P availability and less organic matter in soils are two of the key factors limiting wheat productivity in Pakistan, particularly in Khyber Pakhtunkhwa. Therefore, the aim of this study was to investigate the effect of combined application of BF, organic P and inorganic P on the wheat productivity in wheat–maize cropping systems in the semiarid climate of Peshawar.

2. Materials and Methods

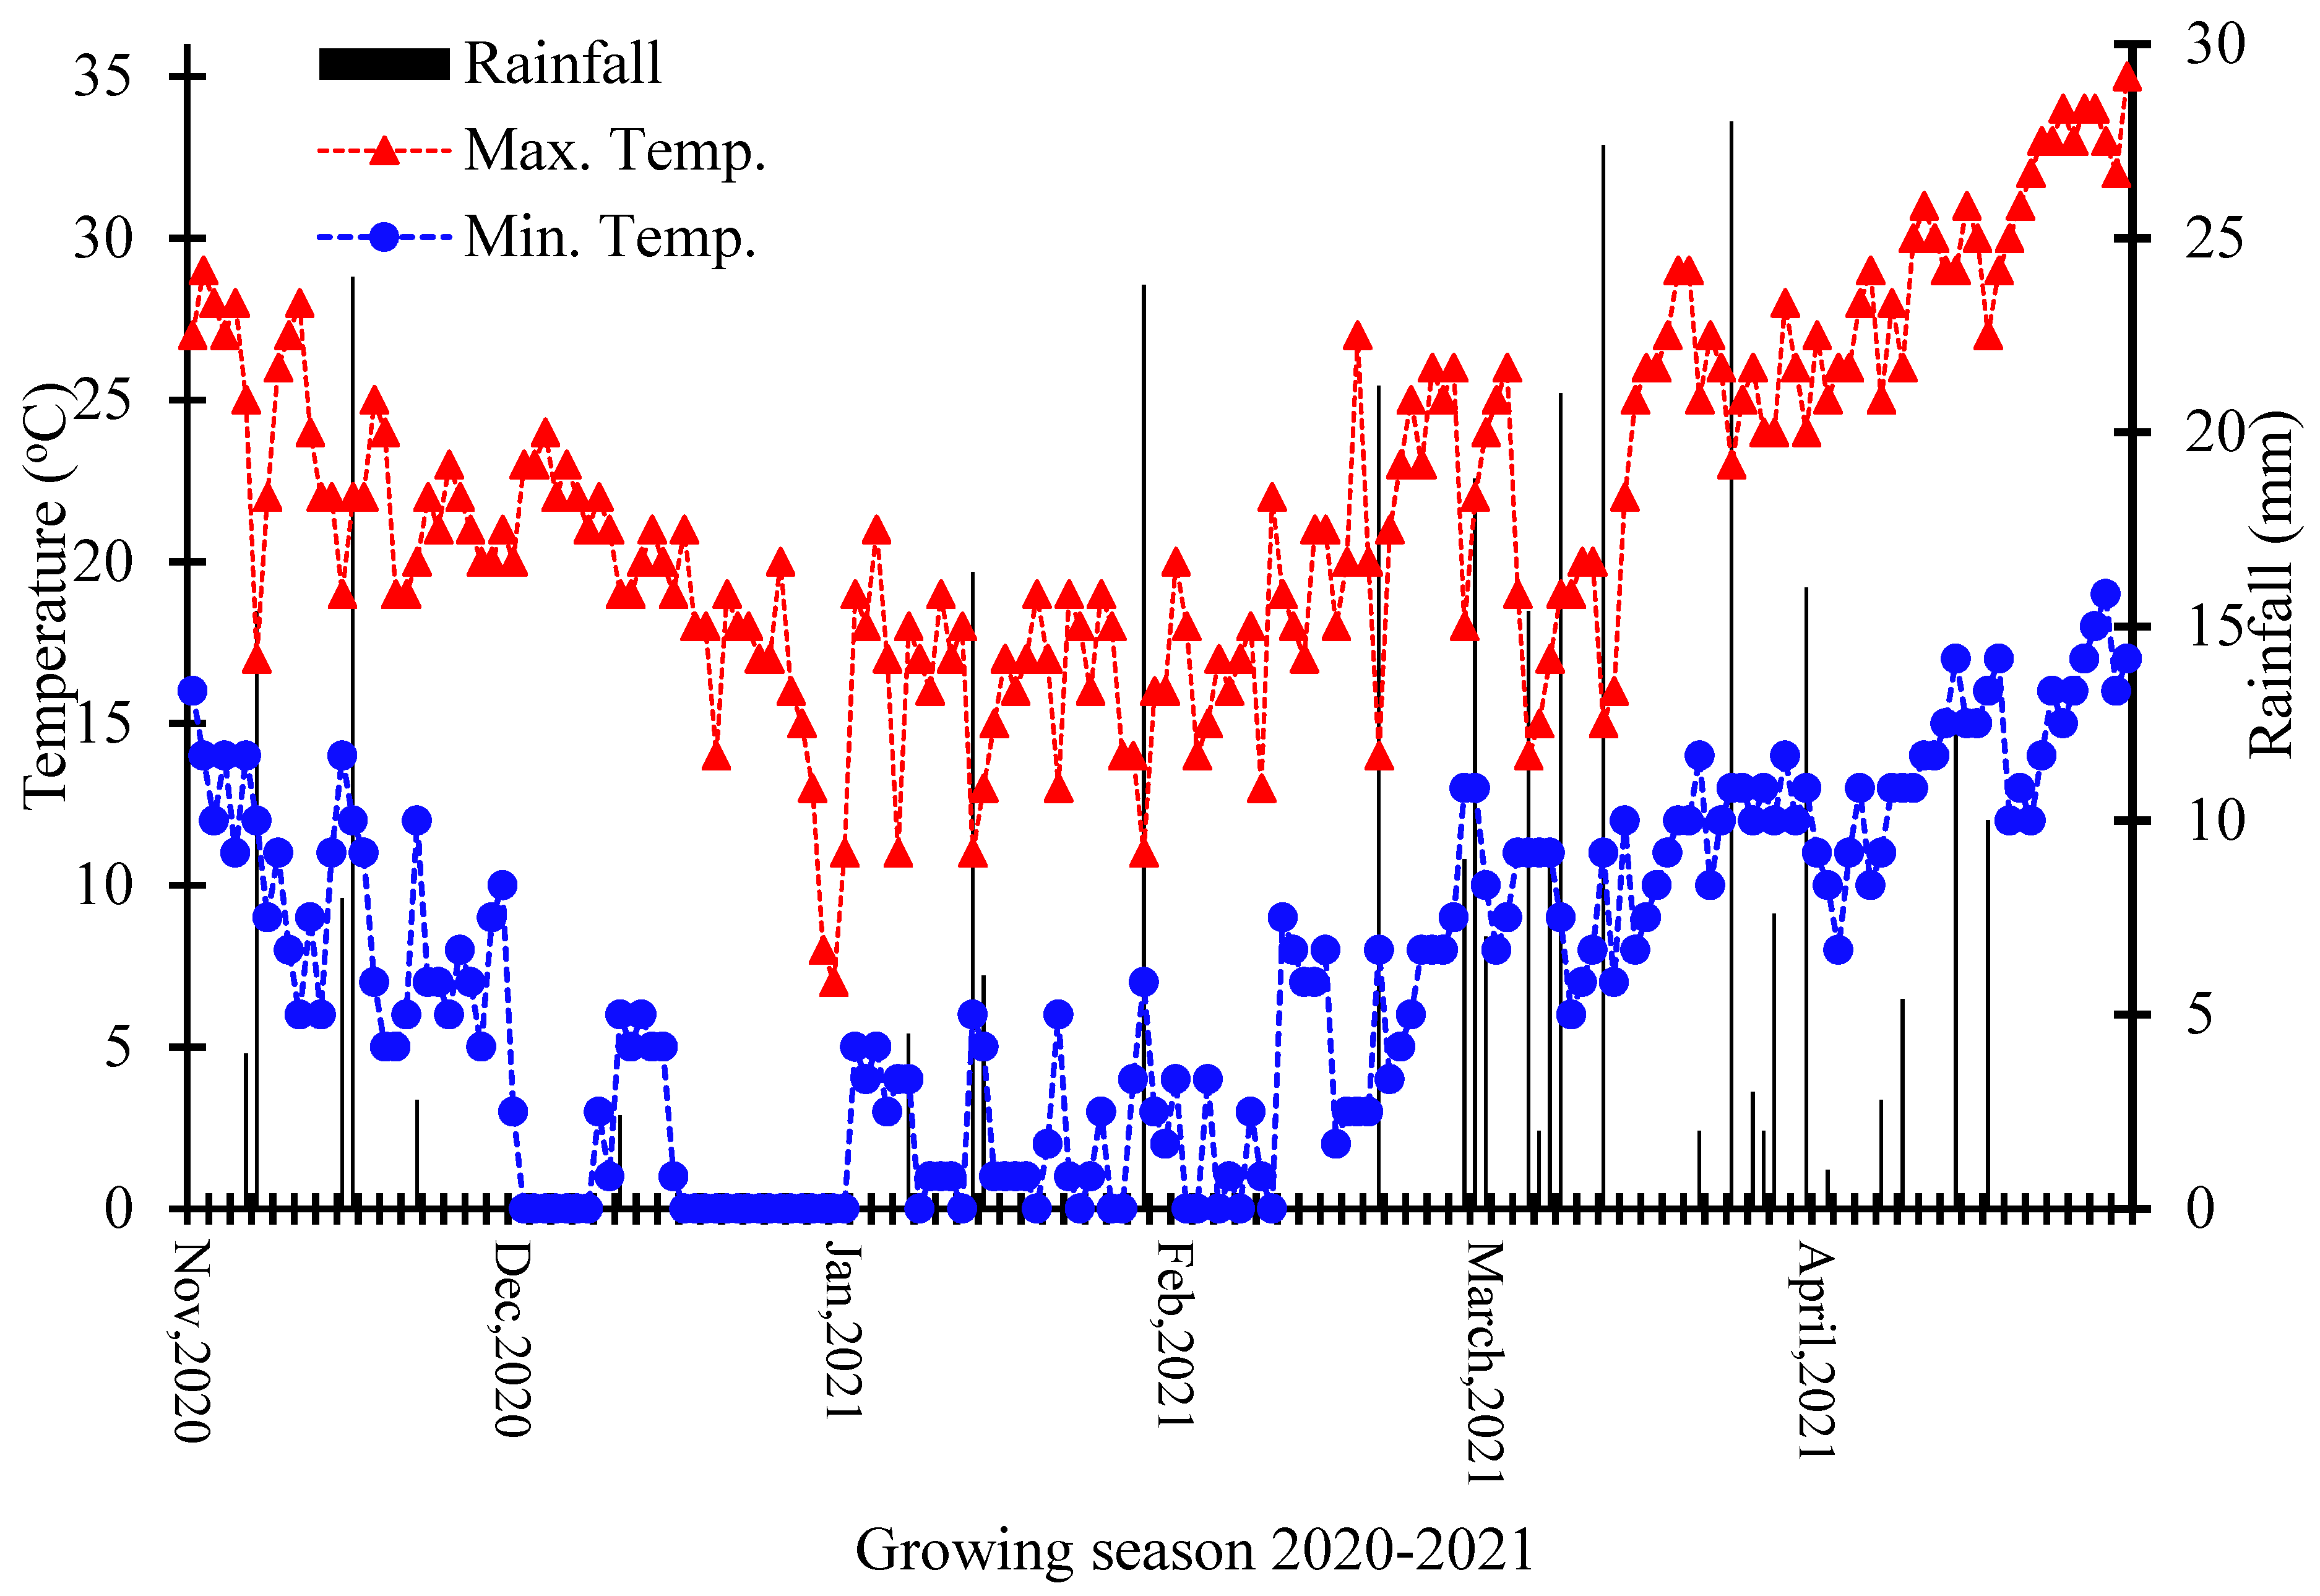
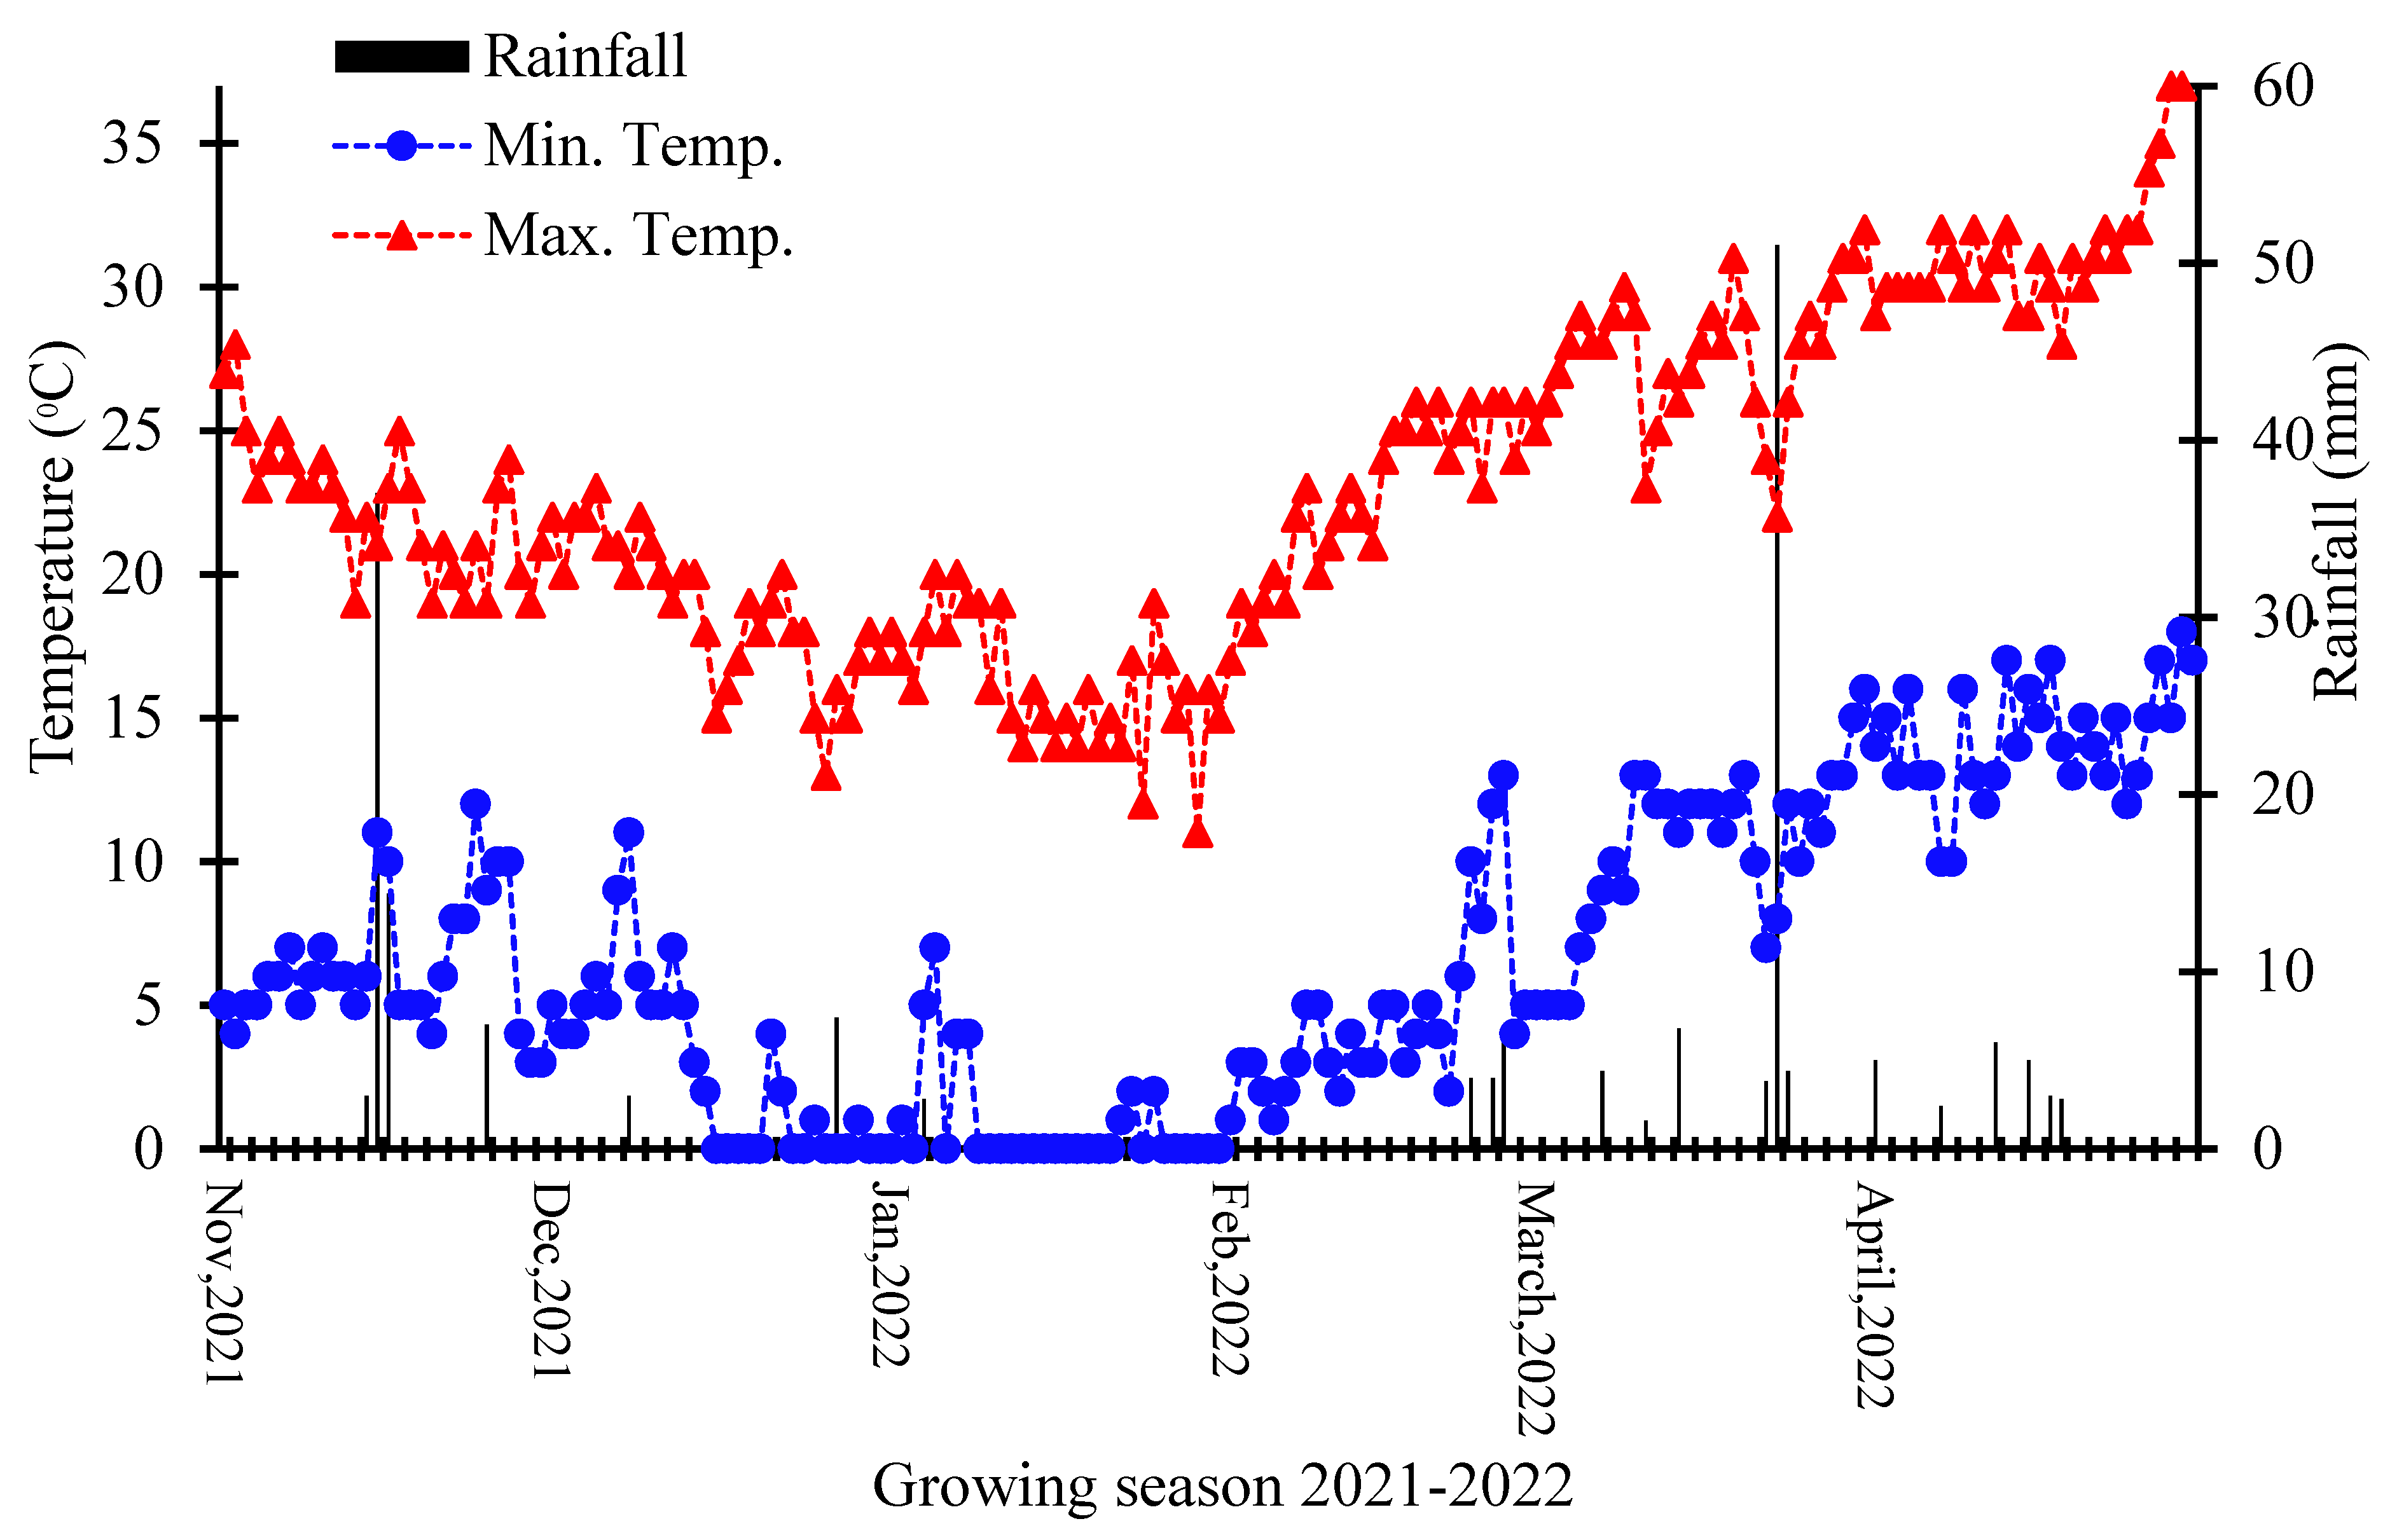
2.1. Experimental Site

Field experiments were carried out to determine the influence of biofertilizers (BF), organic phosphorus sources (OPS), and inorganic phosphorus sources (IPS) on wheat productivity in a wheat–maize cropping system. The study was conducted at the University of Agriculture Peshawar’s Agronomy Research Farm for two years, in 2020–2021 (Y1) and 2021–2022 (Y2). The investigational location has latitude and longitude coordinates of 34.015° N and 71.581°, an elevation of 359 m above sea level, and a semi-arid subtropical climate. The soil at the farm is silt loam, with N 0.1 (%), P 3.0 (mg kg−1), K > 100 (mg kg−1), pH > 7, and OM 1 (%). Temperature and rainfall data were collected and are shown in Figure 1 and Figure 2 for Y1 and Y2, respectively. In addition to rainfall, the crop water requirements were met by delivering water through a surface water system. The trials were designed as a two-factor randomized complete block design with three replications. Factor A contained 21 treatment combinations of organic and inorganic P sources (Table 1). Factor B was made up of two distinct biofertilizers (PSB and Bioaab). For comparison, one control treatment (no P and no BF applied) was included in each replication for comparison. Weeds were eliminated using the chemical herbicide “Affinity”.

2.2. PSB and Bioaab Application Method

The PSB were obtained from the NARC in Islamabad in culture form. The PSB belonged to the following genera: Cellulomonas, Alcaligenes, Pantoea, Klebsiella, Acinetobacter, Raoultella, Exiguobacterium and Pseudomonas. PSB in culture form were applied through seed inoculation at a rate of 100 mL for 1 kg of wheat seeds. The inoculated seeds were kept for 20–30 min under shade before sowing.
The Bioaab contained high populations of lactic acid bacteria at 1 × 10¹¹ cfu mL−1, photosynthetic bacteria at 1 × 10⁶ cfu mL−1, and 1 × 10³ cfu mL−1 yeast suspension. One liter of Bioaab was taken in a closed container. Then, 20 L of water was added with 1 kg of sugar and placed for 7 days. The prepared Bioaab was applied via spraying to the treatments at a rate of 1000 L ha−1 during sowing time.

2.3. Experimental Design

The experiment was laid out in a two-factor randomized complete block design having three replications. Factor one consisted of 21 treatments of organic and inorganic P-fertilizer combinations, while factor two consisted of two different beneficial microbes or biofertilizers (BF), viz. PSB and Bioaab. One overall control where no P or BF was used was also included in each replication. The experiment consisted of six treatments of sole P sources (sheep manure (SM), cattle manure (CM), legumes residues (LR), non-legumes residues (NLR), single super phosphate (SSP) and rock phosphate (RP)), each applied at a rate of 90 kg P ha−1. Different combinations of organic and inorganic P sources (giving 15 treatments) were applied at a rate of 50% P from each source (45 kg P ha−1 from organic and 45 kg P ha−1 from inorganic P sources). Animal manures and plant residues were applied as organic P sources a month before sowing, whilst RP (30% P2O5) and SSP (18% P2O5) were applied as inorganic P sources at the time of sowing. Phosphorus and nitrogen contents of the six organic sources is given in Table 2. A basal dose of 150 kg N ha−1 was compensated from organic sources, with the remaining N applied in three split dosages from urea. A plot size of 3 m long by 3 m wide (9 m2) was chosen, and a 30 cm R–R spacing was maintained. With the aid of a cultivator, the field was twice ploughed to a depth of 30 cm. After that, planking was applied. The Pirsabak-2015 wheat variety was sown at a seed rate of 100 kg ha−1. The recommended irrigation schedule was followed; however, adjustments were made based on the weather. During both years, the 1st irrigation was performed after emergence, followed by the next irrigation at the tillering stage, the 3rd irrigation at the stem elongation stage and the 4th irrigation was applied at the anthesis stage. All other agronomic recommended practices were carried out uniformly for all the treatments for both the wheat and maize crops.
Data were recorded on the number of spikes m−2, number of grains spike−1, thousand-grain weight (g), grain yield (kg ha−1) and harvest index (%) of the wheat crop. Data on the spikes m−2 of the wheat were measured by counting the spikes in each plot’s center three rows of one-meter length. In each plot, the number of grains spike−1 of 10 randomly selected spikes was counted and averaged. After threshing the wheat crop in each plot, the thousands of grains were counted and weighed using an electronic balance. Four center rows of the wheat crop were harvested in each plot and the grains were cleaned to determine the grain yield. The wheat harvest index was determined using the following formula:
Harvest index (%) = Grain yield/Biological yield × 100

2.4. Statistical Analysis

A randomized complete block design (RCBD) was used to analyze the data. In the event of a significant difference, the least significant difference (LSD) test at a 5% level of significance was utilized for the mean comparison [30]

3. Results

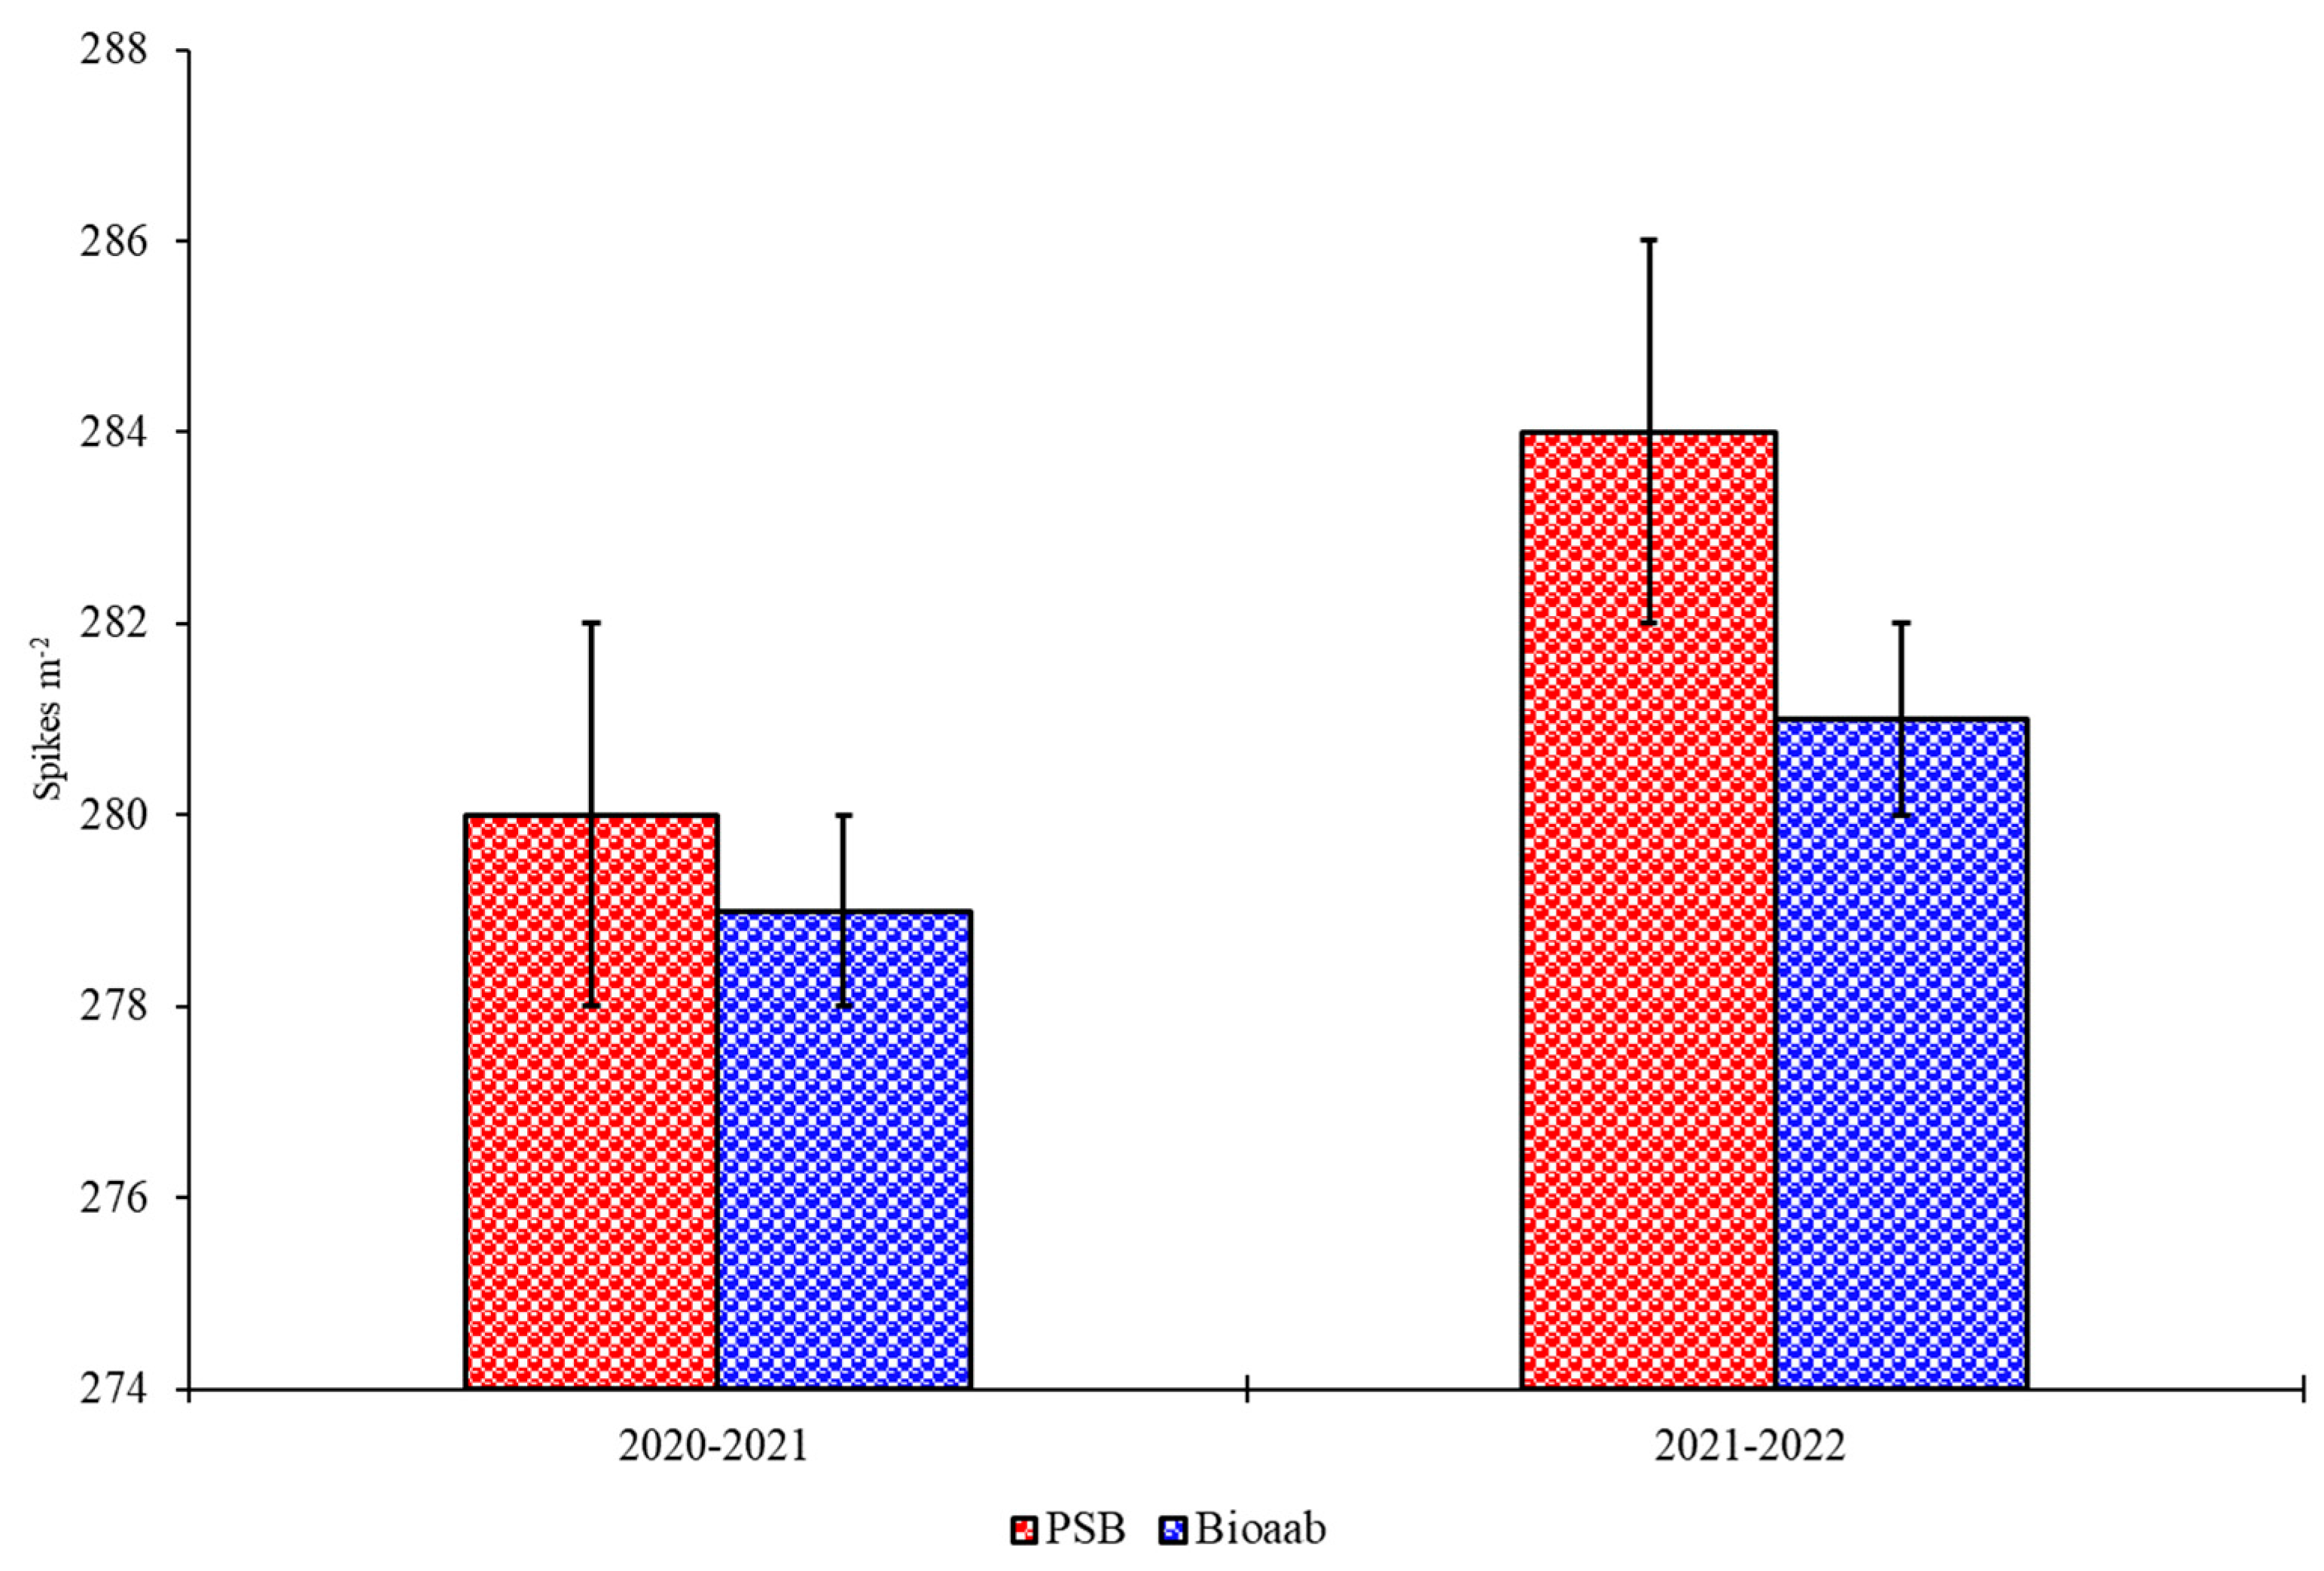
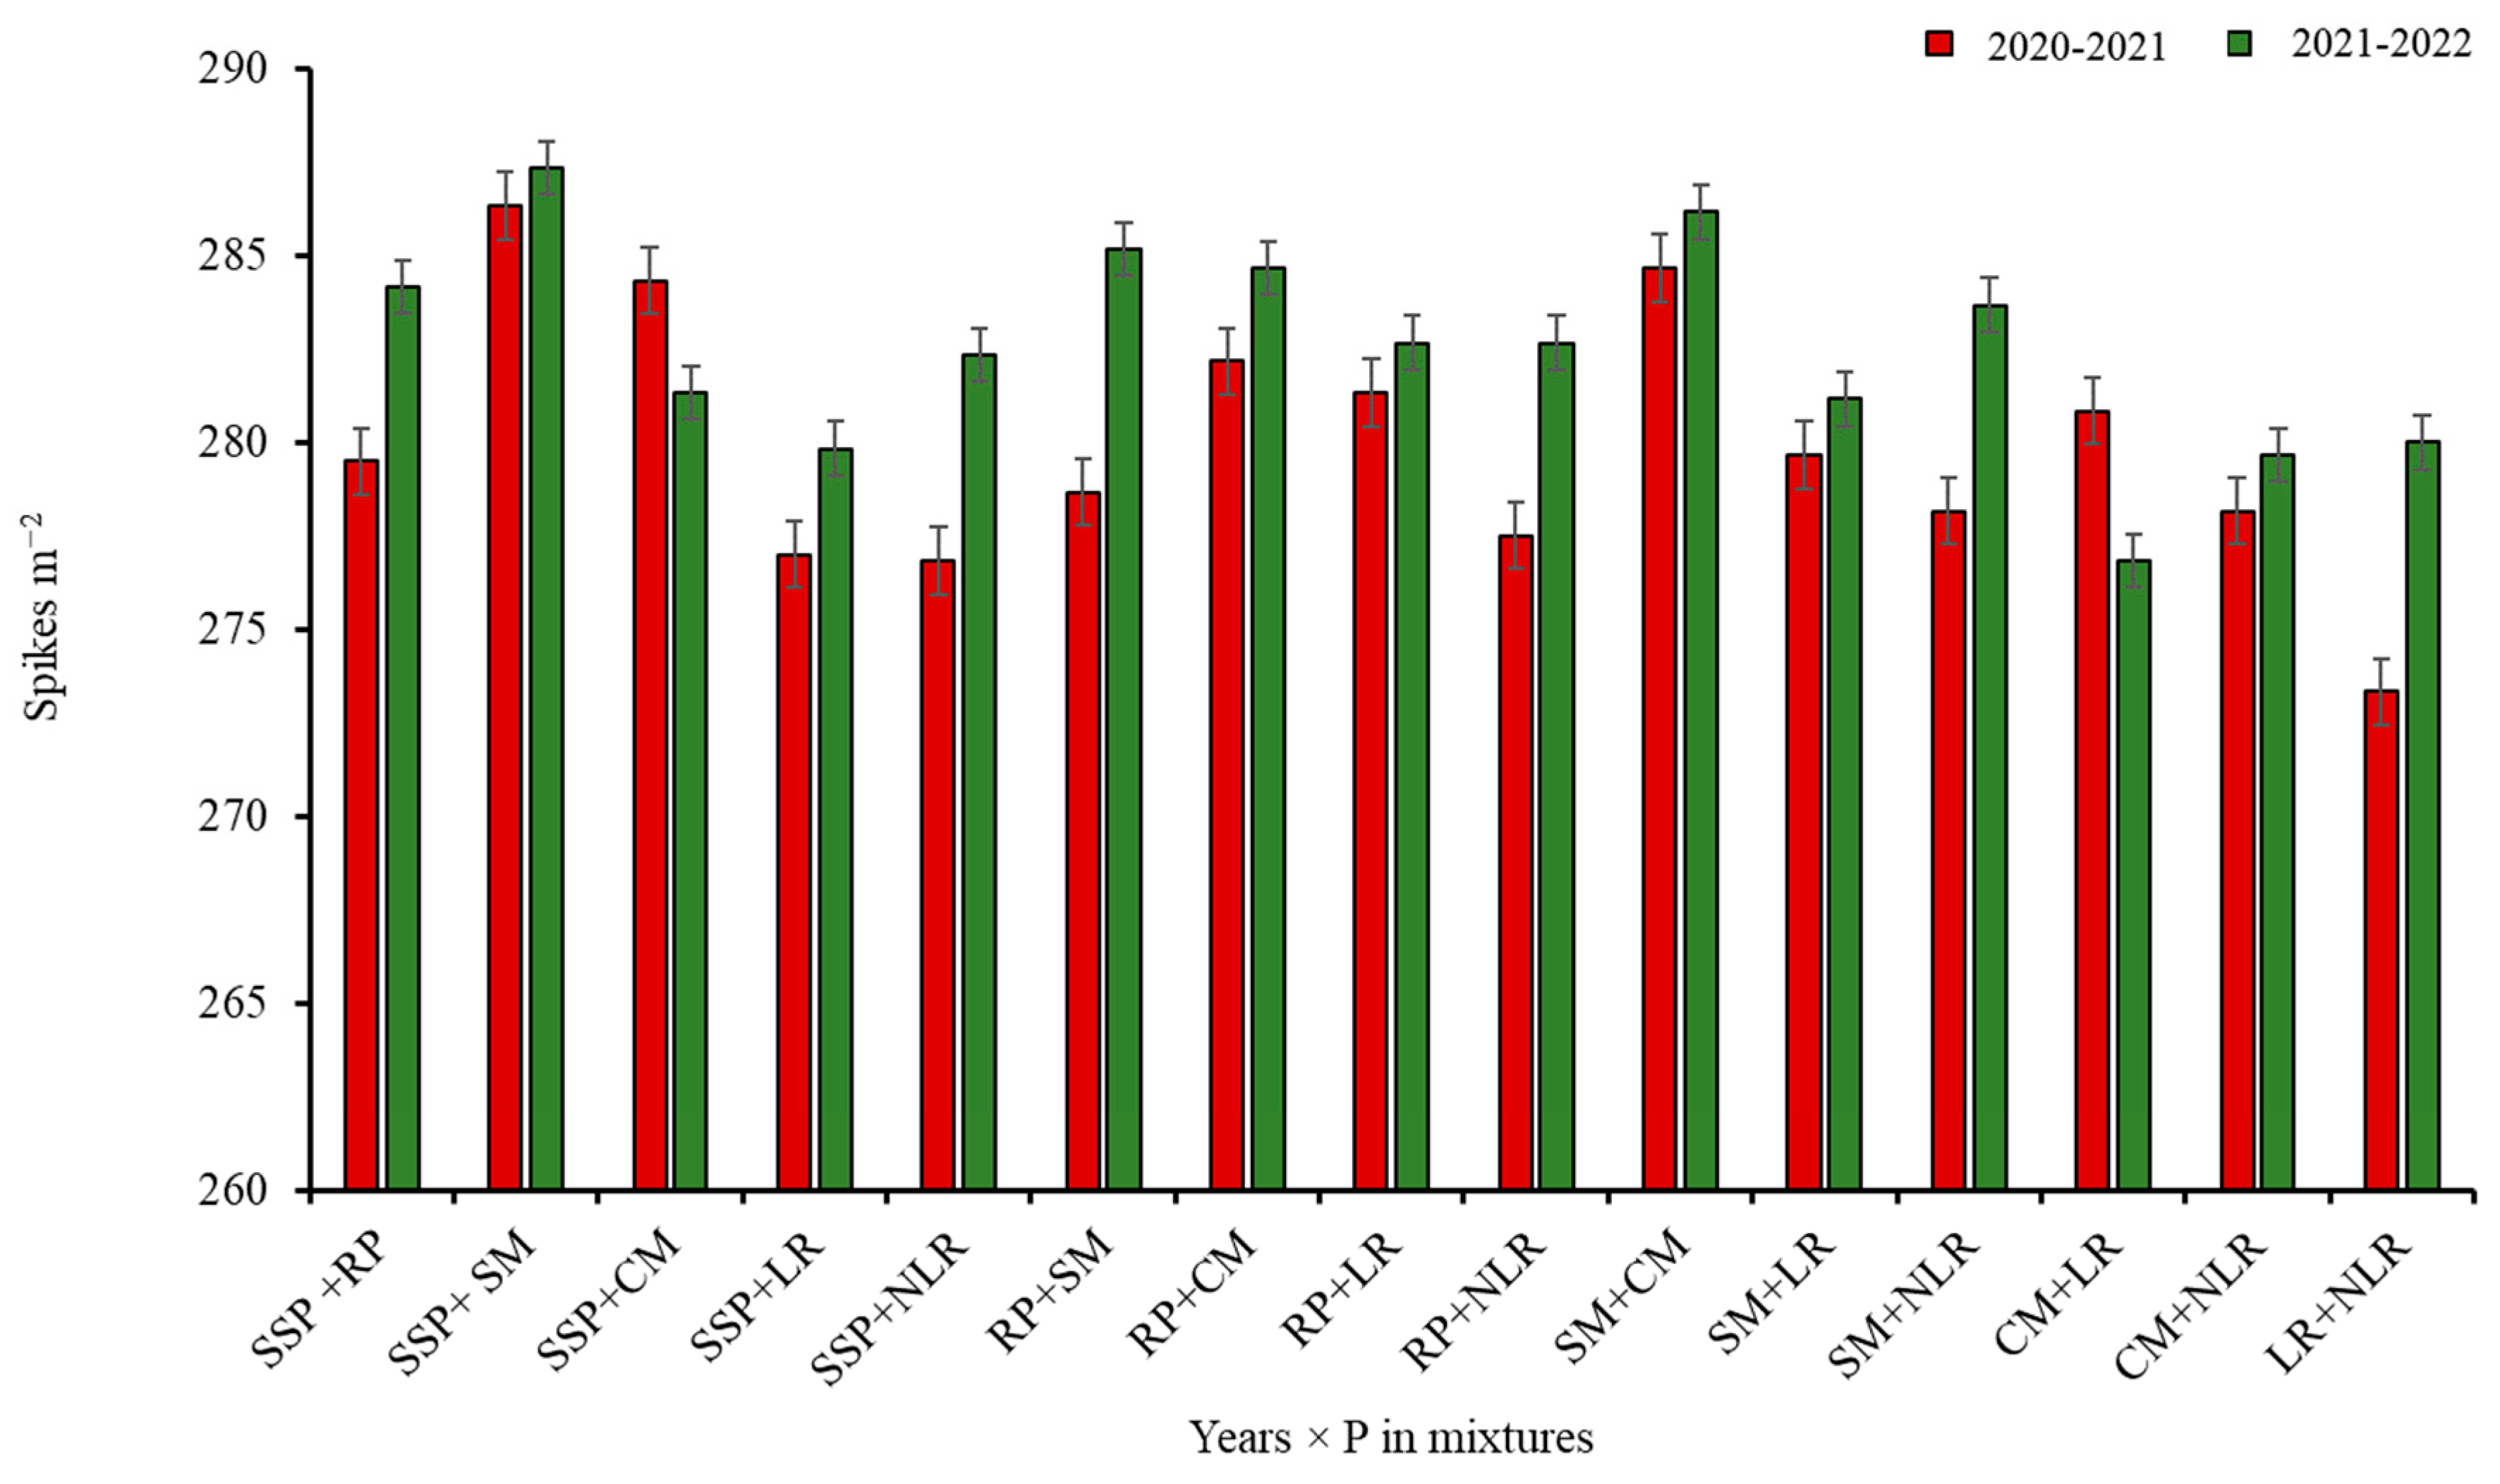
3.1. Number of Spikes m−2

In the case of the P sources (PS), the maximum number of spikes m−2 (SPMS) (287 m−2) was recorded with the application of SSP+SM, which was statistically on par with SM (286 m−2) and SM+CM (285 m−2), while the lowest SPMS was recorded with the application of NLR (275 m−2) as shown in Table 3. In the case of the BF, a higher SPMS was recorded with the application of PSB (282 m−2) than Bioaab (280 m−2); however, the increase in the SPMS was not significant in Y1, while a significantly higher SPMS was recorded during Y2, which resulted in the significant interaction of Y × BF (Figure 3). Although the year effect was found to be statistically non-significant, a higher SPMS was recorded during Y2 than Y1. The planned mean comparison of the data showed that the maximum SPMS (281 m−2) was recorded in the rest (P-treated plots) than the control (274 m−2). Furthermore, the animal P sources (APS) produced a higher SPMS (285 m−2) than the inorganic P sources (IPS) (279 m−2); however, the IPS (2279 m−2) produced a higher SPMS than the PPS (276 m−2). Moreover, the APS produced a higher SPMS (285 m−2) than the PPS (275 m−2), while the application of IPS showed no significant difference in term of the SPMS with OPS (Table 4).
The combined application of SSP+SM and SM+CM produced a comparatively higher SPMS during both years than all the other P combinations, while the minimum SPMS was recorded with the combined application of LR+NLR in Y1 (Figure 4).

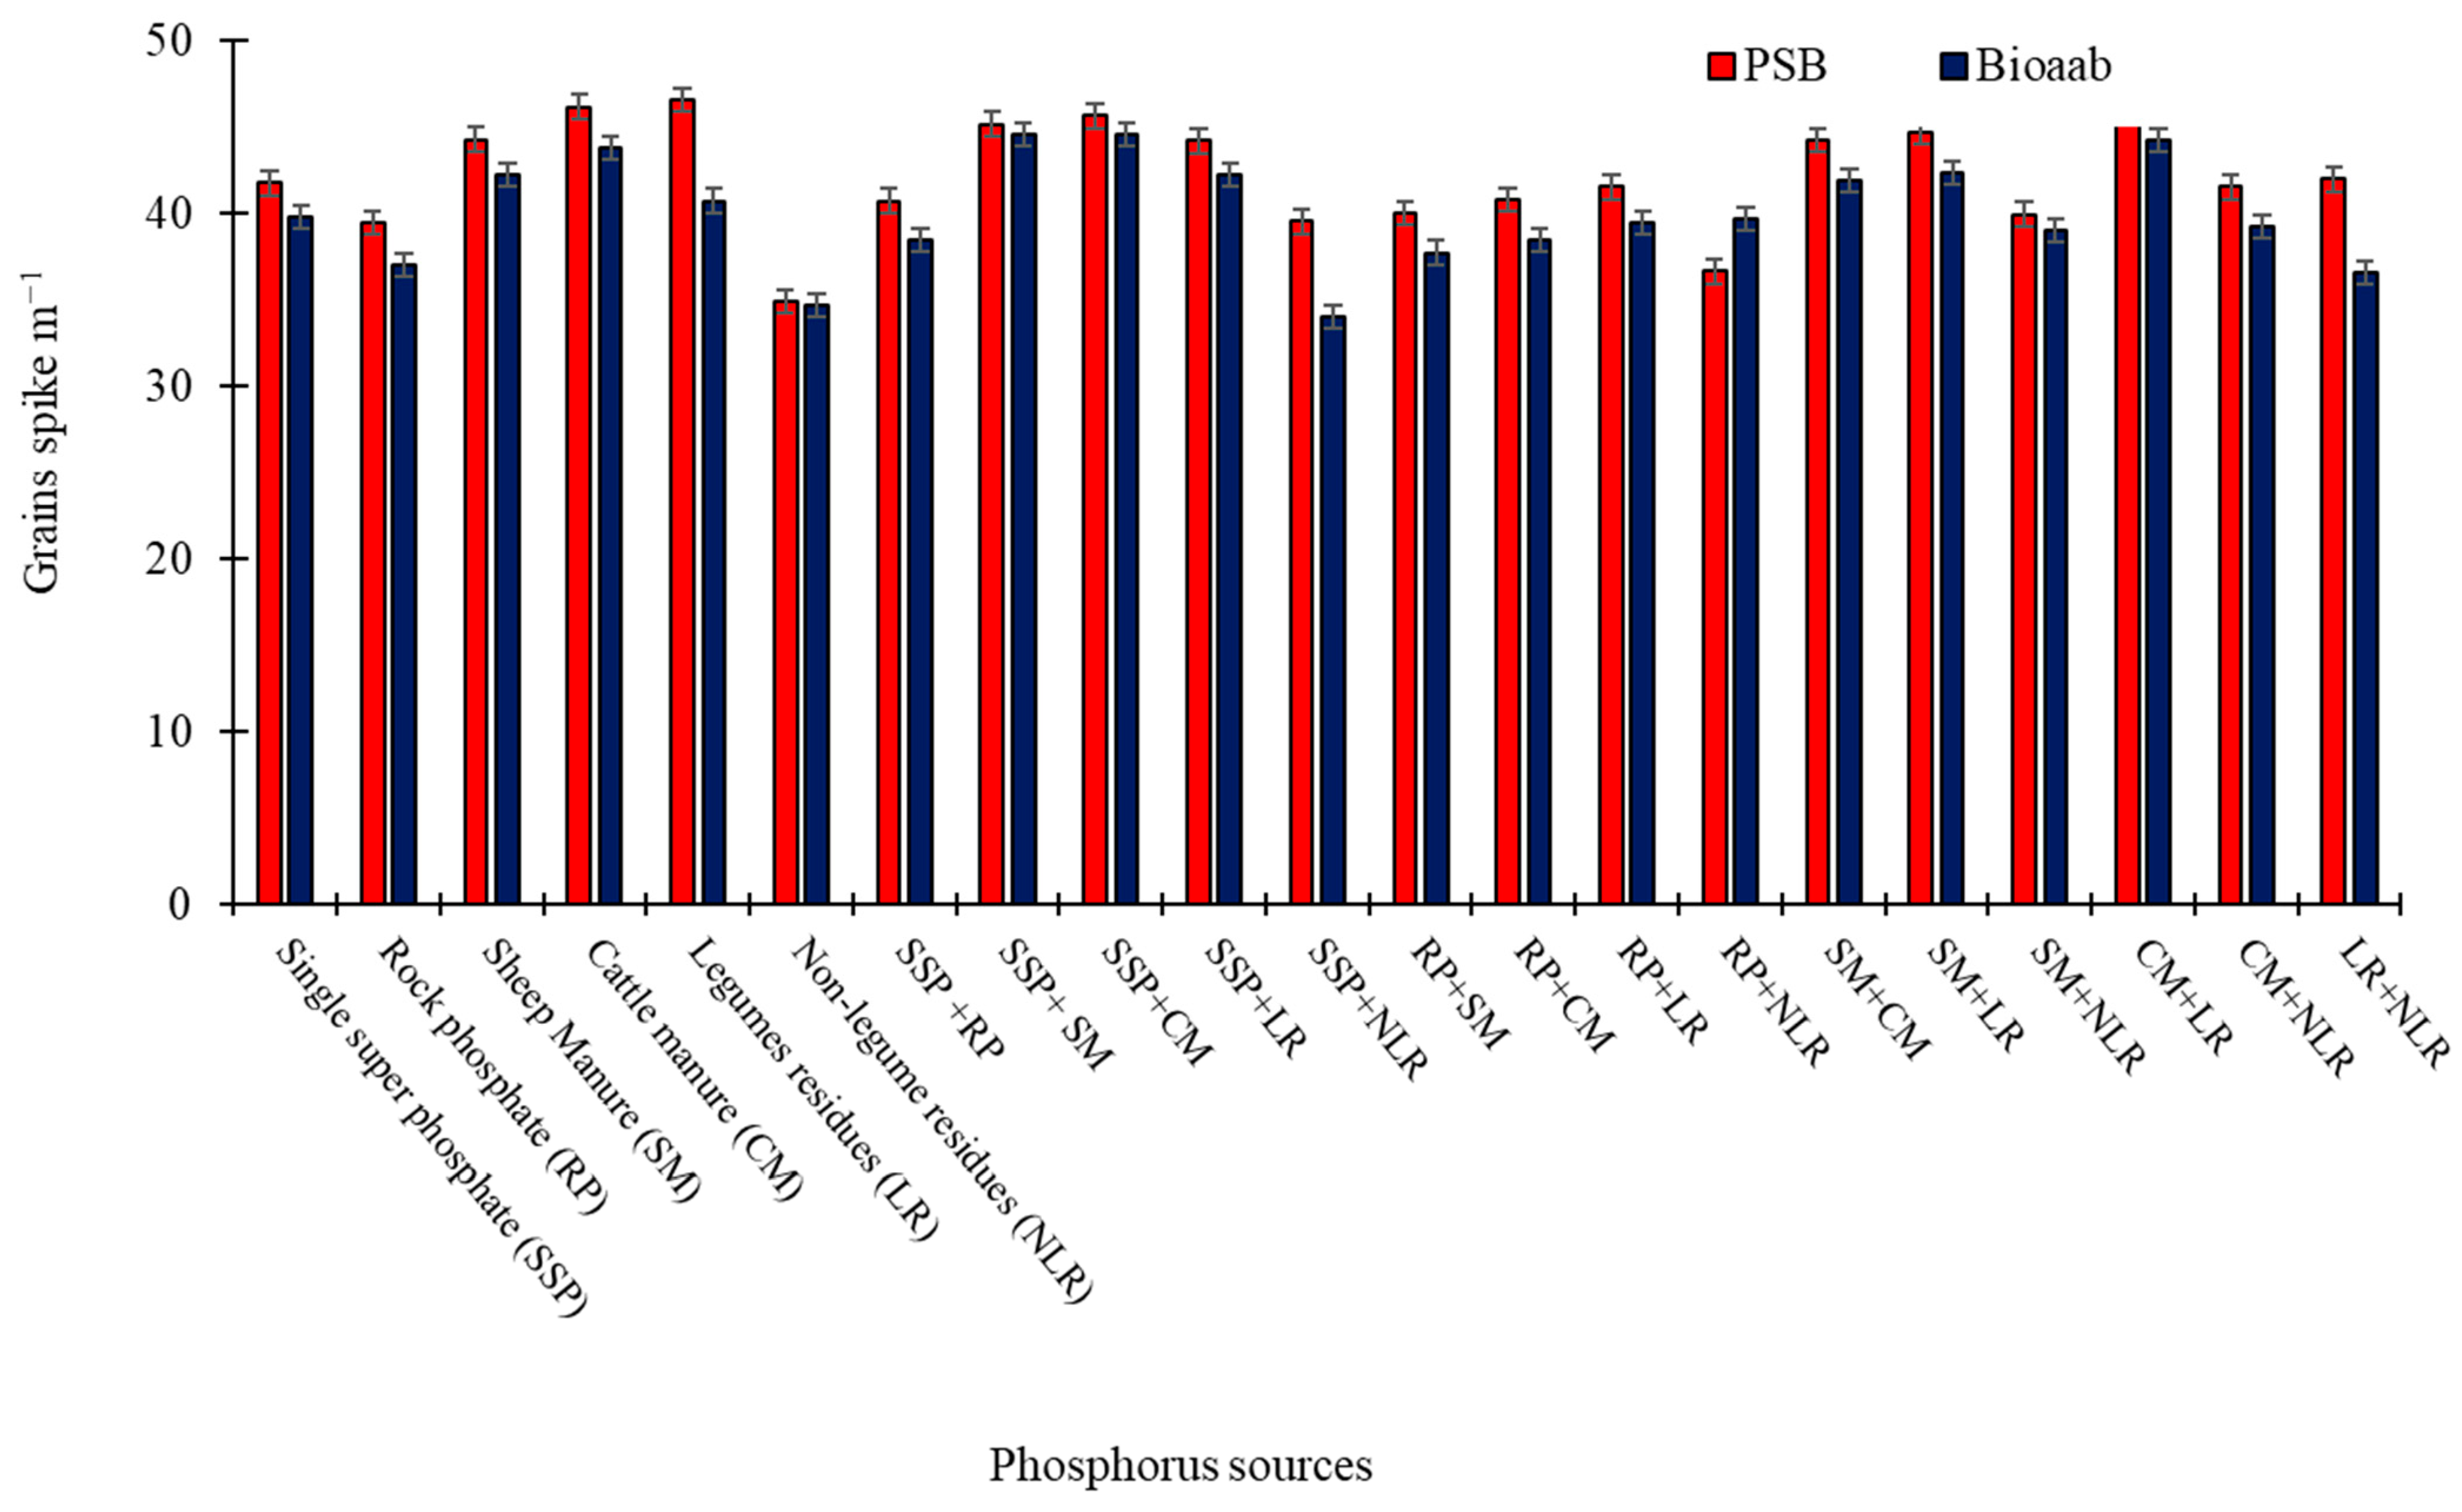
3.2. Number of Grains Spike−1

The phosphorus sources had a significant effect on the number of grains spike−1 (GPS) (Table 3). In Y1, the maximum GPS was obtained with SSP+CM and SSP+SM, while the lowest GPS was recorded with NLR. In Y2, the maximum GPS was recorded with CM+LR, SM+CM, SM, SM+LR, SSP+SM, and SSP+CM, while the minimum GPS was recorded with NLR. The average of the two years’ data showed that the maximum GPS was recorded with CM+LR, CM, and LR, while the minimum GPS (55) was obtained with NLR. In the case of the BF, the maximum GPS was recorded with the application of PSB rather than Bioaab. Similarly, a higher GPS was recorded during Y2 than Y1. The planned mean comparison of the data showed that the maximum GPS (41) was recorded in the rest (P- and BF-treated plots) than the control (34). On the other hand, the APS produced a higher GPS (44) than the IPS (40); however, there was no significant difference between the IP and PPS in terms of the GPS. Similarly, the APS produced a higher maximum GPS than the PPS. A significantly higher GPS was recorded with OPS than IPS (Table 4). The interactive effect of PS × BF showed that the application of PSB with SM, CM, LR and a combination of CM+LR produced a higher GPS than all the other combinations, while the lowest GPS was recorded with the application of NLS in combination with either PSB or Bioaab (Figure 5). Similarly, the interactive effect of Y × Sole PS showed that during Y1, the application of CM and SM produced a higher GPS, while in Y2, the application of CM and LR produced a higher GPS (Figure 6).

3.3. Thousand-Grains Weight (g)

In Y1, the maximum thousand-grain weight (TGW) was obtained with the SM, CM, LR, SM+CM and SM+LR, while the lowest TGW was recorded with the RP. In Y2, the maximum TGW was recorded with the CM+SM, while the minimum was recorded for the RP. The average of the two years’ data showed that the maximum GPS was recorded with the CM+SM (36.6 g), which was statistically similar to the LR (36.5 g) while statistically on par with the CM, SM, SM+LR, SM+NLR and CM+LR, while the minimum TGW (35) was obtained with the RP (Table 3). In the case of the BF, the maximum TGW was recorded with the application of PSB (36.1 g) rather than Bioaab (35.5 g). Although the year effect was found to be statistically non-significant, a higher TGW was recorded during Y1 than Y2.
The planned mean comparison of the data revealed that the maximum TGW (35.8 g) was recorded in the rest (P- and BF-treated plots) rather than the control (33.5 g). Furthermore, the APS produced a higher TGW (36.4 g) than the IPS (35.2), and the PPS also produced a higher TGW (35.8 g) than the IPS (35.2 g) (Table 5).

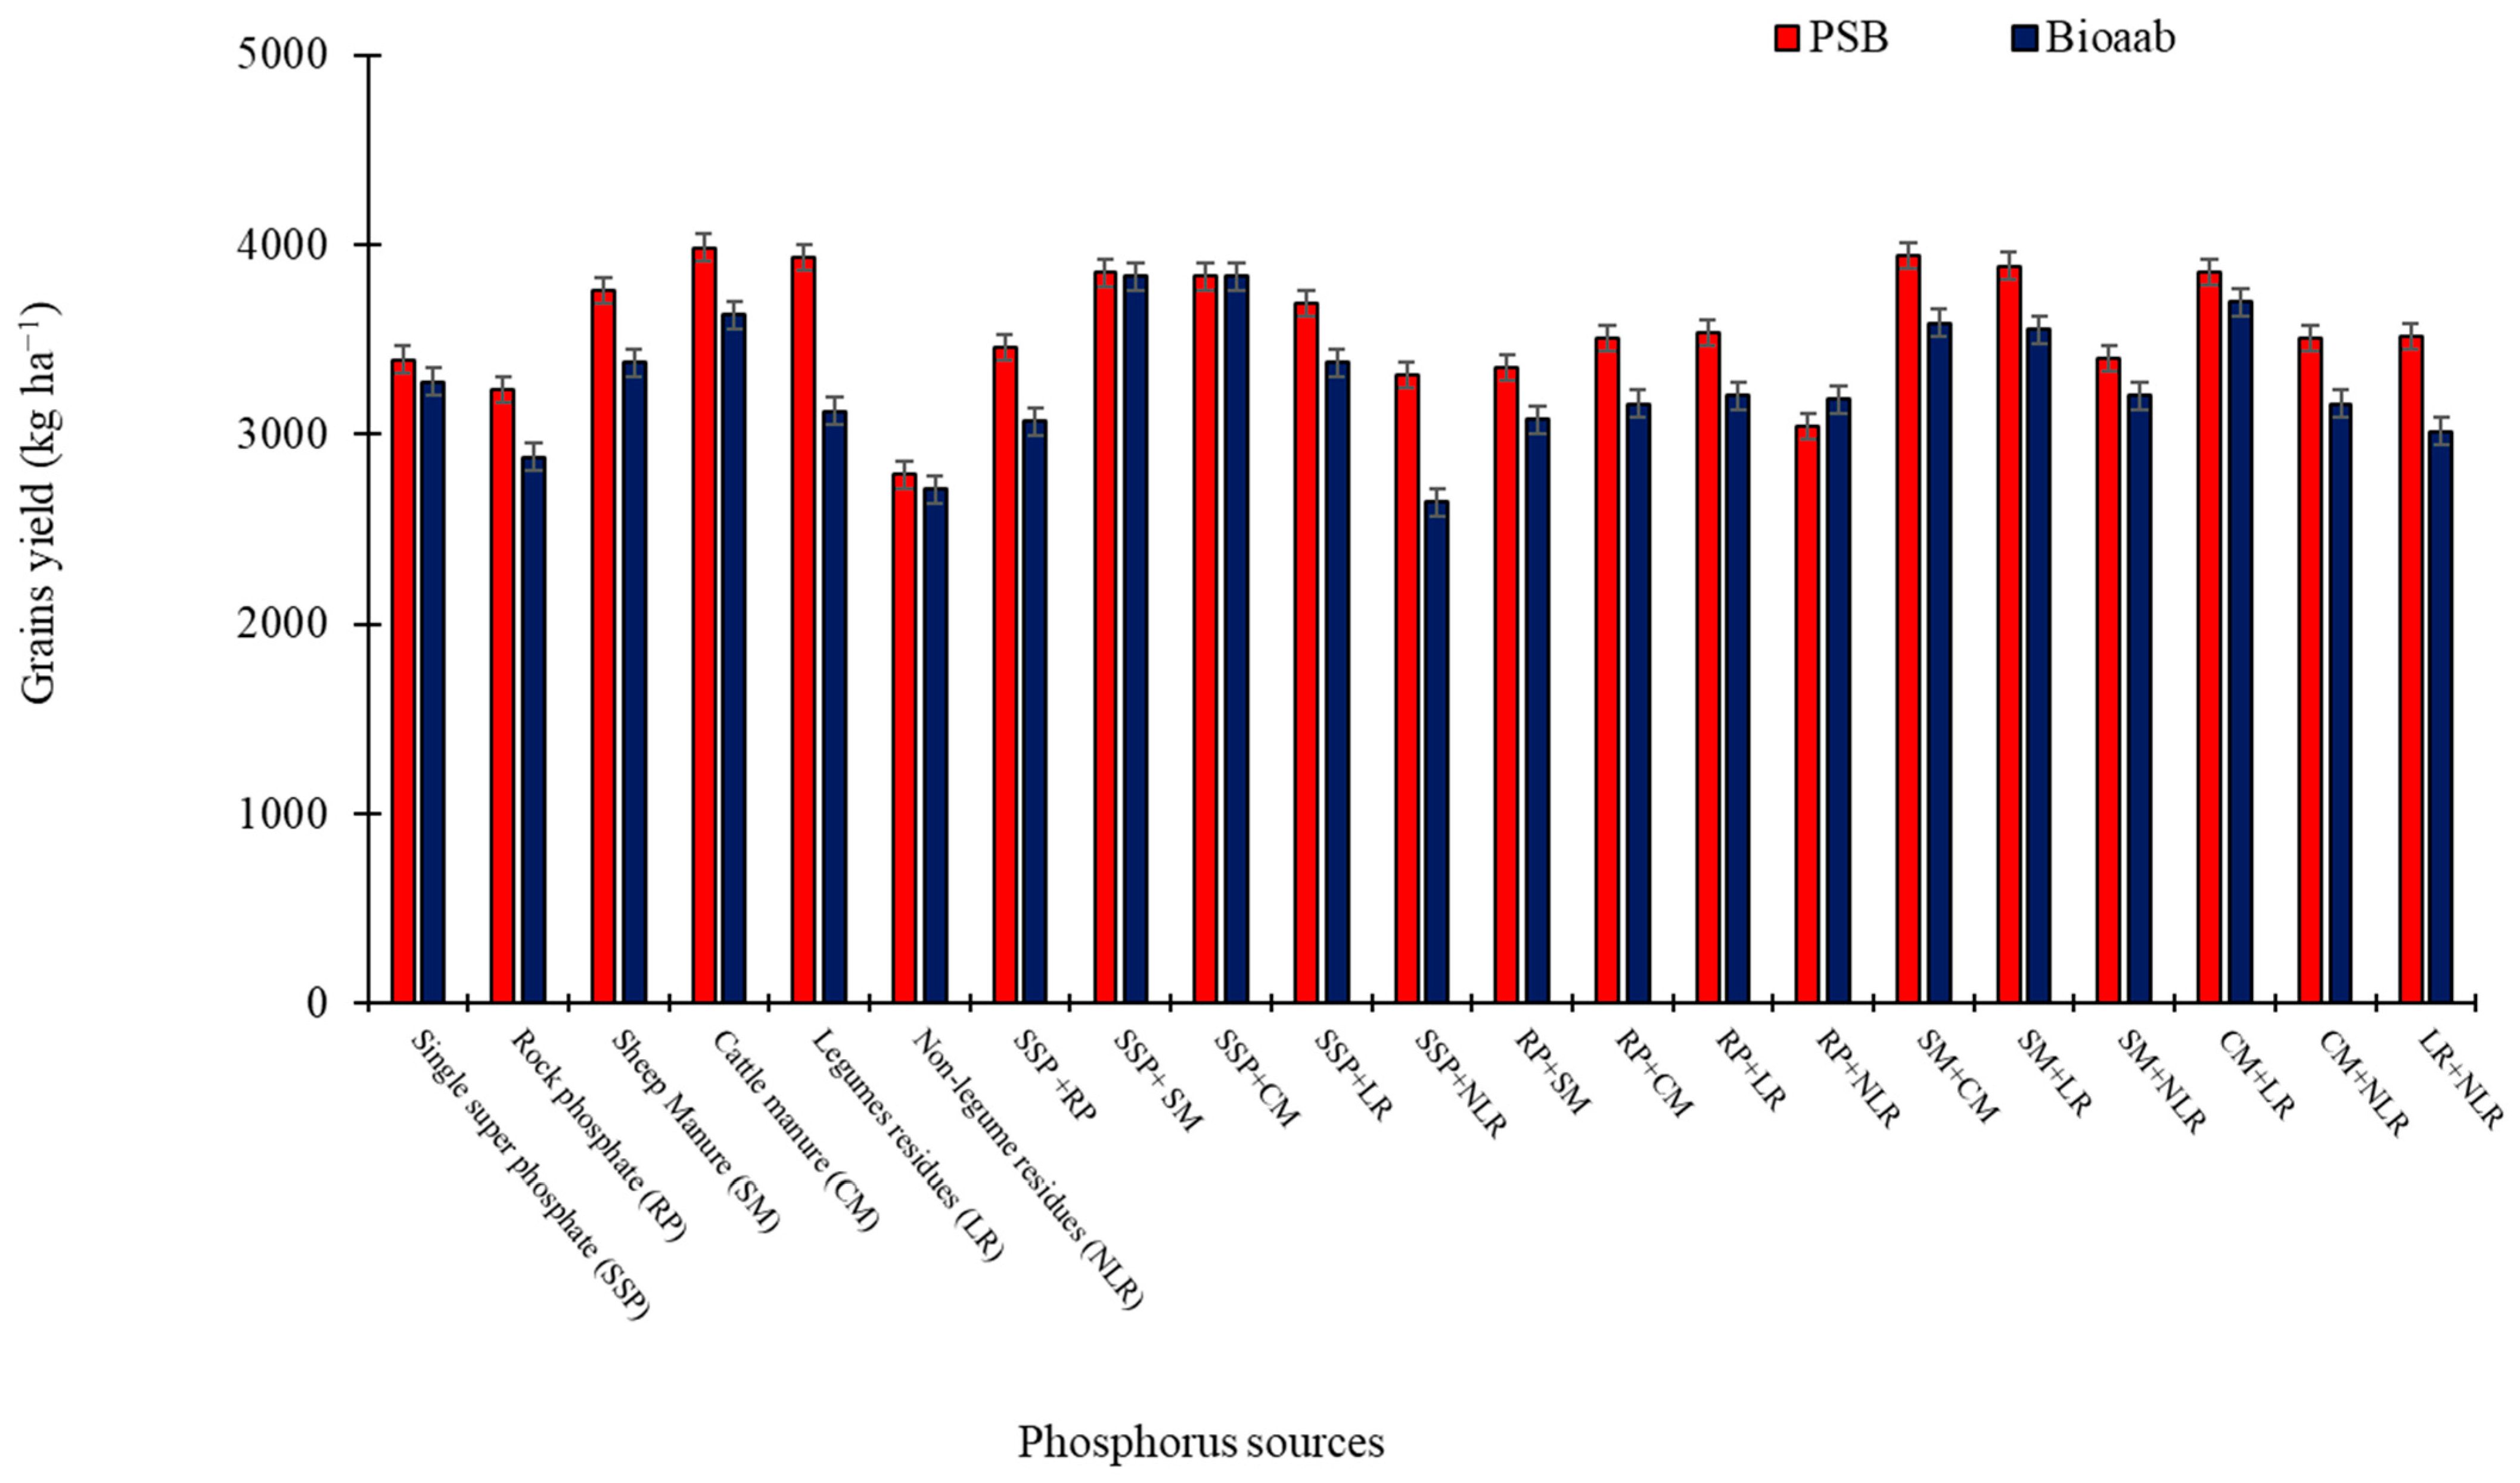
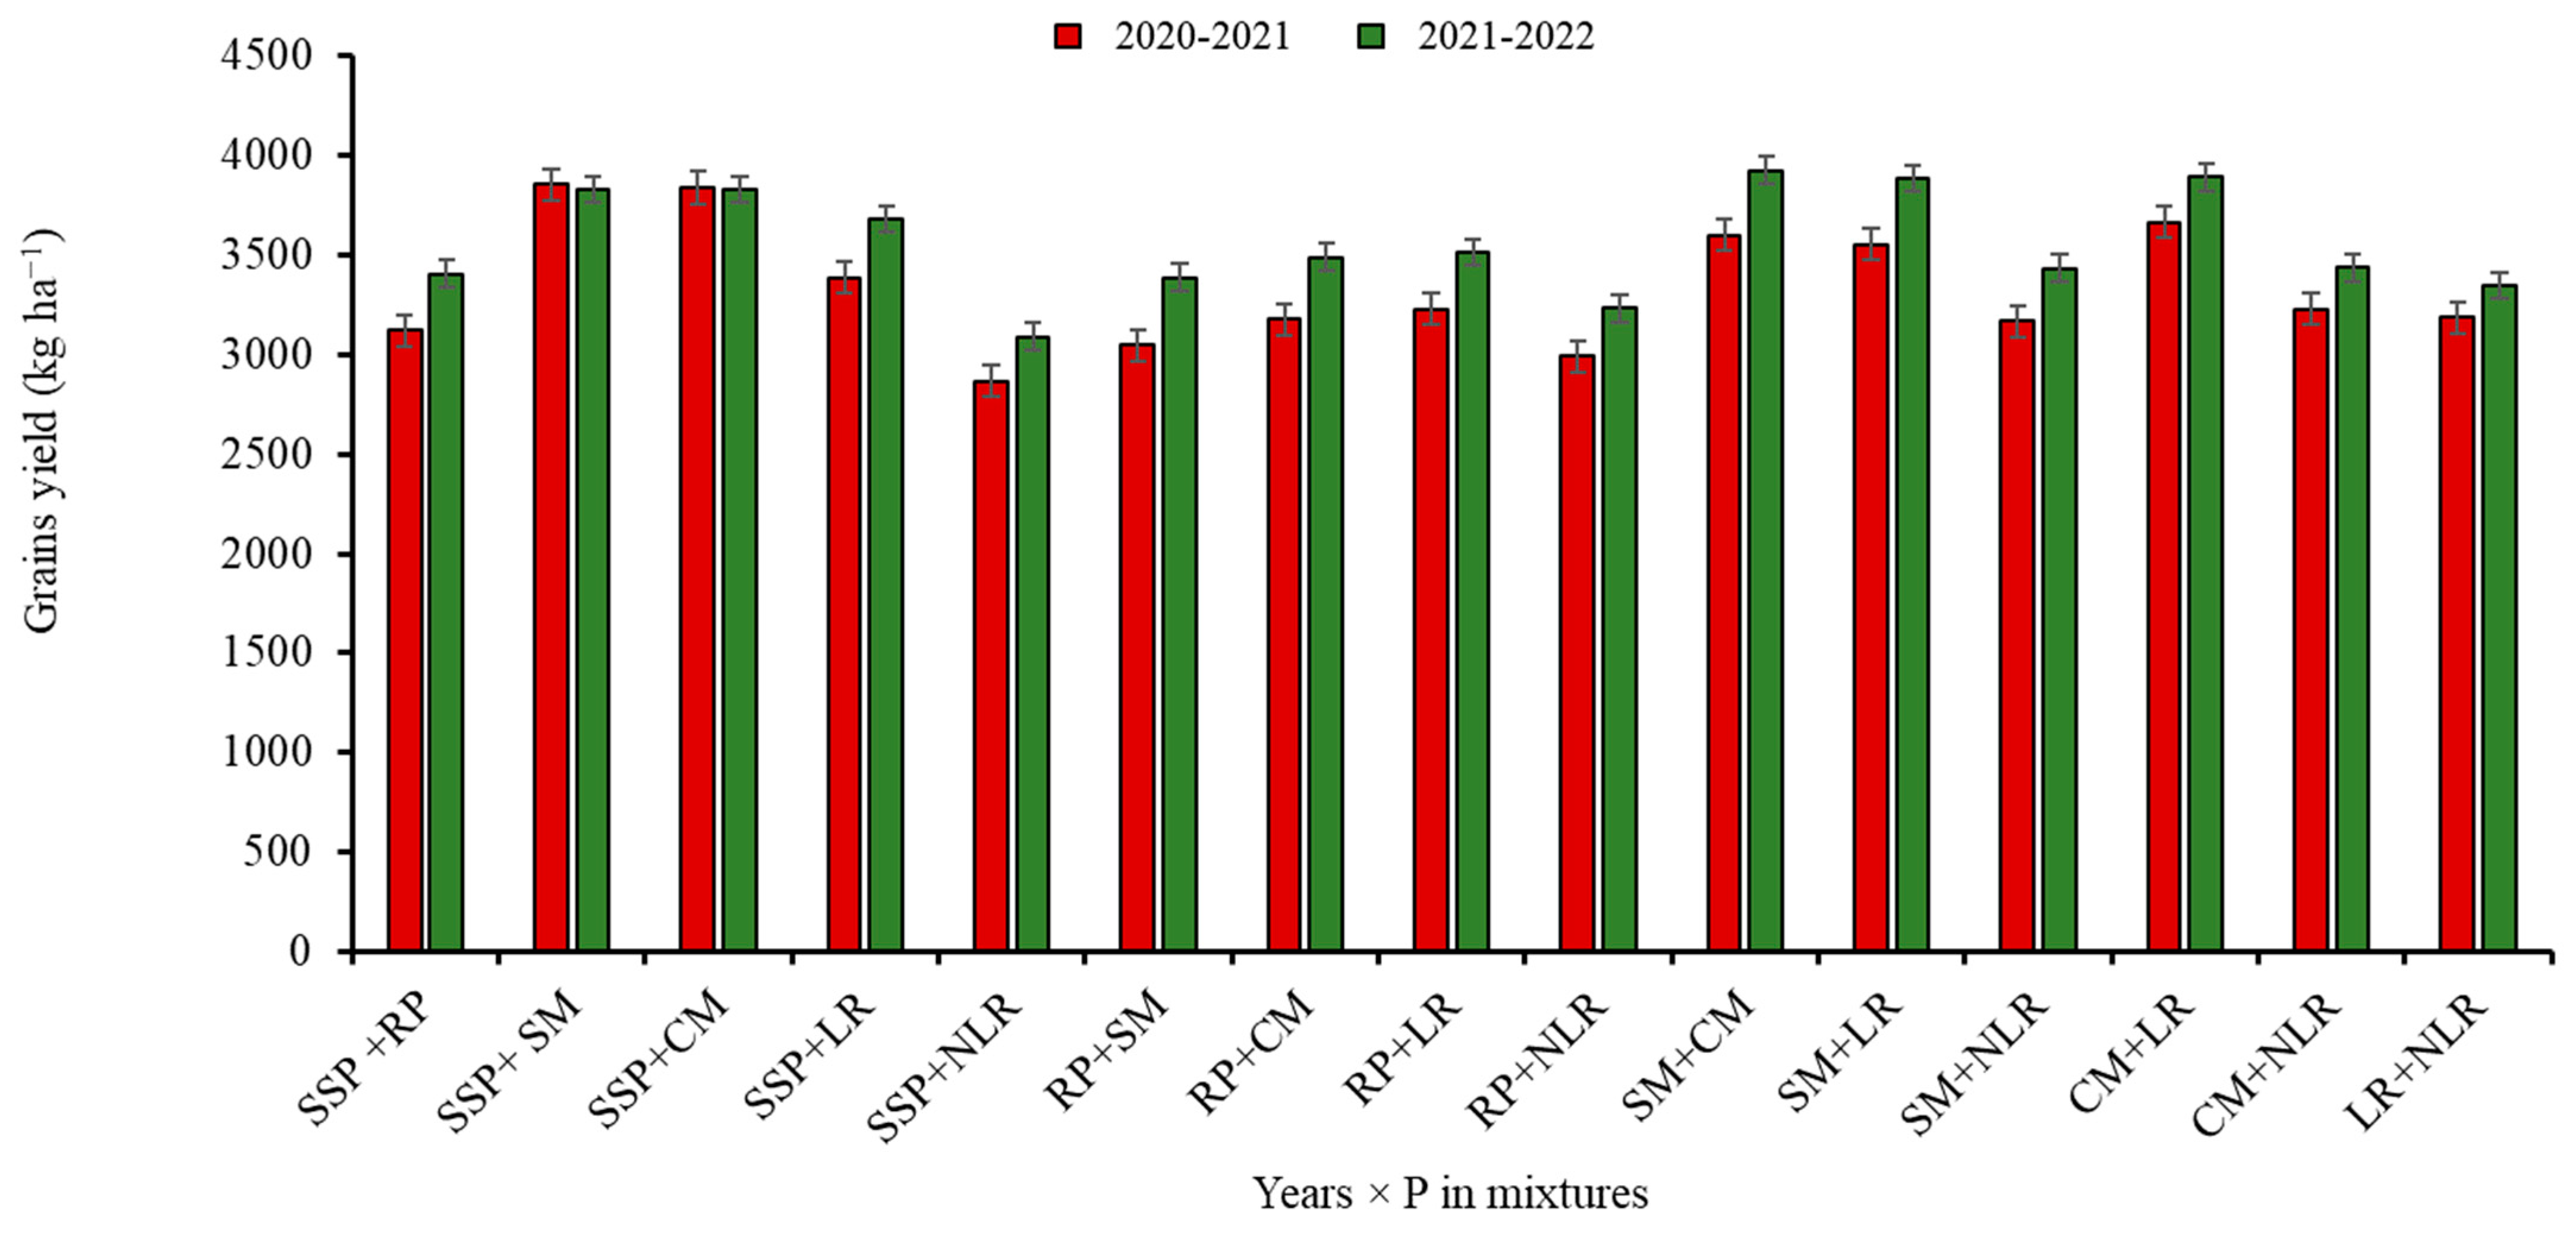
3.4. Grain Yield (kg ha−1)

Improvements in grain yield (GY) have been essential to feed a growing population. Data concerning the GY of the wheat are shown in Table 3. Among the PS, the combination of SSP either with SM or CM (SSP+SM or SSP+CM) and the combination of SM+CM produced the highest GY (3843, 3834 and 3777 kg ha−1, respectively), while the lowest GY was recorded with the application of NLR (2749 kg ha−1). Application of PSB produced a higher GY (3562 kg ha−1) than Bioaab (3267 kg ha−1). The GY in Y2 (3525 kg ha−1) was significantly higher than in Y1 (3303 kg ha−1). The GY of the wheat varied significantly (P ≤ 0.05) with Y × PS. The wheat produced a higher GY in Y2 than in Y1 while using different P sources. In Y1, the GY ranged between 2693 (NLR) and 3856 kg ha−1 (SSP+SM), while in Y2, it ranged between 2805 (NLR) and 3991 kg ha−1 (CM+LR). The higher increase in the GY in Y2 over Y1 was obtained with the application of SM and CM. The planned mean comparison of the data showed that the rest of the plots produced a higher GY (3414 kg ha−1) than the control (2272 kg ha−1). The GY increased in the rest of the plots in Y2 over Y1; in contrast, in the control plots, the GY decreased in Y2 as compared with Y1 (Y × control vs. rest interaction). On average, the application of PiM produced a higher GY (3443 kg ha−1) than sole PS. The application of APS produced a higher GY than IPS; however, the IPS produced a higher GY than the PPS. In contrast, the APS produced a higher GY than the PPS (Table 5); however, a higher GY was recorded with OPS than IPS. The PS × BF interaction showed that CM in combination with PSB produced a higher GY than the other combinations (Figure 7). The GY increased with the application of PiM or pure PS in Y2 over Y1. Application of SSP+SM and SSP+CM produced a higher GY during Y1, while the application of SM+CM, SM+LR and CM+LR produced a higher GY during Y2 (Figure 8).

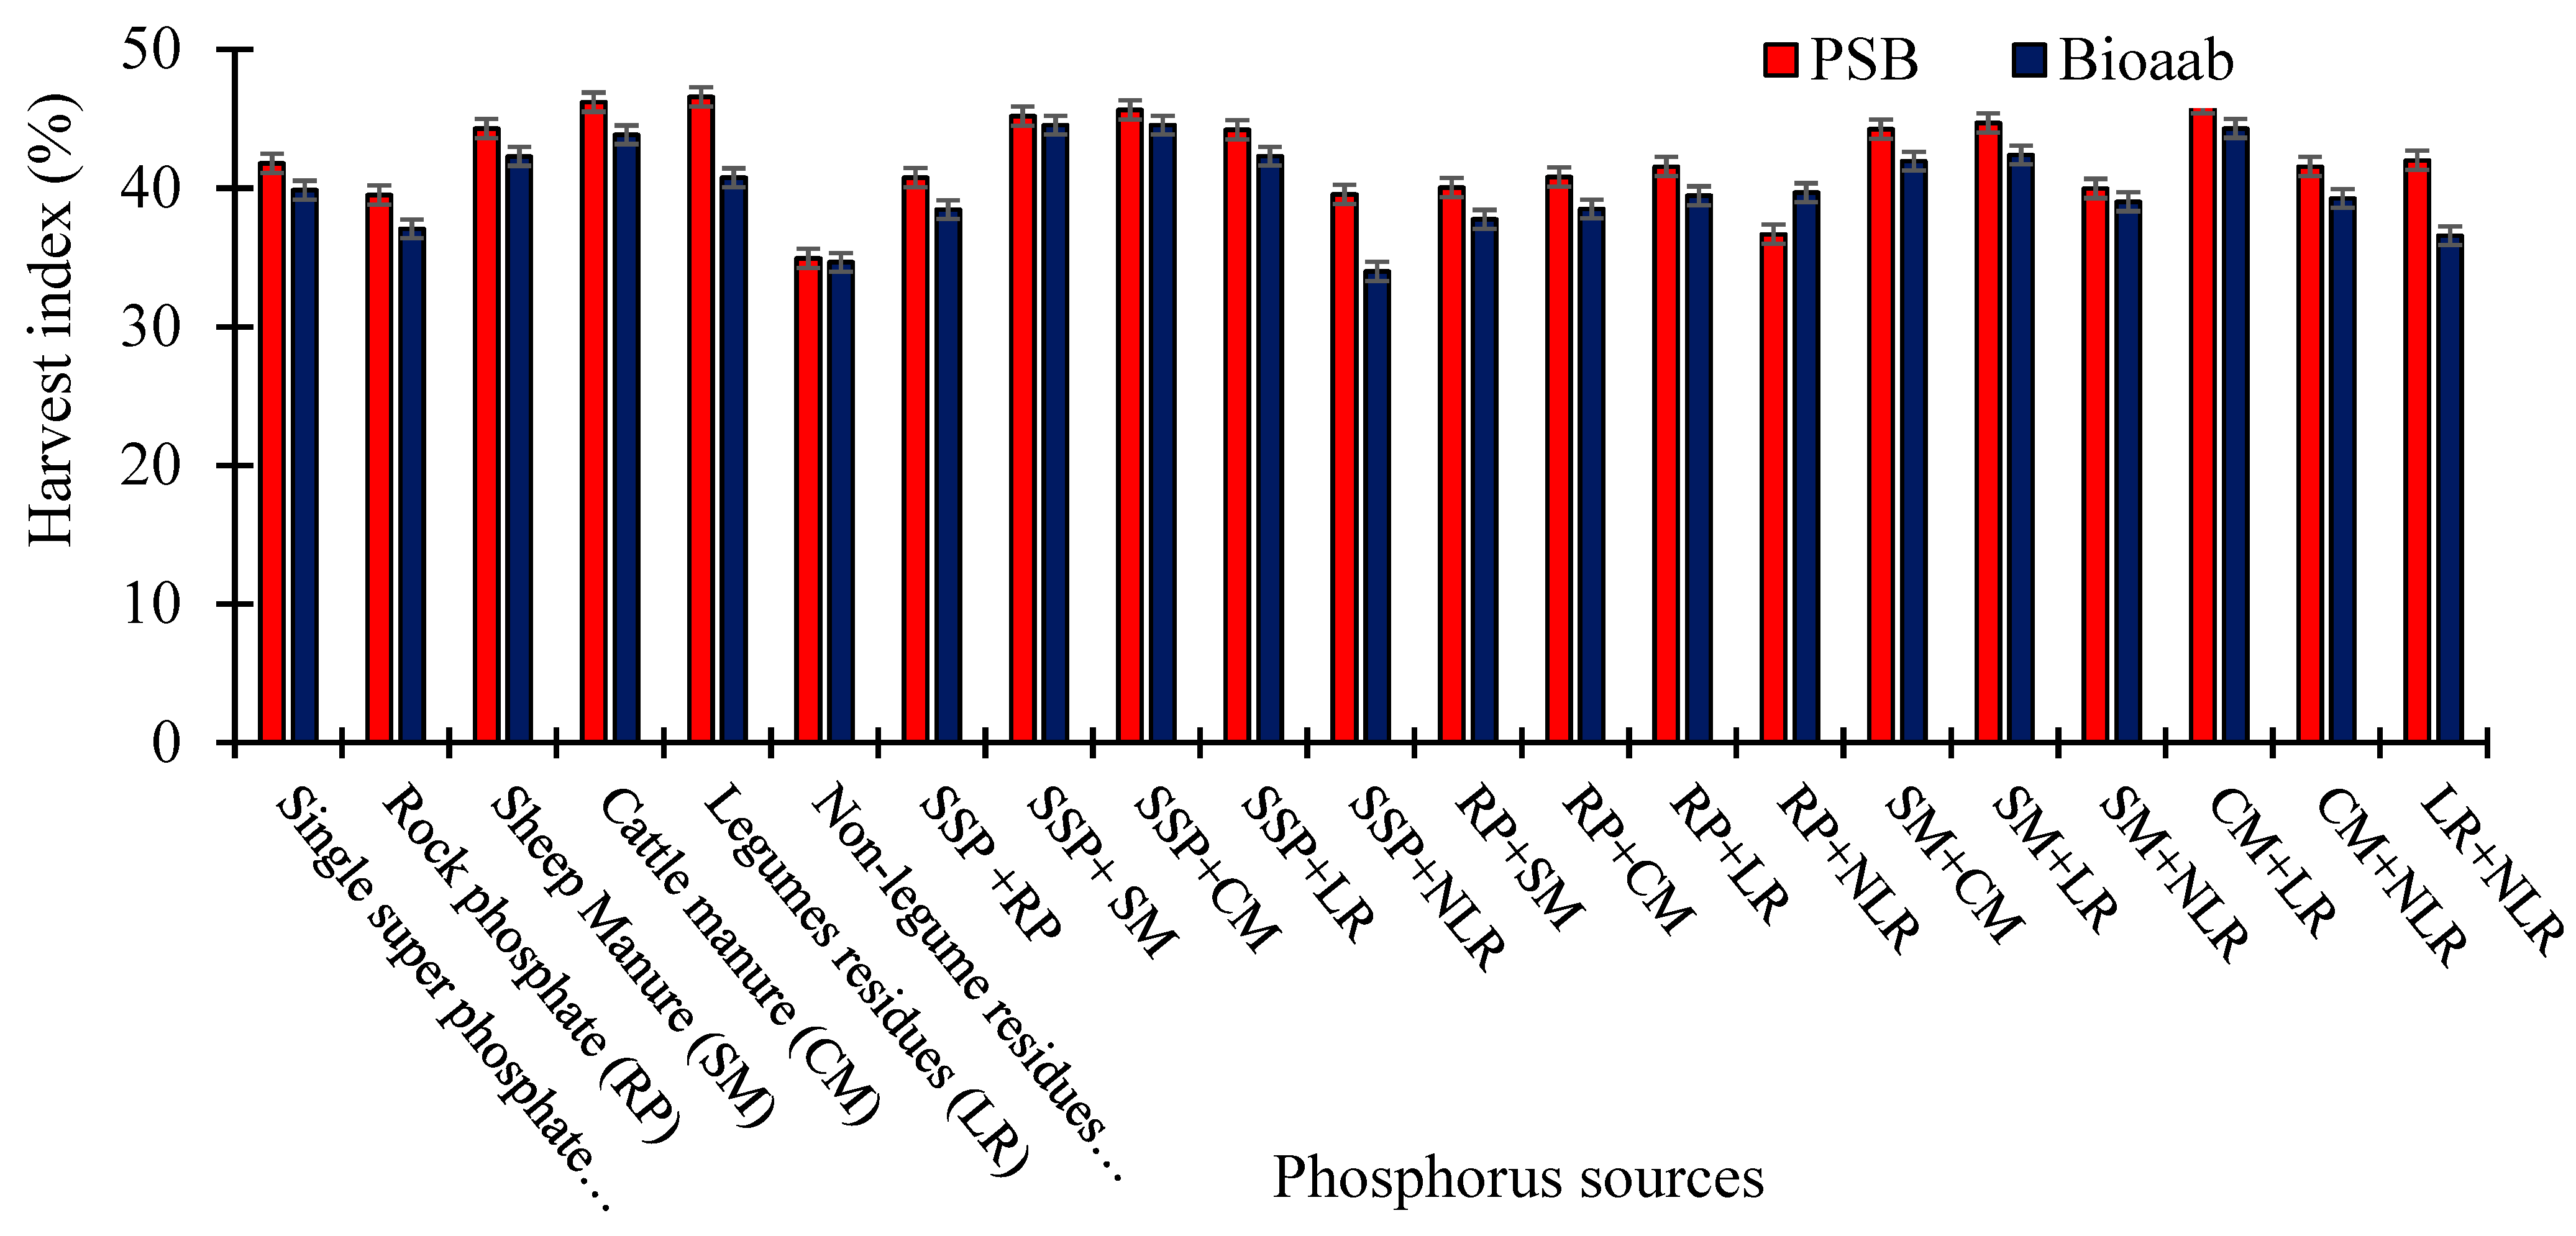
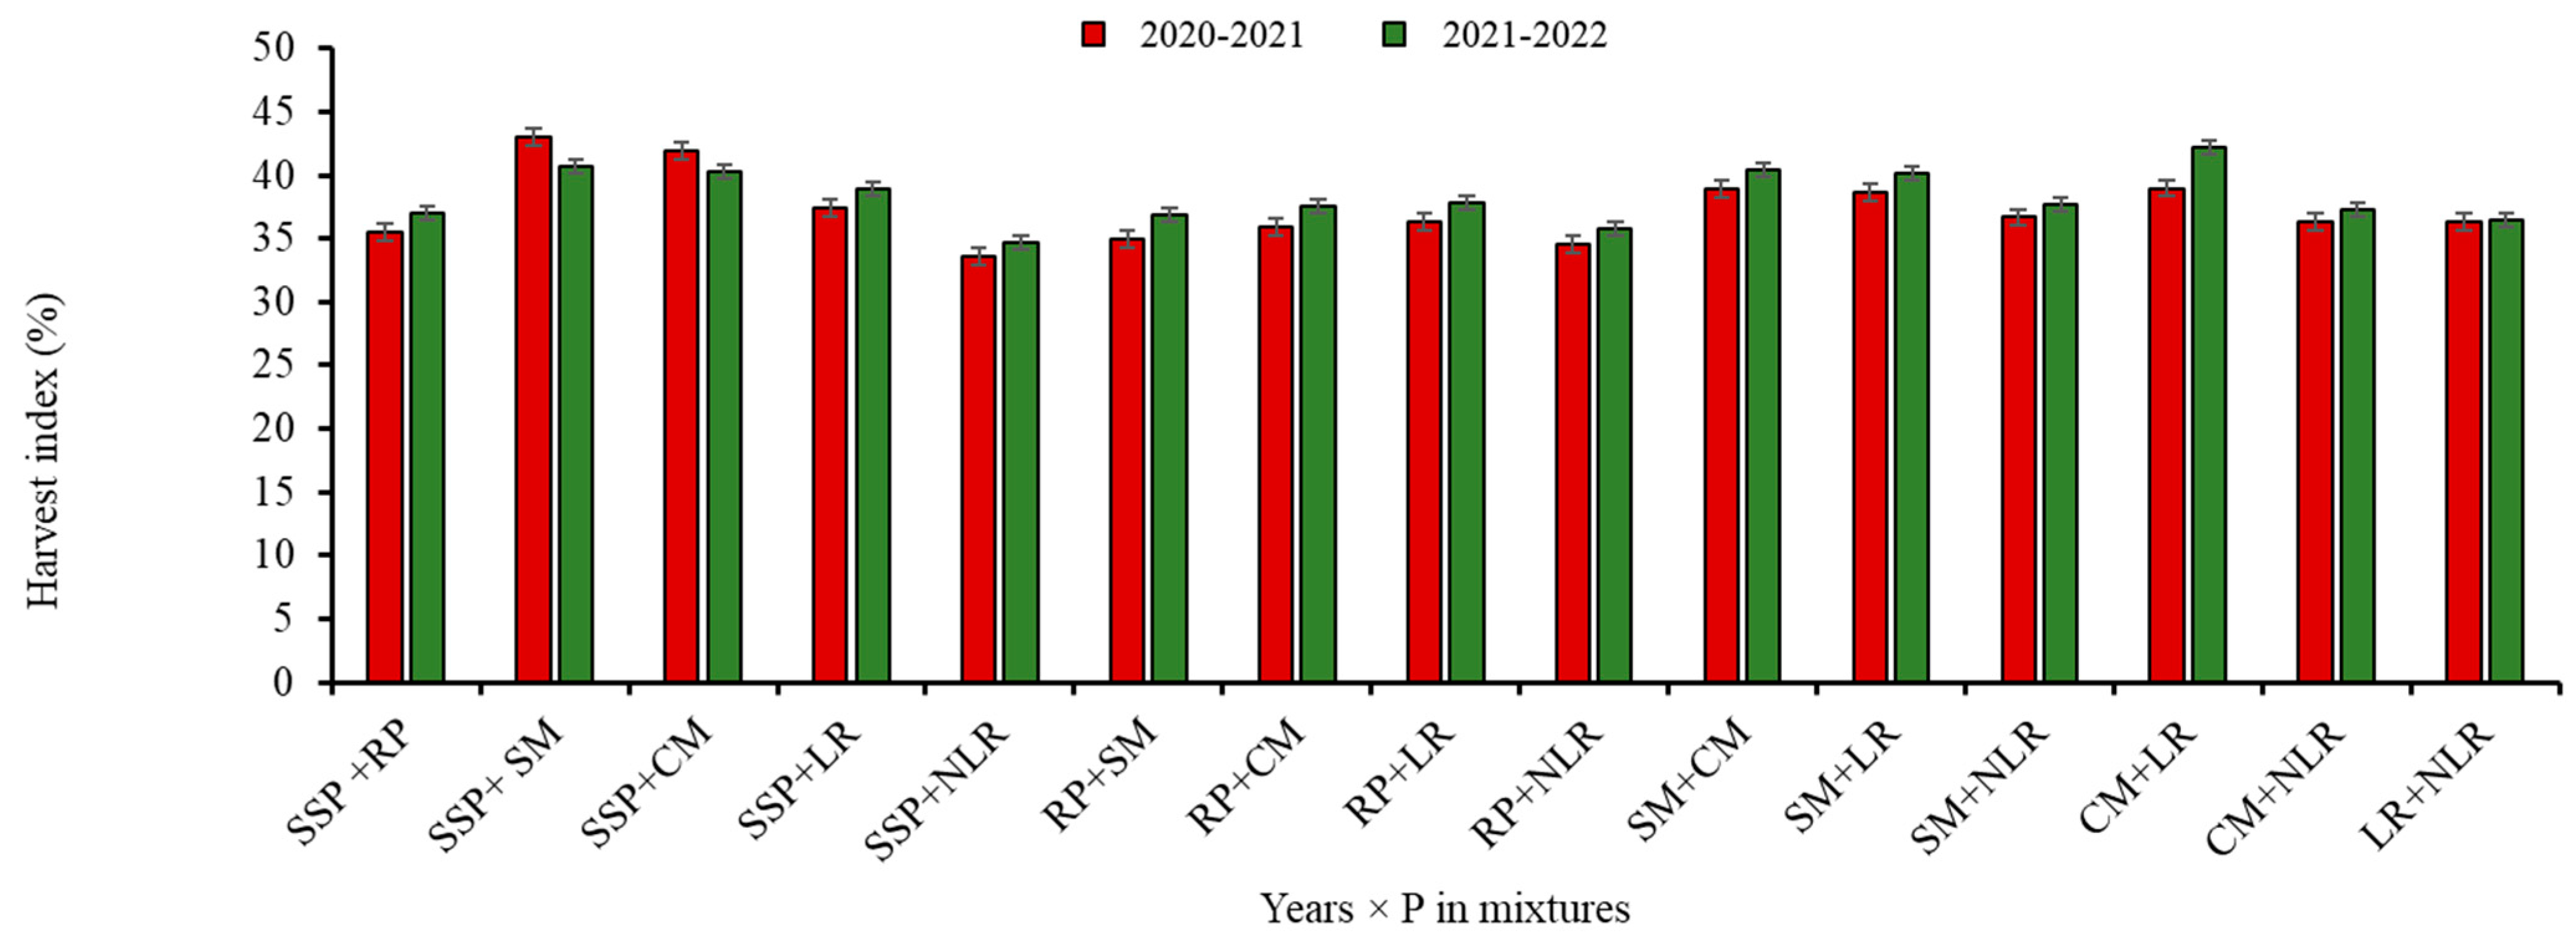
3.5. Harvest Index (%)

The average of the two years’ data indicated that the combined application of SSP+SM produced the highest HI (41.9%), followed by SSP+CM (41.1%), while the lowest HI (33.1%) was recorded with the application of NLR (Table 6). In the case of the BF, a higher HI was recorded with the application of PSB (38.4%) than Bioaab (36.8%). Additionally, a higher HI was recorded during Y2 (38.1%) than in Y1 (37.0%).
The planned mean comparison of the data showed that the rest (P-treated plots) produced a higher HI (37.6%) than the control (28.9%). On average, a higher HI was recorded with the application of PiM (37.8%) than sole PS (37.1%); however, the increase in the HI during Y1 was found to be significant, while it was non-significant in Y2. APS produced a higher HI than IPS (Table 7). Additionally, IPS produced a higher HI than PPS. APS produced a higher HI than PPS, and OPS had a higher HI than IPS. The PS × BF interaction was found to be significant. The PS × BF interaction showed that CM and LR in combination with PSB produced a higher HI than the other combinations (Figure 9). The interactive effect of the year and P in mixture revealed that the application of SSP+CM and SSP+SM produced a significantly higher HI in Y1 than all the other combinations (Figure 10).

4. Discussion

The wheat yield is commonly determined by the grain weight, number of grains spike−1, and number of spikes m−2. Our findings demonstrated that all the treated plots had significantly higher yields and yield components than the control treatment. The highest number of spikes m−2 could be the consequence of rapid growth and development as well as of more tillers m−2 due to increased P availability through the use of both organic and inorganic P sources. Higher fertilizer availability improves water usage efficiency and soil water utilization [31,32], and hence, the number of grains spike−1 in wheat increases. Both [25] and [29] observed increases in the spike m−2 and other yield-related variables of maize and wheat after seed inoculation with PSB. The use of APS produced a higher GPS than the use of IPS and PPS. The average of the two years’ data revealed that CM+LR, CM, LR produced the highest number of grains spike−1 (GPS), while NLR produced the lowest. Ref. [33] found an increase in the GPS of wheat with a combined application of NPK+ press mud and suggested NPK+ PM. The GPS in wheat increases with green manuring and poultry manure [34]. In comparison to the control treatment, both the PSB and Bioaab inoculation showed an increasing trend in GPS. These findings are corroborated by the findings of [35], who found that using biofertilizers significantly boosted the GPS in wheat. The plant nutrients and organic chemicals generated during organic matter decomposition improve crop development and yield [14]. The beneficial effect of organic manures in combination was also observed by [21]. The results are also consistent with those of [36], who reported that the application of PSB increased the nutrient availability to the plant, which increased the plant growth and yield.
In our experiment, a heavy thousand-grain weight (TGW) was recorded with the combined application of CM+SM, being on par with LR, CM, SM, SM+LR, SM+NLR and CM+LR, while the minimum TGW was obtained with rock phosphate (RP) and NLR. The combined application of DAP or TSP with CM resulted in a higher TGW than their sole application. Additionally, a higher TGW was recorded in the treated plots in comparison with the control. Ahmad et al. [37] reported that the TGW increased by using NPK+ press mud and NPK+ city compost, which supports our findings. Our findings, on the other hand, revealed that APS produced a larger TGW than IPS and PPS. Ayoola et al. [34] reported an improvement in growth and yield characteristics in maize crops when poultry manure and NPK fertilizer were used. The maximum TGW was recorded with the application of PSB rather than Bioaab. The use of efficient microorganisms may improve the efficiency of both organic and inorganic nutrient sources, resulting in enhanced wheat TGW. These findings are consistent with those of [38,39], who found that using biofertilizers increased the maize and wheat grain yield significantly.
Improvements in the grain yield (GY) of crops have been essential to feed a growing population. By increasing the GY per unit area, we can reduce the problem of food security and amount of land we use for agriculture. Our results revealed that the GY of the wheat was significantly affected by the PS and BF in both years. The noteworthy distinction in the yield between the two years was attributed to the increase in the yield components and P availability, especially in the Y2 than Y1. Over the period of addition of P sources to soils, the concentration of P increases over time [38] and so the GY increases. The maximum GY was recorded with the integrated use of SSP + SM and CM + SSP. The organic materials, especially the APS, improved the soil P content and availability, thereby increasing root development and P uptake, which led to the maximum yield. Application of P through combined organic and inorganic sources makes the nutrient in a form that is not fixed and is more available due to improved microbial activity, nutrient supply and soil health [4] and improved biomass as well as GY [40]. The release of organic acids decreases the pH of alkaline soils in a semiarid climate [41]. This meant that more P was available at our study site with a high Ca content [25]. The findings of [42] helped us come to the conclusion that using NPK along with poultry manure improved the wheat yield. Our results also showed that the GY of the wheat was a lot higher with both BF than the control treatment. The activity of the PSB increased the release of usable P by mineralizing and dissolving the different PS used [43], which caused the higher GY of the wheat. Our results are also in line with those of [44], who found that PS (5 t ha−1) + 75% NPK+ dual injection of Azotobacter + PSB made wheat grow and produce better in many ways. Ref. [45] also demonstrated that PSB with P fertilizer and organic manures positively enhanced the wheat GY. Many researchers reported that the pre-sowing inoculation of wheat seeds with BF inoculation led to an increase in the GY of different crops over non-inoculated treatments [46].
The harvest index (HI) is the ratio of the GY to BY, and it is as a measure of the reproductive efficiency of field crops. The distinction between the HI in the different treatments may be due to the variable assimilate translocation rate of toward grain development [38]. The average of two years’ data indicated that the combined application of SSP+SM produced the highest HI, followed by CM+LR, while the lowest HI was recorded with the application of NLR. The increase in the HI with the combined application of APS with SSP was attributed to the increase in the yield components and GY [25]. An increase in the wheat HI with the application of organic amendments was also reported by [47]. In the case of the BF, higher HI values were recorded with the application of PSB than Bioaab. The increase in the HI with the application of PSB over Bioaab was attributed to the increase in the yield components and GY. Additionally, the higher HI in Y2 over Y1 was also attributed to the increase in the yield components and GY in Y2 than Y1. In our experiment, the combined application of PSB with organic and inorganic P increased the GY, BY and HI [48]. Despite the advantages of organic manuring the crops, some researchers reported that bioavailable organic C, N, and P are abundant in organic manure, which provides abundant C, energy sources and substrates for microbes to flourish. This raises microbial activity, which in turn increases microbial respiration and soil CO2 flow [49]. However, organic manure that has been deeply incorporated into the soil can lower nutrient runoff and CO2 emissions [50].

5. Conclusions

The application of sole SSP, CM or SM, and the combined application of CM+SSP, SM+SSP and LR+SSP, increased the yield components (GPS, SPMS, TGW), GY and HI of the wheat crop as compared to the other P sources. The average of the 21 treated plots (applied with PS and BF) produced an 11–25% higher GPS, a 4–8% higher TGW, a 23–40% higher GY, a 5–17% higher BY, and a 39–47% higher soil P content than the control plots (no BF and no PS applied) in the case of the wheat crop. The application of animal P sources (APS) was found most beneficial in terms of the improved yield and yield components and more economic returns from the wheat crop as compared with the plant P sources (PPS). Interestingly, the combined use of organic P sources (OPS) + inorganic P sources (IPS) was found to be better in terms of the higher yield and yield components and more economic returns from the wheat crop as compared with the sole inorganic P sources. In the case of the biofertilizers, application of PSB increased the yield components (GPS, SPMS, TGW), GY, and HI as compared to Bioaab. The yield and yield components were higher in Y2 due to more P availability and uptake compared to Y1, which indicated that continuous application of P, especially OPS or PiM (P in mixture), could increase soil fertility and crop productivity on a sustainable basis. Therefore, application of sole organic sources (SM or CM or LR) or combined use of organic sources with SSP (SM + SSP or CM + SSP or LR + SSP) along with PSB inoculation can be recommended for improving soil fertility, phosphorus use efficiency, crop productivity and profitability in wheat–maize cropping systems.

Author Contributions

A. designed and supervised the research project and revised the manuscript. N. carried out the lab and field studies, carried out the statistical analysis, wrote the draft paper, and made the figures and tables. D.M. and M.A. helped with the lab analysis and correction. All authors have read and agreed to the published version of the manuscript.

Funding

This research received no external funding.

Institutional Review Board Statement

Not applicable.

Informed Consent Statement

Not applicable.

Data Availability Statement

All the data obtained and recorded in this research project will appear online on the website of the Higher Education Commission (HEC) of Islamabad after the award of a Ph.D. degree to the scholar (Miss Nadia).

Acknowledgments

We acknowledge the Department of Agronomy, University of Agriculture, Peshawar for providing technical support. We also acknowledge Shah Khalid for the statistical analysis and making the figures.

Conflicts of Interest

The authors declare no conflict of interest.

References

  1. Shahbaz, M.; Fatima, N.; Mashwani, Z.-u.-R.; Akram, A.; Haq, E.u.; Mehak, A.; Abasi, F.; Ajmal, M.; Yousaf, T.; Raja, N.I. Effect of Phytosynthesized Selenium and Cerium Oxide Nanoparticles on Wheat (Triticum aestivum L.) against Stripe Rust Disease. Molecules 2022, 27, 8149. [Google Scholar] [CrossRef] [PubMed]
  2. Government of Pakistan. Economic Survey of Pakistan. 2021; pp. 17–40. Available online: https://www.finance.gov.pk/survey/chapter_22/PES02-AGRICULTURE.pdf (accessed on 22 May 2023).
  3. An, X.; Liu, J.; Liu, X.; Ma, C.; Zhang, Q. Optimizing phosphorus application rate and the mixed inoculation of arbuscular mycorrhizal fungi and phosphate-solubilizing bacteria can improve the phosphatase activity and organic acid content in alfalfa soil. Sustainability 2022, 14, 11342. [Google Scholar] [CrossRef]
  4. Li, H.; Li, Y.; Xu, Y.; Lu, X. Biochar phosphorus fertilizer effects on soil phosphorus availability. Chemosphere 2020, 244, 125471. [Google Scholar] [CrossRef] [PubMed]
  5. Fertahi, S.; Bertrand, I.; Amjoud, M.B.; Oukarroum, A.; Arji, M.; Barakat, A. Properties of coated slow-release triple superphosphate (TSP) fertilizers based on lignin and carrageenan formulations. ACS Sustain. Chem. Eng. 2019, 7, 10371–10382. [Google Scholar] [CrossRef]
  6. Tórz, A.; Burda, M.; Półgęsek, M.; Sadowski, J.; Nędzarek, A. Transformation of phosphorus in an experimental integrated multitrophic aquaculture system using the media filled beds method in plant cultivation. Aquac. Environ. Interact. 2022, 14, 1–14. [Google Scholar] [CrossRef]
  7. Zheng, X.; Jiang, Z.; Ying, Z.; Ye, Y.; Chen, W.; Wang, B.; Dou, B. Migration and transformation of phosphorus during hydrothermal carbonization of sewage sludge: Focusing on the role of pH and calcium additive and the transformation mechanism. ACS Sustain. Chem. Eng. 2020, 8, 7806–7814. [Google Scholar] [CrossRef]
  8. Liu, J.; Li, C.-Y.; Xing, Y.-W.; Wang, Y.; Xue, Y.-L.; Wang, C.-R.; Dang, T.-H. Effects of long-term fertilization on soil organic phosphorus fractions and wheat yield in farmland of Loess Plateau. J. Appl. Ecol. 2020, 31, 157–164. [Google Scholar]
  9. Amanullah; Asif, M.; Almas, L.K.; Jan, A.; Shah, Z.; Rahman, H.u.; Khalil, S.K. Agronomic efficiency and profitability of P-fertilizers applied at different planting densities of maize in Northwest Pakistan. J. Plant Nutr. 2012, 35, 331–341. [Google Scholar] [CrossRef]
  10. Reddy, K.R.; Vardanyan, L.; Hu, J.; Villapando, O.; Bhomia, R.K.; Smith, T.; Harris, W.G.; Newman, S. Soil phosphorus forms and storage in stormwater treatment areas of the Everglades: Influence of vegetation and nutrient loading. Sci. Total Environ. 2020, 725, 138442. [Google Scholar] [CrossRef]
  11. Reddy, K.R.; Hu, J.; Villapando, O.; Bhomia, R.K.; Vardanyan, L.; Osborne, T. Long-term accumulation of macro- and secondary elements in subtropical treatment wetlands. Ecosphere 2021, 12, e03787. [Google Scholar] [CrossRef]
  12. Yadav, K.K.; Sarkar, S. Biofertilizers, impact on soil fertility and crop productivity under sustainable agriculture. Environ. Ecol. 2019, 37, 89–93. [Google Scholar]
  13. Jyothi, V.; Basaiah, T. Isolation and Characterization of Phosphofungi—Aspergillus niger from Rhizosphere Soil to Supplement Phospho-biofertilizer. Res. Sq. 2022, 1–16. [Google Scholar] [CrossRef]
  14. Marimuthu, S.; Gnanachitra, M.; Prabu Kumar, G.; Surendran, U. Effect of organic and inorganic sources of phosphorus for enhancing productivity and phosphorus use efficiency in blackgram under acid soils. J. Plant Nutr. 2022, 46, 1845–1855. [Google Scholar] [CrossRef]
  15. Timofeeva, A.; Galyamova, M.; Sedykh, S. Prospects for using phosphate-solubilizing microorganisms as natural fertilizers in agriculture. Plants 2022, 11, 2119. [Google Scholar] [CrossRef] [PubMed]
  16. Sharma, S.B. Trend setting impacts of organic matter on soil physico-chemical properties in traditional vis-a-vis chemical-based amendment practices. PLOS Sustain. Transform. 2022, 1, e0000007. [Google Scholar] [CrossRef]
  17. Adnan, M.; Fahad, S.; Saleem, M.H.; Ali, B.; Mussart, M.; Ullah, R.; Arif, M.; Ahmad, M.; Shah, W.A.; Romman, M. Comparative efficacy of phosphorous supplements with phosphate solubilizing bacteria for optimizing wheat yield in calcareous soils. Sci. Rep. 2022, 12, 11997. [Google Scholar] [CrossRef]
  18. Xu, H.; Lv, J.; Yu, C. Combined phosphate-solubilizing microorganisms jointly promote Pinus massoniana growth by modulating rhizosphere environment and key biological pathways in seedlings. Ind. Crops Prod. 2023, 191, 116005. [Google Scholar] [CrossRef]
  19. Ali, W.; Ali, M.; Iqbal, J.; Khalil, M.; Ahmad, Z. Impact of zinc and organic manure on wheat productivity and soil fertility. Adv. Crop Sci. Technol. 2019, 7, 414. [Google Scholar] [CrossRef]
  20. Khalid, S.; Al-Tawaha, A.R.M.; Thangadurai, D.; Sangeetha, J.; Khanum, S.; Turk, M.; Alatrash, H.; Lone, S.; Hussain, K.; Saranraj, P. The Role of Organic Mulching and Tillage in Organic Farming. In Organic Farming for Sustainable Development; Apple Academic Press: Waretown, NJ, USA, 2023; pp. 259–276. [Google Scholar]
  21. Khalid, S.; Khan, H.A.; Arif, M.; Altawaha, A.R.; Adnan, M.; Fahad, S.; Parmar, B. Organic matter management in cereals based system: Symbiosis for improving crop productivity and soil health. Sustain. Agric. Rev. 2019, 29, 67–92. [Google Scholar]
  22. Terek, J.; Dobrovič, J. Ecologically active surface, the basis for the study and evaluation of ecological functions. Ekológia 2015, 34, 207–215. [Google Scholar] [CrossRef]
  23. Shanware, A.S.; Taiwade, L.H. Nano-biofertilizers: Progressive evolution for sustainable agriculture. Biol. Sci. 2022, 2, 166–171. [Google Scholar] [CrossRef]
  24. Cui, K.; Xu, T.; Chen, J.; Yang, H.; Liu, X.; Zhuo, R.; Peng, Y.; Tang, W.; Wang, R.; Chen, L. Siderophores, a potential phosphate solubilizer from the endophyte Streptomyces sp. CoT10, improved phosphorus mobilization for host plant growth and rhizosphere modulation. J. Clean. Prod. 2022, 367, 133110. [Google Scholar] [CrossRef]
  25. Amanullah, K.S. Phenology, growth and biomass yield response of maize (Zea mays L.) to integrated use of animal manures and phosphorus application with and without phosphate solubilizing bacteria. J. Microb. Biochem. Technol. 2015, 7, 439–444. [Google Scholar]
  26. Viruel, E.; Erazzú, L.E.; Martínez Calsina, L.; Ferrero, M.A.; Lucca, M.E.; Siñeriz, F. Inoculation of maize with phosphate solubilizing bacteria: Effect on plant growth and yield. J. Soil Sci. Plant Nutr. 2014, 14, 819–831. [Google Scholar] [CrossRef]
  27. Rebi, A.; Zhou, J.; Aslam, S.; Ahmad, M.I.; Noor, K. Uptake of phosphorus by maize plant and availability in soil with inoculated pgpr from rock phosphate. Ann. For. Res. 2022, 65, 7333–7351. [Google Scholar]
  28. Amarasinghe, T.; Madhusha, C.; Munaweera, I.; Kottegoda, N. Review on Mechanisms of Phosphate Solubilization in Rock Phosphate Fertilizer. Commun. Soil Sci. Plant Anal. 2022, 53, 944–960. [Google Scholar] [CrossRef]
  29. Amanullah; Khalid, S.; Muhammad, A.; Yar, M.; Ahmad, M.; Akram, H.M.; Imran; Al-Tawaha, A.R.M.; Ullah, S.; Ali, I. Integrated use of biofertlizers with organic and inorganic phosphorus sources improve dry matter partitioning and yield of hybrid maize. Commun. Soil Sci. Plant Anal. 2021, 52, 2732–2747. [Google Scholar] [CrossRef]
  30. Steel, R.G.D.; Torrie, J.H.; Dickey, D.A. Principles and Procedures of Statistics: A Biometrical Approach; McGraw-Hill: New York, NY, USA, 1997. [Google Scholar]
  31. Deng, B.; Tammeorg, P.; Luukkanen, O.; Helenius, J.; Starr, M. Effects of Acacia seyal and biochar on soil properties and sorghum yield in agroforestry systems in South Sudan. Agrofor. Syst. 2017, 91, 137–148. [Google Scholar] [CrossRef]
  32. Amanullah; Shah, K.; Khalil, F. Influence of irrigation regimes on competition indexes of winter and summer intercropping system under semi-arid regions of Pakistan. Sci. Rep. 2020, 10, 8129. [Google Scholar] [CrossRef]
  33. Ahmad, M.; Afzal, M.; Ahmad, A.; Ahmad, A.; Azeem, M. Role of organic and inorganic nutrient sources in improving wheat crop production. Cercet. Agron. Mold. 2013, 153, 15–20. [Google Scholar] [CrossRef]
  34. Ayoola, O.; Adeniyan, O. Influence of poultry manure and NPK fertilizer on yield and yield components of crops under different cropping systems in south west Nigeria. Afr. J. Biotechnol. 2006, 5, 1386–1392. [Google Scholar]
  35. Daniel, A.I.; Fadaka, A.O.; Gokul, A.; Bakare, O.O.; Aina, O.; Fisher, S.; Burt, A.F.; Mavumengwana, V.; Keyster, M.; Klein, A. Biofertilizer: The future of food security and food safety. Microorganisms 2022, 10, 1220. [Google Scholar] [CrossRef]
  36. Sang, Y.; Jin, L.; Zhu, R.; Yu, X.-Y.; Hu, S.; Wang, B.-T.; Ruan, H.-H.; Jin, F.-J.; Lee, H.-G. Phosphorus-Solubilizing Capacity of Mortierella Species Isolated from Rhizosphere Soil of a Poplar Plantation. Microorganisms 2022, 10, 2361. [Google Scholar] [CrossRef] [PubMed]
  37. Ahmad, A.; Wahid, A.; Khalid, F.; Fiaz, N.; Zamir, M. Impact of organic and inorganic sources of nitrogen and phosphorus fertilizers on growth, yield and quality of forage oat (Avena sativa L.). Cercet. Agron. Mold. 2011, 44, 39–49. [Google Scholar] [CrossRef]
  38. Amanullah; Iqbal, A.; Khan, A.; Khalid, S.; Shah, A.; Parmar, B.; Khalid, S.; Muhammad, A. Integrated management of phosphorus, organic sources, and beneficial microbes improve dry matter partitioning of maize. Commun. Soil Sci. Plant Anal. 2019, 50, 2544–2569. [Google Scholar] [CrossRef]
  39. Khan, M.S.; Zaidi, A.; Ahmad, E. Mechanism of phosphate solubilization and physiological functions of phosphate-solubilizing microorganisms. In Phosphate Solubilizing Microorganisms; Springer: Berlin/Heidelberg, Germany, 2014; pp. 31–62. [Google Scholar]
  40. Endris, S. Combined application of phosphorus fertilizer with Tithonia biomass improves grain yield and agronomic phosphorus use efficiency of hybrid maize. Int. J. Agron. 2019, 2019, 6167384. [Google Scholar] [CrossRef]
  41. Ananthi, T.; Vennila, C. Influence of Organic Manures and Synthetic Fertilizers on Nutrient Uptake and Yield of Fodder Maize. Madras Agric. J. 2023, 109, 107–112. [Google Scholar]
  42. Abbas, G.; Khattak, J.; Mir, A.; Ishaque, M.; Hussain, M.; Wahedi, H.; Ahmed, M.; Ullah, A. Effect of organic manures with recommended dose of NPK on the performance of wheat (Triticum aestivum L.). J. Anim. Plant. Sci. 2012, 22, 683–687. [Google Scholar]
  43. Sharif, M.; Khan, M.; Khan, M.A.; Wahid, F.; Marwat, K.; Khattak, A.; Naseer, M. Effect of rock phosphate and farmyard manure applied with effective microorganisms on the yield and nutrient uptake of wheat and sunflower crops. Pak. J. Bot. 2015, 47, 219–226. [Google Scholar]
  44. Chopra, R.; Sharma, M.; Sharma, S.; Nepalia, V.; Jain, H.; Singh, A. Effect of integrated nutrient management on growth and yield of wheat (Triticum aestivum L.) in Haplustepts. Ind. J. Sci. Nat. 2016, 7, 622–628. [Google Scholar]
  45. Afzal, A.; Bano, A. Rhizobium and phosphate solubilizing bacteria improve the yield and phosphorus uptake in wheat (Triticum aestivum). Int. J. Agric. Biol. 2008, 10, 85–88. [Google Scholar]
  46. Sial, N.A.; Abro, S.A.; Abbas, M.; Irfan, M.; Depar, N. Growth and yield of wheat as affected by phosphate solubilizing bacteria and phosphate fertilizer. Pak. J. Biotechnol. 2018, 15, 475–479. [Google Scholar]
  47. Hammad, H.M.; Khaliq, A.; Ashfaq, A.; Aslam, M.; Malik, A.H.; Farhad, W.; Laghari, K. Influence of different organic manures on wheat productivity. Int. J. Agric. Biol. 2011, 13, 137–140. [Google Scholar]
  48. Zafar, M.; Abbasi, M.K.; Khaliq, A. Effect of different phosphorus sources on the growth, yield, energy content and phosphorus utilization efficiency in maize at Rawalakot Azad Jammu and Kashmir, Pakistan. J. Plant Nutr. 2013, 36, 1915–1934. [Google Scholar] [CrossRef]
  49. Hu, J.; Miles, D.M.; Adeli, A.; Brooks, J.P.; Podrebarac, F.A.; Smith, R.; Lei, F.; Li, X.; Jenkins, J.N.; Moorhead, R.J. Effects of Cover Crops and Soil Amendments on Soil CO2 Flux in a Mississippi Corn Cropping System on Upland Soil. Environments 2023, 10, 19. [Google Scholar] [CrossRef]
  50. Sistani, K.R.; Torbert, H.A.; Way, T.R.; Bolster, C.H.; Pote, D.H.; Warren, J.G. Broiler Litter Application Method and Runoff Timing Effects on Nutrient and Escherichia coli Losses from Tall Fescue Pasture. J. Environ. Qual. 2009, 38, 1216–1223. [Google Scholar] [CrossRef]
Figure 1. Daily maximum and minimum temperature (°C) and rainfall (mm) at the experimental site during November 2020 to April 2021.
Agriculture 13 01118 g001
Figure 2. Daily maximum and minimum temperature (°C) and rainfall (mm) at the experimental site during November 2021 to April 2022.
Agriculture 13 01118 g002
Figure 3. Interactive effect of the year and BF on the spikes m−2 of wheat.
Agriculture 13 01118 g003
Figure 4. Interactive effect of the year and P in the mixture on the spikes m−2 of wheat.
Agriculture 13 01118 g004
Figure 5. Interactive effect of biofertilizers and phosphorus sources on the grains spike−1 of wheat.
Agriculture 13 01118 g005
Figure 6. Interactive effect of the year and sole phosphorus sources on the grains spike−1 of wheat.
Agriculture 13 01118 g006
Figure 7. Interactive effect of phosphorus sources and biofertilizers on the grain yield (kg ha−1) of wheat.
Agriculture 13 01118 g007
Figure 8. Interactive effect of the year and P in mixture on the grain yield (kg ha−1) of wheat.
Agriculture 13 01118 g008
Figure 9. Interactive effect of phosphorus sources and biofertilizers on the harvest index (%) of wheat.
Agriculture 13 01118 g009
Figure 10. Interactive effect of the year and P in mixture on the harvest index (%) of wheat.
Agriculture 13 01118 g010
Table 1. Twenty-one different combinations of organic and inorganic phosphorus sources used in the study at the required rate of 90 kg P ha−1 (Factor A).
Phosphorus SourcesTreatmentsInorganic P SourcesOrganic P Sources
SSPRPSMCMLRNLR
19000000
20900000
Sole P sources30090000
40009000
50000900
60000090
Inorganic + organic P sources745450000
845045000
945004500
1045000450
1145000045
1204545000
1304504500
1404500450
1504500045
1600454500
Animal + plant P sources1700450450
1800450045
1900045450
2000045045
2100004545
Note: One control treatment (no P and no BF were applied) was also included in each replication for comparison. SSP stands for single super phosphate, RP stands for rock phosphate, CM stands for cattle manure, SM stands for sheep manure, LR stands for legume residues, and NLR stands for non-legume residues.
Table 2. Chemical properties of animal and plant phosphorus sources used in the study.
NutrientsSheep
Manure
Cattle
Manure
Legume
Residues
(Cowpea)
Non-Legume
Residues
(Maize)
N (%)1.211.110.720.52
P (%)1.011.010.500.31
Table 3. Number of spikes m−2, grains spike−1, thousand-grain weight (g), grain yield (kg ha−1) and harvest index (%) of wheat as affected by phosphorus sources and biofertilizers.
Phosphorus Sources (PS)No. of Spikes m−2Grains Spike−1Thousand-Grain Weight (g)Grain
Yield (kg ha−1)
Harvest Index (%)
Single super phosphate (SSP)282bc41d35.4ab3335d37.1de
Rock phosphate (RP)279cd38g35.3c3058f35.0d
Sheep manure (SM)286ab43c36.4ab3569c39.0c
Cattle manure (CM)284b45a36.3ab3808ab40.2bc
Legume residues (LR)277de44b36.5a3529c38.4cd
Non-legume residues (NLR)275e35i35.5bc2749g33.1f
SSP+RP282bc40e35.2c3264de36.3de
SSP+SM287a45a35.4bc3843a41.9a
SSP+CM283bc45a35.6bc3834ab41.1ab
SSP+LR278d43c35.2c3534c38.1cd
SSP+NLR280cd37h35.4bc2980f34.1f
RP+SM282bc39f35.6bc3217e36.0de
RP+CM283bc40e35.9b3333de36.8de
RP+LR282bc41d35.7bc3371de37.0de
RP+NLR280cd38g35.5ab3112e35.2d
SM+CM285ab43c36.6a3764ab39.6bc
SM+LR280cd44b36.5ab3720b39.4bc
SM+NLR281c39f36.0ab3301cd37.2d
CM+LR279cd45a36.2ab3777ab40.6b
CM+NLR279cd40e35.8bc3332de36.8de
LR+NLR277de39f36.0ab3267de36.4de
LSD (0.05) for PS3.2 2 0.7 117 1.2
Biofertilizers (BF)
PSB282a42a36.1a3562 38.4
Bioaab280b40b35.5b3267 36.8
LSD (0.05) for BF1 1 0.2 36 0.4
Years (Y)
2020–2021280 40b35.6 3303 37.0
2021–2022282 43a36.0 3525 38.1
Sig. (at 5% probability)ns ** ns ** **
Means of the same category followed by different letters are significantly different at 5% level of probability using LSD test. ** = significant at 1% probability. ns = non-significant.
Table 4. Planned mean comparisons of the spikes m−2 and grains spike−1 of wheat as affected by phosphorus sources and biofertilizers.
Planned Mean ComparisonsNo. of Spikes m−2No. of Grains Spike−1
Control vs. RestYears (Y)MeanYears (Y)Mean
2020–20212021–20222020–20212021–2022
Control (no P and no BF applied)271277274343534
Rest (treated plots)280282281404341
Sig. (at 5% probability)***********
Sole PS vs. PiM
Sole PS280281280394341
P in mixture (PiM)280283281404341
Sig. (at 5% probability)nsnsnsnsnsns
IPS vs. APS
Inorganic P sources (IPS)279282280384240
Animal P sources (APS)285285285434544
Sig. (at 5% probability)**ns********
IPS vs. PPS
Inorganic P sources (IPS)279282280384240
Plant P sources (PPS)275277276374139
Sig. (at 5% probability)*****nsnsns
APS vs. PPS
Animal P sources (APS)285285285434544
Plant P sources (PPS)275277276374139
Sig. (at 5% probability)************
IPS vs. OPS
Inorganic P sources (IPS)279282280384240
Organic P sources (OPS)280281280404342
Sig. (at 5% probability)nsnsns******
Interactions
PS × BF nsPS × BF **
Y × Control vs. Rest nsY × Control vs. Restns
Y × Sole PS vs. PiM **Y × Sole PS vs. PiM**
Y × PS nsY × PS ns
Y × PPS nsY × PPS **
Y × PiM *Y × PiMns
Y × IPS vs. APS nsY × IPS vs. APSns
Y × IPS vs. PPS nsY × IPS vs. PPSns
Y × APS vs. PPS nsY × APS vs. PPS*
Y × IPS vs. OPS nsY × IPS vs. OPSns
Y × BF *Y × BF ns
Y × PS × BF nsY × PS × BFns
* = significant at 5% probability. ** = significant at 1% probability. ns = non-significant. IPS = inorganic phosphorus sources. Sole PS = sole phosphorus sources. APS = animal phosphorus sources. PPS = plant phosphorus sources. PS = phosphorus sources. PiM = phosphorus in mixture.
Table 5. Planned mean comparisons of the thousand-grain weight (g) and grain yield (kg ha−1) of wheat as affected by phosphorus sources and biofertilizers.
Planned Mean Comparisons1000-Grain Weight (g)Grain Yield (kg ha−1)
Control vs. RestYears (Y)MeanYears (Y)Mean
2020–20212021–20222020–20212021–2022
Control (no P and no BF applied)34.033.033.5b228722562272b
Rest (treated plots)35.636.035.8a330335253414a
Sig. (at 5% probability)************
Sole PS vs. PiM
Sole PS35.836.035.9324134413341b
P in mixture (PiM)35.636.035.8332835593443a
Sig. (at 5% probability)nsnsns******
IPS vs. APS
Inorganic P sources (IPS)35.135.435.2b306833263197b
Animal P sources (APS)36.536.336.4a364037363688a
Sig. (at 5% probability)***********
IPS vs. PPS
Inorganic P sources (IPS)35.135.435.2b306833263197
Plant P sources (PPS)35.836.236.0a301632623139
Sig. (at 5% probability)****nsnsns
APS vs. PPS
Animal P sources (APS)36.536.336.4364037363688a
Plant P sources (PPS)35.836.236.0301632623139b
Sig. (at 5% probability)*nsns******
IPS vs. OPS
Inorganic P sources (IPS)35.135.435.2b306833263197b
Organic P sources (OPS)36.236.336.2a332834993414a
Sig. (at 5% probability)************
Interactions
PS × BF ns PS × BF **
Y × Control vs. Rest ns Y × Control vs. Rest*
Y × Sole PS vs. PiM ** Y × Sole PS vs. PiM**
Y × PS ns Y × PS ns
Y × PPS ns Y × PPS ns
Y × PiM ns Y × PiM*
Y × IPS vs. APS ns Y × IPS vs. APSns
Y × IPS vs. PPS ns Y × IPS vs. PPSns
Y × APS vs. PPS ns Y × APS vs. PPSns
Y × IPS vs. OPS ns Y × IPS vs. OPSns
Y × BF ns Y × BF ns
Y × PS × BF ns Y × PS × BFns
Means of the same category followed by different letters are significantly different at 5% level of probability using LSD test. * = significant at 5% probability. ** = significant at 1% probability. ns = non-significant. IPS = inorganic phosphorus sources. Sole PS = sole phosphorus sources. APS = animal phosphorus sources. PPS = plant phosphorus sources. PS = phosphorus sources. PiM = phosphorus in mixture.
Table 6. Harvest index (%) of wheat as affected by phosphorus sources and biofertilizers.
Phosphorus Sources (PS)YearsMean
2020–20212021–2022
Single super phosphate (SSP)36.937.337.1de
Rock phosphate (RP)34.135.935.0d
Sheep manure (SM)38.939.139.0c
Cattle manure (CM)39.441.140.2bc
Legume residues (LR)36.840.038.4cd
Non-legume residues (NLR)32.633.533.1f
SSP+RP35.537.036.3de
SSP+SM43.040.841.9a
SSP+CM42.040.341.1ab
SSP+LR37.438.938.1cd
SSP+NLR33.634.634.1f
RP+SM35.036.936.0de
RP+CM35.937.636.8de
RP+LR36.337.837.0de
RP+NLR34.635.835.2d
SM+CM38.940.439.6bc
SM+LR38.640.139.4bc
SM+NLR36.737.737.2d
CM+LR39.042.340.6b
CM+NLR36.337.236.8de
LR+NLR36.436.536.4de
LSD (0.05) for PS1.52.11.2
Biofertilizers (BF)
PSB37.839.038.4
Bioaab36.337.336.8
LSD (0.05) for BF0.50.60.4
Years
2020–2021 37.0
2021–2022 38.1
Significance (at 5% probability) **
Means of the same category followed by different letters are significantly different at 5% level of probability using LSD test. ** = significant at 1% probability.
Table 7. Planned mean comparisons of the harvest index (%) of wheat as affected by phosphorus sources and biofertilizers.
Planned Mean Comparisons
Control vs. RestYearsMean
2020–20212021–2022
Control (no P and no BF applied)29.228.728.9 b
Rest (treated plots)37.038.137.6 a
Significance (at 5% probability)******
Sole PS vs. PiM
Sole PS36.537.837.1 b
P in mixture (PiM)37.338.337.8 a
Significance (at 5% probability)**ns**
IPS vs. APS
Inorganic P sources (IPS)35.536.636.1 b
Animal P sources (APS)39.240.139.6 a
Significance (at 5% probability)******
IPS vs. PPS
Inorganic P sources (IPS)35.536.636.1
Plant P sources (PPS)34.736.735.7
Significance (at 5% probability)nsnsns
APS vs. PPS
Animal P sources (APS)39.240.139.6 a
Plant P sources (PPS)34.736.735.7 b
Significance (at 5% probability)******
IPS vs. OPS
Inorganic P sources (IPS)35.536.636.1 b
Organic P sources (OPS)36.938.437.7 a
Significance (at 5% probability)******
Interactions
PS × BF**Y × IPS vs. APSns
Y × Control vs. RestnsY × IPS vs. PPSns
Y × Sole PS vs. PiM**Y × APS vs. PPSns
Y × PSnsY × IPS vs. OPSns
Y × PPSnsY × BFns
Y × PiM**Y × PS × BFns
Means of the same category followed by different letters are significantly different at 5% level of probability using LSD test. ** = significant at 1% probability. ns = non-significant. IPS = inorganic phosphorus sources. Sole PS = sole phosphorus sources. APS = animal phosphorus sources. PPS = plant phosphorus sources. PS = phosphorus sources. PiM = phosphorus in mixture.
Disclaimer/Publisher’s Note: The statements, opinions and data contained in all publications are solely those of the individual author(s) and contributor(s) and not of MDPI and/or the editor(s). MDPI and/or the editor(s) disclaim responsibility for any injury to people or property resulting from any ideas, methods, instructions or products referred to in the content.

