Article

Application of Computational Intelligence in Describing Dust Emissions in Different Soil Tillage Applications in Middle Anatolia

by
Kazım Çarman
1,†,
Alper Taner
2,†,
Fariz Mikailsoy
3,
Kemal Çağatay Selvi
2,
Nicoleta Ungureanu
4,* and
Nicolae-Valentin Vlăduț
5,*
1
Department of Agricultural Machinery and Technologies Engineering, Faculty of Agriculture, Selçuk University, 42250 Konya, Turkey
2
Department of Agricultural Machinery and Technologies Engineering, Faculty of Agriculture, Ondokuz Mayıs University, 55139 Samsun, Turkey
3
Department of Soil Science and Plant Nutrition, Faculty of Agriculture, Iğdır University, 76000 Iğdır, Turkey
4
Department of Biotechnical Systems, Faculty of Biotechnical Systems Engineering, University Politehnica of Bucharest, 006042 Bucharest, Romania
5
National Institute of Research—Development for Machines and Installations Designed for Agriculture and Food Industry—INMA, 013813 Bucharest, Romania
*
Authors to whom correspondence should be addressed.
These authors contributed equally to this work.
Agriculture 2023, 13(5), 1011; https://doi.org/10.3390/agriculture13051011
Submission received: 11 April 2023 / Revised: 2 May 2023 / Accepted: 3 May 2023 / Published: 4 May 2023
(This article belongs to the Special Issue Innovative Methods and Technology for Resilience Agrifood Systems)

Abstract

:
Soil degradation is an increasing problem in Turkey, especially in the Middle Anatolia region where the annual precipitation is approximately 300 mm, resulting from conventional farming methods. To address this issue, the artificial neural networks (ANNs) are used, as they are flexible mathematical tools that capture data. This study aims to investigate the relationships between dust emission (PM10) and the mean weight diameter, shear stress, and stubble amount of the soil, which were measured in eight different tillage practices (conventional tillage, six types of reduced tillage, and direct seeding). The results show that the mean weight diameter, shear stress, and stubble amount of the soil varied between 4.89 and 14.17 mm, 0.40–1.23 N·cm−2, and 30.5–158 g·m−2, respectively, depending on the type of tillage works. Additionally, dust emissions generated during different tillage applications ranged from 27.73 to 153.45 mg·m−3. The horizontal shaft rototiller produced the highest dust emission, approximately 150% higher than those of disc harrow and winged chisel plows. The impact of tillage practices on dust emission was statistically significant (p < 0.01). A sophisticated 3-(7-7)-1 ANNs model using a backpropagation learning algorithm was developed to predict the concentration of dust, which outperformed the traditional statistical models. The model was based on the values of mean weight diameter, shear stress, and stubble amount of the soil after tillage. The best result was obtained from the ANN model among the polynomial and ANN models. In the ANN model, the coefficient of determination, root mean square error, and mean error were found to be 0.98, 6.70, and 6.11%, respectively. This study demonstrated the effectiveness of ANNs in predicting the levels of dust concentration based on soil tillage data, and it highlighted the importance of adopting alternative tillage practices to reduce soil degradation and dust emissions.

1. Introduction

Traditional agriculture, which includes burning crop residues, and deep tillage for weed control, generally harms the environment. Tillage is a substantial cause of particulate matter (PM) released from the soils. Dust particles significantly affect the climate system’s carbon, energy, and water cycles. The emitted and deposited dust particles participate in a range of physical, chemical, and bio-geological processes that interact with energy, carbon, and water cycles. Improper tillage techniques contribute to the increase of soil erosion and can cause various types of degradation processes in agricultural areas [1,2].
Particulate matter originating from human and machine activities (PM10) is a serious subject that challenges the sustainable agriculture. Being a source of both physical and emotional disturbance, they are also a major cause of respiratory diseases, poisoning, and allergic reactions. Krasnov et al. (2015) [3] reported that during dust storms, the concentrations of dust particles with an aerodynamic diameter less or equal to PM10 in arid areas can exceed the WHO guideline for air quality.
Sustainable agriculture emphasizes the agricultural production while considering environmental entities—namely soil, water, and air—and safeguarding the well-being of people, plants, and animals [4,5]. Due to lower population densities and fewer industrial pollution sources, rural areas have lower particulate matter densities than the metropolitan ones. Nevertheless, the densities of particulate matter created during agricultural processes can surpass the limit values (50 mg·m−3 as an annual average). As stated in study [6], in agriculture and agri-businesses, dust is a major cause of respiratory allergies, and of the disease called farmer’s lung (extrinsic allergic alveolitis). The main aim of sustainable agriculture is to protect the ecological balance as much as possible, while also maintaining soil functions [7,8].
Particulate matter exists in a wide range of sizes and is distinguished by its aerodynamic sizes. Depending on their sizes, particles with an aerodynamic diameter smaller than 10 µm (PM10) are regarded as harmful particles that enter the human body through the respiratory tract. While the term “coarse particle” refers to larger particles, the particulate matter with a diameter smaller than 2.5 µm (PM2.5) is regarded as “fine particle”. It was found that excessive dust usually occurs when working with different agricultural and forestry machines; dust concentrations outside the cabin during tillage works ranged between 2.1 and 577 mg·m−3 [9]. In addition, it was found that dust concentrations are very high if the temperature is typically high, and dust always causes irritations, unfavorable conditions, and indirect health hazards.
Atiemo et al. (1980) [10] investigated dust concentrations in the cabins of combine harvesters and three different tractors: without a cabin, with a factory cabin, and with a cabin added later, in tillage, seeding, fertilization, spraying, baling, and harvesting processes. The authors reported that environmental factors such as wind speed, soil moisture, soil composition, relative humidity, temperature, and soil cover affect dust formation in agricultural studies. The respirable dust concentrations formed in the cabins, and the dust concentrations formed in the outdoor environment were compared. Dust concentrations formed in the external environment ranged between 34 and 195 mg·m−3, and dust concentrations formed in the cabin were 0.03–2.63 mg·m−3, respectively.
Aimar et al. (2011) [11] assessed the effects of soil moisture, textural fractions, and organic matter of sandy-loamy-sandy soils on PM10 in wind tunnel simulations. The maximum PM10 emissions were found in soils with high silt contents. Even when silt contents were high, lower PM10 emissions were obtained because of high organic matter (OM) contents.
Some applications that could be an alternative to conventional tillage to reduce PM10 emission during summer fallow were studied by Sharratt et al. (2010) [12]. It was determined that PM10 flow decreased with the decrease in tillage intensity. In comparison to reduced or delayed-minimum tillage, conventional tillage generally resulted in higher PM10 flux, while no tillage resulted in the lowest change of PM10.
Working with tractors and combine harvesters in the Eastern Mediterranean region, Aybek and Arslan (2007) [13] determined the dust levels formed during some agricultural operations. According to their investigation, the average dust levels were 137.95 mg·m−3, 83.57 mg·m−3, 80.28 mg·m−3, and 88.8 mg·m−3 when working with tractors without a cab in the operations of pulling, floating, making the arc, and using the baler and straw-making machines; 5.6 mg·m−3, 6.6 mg·m−3, 6.4 mg·m−3, and 3.7 mg·m−3 in tractors with a later cabin; and in tractors with an original cabin, it was found as 1.10 mg·m−3, 1.6 mg·m−3, 3.2 mg·m−3, 1.35 mg·m−3, and 1.4 mg·m−3, respectively. Moreover, the average dust concentrations formed during combine harvesting were found to be 106.9 mg·m−3 in the combined harvesters without a cabin, 4.7 mg·m−3 in the later cabin combines, and 1.43 mg·m−3 in the original cabin combines.
Measured PM10 emission factors for harvesting and tillage in several row crops were determined by Cassel et al. (2003) [14]. Emission factors were verified by real-time remote particle-sensing techniques and were further parameterized by measurement uncertainties and repeated measurements. In determining the PM10 emission factors for similar activities under varying field conditions, the effect of soil moisture and relative humidity on seasonality and crop specificity was found to be significant. Chen et al. (2017) [15] measured the emission factors of PM10 and PM2.5 from three field operations (tilling, planting, and harvesting) in corn and soybean production, using real-time PM analyzers and weather station data. PM10 and PM2.5 emissions from tillage and harvesting were estimated based on local emission factors, crop areas, and crop calendars. Emission factors ranged from 9 and 119 mg·m−2 for tillage, and 18–33 mg·m−2 for soybean and maize harvests in relatively dry conditions. PM emission factors from tillage and planting were adversely affected by topsoil moisture. Another study on dust emissions from soil aggregates of different sizes found that PM10 emission was associated with salinization and breaking of aggregates. At wind shear speeds of 0.24–0.52 m·s−1, saltator-sized (125–500 µm) aggregates caused dust formation by the aggregate fragmentation mechanism. A higher shear speed is required in larger aggregates to cause breakage and dust emission [16].
A two-dimensional model for particulate matter (PM) dispersion showed the emitted particulate matter flows for different wind speeds and soil conditions, with a portable boundary layer wind tunnel, and it conducted field tests at a dust source location. The wind speed profiles, applied in the simulations, were fitted from the data obtained by field measurements. In numerical simulations, the size distribution of dust particles was evaluated using the Monte Carlo method. Under low-friction velocity (0.27 m·s−1) and undisturbed soil conditions, dust emissions from the semi-arid region’s bare and dry loose soil area were of 17.1 mg·m−2·min−1 on the ground. The results were of approximately 2.5 mg·m−3 and 4.5 mg·m−3 for PM10 and PM5, respectively, at the monitoring station found at 10 m altitude [2].
Carman et al. (2016) [17] concluded that PM10 concentration for seven different tillage applications in clay-loam soil conditions generally increased with the intensity of tillage operations. They examined the relationship between the wind erosion rate and dust concentration using artificial neural networks (ANNs) and discovered that the ANNs model consistently provided better predictions. Eight models were developed by Mikailsoy et al. (2018) [18] to predict the rates of wind erosion. The estimated data from these models and the measured data were in good agreement, and the root mean square error (R2) values varied between 92.52 and 93.74%.
No-till and conservation-till practices have been advocated for the drylands in Middle Anatolia. No-till fallow, where herbicides are used in lieu of tillage to control weeds, is ideal for erosion control and is used by an increasing number of dryland farmers despite being generally less efficient than tillage-based fallow for retention of stored seed-zone soil water. A method for conservation tillage in this region consists in using a vertical cutter (chisel) implement as an alternative to the conventional plough implements. The vertical cutter has wide, narrow-pitch sweep blades that slice beneath the soil at a desired depth to create a tillage mulch and retains significantly more surface residue and soil clods compared to conventional tillage methods [19].
There is a severe threat of erosion over about 40% of Turkish agricultural lands. In Central Anatolia, erosion is still prevalent at a rate of 420 million tons per year, due to inappropriate soil tillage and agricultural implementations [20]. Dust has become one of the leading daily environmental problems for the people living in the region. As 90% of the soils in the Central Anatolian region are degraded, dust storms are created both during agricultural activities and by wind erosion. The resulting dust adversely affects both human health and logistics on the roads in the region.
The objectives of this research can be stated as follows:
1. Evaluation of the effect of some physical properties that define the eroding ability of the soil on dust concentration in different tillage applications. Evaluation of conventional and conservation agricultural techniques applied in agricultural production in Middle Anatolia in terms of their effects on dust emission.
2. Investigating the ability of ANNs and empirical model approaches for predicting dust concentration.
3. Comparison of the accuracy of dust concentration predictions using ANNs and empirical models based on statistical parameters.

2. Materials and Methods

The experiments were carried out in the Sarıcalar Research and Application farm of the Selçuk University Faculty of Agriculture in Konya (41°82′27″ N, 45°60′15″ E). Land degradation processes are more prominent in Konya, where arid and semi-arid climatic conditions prevail. The region’s average temperature is 11.4 °C, the average total evaporation is 1033 mm, and the average precipitation is around 300 mm [21].
Agricultural areas in the basin cover 12% of Turkey’s agricultural areas, and irrigated areas represent 17% of Turkey’s irrigated areas. Agricultural irrigation comprises 90% of the water used in the basin, hence its situation puts an intense pressure on groundwater available resources, which are decreasing drastically [21].
Experiments were carried out during the years 2013 (the first year) and 2014 (the second year). The plots containing different treatments were 200 m long (from east to west) and 5 m wide (from north to south). Soil samples taken from the field were passed through a 2 mm sieve, and soil texture was determined according to the Bouyoucos hydrometer method [22].

2.1. Soil Properties

Soil texture of the experimental fields covering stubble was clayey-loamy (36% clay, 40% loam, and 24% sand, respectively), according to the FAO soil classification. The “Smith Weldon” method, which is based on the oxidation of organic matter, was used to determine soil organic matter [23].
Soil moisture content was determined by means of a time domain reflectometer (TDR 300) with 12 cm rods. Some physical properties of the soil in the area under experiment, before tillage, are presented in Table 1.

2.2. Tillage Practices

Soil tillage practices were carried out in the first and second years, respectively, on 20–21 October 2013 and 27–28 October 2014. The experiment was set up in a randomized complete block trial design with three replications. Each parcel size was 200 × 5 m. The experiments were carried out for eight tillage applications (Table 2).
Some technical features of the equipment used in the experiments are presented in Table 3.

2.3. Measurement of Dust Emissions

Thermo-Scientific MIE pDR-1500 portable dust measurement devices were used for the measurements of dust emissions (PM10). The dust emission measuring range of the device is 0.001–400 mg·m−3, the particle size range is 0.1–10 μm, and the airflow range is 1.0–3.5 L·min−1, respectively. For the eight equipment used in tillage, dust emission measurements were performed with the device connected to a special apparatus at 1 m behind and 1 m high from the ground.
This study is based on particle size distribution. Samples were taken after tillage from depths of 0 to 20 cm. Different sub-samples were obtained from the cultivated soil to reveal the effect of particle size distribution on dust concentration. Soil samples were air-dried for each treatment to determine the mean weight diameter of soil particles. Samples were sieved through 40, 20, 16, 8, 4, and 2 mm sieves, and then divided into seven fractions, which were further weighed separately, in order to obtain the percentage values.
The following equation was used to calculate the mean weight diameter (MWD) [24]:
M W D = X i W i  
where Xi is the mean diameter of each size fraction (mm), and Wi is the proportion of the total sample weight occurring in the corresponding size fraction (g).
A winged cutting tool with a diameter of 10 cm and height of 12 cm was used in order to determine the shear stress of the soil. The torque arm attached to the tip of the blade cutter had a measuring range of 0–80 Nm. After tillage, the measuring tool was driven at 0–20 cm into soil profile. The torque applied by the bladed cutters along a cylinder surface was read analogously from the indicator on the torque meter arm. The torque value that emerged due to the winged cutting device cutting the soil circularly was evaluated. Measurements were made in five replications in each application plot.
The maximum torque was obtained as shear resistance using the following equation [25]:
τ = T π d 2 h 2 + d 6
where 𝜏 is shear resistance, d is the diameter of the winged cutting tool, h is the height of the winged cutting tool, and T is the measured torque. In determining the amount of stubble, a frame measuring 1 m2 was placed on each application parcel after tillage, and the stubble that was collected by cutting the stubble from the soil level in the frame was weighed. The weighing was carried out in five replications in each application plot, and the amount of stubble (g·m−2) was determined.

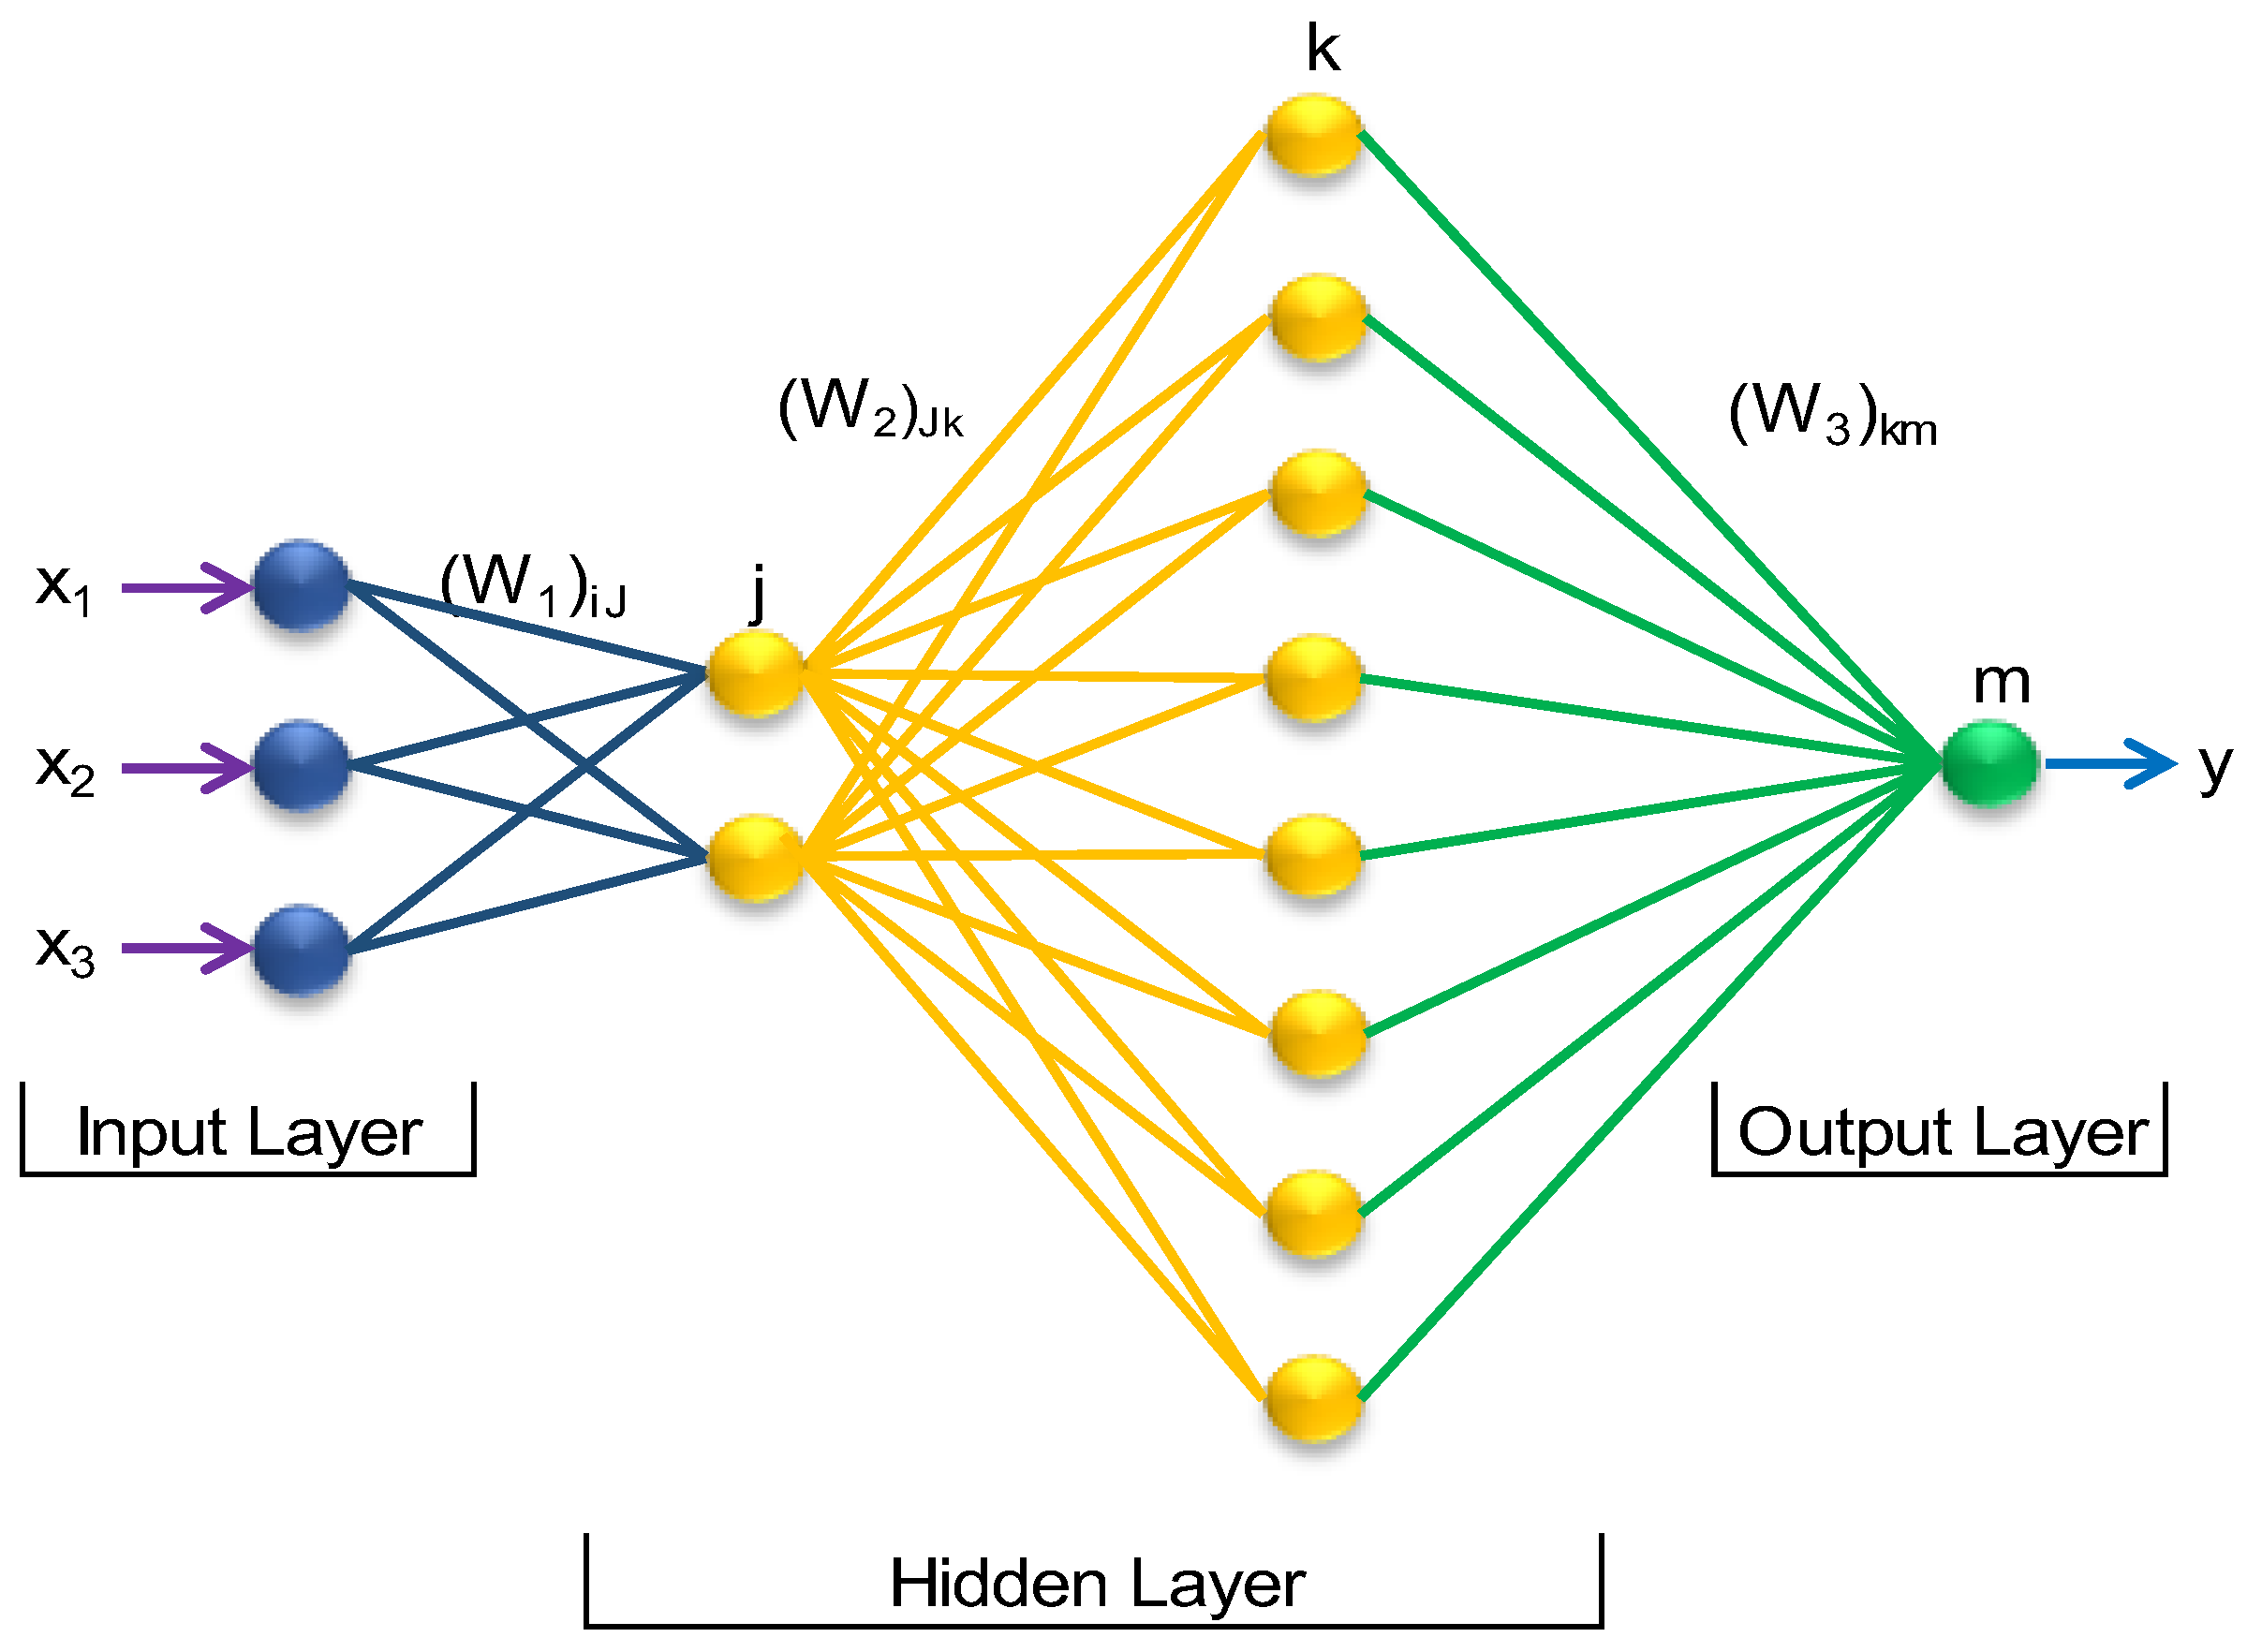
2.4. Artificial Neural Networks

The ANNs model was developed using the MATLAB NN Toolbox software. For the ANNs model, 48 data were used. These data are normalized between 0 and 1 [26].
The following equation was used for normalization:
y n o r = y y m i n y m a x y m i n
The ‘y’ real value was calculated from the same formula to obtain the real values from the normalized values.
Data used in this study were divided into two training and test datasets. Of the 48 data, 36 were in the training set and 12 in the test set. As input data, the shear stress of the soil, mean weight diameter of the soil, stubble amount, and dust emissions values were used as output data. In the ANNs model, the network structure was designed as 3-(7-7)-1 with an input layer, two hidden layers, and an output layer (Figure 1). As the transfer function, purelin was used in the first hidden layer and logsig in the second hidden layer, and tansig functions were used in the output layer. For the network, the lowest training error was obtained at the epoch number of 220. R2 and RMSE values in the training set were found to be 0.99 and 3.21, respectively.
A Multilayer Perceptron network structure was used in the ANNs model, Feed Forward Backpropagation [27]. The Levenberg-Marquardt (LM) algorithm was preferred as the training algorithm [28,29].
The network was trained until the test error reached the desired tolerance value. After the training was completed, the network was tested with test data [30].

2.5. Polynomial Models

Let us assume that we have n measurements obtained through observations or experiments x 11 , x 21 , x 31 ; u 1 , , x 1 n , x 2 n , x 3 n ; u n . Using these data, our purpose is to determine the analytical statement of the equation that is closest to reality and represents the measurement results of x 1 i , x 2 i , x 3 i ; u i . Here, the xi values represent the abscissa, whereas the yi values represent the ordinate in the coordinate system. In general, a method known in mathematics as the approximation theory is used to determine the analytical statement of such experimental models. Investigation using polynomials offers enormous ease, as many characteristics of polynomials are sufficiently known; moreover, they can represent functions and be used as a substitution. Thus, if a polynomial form has been selected for p(x1,x2,x3), the expression of the function f(x1,x2,x3) using p(x1,x2,x3) is called polynomial interpolation.
Polynomials are the simplest functions; polynomial interpolation functions are typically represented as p(x1,x2,x3). It is well known that a function whose values are discrete points can be defined approximately using a polynomial or another function that passes through these points.
The prediction model was developed according to the traditional methods of the dust emission rate by using the Statistica program, version 5. The shear stress of soil (x1), mean weight diameter of soil (x2), and stubble amount (x3) were used as variables.
An approximation function, which needs to be determined for the function f, is given below in general terms:
u ˜ = f a ; x = f a 1 , a 2 , , a m ; x 1 , x 2 , , x p
where a1, a2, ..., and am are parameters that must be calculated to identify the best approximation. To obtain simple approximation functions:
u ˜ = a 0 · φ 0 x 1 , x 2 , , x p + + a m · φ m x 1 , x 2 , , x p = i = 0 m a i · φ i x 1 , x 2 , , x p
Regression analysis is one of the most common statistical methods used in constructing mathematical relationships based on experimental data. Regression functions are often built in the polynomial function class, and the coefficients of polynomials are determined by the least squares method (LSM). We used polynomial models to make our experimental data’s mathematical dependencies (Table 4).
When dealing with multiple models, the question is how to find the best model among competing models. Depending on the structure of the models, different statistical criteria can be used to find the best model. To compare the models, we used six comparison criteria. These criteria are given below.
R—Pearson’s correlation coefficient [31]
R2adj—Adjusted coefficient of determination [32]
σ—Root mean squared error (RMSE) [33,34]
D—Willmott’s index of agreement [35]
c = rD—the confidence index [36]
UIII—Normalized standard error, or Theil’s U Statistic [32].
When models are nested, any of these criteria are applicable [34]. In this paper, the models we consider are nested.
The values of the coefficients of five nested polynomial models and their statistical parameters, calculated using the implementation of the Levenberg-Marquardt method, are given in Table 4 for predicting and for the purpose of selecting the best model.
The models are compared using the values of these criteria. The best model is selected, and the dust emission is predicted from the selected best model. When considering the resulting values of the indicators presented in Table 4, it becomes clear that Model 4 is more adequate, giving the best result for each criterion.
Table 5 shows that the polynomial Model 4 gives the minimum value for the statistical parameters (RMSE, UIII) and the maximum value for (r, R2adj, D, c). Therefore, this model is more accurate than other models.

2.6. Evaluation of Model Performance

To evaluate the performance of the results obtained with both ANNs and polynomial models, root mean square error (RMSE), coefficient of determination (R2), and relative error ( ε ) were utilized and calculated using the following equations [17,37]:
R M S E = 1 m i = 1 m x 1 i x i 2 1 2                              
R 2 = 1 i = 1 m x 1 i x i 2 / i = 1 m x 1 i 2  
ε = 100 m 1 m x x 1 x
where RMSE is the root squared mean squared error, R2 is the coefficient of determination, ε is the relative error, m is the number of data points, x is the measured value, and x1 is the predicted value.

3. Results and Discussion

The variations in mean weight diameter of soil, shear stress, amount of stubble, and dust emission values, depending on different tillage applications, are presented in Table 6.

3.1. Mean Weight Diameter

The effect of different tillage applications on the mean weighted diameter was significant (p < 0.01). Regarding the effects of different tillage machines on the degree of soil fragmentation (mean weighted diameter) the highest mean weighted diameter was obtained with the direct seeding machine. At the same time, the lowest value was reached with the vertical shaft rototiller. In general, the mean weighted diameter values of the soil were found to be smaller in the machines driven by the PTO. Here, aggregate fragmentation can lead to a decrease in aggregate size distribution, and an increase in salinization flows during erosion, and thus alters dust production over time. This could affect the dust emission potential over time and in the next wind event.
The mean weight diameter of soil differed significantly between conventional tillage and reduced tillage treatments, which is consistent with the results obtained by Coulibaly et al. (2022) [38]. The mean weight diameter in reduced tillage did not change significantly after tillage. The mean weight diameter of soil particles varied between 4.66 and 14.17 mm at different soil tillage treatments. When tillage practices were compared, the mean weight diameter was higher in no-tillage treatment, similar to the study of Seflek et al. (2017) [39]. While increasing the peripheral machine speed in machines driven by a tractor, the PTO shaft also increased the fragmentation efficiency of soil. The mean weight diameter of the soil was between 9.15 and 11.57 mm for the winged chisel plow-float. This situation is consistent with the views of Carman et al. (2012) [40].

3.2. Shear Stress

The effect of different tillage applications on the shear stress of the soil was found to be significant (p < 0.01). Depending on the different tillage applications, soil shear stress varied between 0.40–1.23 N·cm−2. Compacted soils have higher values of more significant shear stress due to the proximity between particles, which lessen the voids and increases soil density [41]. The highest change in its value was obtained with a value of 81% reduction in a vertical shaft rototiller-float application, while the lowest change in the direct seeding application was with a value of 47%. Soil shear stress varied between 0.669 and 1.10 N·cm−2 in machines with three different working tines driven by the tractor’s power take-off (PTO). The most significant change of 66% reduction was obtained for the machine with a horizontal shaft rototiller (L type)-float application. The highest shear stress values were obtained from the no-tillage application. The results obtained from our study were found to be compatible with Carman et al. (2012) [40].

3.3. Stubble Amount

The effect of different tillage applications on the stubble amount was significant (p < 0.01). Depending on the different tillage applications, the amount of stubble varied between 30.5 and 158 g·m−2. The highest stubble values were obtained in the no-tillage application. The stubble on the soil surface is not buried because the plow is unused. A winged chisel plow-float application followed a no-tillage application. Since the chisel used here works by tearing the soil, it has come to the fore more than other applications. Therefore, more stubble was obtained on the soil surface. Depending on the applications, stubble burial rates vary between 25% and 80%. In the horizontal shaft rototiller (I type foot) application, the amount of stubble in the field after tillage was obtained with an 80% burying rate. The amount of stubble on the field after tillage was obtained with a reduction of 80%, or a burying rate of 80% in a machine with a horizontal shaft rototiller (I-type foot)-float application. In the tillage application with a disc harrow, the surface residue coating rate was 47–66% compared to the first, and the change occurred between 2 and 16%. It can be observed that the disc harrow mixes the soil better and mixes the surface residues better than the field cultivator in tillage with a chisel, and in tillage with a moldboard [42]. In conservation tillage techniques, the percentage of critical ground cover is 50–60% for prostrate stubble, and 30% for standing stubble (30–60 cm high). The results obtained from our study were found to be compatible with Carman et al. (2018) [43]. Retained stubble reduces dust emissions and wind erosion. It also increases soil moisture retention and improves water infiltration. This result is consistent with the views of Scott et al. (2010) [44].

3.4. Dust Emissions

The effect of different tillage applications on dust emissions was significant (p < 0.01). Dust emission values varied between 27.73 and 153.45 mg·m−3 in eight tillage applications. While the average dust emission was lowest in direct seeding (27.73 mg·m−3), the highest value was obtained in the horizontal shaft rototiller (L-type foot)-float application (153.45 mg·m−3). Similar results were obtained in PTO-driven applications. The high soil-fragmentation activity in the horizontal shaft rototiller application produced approximately 150% higher dust emission value than in the disc harrow and winged chisel plow-floats. In the second year of this study, an increase of approximately 17% in soil moisture and a decrease of 18% in dust emissions were obtained. While all applications in conventional tillage cause more dust emissions, the lowest dust emission was obtained with the no-tillage application. This result is consistent with the views of Gao et al. (2014) [45]. Among the reduced tillage applications, the lowest dust emission (39–73.6%) was obtained in the winged chisel plow application. While the dust emission value in direct seeding decreased by 75% compared to the traditional application, it fell by 72% on average compared to the reduced tillage applications. An aggregate size-distribution analysis showed that tillage affected the PM10 content of the soil in the field [39]. The low PM10 content in the no-tillage application may be due to the biophysical conditions that promoted the formation of larger aggregates in the no-tillage, compared to the PM10 content in other tillage applications [46].
Tillage affects dust emission. Agricultural applications such as plowing, mowing, cutting, and baling have the potential to increase dust emissions. Conservation tillage, however, has the potential to reduce wind erosion and dust emissions. Sharratt and Feng (2009) [47] found a 15–65% reduction in soil loss, and a 30–70% reduction in PM10 loss from agricultural lands managed using undercutter tillage versus conventional tillage.
Wang et al. (2010) [48] conducted field experiments to measure dust emissions from disking, rolling, planting, listing, and harvesting cotton. The values obtained in this study were lower than those obtained by these authors. Dust emissions varied according to soil type, moisture content, operation, and crop type. It was found that dust emissions from tillage, planting, and harvesting processes in corn and soybean production are negatively affected by topsoil moisture [16]. Sharratt et al. (2010) [12] conducted studies to reduce PM10 emissions using different tillage practices. They used seven conventional, five reduced, and three delayed-minimum and no-tillage applications as soil tillage in their studies. PM10 emission decreased with the number of operations in the soil tillage application. The lowest PM10 emission was obtained in the no-tillage application.

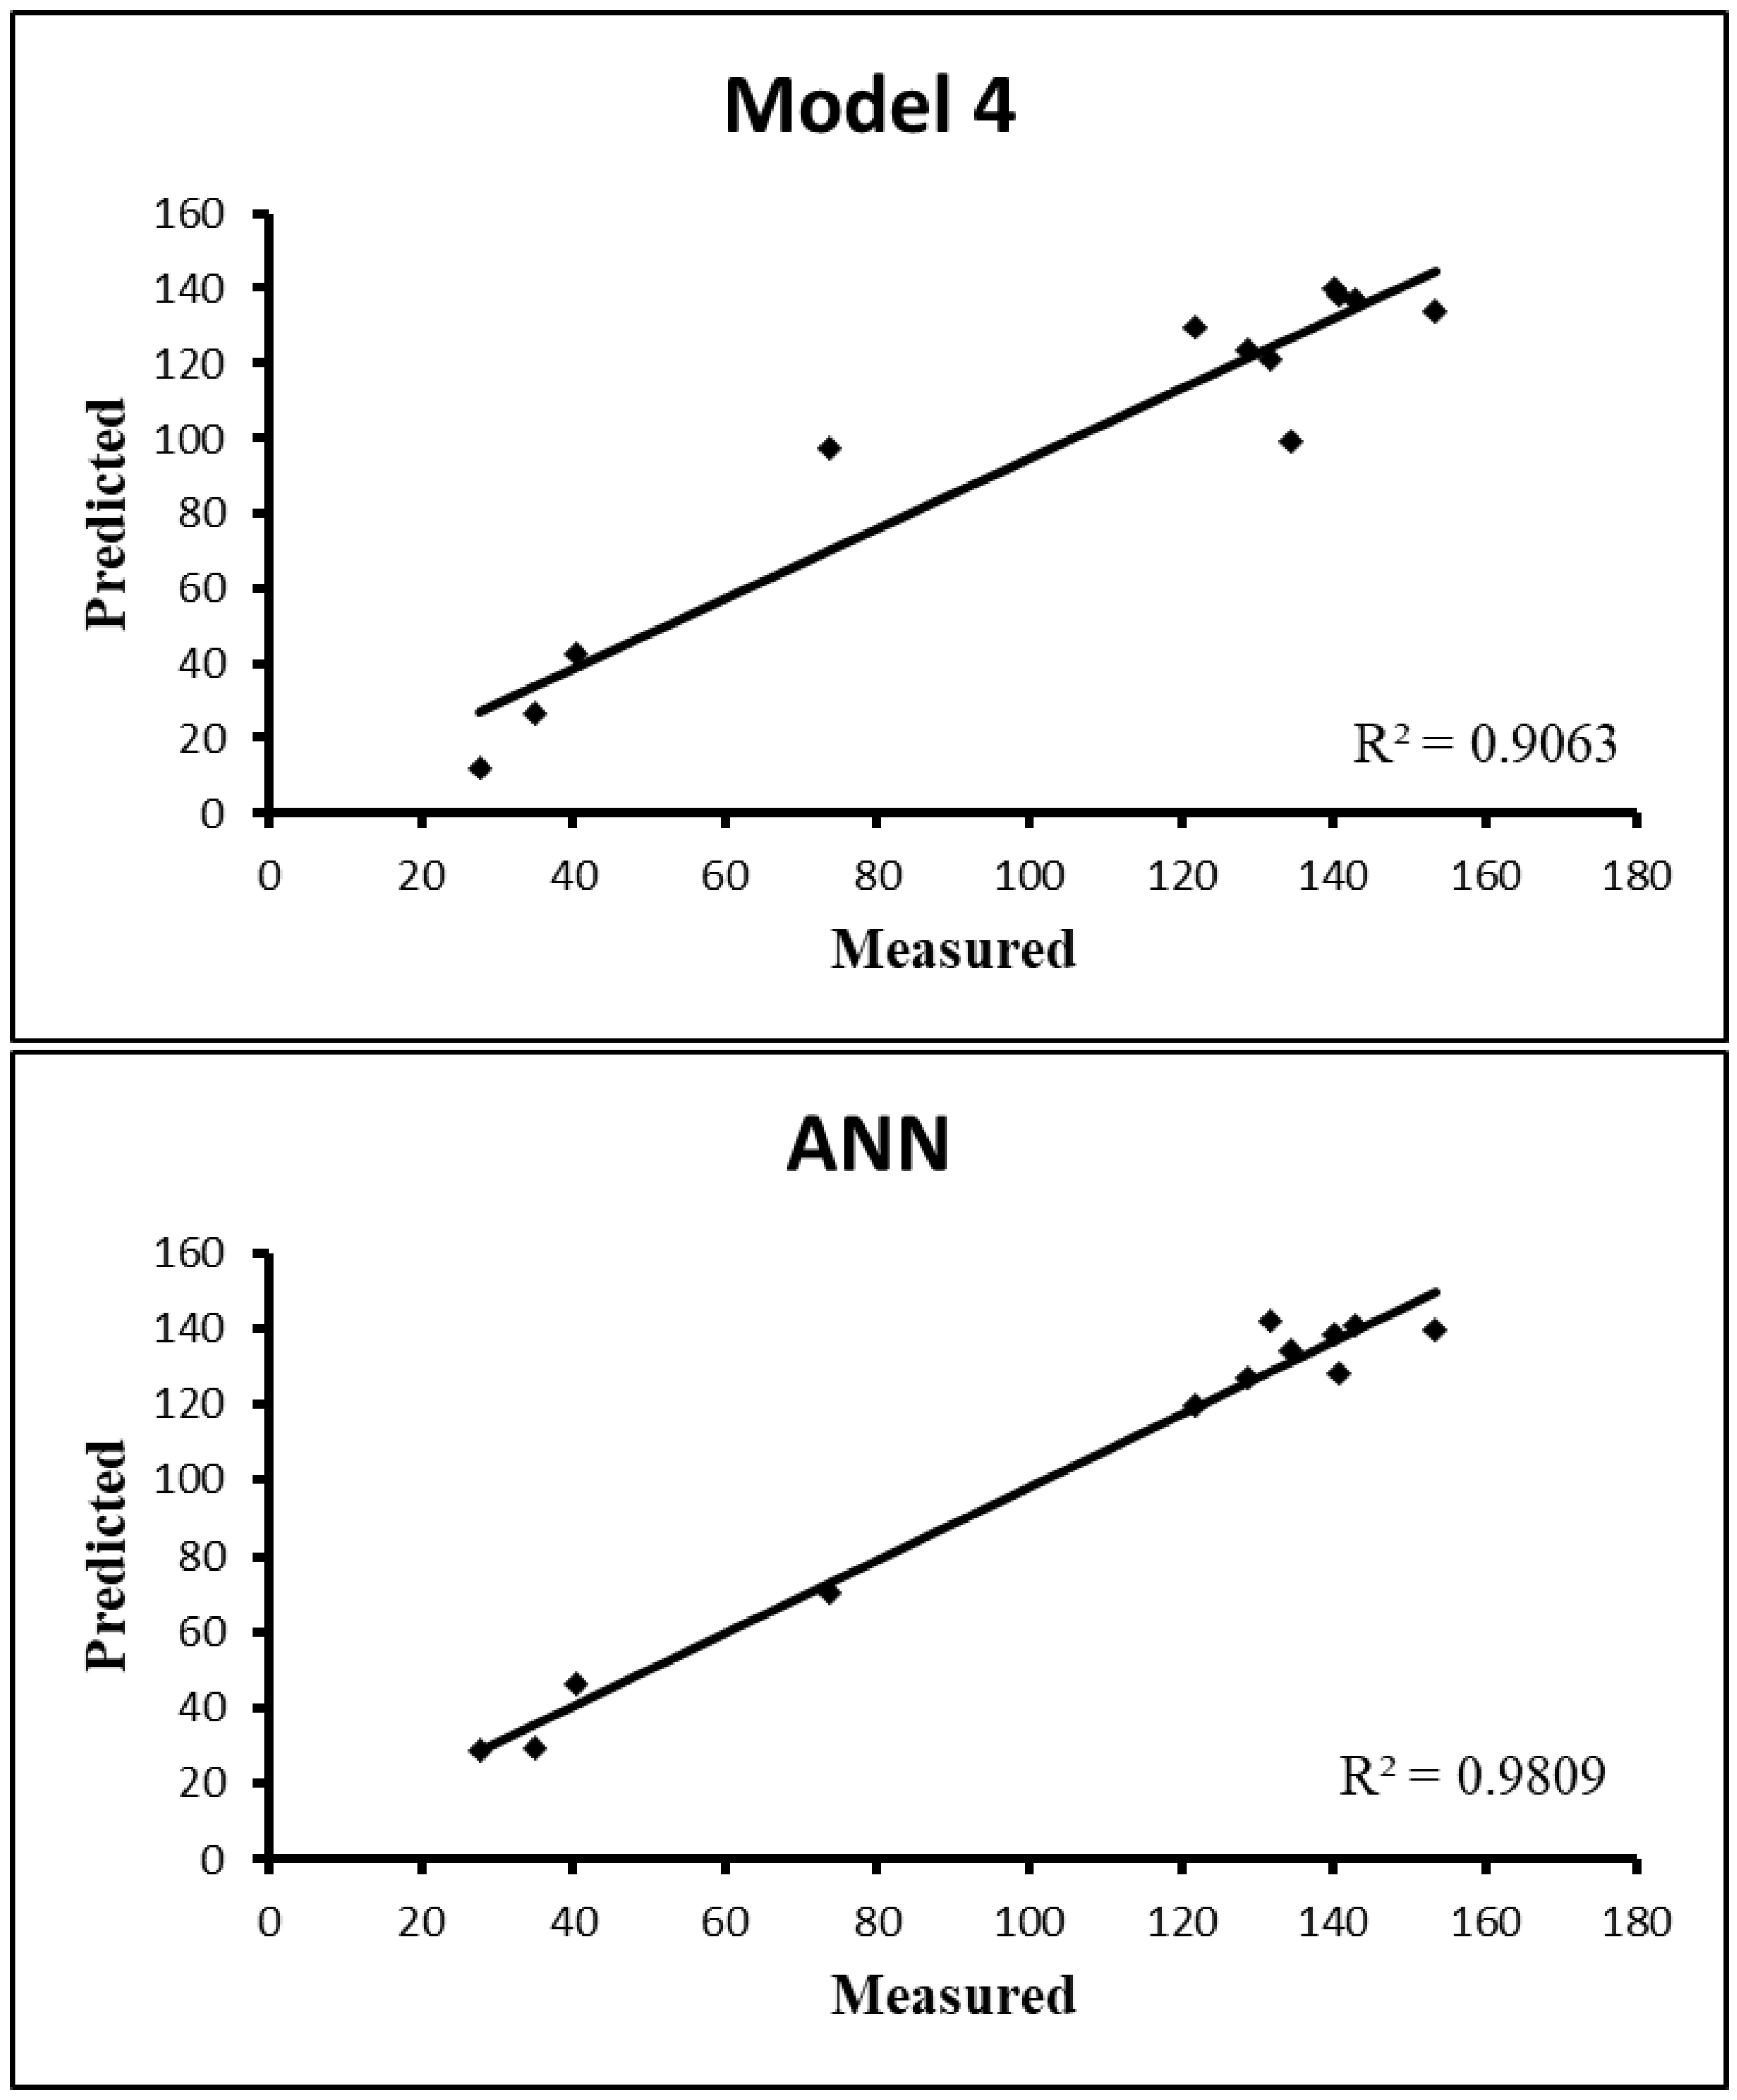
3.5. Comparison of Models

The performance results of the models are provided in Table 7. Among the polynomial models, the best model was determined as Model 4. The ANNs model made the closest prediction to the observed value. The highest R2, the lowest RMSE, and the lowest ε values were found in this model. In studies with non-linear data, more successful results are obtained with ANN [30]. The coefficient of determination (R2) between the observed data and the predicted values were found to be 98.09% for ANN, and 90.63% for Model 4, respectively.
The relationship (R2) between measured and predicted data from ANN and Model 4 was found to be 98.63%, and 90.63%, respectively. The data predicted from the ANN model was determined to be entirely parallel and compatible with the measured data, according to the data predicted by the polynomial models (Figure 2).
The success of an ANN model varies according to some parameters, such as: transfer function, learning coefficient ratio, learning rule, momentum, multiple hidden layers, and multiple neurons in the hidden layers [49]. The empirical model has a relatively simple structure compared to the ANNs model. These models do not have parameters such as the number of neurons, hidden layer, momentum, learning rule, and transfer function [50]. There is a very strong relationship between the success of the estimation technique and the data characteristics. If data set fits the normal distribution, empirical models should be preferred; if not, ANNs should be preferred. In terms of model accuracy, due to their non-linearity, the ANNs perform much better than the empirical models [51].
A higher coefficient of determination and lower root mean square value were obtained in the ANNs model compared to other models. In this sense, it is possible to say that the ANNs model may be more suitable than other models for modeling dust emissions. According to the results of the models in this study, the efficiency of the models to predict dust emission was obtained as follows: ANNs Model (according to Table 7).
Polynomial models are relatively easy to construct because they have a more straightforward structure than the ANN ones. In contrast, learning an ANN is a problem that can be much more difficult to solve and requires good initialization and tuning. However, for the same computation time, polynomial models can have more degrees of freedom. Although it is thought that these polynomial models can approach any function just like ANN, most of the success of ANN comes from the rich hierarchical representations these models are capable of [30].
In our study, the low value of relative error indicates that the prediction ability of the ANN method is better. However, there is a severe drawback in the ANN-based method because the mathematical form of ANN is generally too complicated, and the relationship between dust emissions and their influencing factors cannot be intuitively mirrored (Table 7).
The success of the ANNs model may be due to the ability of many hidden layers within the model’s structure to use higher computational resources. The empirical model’s predictive ability depends on its assumptions’ rationality. However, in the model-building process, sometimes essential details are inevitably overlooked. This relatively limits the forecasting performance. The ANNs model, on the other hand, is entirely data driven. Therefore, it can often obtain a better estimate than the empirical model suggested. The results obtained in our study were found to be compatible with those obtained by Yang et al. (2020) [52].

4. Conclusions

This study compared the effectiveness of ANNs and Polynomial Models in predicting dust emission during various tillage practices in Middle Anatolia. The relationships between dust emission and mean weight diameter of the soil, shear stress, and amount of stubble were evaluated for eight different tillage applications.
The most significant change in soil physical conditions (MWD, shearing stress, and the amount of stubble remaining) was observed in soil tillage treatment that was PTO-driven. This has caused an increase in dust emissions during tillage, especially compared to other reduced tillage practices. PTO-driven reduced tillage practices, used by farmers in the region as an alternative to traditional practices for optimum seedbed preparation in the production of sugar beet, maize, etc., cause an increase in dust emissions due to excessive soil fragmentation. The effect of tillage applications on dust emissions was statistically significant. The lowest dust emission values were obtained in the no-tillage application. Compared to conventional tillage, dust emission decreased by 75.8% in no-tillage, 1.5% in reduced tillage applications driven from PTO, and 59.6% in other reduced tillage applications. Conventional and PTO-driven reduced tillage practices are a significant threat to sustainable agriculture and the environment in the region. The results showed that PM10 emissions would be higher for conventional tillage, hence less soil-degrading conservation practices such as winged chisel and disc harrow play an important role in minimizing soil erosion and improving air quality in semi-arid regions. In both years of the experiments, the change in soil moisture caused a change in dust emission. In the second year of the experiments, a 16.7% increase in soil moisture caused an average decrease of 17.7% in dust emission.
The amount of dust concentration was predicted with six models depending on the mean weight diameter, shear stress, and stubble amount values. Among these models, the ANNs model was obtained as the most successful. The obtained mean error of ANN was 6.11%. In addition to its numerical accuracy, the artificial neural network (ANN) model is much faster and easier to use, which makes it suitable for predicting dust emissions. In the future, we aim to increase the data and further develop this study using different machines and deep learning methods.

Author Contributions

Conceptualization, K.Ç. and A.T.; methodology, K.Ç. and A.T.; software, K.Ç.S. and F.M.; validation, K.Ç. and A.T.; formal analysis, K.Ç.S., F.M., N.U. and N.-V.V.; investigation, K.Ç., A.T., F.M. and K.Ç.S.; resources, N.U. and N.-V.V.; data curation, K.Ç.S. and F.M.; writing—original draft preparation, K.Ç., A.T., F.M. and K.Ç.S.; writing—review and editing, N.U. and N.-V.V.; visualization, N.U. and N.-V.V.; supervision, K.Ç., A.T. and N.-V.V.; funding acquisition, N.U. All authors have read and agreed to the published version of the manuscript.

Funding

The APC was funded by University Politehnica of Bucharest, Romania, within the PubArt Program.

Institutional Review Board Statement

Not applicable.

Informed Consent Statement

Not applicable.

Data Availability Statement

Not applicable.

Conflicts of Interest

The authors declare no conflict of interest.

References

  1. Shao, Y.; Wyrwoll, K.H.; Chappell, A.; Huang, J.; Lin, Z.; McTainsh, G.H.; Mikami, M.; Tanaka, T.Y.; Wang, X.; Yoon, S. Dust cycle: An emerging core theme in Earth system science. Aeolian Res. 2011, 2, 181–204. [Google Scholar] [CrossRef]
  2. Katra, I.; Elperin, T.; Fominykh, A.; Krasovitov, B.; Yizhaq, H. Modeling of particulate matter transport in atmospheric boundary layer following dust emission from source areas. Aeolian Res. 2016, 20, 147–156. [Google Scholar] [CrossRef]
  3. Krasnov, H.; Katra, I.; Novack, V.; Vodonos, A.; Friger, M.D. Increased indoor PM concentrations controlled by atmospheric dust events and urban factors. Build. Environ. 2015, 87, 169–176. [Google Scholar] [CrossRef]
  4. Ungureanu, N.; Vlăduț, V.; Voicu, G. Water scarcity and wastewater reuse in crop irrigation. Sustainability 2020, 12, 9055. [Google Scholar] [CrossRef]
  5. Ungureanu, N.; Vlăduț, V.; Biriș, S.Ș. Sustainable valorization of waste and by-products from sugarcane processing. Sustainability 2022, 14, 11089. [Google Scholar] [CrossRef]
  6. Melbostad, E.; Eduard, W. Organic dust-related respiratory and eye ırritaton in Norwegian farmers. Am. J. Ind. Med. 2001, 39, 209–217. [Google Scholar] [CrossRef]
  7. Biriş, S.Ş.; Vlăduţ, V.; Paraschiv, G.; Gafiţianu, D.; Ungureanu, N.; Manea, M. Some concepts regarding the sustainable development in Romanian agriculture. INMATEH Agric. Eng. 2008, 25, 102–108. [Google Scholar]
  8. Ştefan, V.; Zaica, A.; Iosif, A. Research on the uniformity degree of solid organic fertilizers distribution. INMATEH Agric. Eng. 2021, 65, 495–504. [Google Scholar] [CrossRef]
  9. ISO/IC 23/SC 3; Dust Problems on Operating Machines in Agriculture and Forestry. International Organization for Standardization: Geneva, Switzerland, 1979.
  10. Atiemo, M.A.; Yoshida, K.; Zoerb, G.C. Dust measurements in tractor and combine cabs. Trans. ASAE 1980, 23, 571–576. [Google Scholar] [CrossRef]
  11. Aimar, S.B.; Mendez, M.J.; Funk, R.; Buschiazzo, D.E. Soil properties related to potential particulate matter emissions (PM10) of sandy soils. Aeolian Res. 2011, 3, 437–443. [Google Scholar] [CrossRef]
  12. Sharratt, B.; Wendling, L.; Feng, G. Windblown dust affected by tillage intensity during summer fallow. Aeolian Res. 2010, 2, 129–134. [Google Scholar] [CrossRef]
  13. Aybek, A.; Arslan, S. Dust exposures in tractor and combine operations in eastern Mediterranean Turkey. J. Environ. Biol. 2007, 28, 839–844. [Google Scholar] [PubMed]
  14. Cassel, T.; Trzepla-Nabaglo, K.; Flocchini, R. PM10 emission factors for harvest and tillage of row crops. In Proceedings of the 12th International Emission Inventory Conference Emission Inventories–Applying New Technologies, San Diego, CA, USA, 29 April–1 May 2003. [Google Scholar]
  15. Chen, W.; Tong, D.Q.; Zhang, S.; Zhang, X.; Zhao, H. Local PM10 and PM2.5 emission inventories from agricultural tillage and harvest in northeastern China. J. Environ. Sci. 2017, 57, 15–23. [Google Scholar] [CrossRef]
  16. Gelbart, G.; Katra, I. Dependence of the dust emission on the aggregate sizes in loess soils. Appl. Sci. 2020, 10, 5410. [Google Scholar] [CrossRef]
  17. Çarman, K.; Marakoğlu, T.; Taner, A.; Mikailsoy, F. Measurements and modelling of wind erosion rate in different tillage practices using a portable wind erosion tunnel. Zemdirbyste 2016, 103, 327–334. [Google Scholar] [CrossRef]
  18. Mikailsoy, F.; Çarman, K.; Özbek, O. Non-linear modelling to describe the wind erosion rate in different tillage practices. Fresen Environ. Bull. 2018, 27, 1604–1612. [Google Scholar]
  19. Marakoglu, T.; Çarman, K. A comparative study on energy efficiency of wheat production under different tillage practices in Middle Anatolia of Turkey. Fresenius Environ. Bull. 2017, 26, 3163–3169. [Google Scholar]
  20. Carman, K. The effect on wind erosion of soil tillage applications in Middle Anatolia. In Proceedings of the 3rd International Scientific Conference, Conserving Soils and Waters, Burgas, Bulgaria, 29 August–1 September 2018. [Google Scholar]
  21. Kalender, M.A.; Topak, R. The performance assessment in irrigation systems: The case of Turkey. EJAR 2017, 1, 30–36. [Google Scholar]
  22. Gee, G.; Bauder, J. Particle-Size Analysis 1. In Methods of Soil Analysis; Soil Science Society of America, American Society of Agronomy: Madison, WI, USA, 1986; pp. 383–411. [Google Scholar]
  23. Jakson, M.L. Soil Chemical Analysis; Prentice-Hall Inc.: New York, NY, USA, 1962. [Google Scholar]
  24. Black, C.A.; Evans, D.D.; White, J.L.; Ensminger, L.E.; Clark, F.E. Methods of Soıl Analysıs. Part I, Physical and Mineralogical Properties, İncluding Statistics of Measurement and Sampling; Agronomy 9; American Society of Agronomy: Madison, WI, USA, 1965. [Google Scholar]
  25. Okello, J.A. A Review of soil strength measurement techniques for prediction of terrain vehicle performance. J. Agric. Eng. Res. 1991, 50, 129–155. [Google Scholar] [CrossRef]
  26. Purushothaman, S.; Srinivasa, Y.G. A back-propagation algorithm applied to tool wear monitoring. Int. J. Mach. Tools Manuf. 1994, 34, 625–631. [Google Scholar] [CrossRef]
  27. Minai, A.A.; Williams, R.D. Back-propagation heuristics: A study of the extended delta-bar-delta algorithm. In Proceedings of the International Joint Conference on Neural Networks, San Diego, CA, USA, 17–21 June 1990; pp. 595–600. [Google Scholar] [CrossRef]
  28. Levenberg, K. A method for the solution of certain nonlinear problems in least squares. Quart. Appl. Math. 1944, 2, 164–168. [Google Scholar] [CrossRef]
  29. Marquardt, D.W. An algorithm for leastsquares estimation of nonlinear parameters. J. Soc. Indust. Appl. Math. 1963, 11, 431–441. [Google Scholar] [CrossRef]
  30. Kalogirou, S.A. Artificial neural networks in the renewable energy systems applications: A review. Renew. Sustain. Energy Rev. 2001, 5, 373–401. [Google Scholar] [CrossRef]
  31. Burnham, K.P.; Anderson, D.R. Model Selection and Multimodel Inference: A Practical Information-Theoretic Approach, 2nd ed.; Springer-Verlag: New York, NY, USA, 2002; 488p. [Google Scholar]
  32. Theil, H. Principles of Cconometrics; Wiley: New York, NY, USA, 1971; 736p. [Google Scholar]
  33. Chapra, S.C.; Canale, R.P. Numerical Methods for Engineers, 6th ed.; McGraw-Hill: New York, NY, USA, 2010; 994p. [Google Scholar]
  34. Archontoulis, S.V.; Miguez, F.E. Nonlinear regression models and applications in agricultural research. Agron. J. 2015, 107, 786–798. [Google Scholar] [CrossRef]
  35. Willmott, C.J. On the validation of models. Phys. Geogr. 1981, 2, 184–194. [Google Scholar] [CrossRef]
  36. Camargo, A.P.; Sentelhas, P.C. Performance evaluation of different potential evapotranspiration estimating methods in the state of São Paulo, Brazil. Rev. Bras. Agrometeorol. 1997, 5, 89–97. [Google Scholar]
  37. Bechtler, H.; Browne, M.W.; Bansal, P.K.; Kecman, V. New approach to dynamic modelling of vapour-compression liquid chillers: Artificial neural networks. Appl. Therm. Eng. 2001, 21, 941–953. [Google Scholar] [CrossRef]
  38. Coulibaly, S.F.M.; Aubert, M.; Brunet, N.; Bureau, F.; Legras, M.; Chauvat, M. Short-term dynamic responses of soil properties and soil fauna under contrasting tillage systems. Soil Tillage Res. 2022, 215, 105191. [Google Scholar] [CrossRef]
  39. Şeflek, A.Y.; Marakoğlu, T.; Çarman, K. The effects of different tillage treatments on soil surface conditions and dust concentration in semi-arid Central Anatolia. Fresen Environ Bull. 2017, 26, 1720–1726. [Google Scholar]
  40. Carman, K.; Marakoğlu, T.; Çıtıl, E.; Gür, K. The evaluation of some PTO-driven soil tillage machines from in terms of conservation tillage. J. Agric. Mach. Sci. 2012, 8, 345–352. [Google Scholar]
  41. Bachmann, J.; Contreras, K.; Hartge, K.H.; Macdonald, R. Comparison of soil strength data obtained in situ with penetrometer and with vane shear test. Soil Tillage Res. 2006, 87, 112–118. [Google Scholar] [CrossRef]
  42. Korucu, T.; Yurdagül, F. Determination of the effect of soil tillage equipments on residue cover on the soil using the line-transect method. KSU J. Agric. Nat. 2013, 16, 1–8. [Google Scholar]
  43. Carman, K.; Gür, K.; Marakoğlu, T. Wind erosion risk in agricultural soils under different tillage systems in the Middle Anatolia. Selcuk. J. Agr. Food Sci. 2018, 32, 355–360. [Google Scholar]
  44. Scott, B.J.; Eberbach, P.L.; Evans, J.; Wade, L.J. Stubble retention in cropping systems in Southern Australia: Benefits and challenges. In Monograph No 1; Edward, H.C., Helen, M.B., Eds.; EH Graham Centre Industry & Investment: Orange, NSW, Australia, 2010. [Google Scholar]
  45. Gao, F.; Feng, G.; Sharratt, B.; Zhang, M. Tillage and straw management affect PM10 emission potential in subarctic Alaska. Soil Tillage Res. 2014, 144, 1–7. [Google Scholar] [CrossRef]
  46. Sharratt, B.; Zhang, M.; Sparrow, S. Twenty years of tillage research in subarctic Alaska: I. Impact on soil strength, aggregation, roughness, and residue cover. Soil Tillage Res. 2006, 91, 75–81. [Google Scholar] [CrossRef]
  47. Sharratt, B.S.; Feng, G. Windblown dust influenced by conventional and under cutter tillage within the Columbia Plateau, USA. Earth Surf. Process. Landf. 2009, 34, 1323–1332. [Google Scholar] [CrossRef]
  48. Wang, J.; Miller, D.R.; Sammis, T.W.; Hiscox, A.L.; Yang, W.; Holmén, B.A. Local dust emission factors for agricultural tilling operations. Soil Sci. 2010, 175, 194–200. [Google Scholar] [CrossRef]
  49. Kecman, V. Learning and Soft Computing: Support Vector Machines, Neural Networks, and Fuzzy Logic Model; MIT Press: Cambridge, MA, USA, 2001; p. 578. [Google Scholar]
  50. Ortiz-Rodríguez, J.; Martinez-Blanco, M.; CervantesViramontes, J.; Vega-Carrillo, H. Robust design of artificial neural networks methodology in neutron spectrometry. In Artificial Neural Networks-Architectures and Applications; Suzuki, K., Ed.; InTech: London, UK, 2013; pp. 83–111. [Google Scholar]
  51. Shepperd, M.; Kadoda, G. Comparing software prediction techniques using simulation. IEEE Trans. Softw. Eng. 2001, 27, 1014–1021. [Google Scholar] [CrossRef]
  52. Yang, J.; Kang, G.; Liu, Y.; Chen, K.; Kan, Q. Life prediction for rate-dependent low-cycle fatigue of PA6 polymer considering ratchetting: Semi-empirical model and neural network based approach. Int. J. Fatigue 2020, 136, 105619. [Google Scholar] [CrossRef]
Figure 1. The structure of the ANNs model.
Agriculture 13 01011 g001
Figure 2. The relationship between measured and predicted data obtained from ANN and Model 4.
Agriculture 13 01011 g002
Table 1. Some physical properties of the soil in the experimental area.
Soil PropertyFirst Year (2013)Second Year (2014)
pH8.208.14
Organic matter (%)1.511.67
Moisture content (%)14.9017.40
Bulk density (0–20 cm) (g·cm−3)1.591.43
Penetration resistance (0–20 cm) (MPa)2.102.55
Shear stress (N·cm−2)2.332.06
Stubble amount (g·m−2)154232
Table 2. Tillage treatments.
TreatmentMachine-Tool
(CT) Conventional tillageMoldboard plow and cultivator-float (two times)
(RT1) Reduced tillageWinged chisel plow-float
(RT2) Reduced tillageHeavy disc harrow
(RT3) Reduced tillageAlternative moving rototiller-float
(RT4) Reduced tillageHorizontal shaft rototiller (L-type foot)-float
(RT5) Reduced tillageVertical shaft rototiller-float
(RT6) Reduced tillageHorizontal shaft rototiller (I-type foot)-float
(NT) No tillageDirect seeding
Table 3. Technical features of the equipment used in the tests.
Machine-ToolWorking
Width
(cm)
Working
Depth
(cm)
Number
of Cultivating
Organs
Working
Speed
(km·h−1)
Horizontal shaft rototiller (L-type foot)-float25012114.2
Vertical shafted rototiller-float2151883
Moldboard
Cultivator-float
120
210
22
12
4
11
5.5
7
Winged chisel-float2152272.8
Heavy disc harrow (Double acting)22514223.8
Alternative moving rototiller-float1822281.8
Horizontal shaft rototiller (I-type foot)-float19017363.85
Direct seeding1625126.0
Table 4. Models used in this study.
Modelspq *Polynomial Models
14 u ˜ = a 0 + a 1 x 1 + a 2 x 2 + a 3 x 3
27 u ˜ = a 0 + a 1 x 1 + a 2 x 2 + a 3 x 3 + b 1 x 1 x 2 + b 2 x 1 x 3 + b 3 x 2 x 3
37 u ˜ = a 0 + a 1 x 1 + a 2 x 2 + a 3 x 3 + c 1 x 1 2 + c 2 x 2 2 + c 3 x 3 2
48 u ˜ = a 0 + a 1 x 1 + a 2 x 2 + a 3 x 3 + b 1 x 1 x 2 + b 2 x 1 x 3 + b 3 x 2 x 3 + d 1 x 1 x 2 x 3
58 u ˜ = a 0 + a 1 x 1 + a 2 x 2 + a 3 x 3 + c 1 x 1 2 + c 2 x 2 2 + c 3 x 3 2 + d 1 x 1 x 2 x 3
* pq (parametric quantity) is the number of parameters in the empirical model.
Table 5. Different polynomial models and their calculated coefficients.
Model Number
Model 1Model 2Model 3Model 4Model 5
df47788
pq3229292828
a0193.0677265.7917252.6600107.1924243.0435
a129.3064−10.9065−28.8534339.6165−9.6697
a2−0.2001−0.2743−0.34091.7492−0.1567
a3−13.0701−27.4074−21.8174−12.5209−21.0499
b1-−1.2356-−5.8664-
b2-12.6075-−19.5877-
b3-0.0993-−0.0476-
c1--24.0635-−5.6679
c2--0.0007-−0.0015
c3--0.5695-0.4593
d1---0.36150.0260
R0.79010.81460.81070.83870.8112
R2adj0.58910.59390.58640.62930.5726
σ28.7528.5828.8527.3129.33
D0.87340.89050.88800.90730.8883
c = rD0.69010.72540.71990.76090.7206
df: degree of freedom, pq: the number of parameters in the empirical (polynomial) models. Statistical values of polynomial models (for n = 36 observations).
Table 6. Mean weight diameter of soil, shear stress, amount of stubble, and dust emission values depending on different tillage applications.
TrialsMean Weight Diameter (mm)Shear Stress
(N·cm−2)
Stubble Amount
(g·m−2)
Dust Emission
(mg·m−3)
20132014201320142013201420132014
CT5.18 ± 0.17 e6.66 ± 0.85 c0.45 ± 0.24 cd0.43 ± 0.12 c42.67 ± 5.03 g65.5 ± 6.50 d142.7 ± 10.80 b113.51 ± 10.23 c
RT111.57 ± 0.85 b9.15 ± 1.02 b0.72 ± 0.26 b0.75 ± 0.21 b72 ± 6.23 b98 ± 8.50 b40.4 ± 5.36 e35.6 ± 5.65 f
RT28.12 ± 0.55 c7.15 ± 1.03 c0.7 ± 0.16 bc0.68 ± 0.10 b50.6 ± 5.65 e70 ± 5.68 d73.75 ± 6.60 d58.53 ± 6.60 e
RT37.43 ± 0.65 d8.75 ± 0.65 b0.5 ± 0.13 bcd0.58 ± 0.09 bc62.99 ± 4.98 d83 ± 6.35 c134.5 ± 9.90 c90.7 ± 6.50 d
RT45.19 ± 0.25 e5.25 ± 0.36 e0.42 ± 0.09 d0.44 ± 0.08 c47.3 ± 6.65 f65.5 ± 5.65 d153.45 ± 11.25 a121.9 ± 9.68 b
RT54.66 ± 0.54 e5.49 ± 0.56 de0.4 ± 0.08 d0.44 ± 0.06 c68 ± 7.5 c89 ± 5.80 c140.7 ± 9.65 b131.6 ± 10.36 a
RT64.89 ± 0.65 e5.96 ± 0.69 d0.4 ± 0.07 d0.45 ± 0.09 c30.5 ± 3.56 h45.5 ± 4.36 e140.2 ± 10.69 b128.8 ± 9.80 a
NT14.17 ± 1.21 a12.7 ± 1.32 a1.23 ± 0.50 a1.06 ± 0.23 a128 ± 8.65 a158 ± 9.80 a35.11 ± 6.23 f27.73 ± 4.36 g
LSD0.5740.5370.2510.1982.7927.5434.1223.923
LSD: Least Significant Difference, CT: Conventional tillage, RT: Reduced tillage, NT: No tillage, a–h: different letters show statistical differences at 0.05 statistical significance.
Table 7. Performance of the models.
ObservedPredicted
Model 4ANN
27.7311.8928.70
35.1126.6829.24
40.4042.7346.08
73.7597.0870.25
121.90129.49119.89
128.80123.56126.95
131.60121.01141.93
134.5098.96134.50
140.20139.75138.16
140.70138.31128.30
142.70136.95140.86
153.45133.95139.91
R20.90630.9809
RMSE15.146.70
ε22.506.11
Disclaimer/Publisher’s Note: The statements, opinions and data contained in all publications are solely those of the individual author(s) and contributor(s) and not of MDPI and/or the editor(s). MDPI and/or the editor(s) disclaim responsibility for any injury to people or property resulting from any ideas, methods, instructions or products referred to in the content.

