Article

Estimates of Dust Emissions and Organic Carbon Losses Induced by Wind Erosion in Farmland Worldwide from 2017 to 2021

1
Key Laboratory of Wetland Ecology and Environment, Northeast Institute of Geography and Agroecology, Chinese Academy of Sciences, Changchun 130102, China
2
Heilongjiang Province Key Laboratory of Geographical Environment Monitoring and Spatial Information Service in Cold Regions, School of Geographical Sciences, Harbin Normal University, Harbin 150025, China
3
School of Energy and Environment, Shenyang Aerospace University, Shenyang 110136, China
*
Authors to whom correspondence should be addressed.
Agriculture 2023, 13(4), 781; https://doi.org/10.3390/agriculture13040781
Submission received: 28 February 2023 / Revised: 23 March 2023 / Accepted: 27 March 2023 / Published: 28 March 2023

Abstract

:
Wind erosion can cause high dust emissions from agricultural land and can lead to a significant loss of carbon and nutrients from the soil. The carbon balance of farmland soil is an integral part of the carbon cycle, especially under the current drive to develop carbon-neutral practices. However, the amount of global carbon lost due to the wind erosion of farmland is unknown. In this study, global farmland dust emissions were estimated from a dust emission inventory (0.1° × 0.1°, daily) built using the improved Community Multiscale Air Quality Modeling System–FENGSHA (CMAQ-FENGSHA), and global farmland organic carbon losses were estimated by combining this with global soil organic carbon concentration data. The average global annual dust emissions from agricultural land from 2017 to 2021 were 1.75 × 10⁹ g/s. Global dust emissions from agricultural land are concentrated in the UK, Ukraine, and Russia in Europe; in southern Canada and the central US in North America; in the area around Buenos Aires, the capital of Argentina, in South America; and in northeast China in Asia. The global average annual organic carbon loss from agricultural land was 2970 Gg for 2017–2021. The spatial distribution of emissions is roughly consistent with that of dust emissions, which are mainly concentrated in the world’s four major black soil regions. These estimates of dust and organic carbon losses from agricultural land are essential references that can inform the global responses to the carbon cycle, dust emissions, and black soil conservation.

1. Introduction

Wind-driven soil erosion is a meteorological event that occurs when soil or soil parent material is lifted into the air by air currents, which transport it long distances before it is deposited back to the surface [1,2]. Wind erosion produces a large amount of airborne dust particles [3,4], forming around 1~3 billion tons of dust aerosol per year, which is about 30–50% of the total global aerosol mass [5,6]. Dust aerosol has a significant impact on human health, air quality, ecology, and the climate [7,8,9,10]. A series of soil transport processes can destroy soil structure, and blow, transport, and deposition processes can result in a significant loss of soil nutrients, which can pose a serious threat to the productivity and sustainability of global agriculture [11]. Large quantities of organic carbon are lost from the soil through wind erosion. Soil organic carbon (SOC) plays a key role in regulating the global carbon cycle and climate change [3,12,13]. Small changes in soil organic carbon stocks can lead to large changes in atmospheric carbon dioxide (CO2) concentrations [3,14]. As the most erodible organic carbon source that is subject to disturbance from human activities, estimating wind dust emissions and organic carbon loss from agricultural land is extremely important to any analysis of human responses to the greenhouse effect and land degradation [15].
Wind erosion is the wind-driven movement of soil particles and has three phases: particle entrainment, transport, and deposition [2,16]. When the surface wind speed exceeds a threshold wind speed, wind erosion occurs, and a large number of fine particles rise from the ground [17]. Soil nutrients are generally concentrated in fine particles, and so the loss of fines directly drives a reduction in soil nutrients and soil effectiveness [18]. The long-distance transport of soil from wind erosion impoverishes agricultural soil and intensifies desertification, which threatens agricultural productivity [19,20]. Previous studies into soil organic carbon loss have mostly focused on arid and semi-arid areas or on small regional scales [2,15,21]. Global scale losses in areas with active agricultural wind erosion are unclear. To date, there are few global-scale studies into soil organic carbon loss due to wind erosion [14,21]. To bridge this gap, we estimated SOC losses due to wind erosion using a wind erosion model and global data on SOC proportions.
Several models that emphasize wind erosion have been proposed to estimate dust emissions. Owen [22] developed a wind speed profile for the leapfrog layer in 1964 and obtained the mass flux of particles per unit width perpendicular to the fluid plane based on two complementary assumptions about the interaction between turbulent winds and uniform sand or soil particle motion. The wind erosion equation (WEQ) is the first model that estimated annual wind erosion in the field in 1965 and includes 5 groups of 11 variables: climate factors, soil erodibility, soil surface roughness, field length, and crop residue [23]. The main limitation of the WEQ model is its poor regional adaptability. It is mainly based on empirical estimation and does not consider the complex and variable relationships between various wind erosion factors for soil, which research into wind erosion mechanisms has shown to be important. Gomes [24] combined models that represent two processes for fine dust release in arid regions (leapfrogging and sandblasting) to form the dust production model (DPM) in 2003. Shao [25] proposed a simple spectral dust emission scheme in 2004, which can be used to calculate dust emissions for all particle sizes. These models are all designed to be used for small areas. A new offline dust cycle model that uses the Lund–Potsdam–Jena dynamic global vegetation model to calculate time-varying dust sources was also proposed in 2011 [26,27]. In that model, adjustable thresholds are used to determine vegetation cover, soil moisture, snow depth, and threshold friction velocity for surface emissions, so as to improve the accuracy of the model [27]. It can be seen that there has been a general improvement in dust models over time. Today, dust models are gradually being combined with air quality models (e.g., WRF-Chem, CAMx, CUACE/Haze, and CMAQ), which are widely used for the assessment of dust emissions [15]. This study uses a new windblown dust emission module (FENGSHA) from the Community Multiscale Air Quality Modeling System (CMAQ) to estimate dust and organic carbon losses from agricultural fields. The algorithm in the FENGSHA module is derived from the formula proposed by Owen [22]. FENGSHA was built to simulate wind erosion processes using inputs from other modules in CMAQv4.7 and has the strength of providing accurate estimates of dust emissions at a global scale. The module has been used for detailed parameterization studies to investigate the key factors that determine the occurrence and variability of dust emissions.
The amount of organic carbon that is lost due to wind erosion is of global importance. Several studies have estimated the loss of organic carbon from soils in different regions. It has been estimated that some soils lose between 20 and 80 tons of carbon/ha, which is mainly emitted into the atmosphere [28]. In China, the loss of SOC due to wind erosion was estimated to be about 75Tg C yr−1 in 1990 [11]. Organic carbon emissions in some areas of Australia are estimated to be 1.59Tg SOC yr−1 [21]. These studies highlight the severity of SOC losses. Soil surfaces on agricultural land are subject to greater human interference than other soil surfaces [15] and are thus an important source of dust emissions from wind erosion. The loss of organic carbon from agricultural soils is a huge challenge for coping with the greenhouse effect and represents the loss of basic land materials [29]. Organic carbon loss from wind erosion should therefore be considered so that we can further understand the global carbon cycle and land degradation.
Although many studies have looked at SOC loss in specific regions, the results are not uniform. Despite the importance of dust in the global carbon cycle, carbon loss due to wind erosion remains a poorly understood and unquantified component of the global carbon budget [3]. The main objective of this study was to estimate global emissions of dust and organic carbon losses from agricultural land due to wind erosion. The results of this study provide valuable information for understanding dust emissions, global carbon cycling, and black soil conservation.

2. Material and Methods

2.1. Meteorological Data Improvement

Research on wind erosion in farmland typically depends on the relevant meteorological data of the region. Weather research forecast (WRF) models are widely used for the simulation of meteorological data due to their high resolution and detailed surface processes [30]. However, WRF models are at a regional scale. Based on this, this study uses global forecast system (GFS) weather data instead of WRF data. In this study, the wind velocity (u) in the longitude direction and the wind velocity (v) in the latitude direction in the GFS meteorological data were converted to the average wind velocity at 10 m, and then the average wind velocity at 10 m was converted to the ground wind velocity. The specific calculation formula is as follows [31]:
u z = u 2 + v 2
u z = u * k l n z z o
For Formulas (1) and (2), u z is the mean wind speed (m/s) at z (m) height; u * is the critical wind speed; k is constant 0.4; Z o is pneumatic roughness.

2.2. Farmland Cultivation Area Adjustment

Only when the discharge flux is multiplied by the area of soil wind erosion in farmland can the total emissions of soil wind erosion dust in the farmland be obtained. Therefore, the determination of the wind erosion area of farmland is the key to accurately estimating dust emissions. This study determines the wind erosion area of farmland by means of global crop almanac data and global crop area data. We process two kinds of data into 0.1° × 0.1° grid data. The determination of the global area of wind erosion is divided into two scenarios [30], the first of which is limited by the date of the end of cultivation and the date of the end of harvest to determine the area of farmland soil where wind erosion can occur globally; the second scenario is to determine the global area of cropland soil that is likely to be subject to wind erosion by the date of the end of sowing plus the date of one week later and the date of the end of harvest. By comparing the two situations, the method and source distribution of soil wind erosion in farmland are selected. The first case is to judge the area of each grid of crops where wind erosion can occur; The second case is that in the first case, the date of the end of planting is extended by 7 days as the date when the global farmland soil cannot be wind eroded, and the end date of the global farmland soil wind erosion is still the date of the end of the harvest

2.3. Adjustment of Wind Erosion Parameters in Farmland

The roughness of the surface can seriously affect the process of dust. Surface roughness represents the ability of surface features to impede wind erosion, which can affect critical friction velocities by covering parts of the soil surface. Early studies have developed formulas for the effect of surface roughness on critical friction velocity [32]:
f R = 1.0 ln z o z o s ln a × δ b z o s 1
In Formula (3), 𝑧0 = 0.0001, is aerodynamic roughness (m); 𝑧o𝑠 = 0.0000333 is the local roughness of the local soil surface (m); a and b are the empirical coefficients 0.35 and 0.8, respectively; δ = 0.1 is the distance from the discontinuous point of roughness to the downstream (m).
In the wind erosion process of farmland, it is also necessary to determine the effect of vegetation cover on the critical friction velocity. When the local surface covers vegetation, it has a very important protective effect on the soil at the surface, thereby reducing the occurrence of wind erosion in farmland. Compared to perennially exposed land, 20 per cent of vegetation cover can halve the movement of soil particles in farmland. The formula for the vegetation cover impact factor f v e g is as follows [33]:
f v e g = 1.0 min L A I , 0.35 / 0.35
In Formula (4), LAI is the leaf area index data. The formula indicates that when the leaf area index exceeds 0.35, vegetation cover is almost 100%. Although the vegetation cover is high, wind erosion is not possible, so this study set f to constant 0.1 when the leaf area index exceeds 0.35.
Snow on exposed ground can not only directly inhibit dust emissions from soil surfaces, but also reduce them by melting to increase soil moisture. The formula for snow cover in dust emissions is as follows [30]:
f s c = 1.0 s n o w c o v e r / 100
In Formula (5), s n o w c o v e r is the global snow cover data for MOIDS.
Soil moisture can enhance the structure of soil agglomerates to reduce soil wind erosion activity. Before determining the effect of soil moisture, it is necessary to determine the limit value of soil particle adsorption water, which is the minimum value of soil moisture and increases with the increase of soil viscose to limit the effect of soil moisture. The critical friction velocity is affected only when soil moisture exceeds the limit of soil particle adsorption water. On this basis, the effects of soil moisture and critical friction velocity were determined. The specific formula is as follows [32,34]:
w l = 0.0014 % f c l a y 2 + 0.17 % f c l a y
f w = 1   w w l 1 + 1.21 w w l 0.68 0.5   w w l  
In Formula (6), f c l a y is the clay data in soil texture data; Formula (7), w is the content of gravity water in the soil.

2.4. Estimating Global Dust Emissions and Organic Carbon Losses from Wind Erosion on Agricultural Land

Dust emissions from agricultural fields were estimated using the Owen algorithm from the CMAQ-FENGSHA model:
DUSTEMIS = k × A × ρ g × u * u * 2 u t * 2 × S E P × S
DUSTEMIS in Equation (8) is total dust emissions from farmland; k is the ratio of vertical and horizontal fluxes; A is a scale factor; ρ is the air density; g is gravitational acceleration (9.8 m/s2); u * is the friction velocity; u t * is the critical friction velocity; S E P is the soil erodibility factor; and S is the wind-erodible area of farmland. More detailed information about the formula can be found in our previous study [30].
The organic carbon loss is calculated using the following equation:
TOC = DUSTEMIS × P  
TOC is the amount of organic carbon lost (Gg); P is the percentage (by weight) of organic carbon in the soil surface layer. Global organic carbon content data are derived from a gridded soil dataset developed for the Earth System Model [35]. The dataset is derived from the World Soil Map and the National Soil Database and the spatial distribution of soil properties is derived using area weighting. The dataset is available at resolutions of approximately 1 km and 10 km, while the vertical variability of soil properties is captured in eight layers, with the deepest layer extending to 2.3m in depth. We used soil property data from the uppermost vertical layer (0–4.5 cm) of the 1 km resolution dataset. The original data are calculated on a 43,200 × 16,800 grid, while DUSTEMIS uses a 3600 × 1800 grid, so we resampled the original data to a 3600 × 1800 grid.

2.5. Dataset

FENGSHA, as implemented in the CMAQ model, is a module to simulate wind erosion based on inputs from CMAQ. The Owen dust formula is revised in FENGSHA, based on wind speed, soil moisture, soil texture, and erodible land-use type. The improved FENGSHA model requires the following datasets: meteorological data, snow cover, land use, soil texture, vegetation data, and farmland data. The 10 m wind speed and soil moisture data used in this study were obtained from the GFS reanalysis data, jointly produced by the National Centers for Environmental Prediction (NCEP) and the National Center for Atmospheric Research (NCAR). Snow cover information was obtained from MODIS/Terra daily snow data from the National Snow and Ice Data Center (NASA). The MODIS/Terra Snow Cover Daily L3 Global 0.05Deg CMG (MOD10C1) data, processed by the Integrated Climate Data Center (ICDC) of the University of Hamburg with a resolution of 0.05° × 0.05°, were selected for this study for ease of use [36]. Global land cover data were obtained from the University of Maryland, having been derived from data from the National Oceanic and Atmospheric Administration (NOAA) Advanced Very High-Resolution Radiometer (AVHRR) satellite sensor using the method in Hansen and Reed [37] to distinguish between 14 land cover classifications at a resolution of 1 km × 1 km. Soil texture data were obtained from the Food and Agriculture Organization of the United Nations (FAO) and from the International Institute for Applied Systems Analysis (IIASA). From these sources, we collected a large amount of regionally and nationally updated soil information and combined it with the FAO Global Digital Soil Information Map, provided at a scale of 1:5,000,000, to form a new integrated and coordinated World Soil Database Harmonized World Soil Database (HWSD) with a resolution of 0.1° × 0.1°. The Normalized Difference Vegetation Index (NDVI) data for 2005 and 2010 were used to identify areas of farmland subjected to wind erosion, for comparison with the global farmland area that is subject to wind- erosion based on the Global Crop Almanac (GCA) method. Leaf area index data were obtained from the reanalysis data integrated by Klingmuller et al. [38] with a spatial resolution of 0.1° × 0.1° and a temporal resolution of one month. We used annual global farmland crop area data collected by Sacks et al. [39], which comprise 6 different datasets of planting and harvesting dates for 19 major crops, typical crop planting and harvesting date ranges, crop, and region classifications. The global farmland crop area data used in this paper were derived from a spatial production allocation model using a cross-entropy method to make reasonable estimates of crop distribution across 42 crops and 2 production systems based on specific input data.

3. Results

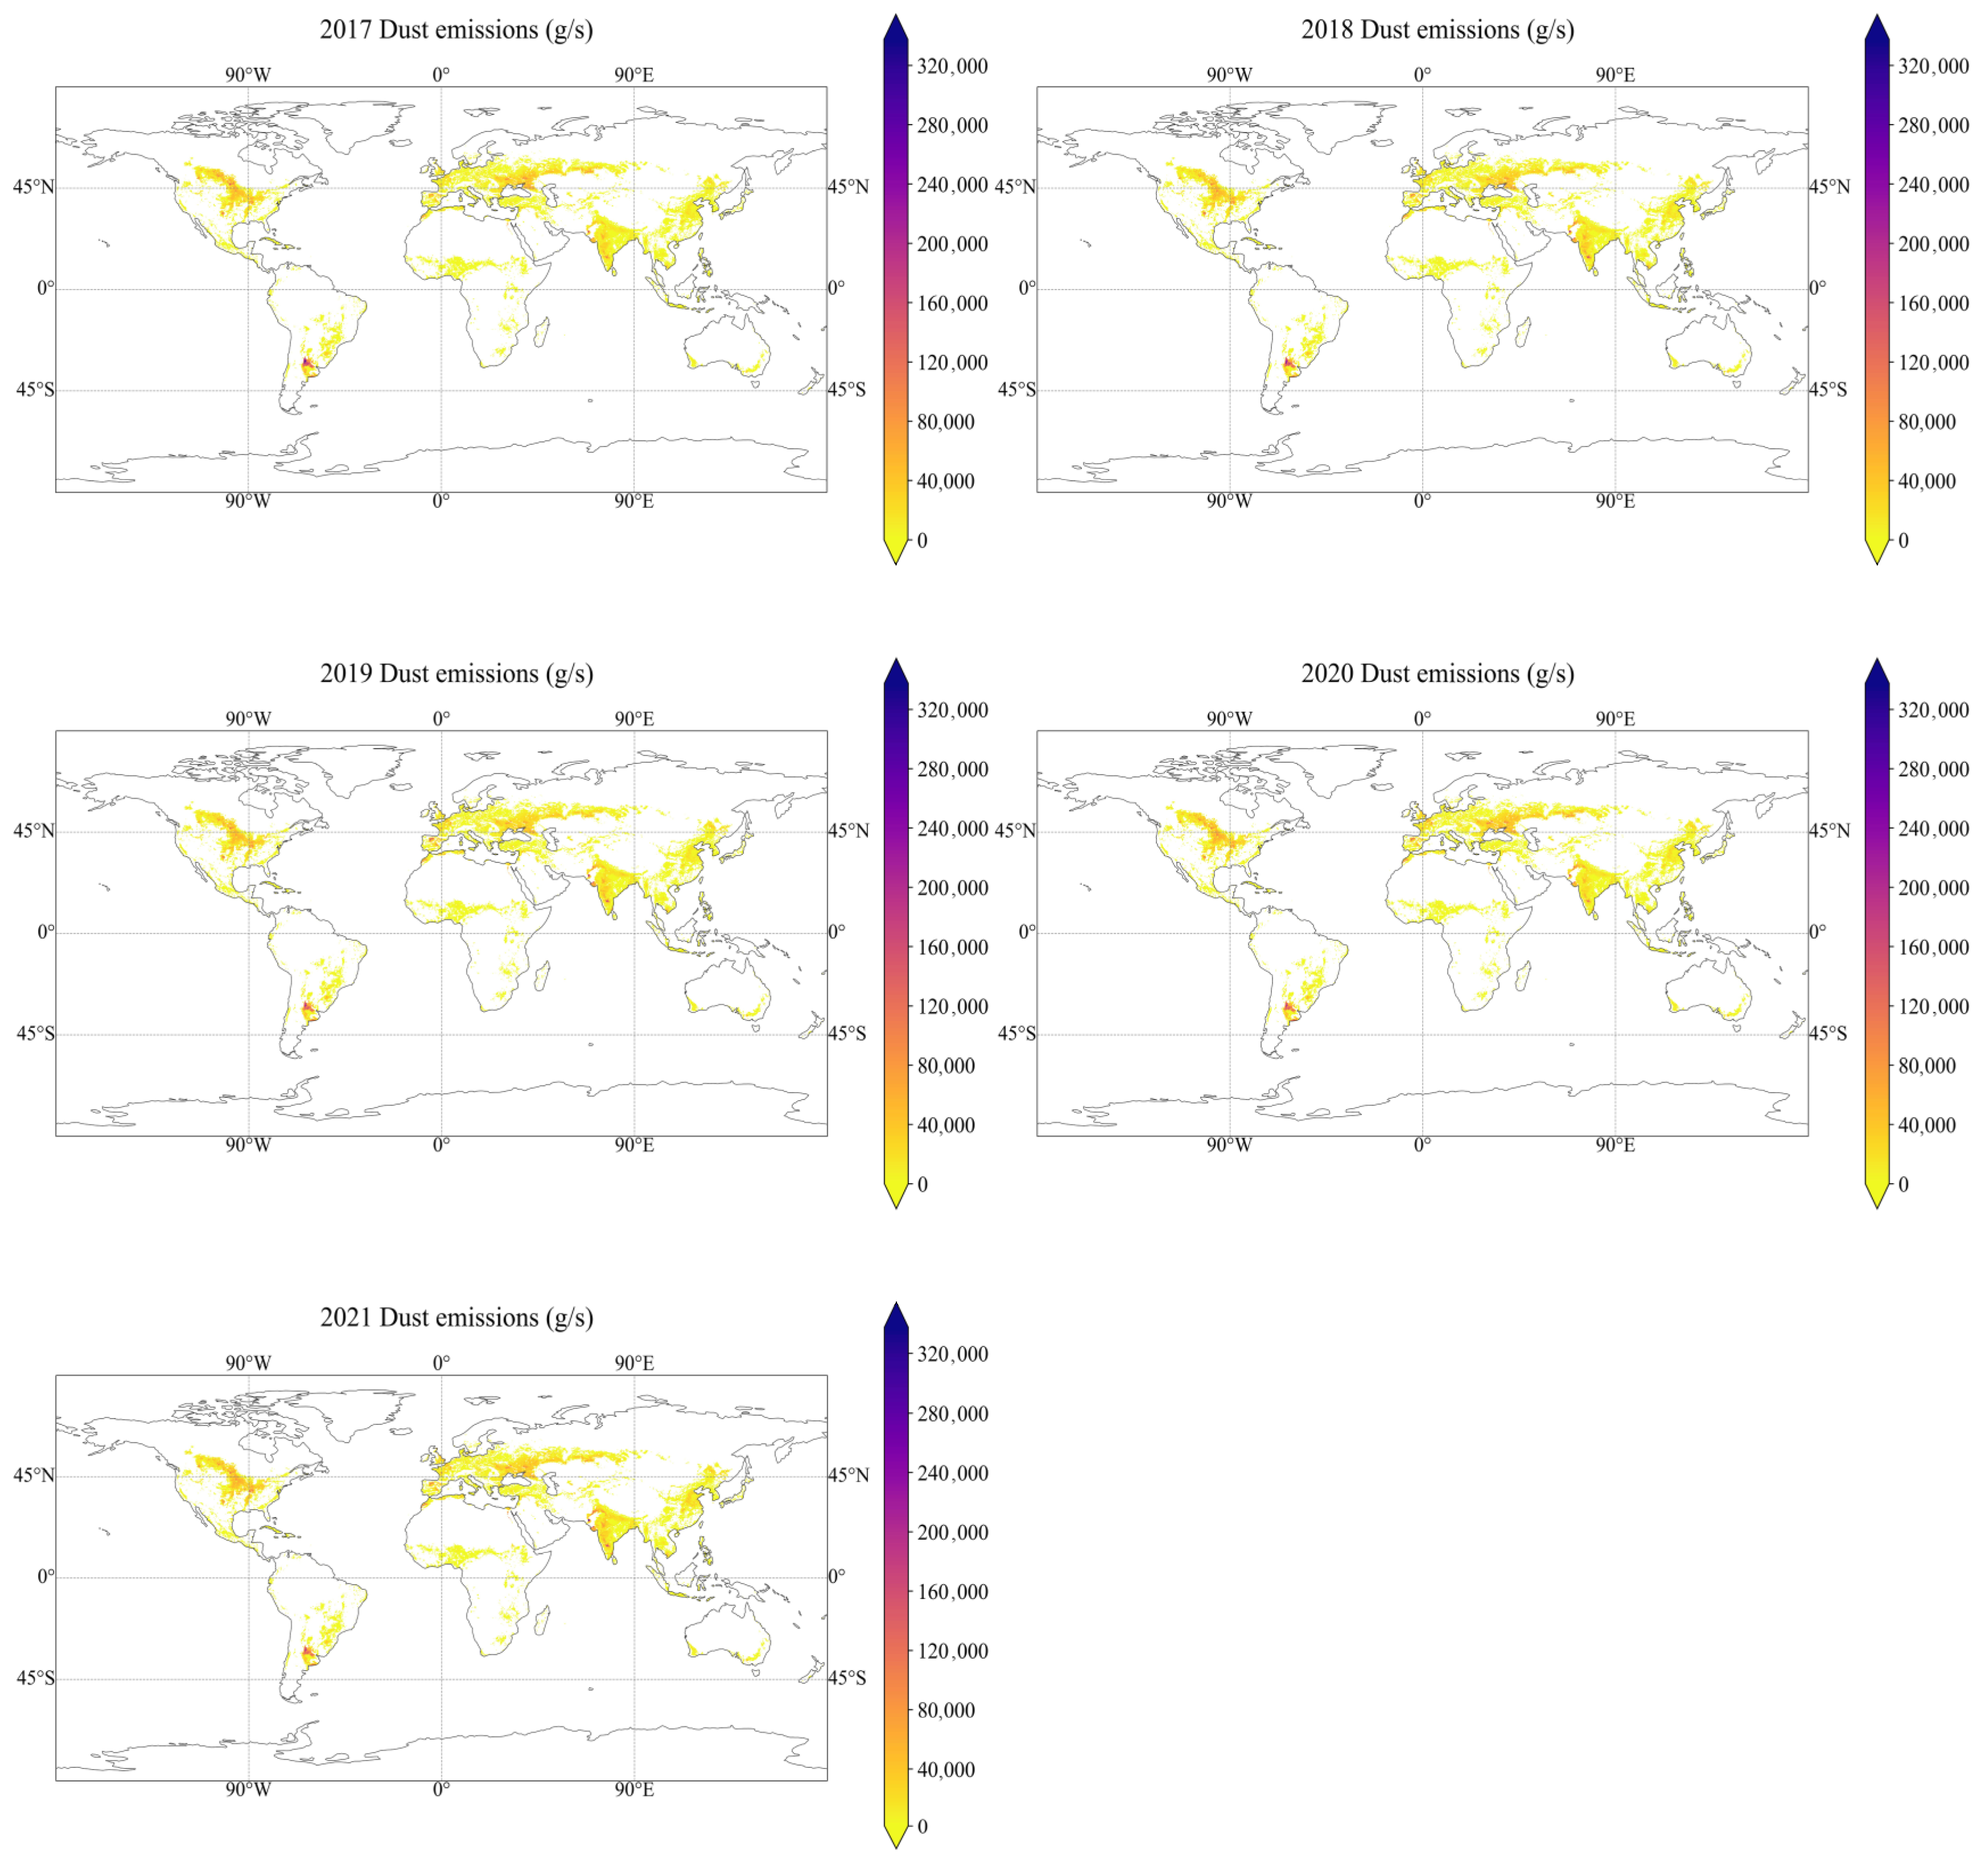
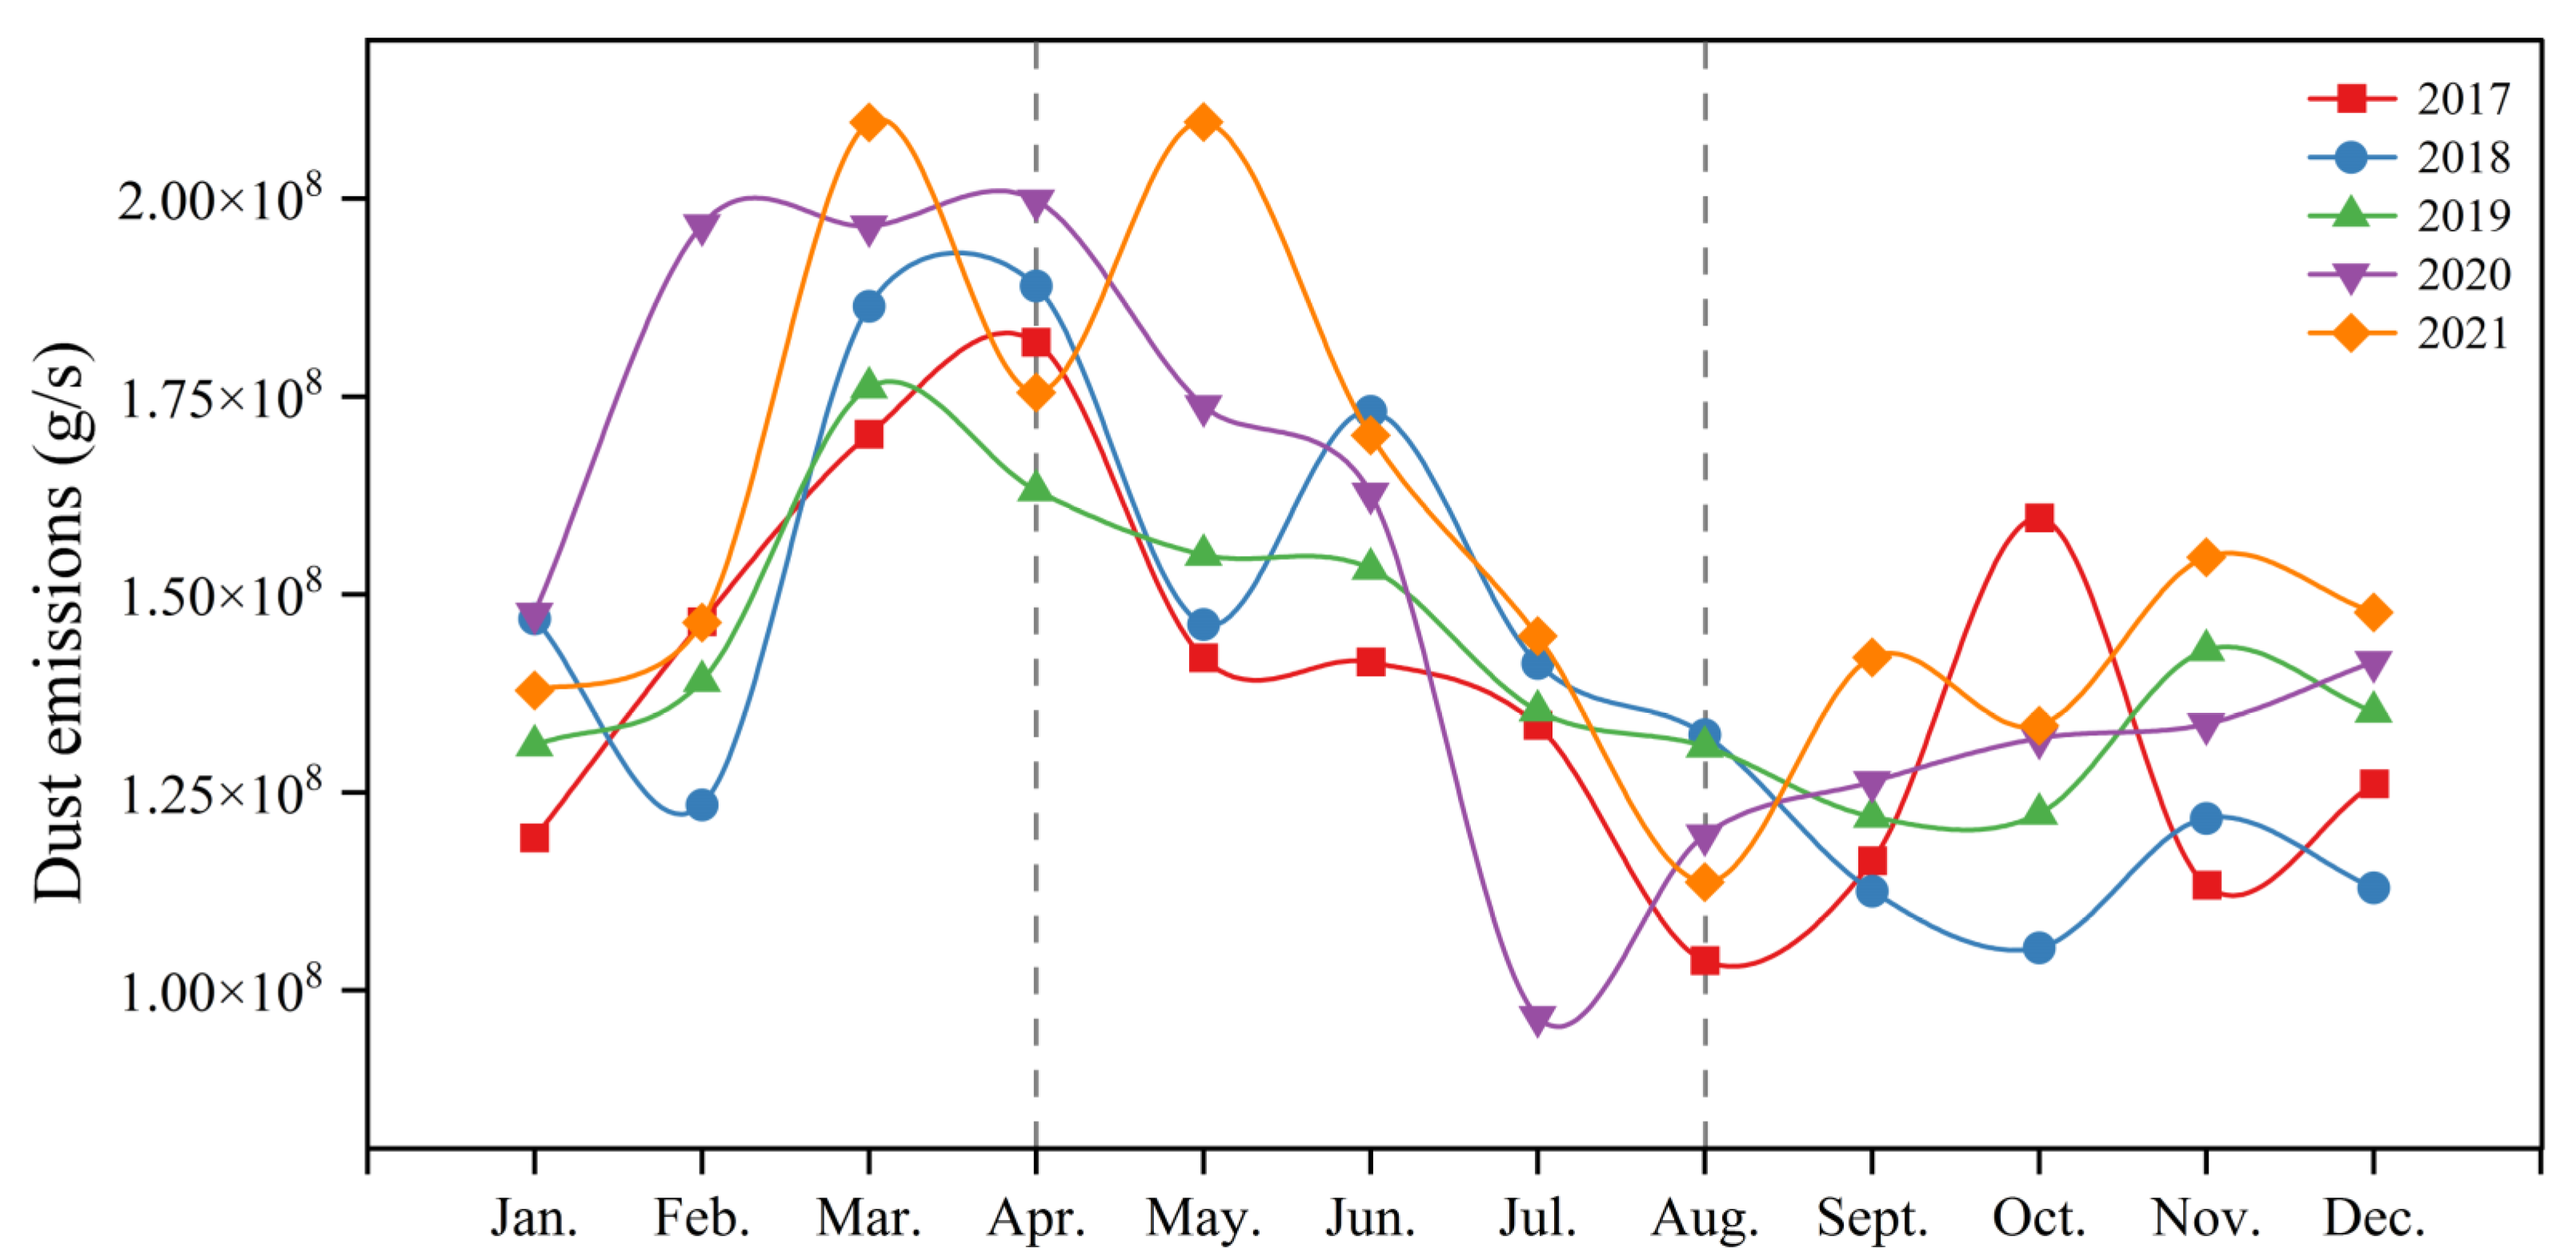
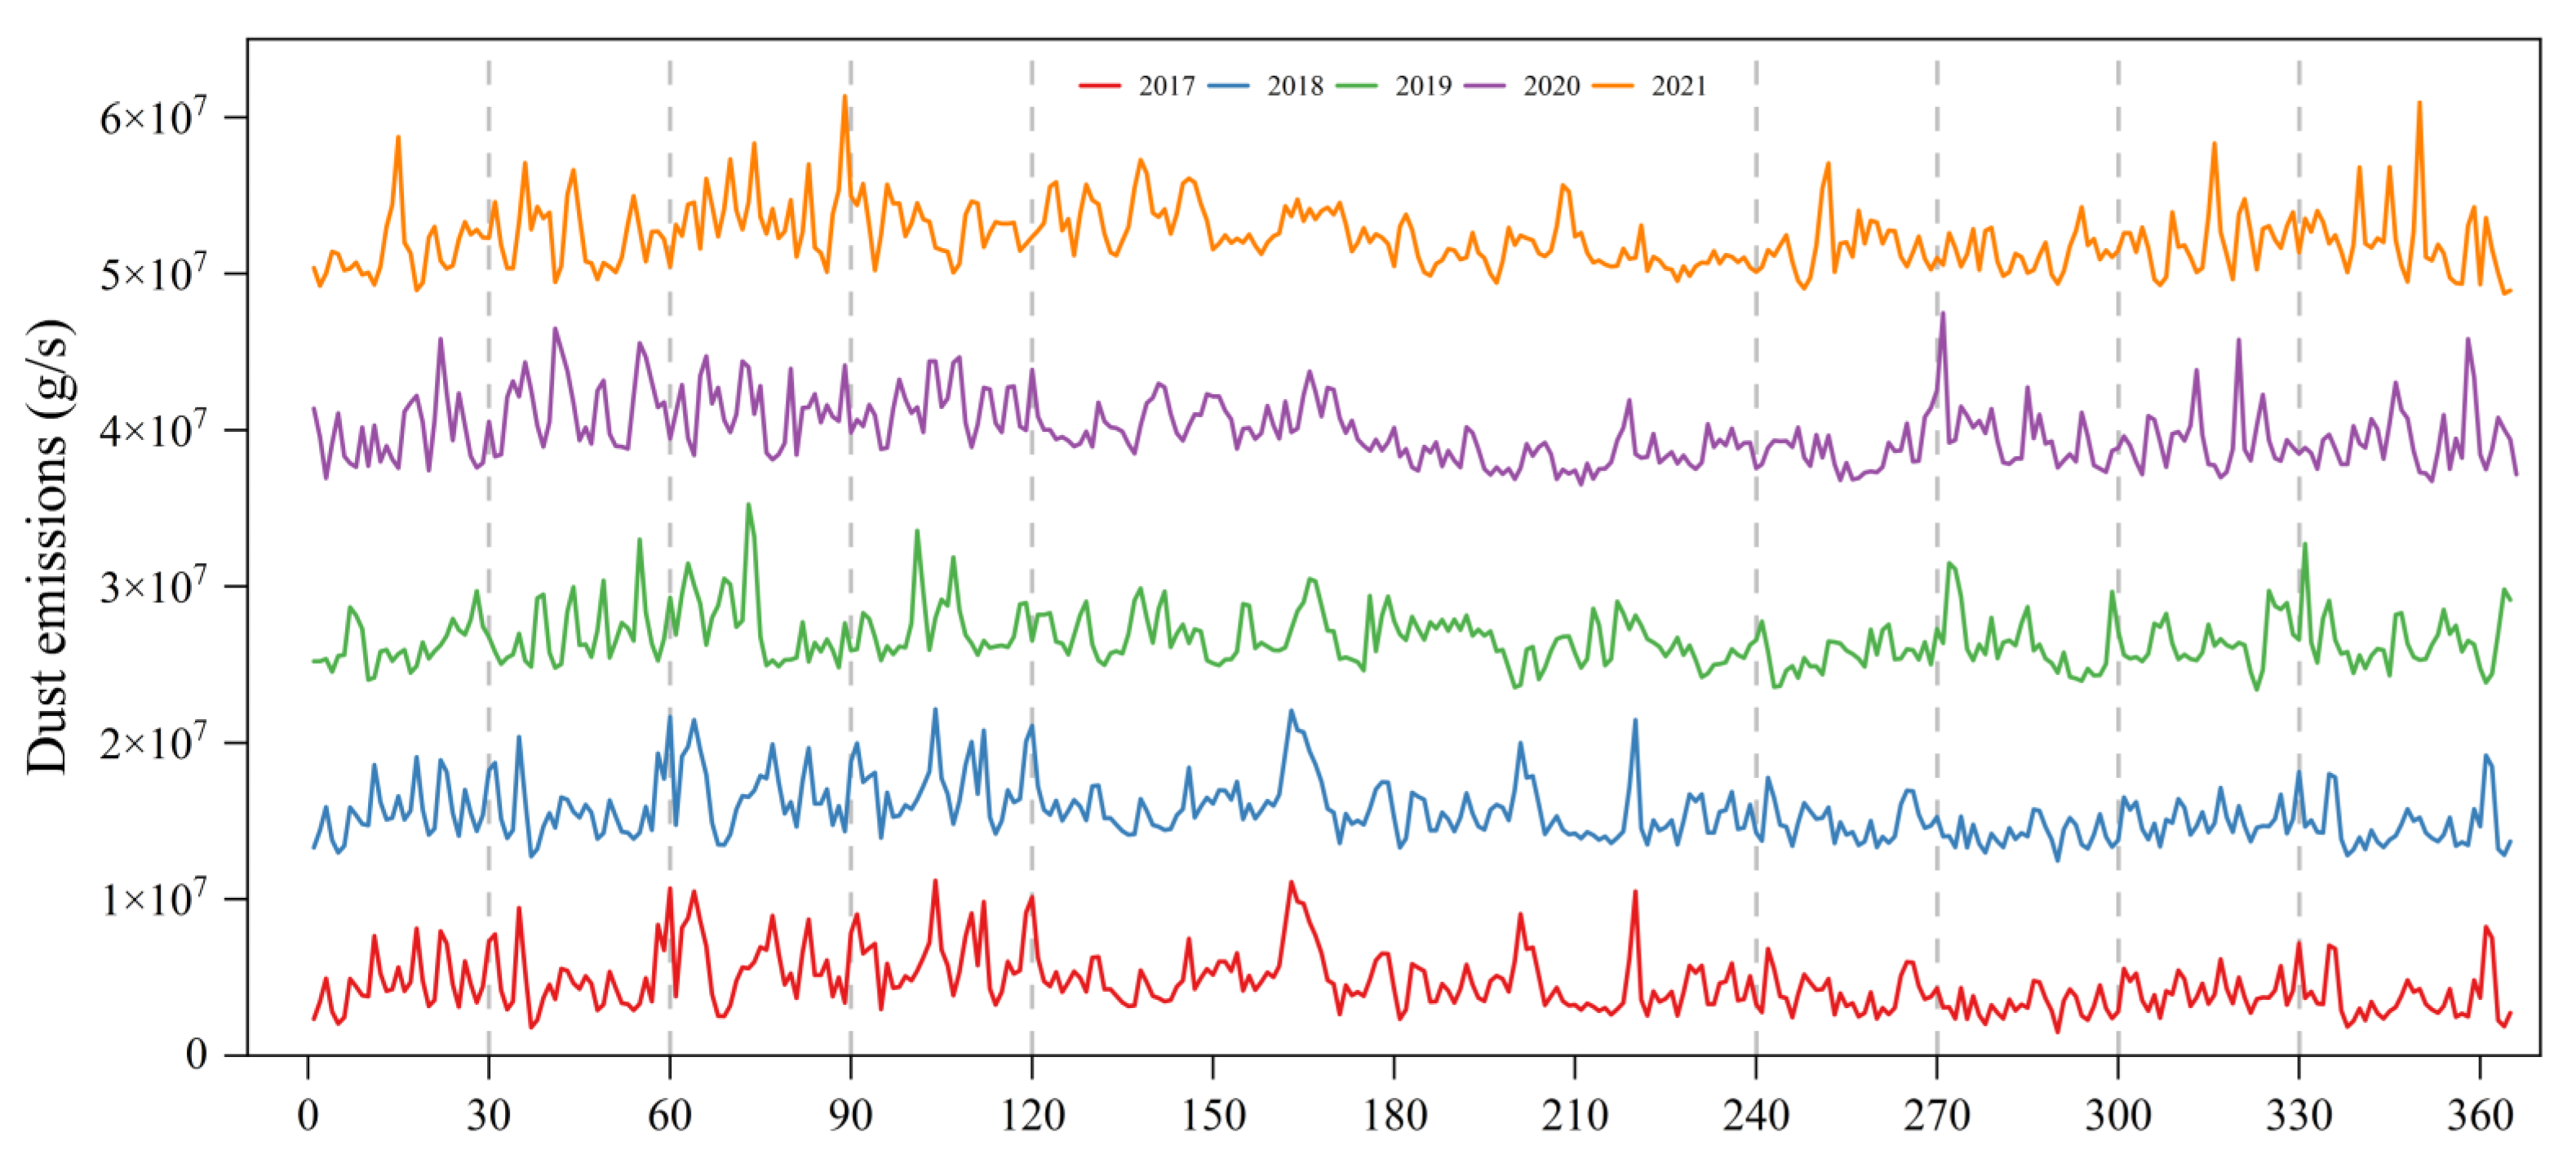
3.1. Characteristics of Global Wind Erosion Dust Emissions from Agricultural Land

The global distribution of emissions shows that the wind erosion of farmland is particularly severe in the European region along the Ukrainian and Russian borders and near the border to the Urals (Figure 1). The Aberdeenshire region of the UK also has a large area of farmland that is subject to wind erosion. In Asia, dust emissions are concentrated in the Bangalore, Mumbai, and Rajkot regions of India and in the northeast of China, where there are areas of farmland. In North America, high levels of wind erosion of agricultural soils occur in the midwestern region of the United States, and high dust levels also occur in the more agriculturally developed regions of North Dakota, South Dakota, and Nebraska. High dust emissions from agricultural lands also occur in Saskatchewan in southern Canada, which is an area of active agricultural activity. In South America, wind erosion mainly occurs near Buenos Aires, the capital of Argentina, which is an important agricultural and pastoral area in Argentina where the Pampas is rich in wheat, corn, and other crops. The main area of wind erosion in Oceana is in Western Australia. The changes caused by wind erosion of farmland each year are not immediately obvious, but changes in the degree of wind erosion that farmland is subjected to are clearer.
The annual global dust emissions from agricultural land for each year from 2017 to 2021 are 1.65 × 10⁹ g/s, 1.69 × 10⁹ g/s, 1.71 × 10⁹ g/s, 1.83 × 10⁹ g/s, and 1.89 × 10⁹ g/s, respectively, with an average annual emission rate of 1.75 × 10⁹ g/s. The wind erosion intensity of global agricultural land is increasing year by year, with an annual growth rate of 14%. Figure 2 shows global monthly emissions of dust over recent years and shows that dust emissions peak in February, March and April, and drop to a minimum in August. The overall monthly dust emissions are divided into three phases: a sharp increase from January to April, a sharp decrease from April to August, and a slow increase from August to December.
The emission of dust from agricultural fields is influenced by many factors, such as wind speed, soil moisture, and crop height, and levels of wind erosion, therefore, differ day to day, as shown in Figure 3.
There are large peaks in daily dust emissions in February, March, and April, with approximately 5 to 6 high-dust-emission days per month, while daily emissions in July, August, and September fluctuate slightly, and then, in October, November, and December, similar peaks occur to those seen at the beginning of the year, with approximately 2 to 3 high-dust-emission days per month.

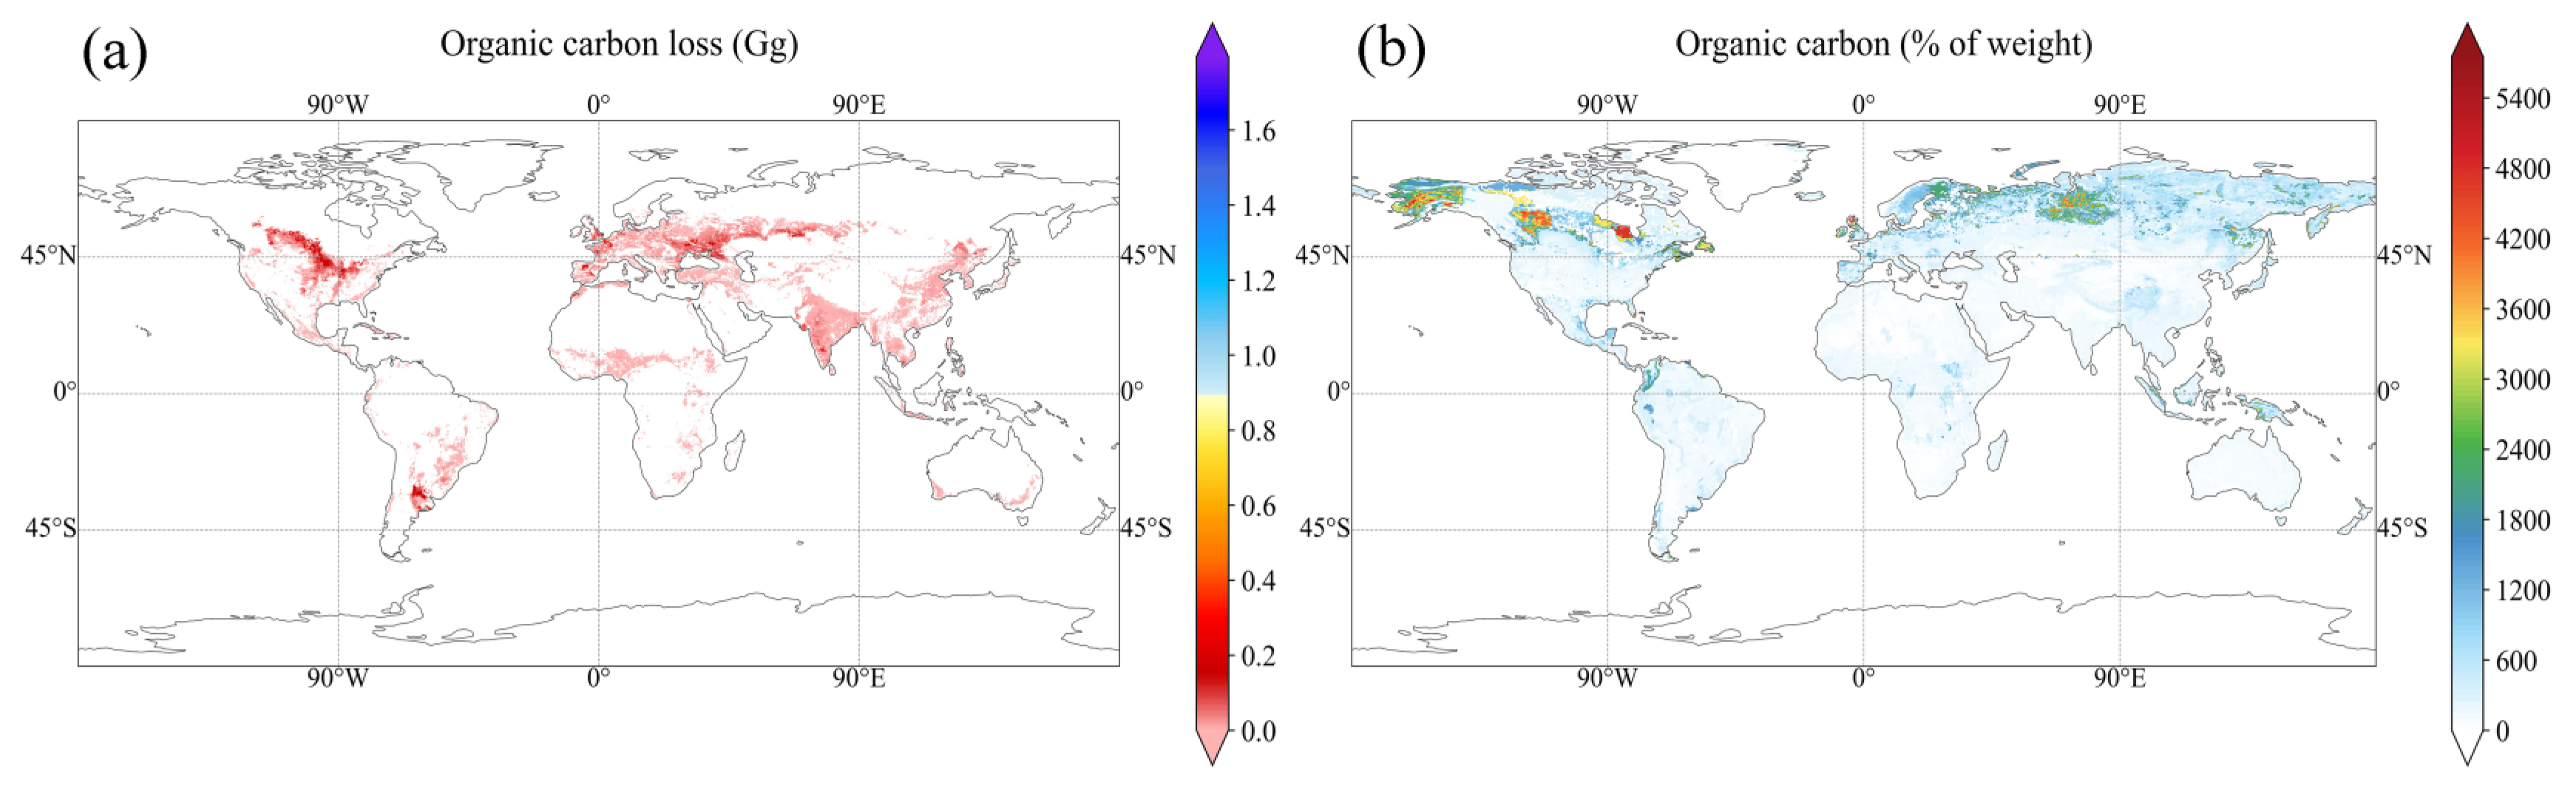
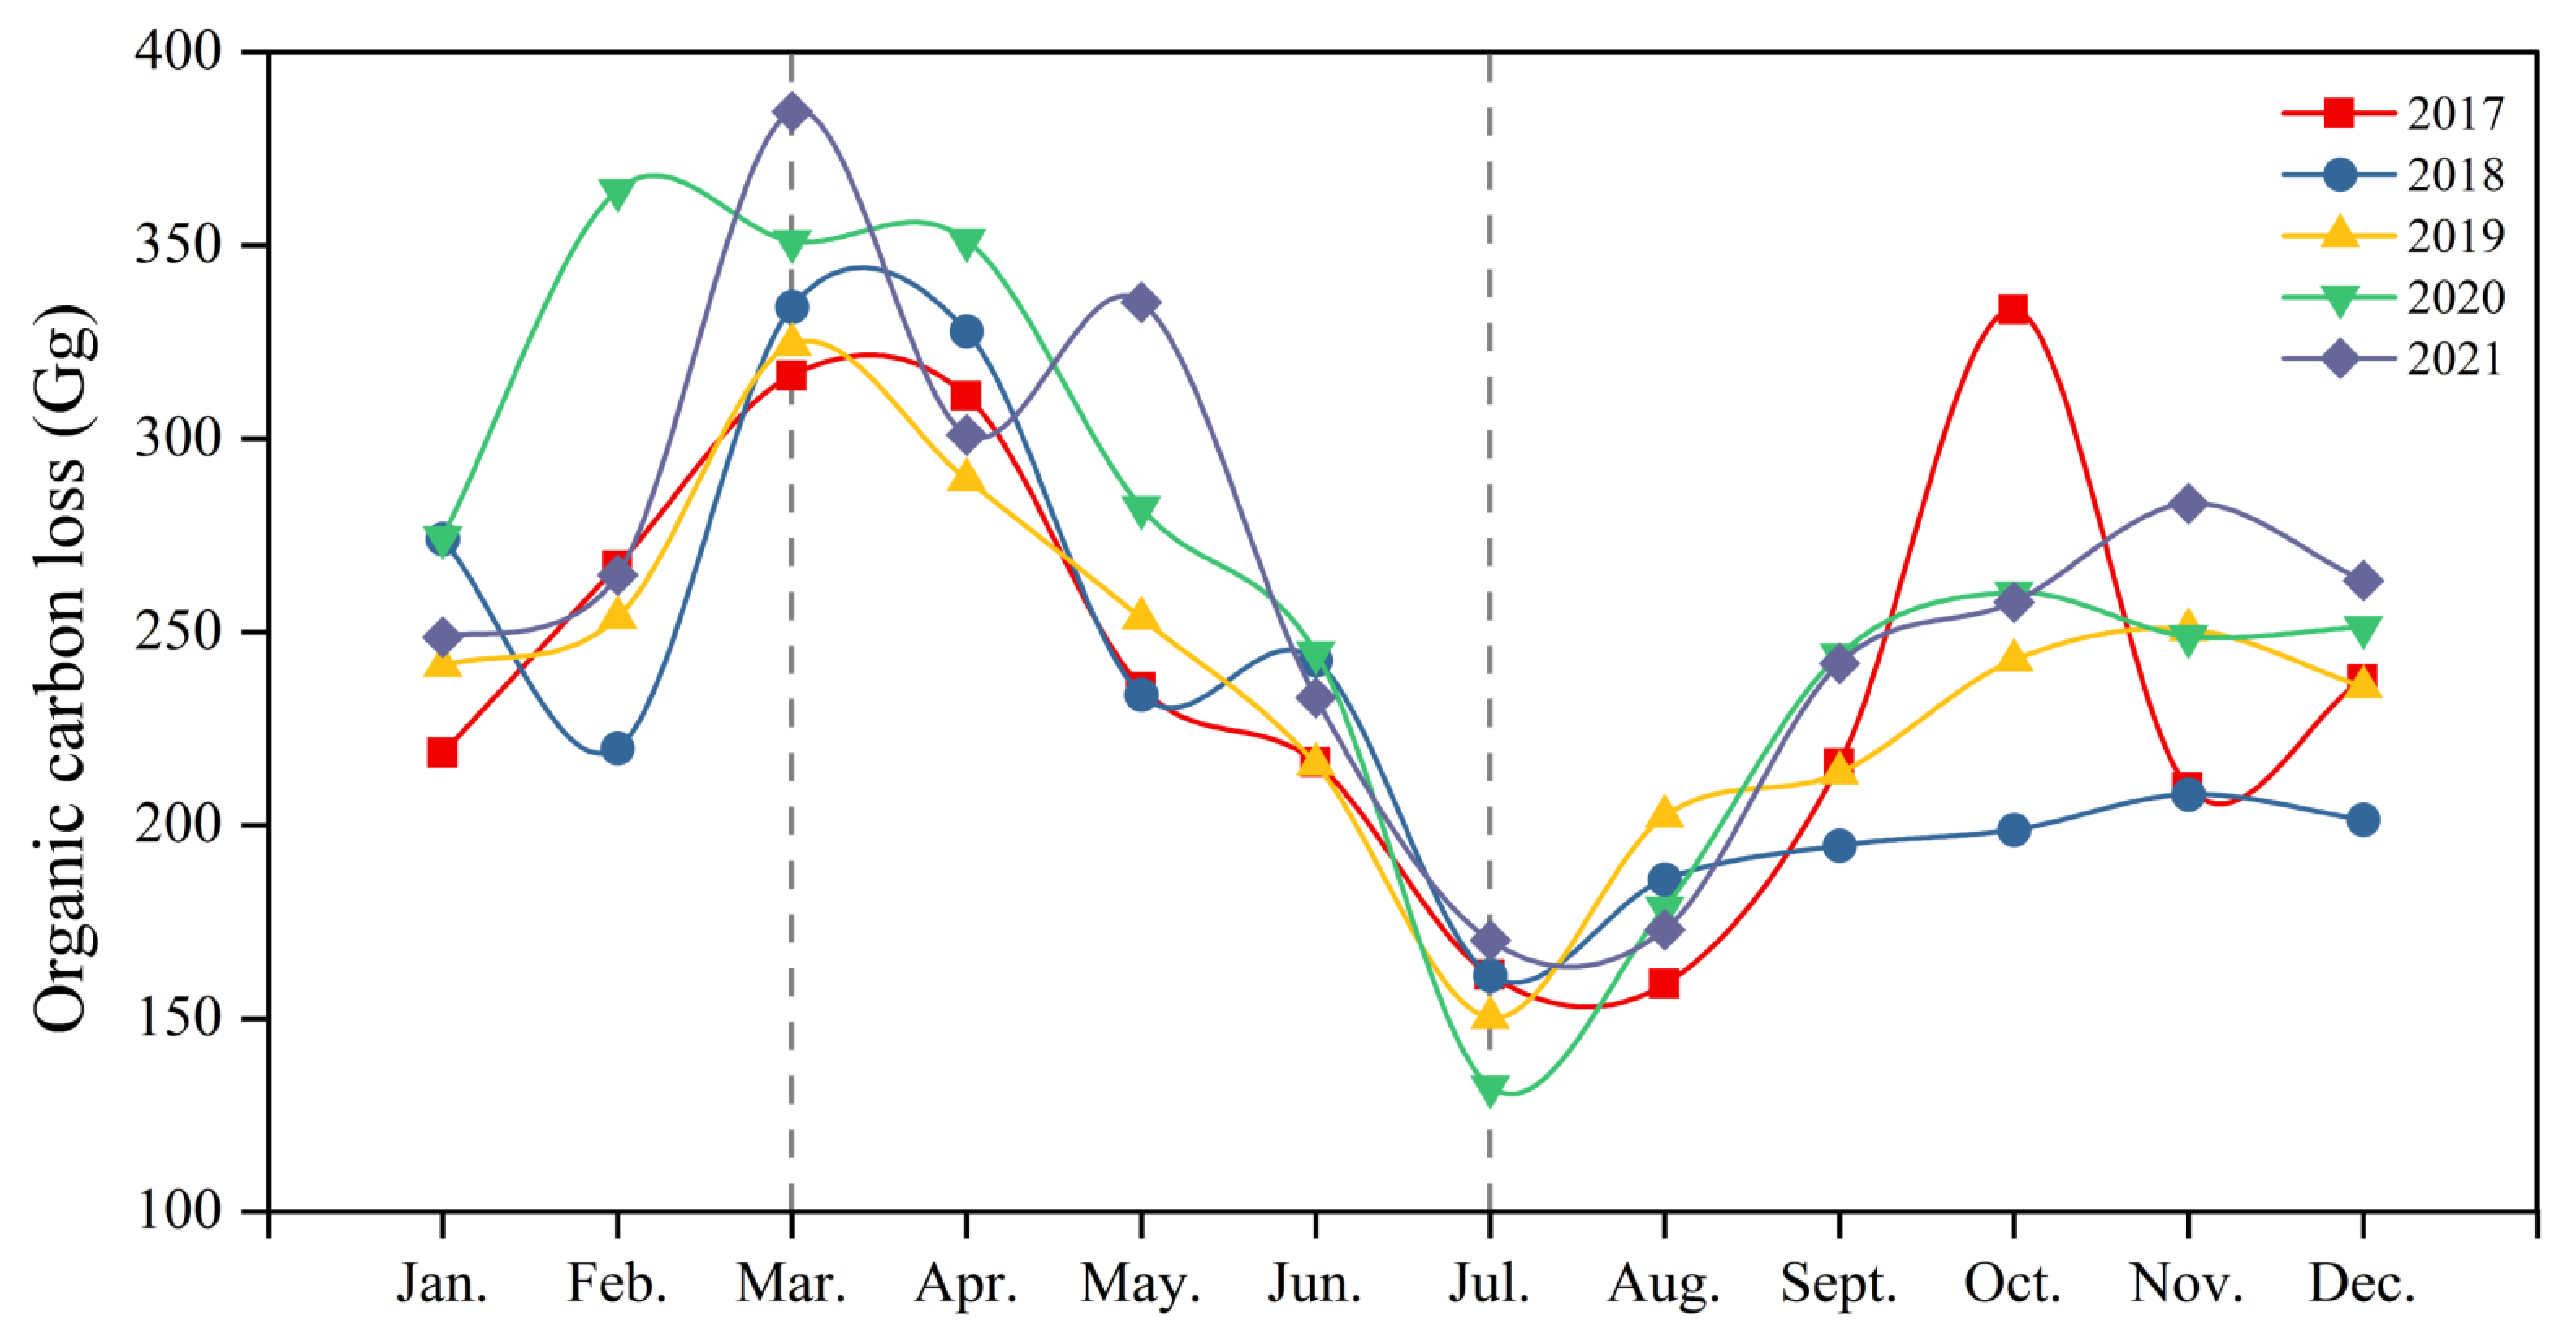
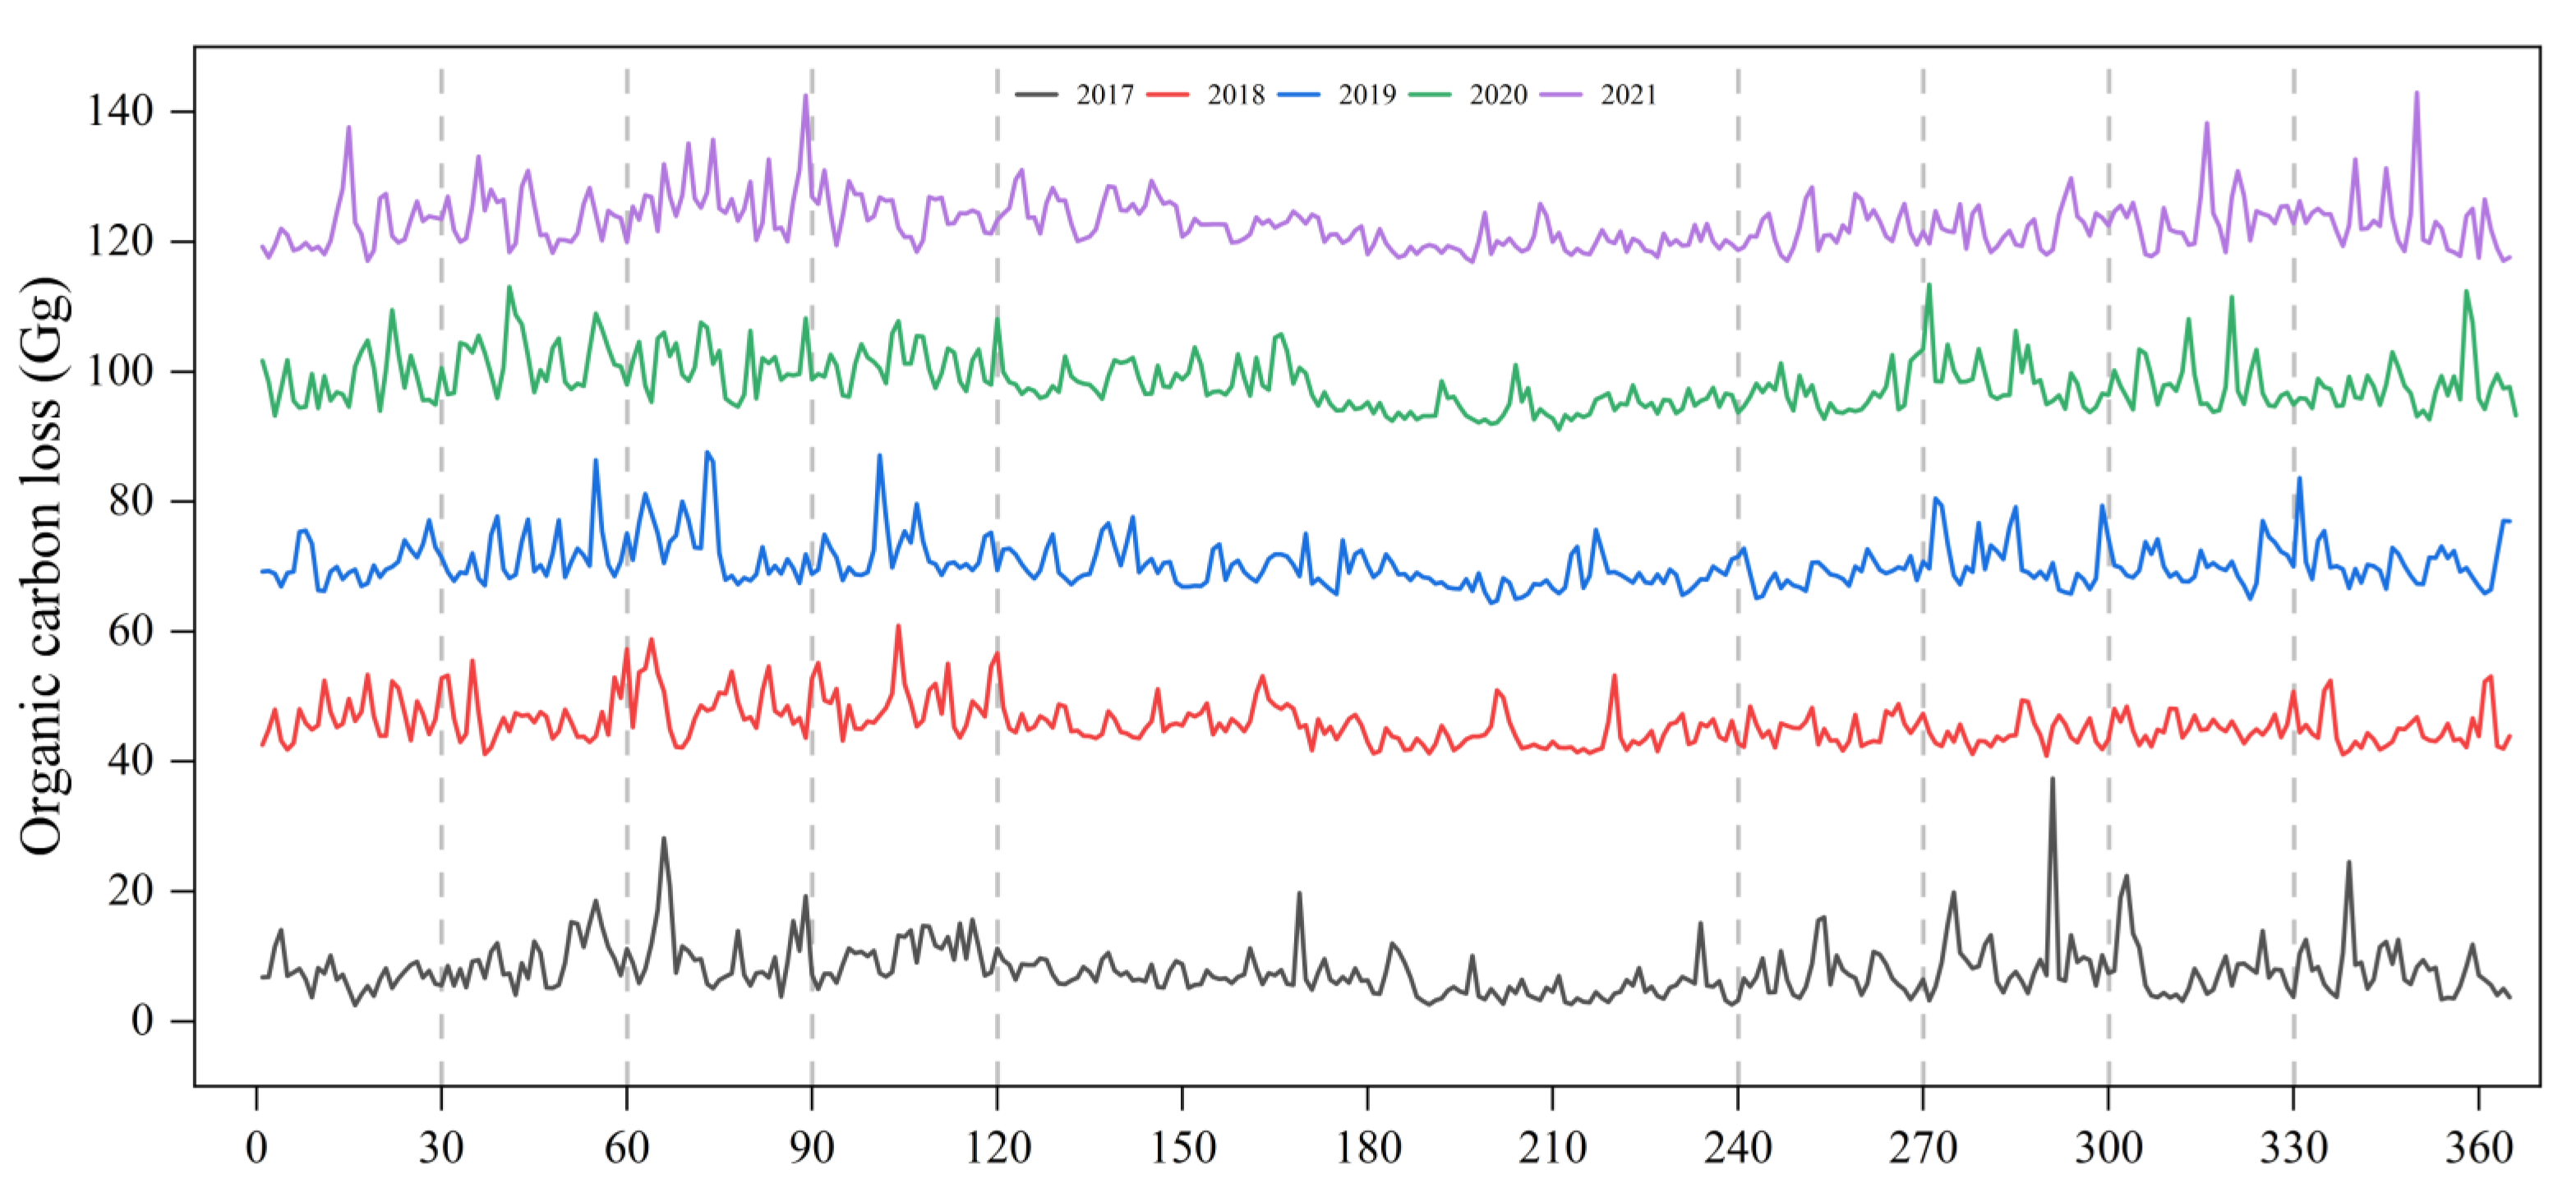
3.2. Characteristics of Global Organic Carbon Loss from Agricultural Land Due to Wind Erosion

The global spatial distribution of organic carbon loss from farmland due to wind erosion is consistent with the global distribution of dust (Figure 4a). The amount of organic carbon loss is influenced by the amount of dust and by the amount of organic carbon in the eroded farmland soils. Figure 4b shows the global distribution of SOC concentration (presented as the percentage weight of the soil). Looking at the loss of organic carbon from all continents, the average annual loss of organic carbon in North America is the highest at 1030 Gg, followed by Europe at 983 Gg, then Asia at 541 Gg, and finally South America, at 371 Gg. The other continents lose less: Africa loses 44 Gg, Oceania loses 0.01 Gg, and Antarctica loses none (Table 1). The central part of Canada, the Central Great Plains of the United States, the Great Plains of Ukraine in southwestern Russia, the Pampas Plain of Argentina, and the northeastern part of China all have high organic carbon content and are all subject to SOC loss through wind erosion. Therefore, the global spatial distribution of organic carbon loss from wind erosion is highest in these areas. There is a narrow band of organic carbon losses from Alberta and Saskatchewan in Canada to Colorado, Kansas, Montana, Nebraska, North Dakota, Oklahoma, South Dakota, Texas, and Wyoming in the United States. Europe forms a belt of organic carbon loss from Manchester, UK, and Seville, Spain, eastward to the plains of Ukraine in southwestern Russia. Asia forms a curved belt of organic carbon loss from Mumbai, India, Mandalay, Myanmar, and Bangkok, Thailand, to northeast China. In South America, a circular loss zone is formed, centered in Buenos Aires, Argentina. These areas are the key areas of organic carbon loss, which we refer to as the three ‘belts’ and the one ‘zone’. A loss zone is also formed in Africa from Mauritania, Mali, Niger, and Chad to Sudan, but the overall loss of organic carbon in this zone is not high. There is also a discontinuous curved loss zone in Oceania from Perth, Western Australia, to Melbourne, Victoria, but the loss of organic carbon from this zone is not high either.
The annual loss of soil organic carbon due to wind erosion each year from 2017 to 2021 was 2877 Gg, 2781 Gg, 2867 Gg, 3175 Gg, and 3149 Gg, respectively (Table 1). The annual average value of farmland organic carbon loss is 2970 Gg and the annual growth rate is 9%. There is an overall rising trend in annual organic carbon loss, with the highest loss in 2020 and only a slight decrease in 2021. Losses from North America and Europe, the two regions with the highest organic carbon losses, both increased in 2020. In terms of monthly organic carbon loss (Figure 5), the maximum peak of organic carbon loss occurs in March and decreases to a minimum in July. The peak and minimum values do not occur at the same time as the dust emissions. Similarly, the loss of organic carbon is divided into three phases, with a rapid increase in organic carbon loss from January to March, a sharp decrease from March to July, and a slow increase from July to December.
In contrast to dust emissions, organic carbon losses are influenced by both dust emissions and the regional weight percentage of organic carbon in farmland soil. This makes variations in organic carbon losses from day to day relatively smooth at a global scale (Figure 6), although regional differences in the weight percentage of organic carbon in farmland soil are not particularly large. Global organic carbon loss, like the dust emissions that influence it, has multiple peaks from January to April, when there are generally one to four days a month with spikes, and from October to December, when there are spikes around two to three days each month. In the crop-growing months in the middle of the year, day-to-day organic carbon loss does not fluctuate much and is less variable than dust emissions.

4. Discussion

4.1. Emission Characteristics and Influencing Factors for Dust Emissions from Agricultural Land

In this study, we estimated global emissions of agricultural dust due to wind erosion using the CMAQ-FENGSHA module. The primary influence of wind erosion is wind speed [10] since wind erosion becomes active when the wind speed reaches the energy required to erode the erodible surface, that is when the wind speed is such that the energy transferred to the surface exceeds the energy required to move particles in the topsoil [40,41]. The intensity of sand erosion is closely related to the weather. In recent years, the frequency of extreme weather events has increased [42], which is reflected in the annual increase in dust emissions. For example, dust emissions during extremely high winds can be 10 to 25 times higher than the annual average [43]. Figure 2 shows that dust emissions increase sharply from February to April and that daily dust events are more frequent during this period. This is late winter and spring in the northern hemisphere, when the average wind speed reaches its maximum, leading to an increase in dust emissions. Agricultural land provides the soil surface that is most affected by human activities [44], and agricultural activities that disturb the soil surface, such as straw burning, tillage, and harvesting, can greatly increase the frequency and intensity of wind erosion [15,45]. The vulnerability of agricultural land to erosion is highly dependent on agricultural management practices, such as planting and grazing schedules and soil conservation practices [14,15,46]. High wind speeds and the management of human activities together drive dust emissions from agricultural land. For example, areas with high emissions of agricultural dust are concentrated in the plains from Ukraine to the Russian border in Europe, southern Canada and the central United States in North America, eastern Argentina in South America, and southern India and northeastern China in Asia. These regions have vast agricultural lands, developed agricultural economies, and high levels of agricultural activity. A large amount of agricultural machine activity (harvesting and planting), combined with windy weather, inevitably leads to high dust emissions [47].
There are many other factors that also influence the amount of dust emitted from agricultural lands, such as the annual crop calendar [48,49]. It is clear from the figures that dust emissions are significantly lower from April to August, mainly because the planting of crops during this period inhibits some dust from entering the atmosphere. As crops grow and a crop canopy forms, this inhibition is strengthened and the amount of dust entering the atmosphere reduces further. The rainy summer means that soil moisture is generally high in summer in farmland areas, making it relatively difficult for wind erosion mechanisms to kick in, Zhao et al. [48]. Emissions of dust from farmland are minimized during this period, and there are fewer extreme dust events and more moderate fluctuations in daily dust emissions.
Global temperatures are rising under the influence of the greenhouse effect, which is indirectly decreasing soil moisture levels [50], which is another reason why dust emissions are increasing year by year.
Snow cover is also related to the slow increase in dust emissions from August to December. The increase mainly occurs in areas of exposed bare ground, but snow cover can also directly affect dust emissions [51]. During this period, dust emissions increase gradually due to windy winter weather, but do not exceed those of late winter and spring, despite the frequency of dusty weather being slightly higher than in summer.

4.2. Loss Characteristics and Influencing Factors for Organic Carbon Loss from Farmland

Emissions of organic carbon from farmland are mainly influenced by the amount of dust that is eroded and the weight percentage of organic carbon in the soil. The driving mechanisms for on-farm dust emissions have been described in 4.1. The trends of monthly and day-by-day organic carbon losses are roughly consistent with the trends for dust emissions, but there are some differences in the peak monthly losses. These differences are mainly related to the SOC content at the location of the erosion [35]. Wind erosion activity occurs in March in areas with higher SOC content, and in August in areas with lower SOC content. Therefore, the concentration of organic carbon in the soil (the weight percentage) directly affects the amount of organic carbon loss [35]. The formation of the three ‘belts’ and one ‘zone’ follows from the fact that these four regions happen to be the four major black soil zones in the world, and black soils have a higher organic carbon content than other soils [52]. The four black soil areas are fertile and create the breadbasket of the world. This is consistent with the higher organic carbon losses in North America, Europe, Asia, and Europe that are seen in the results. The frequency and extent of farmland activity have risen in recent years, driven by a surge in food demand as the population continues to increase [47]. This has further intensified wind erosion activity, resulting in a gradual increase in organic carbon loss. However, the difficulties in transporting basic agricultural materials and the lack of labor due to COVID-19 in 2021 led the global agricultural activity level to generally decrease [53], so organic carbon losses also decreased slightly in 2021. The loss of carbon further intensifies the greenhouse effect by increasing the temperature, resulting in lower soil moisture and so promoting further carbon losses [54]. Changes in SOC are an essential indicator for the loss of nutrients from black soils and for soil response to the greenhouse effect [55,56].
The loss of organic carbon from farmland is influenced by other factors, which directly or indirectly affect the organic carbon content of farmland soil. Firstly, soil properties are important [55]. The three ‘belts’ and a ‘zone’ of black soil are areas of high soil quality, while the emission belt in Africa and the curved emission belt region in Oceania represent poor soil quality, with a lower organic carbon content [44]. The arid climate in the emission belt region of Africa is not conducive to the accumulation of organic matter, and the curved emission belt region of Oceania has serious soil sanding and easily loses organic matter. Secondly, the extensive mechanization of farming and overuse of chemical fertilizers in long-term agricultural activities have led to a significant loss of organic carbon and other nutrients [44,57]. Thirdly, the protection of farmland is important. Reasonable protection of farmland increases the organic content of the soil and increases food yields.

4.3. Impact of Wind-Driven Organic Carbon Loss from Farmland on Conservation Strategies

SOC is an important nutrient in soils and losses will certainly cause reductions in food yields and encourage a food crisis, while also aggravating the greenhouse effect and so affecting the further sequestration of SOC. High losses of organic carbon will lead to a vicious circle between food shortages and the greenhouse effect. The four black soil zones therefore pose a significant challenge, since they are the breadbasket of the world and have high organic carbon emissions. For countries in the three ‘belts’ and one ‘zone’, a soil conservation strategy has become imperative.
The United States currently operates the Environmental Quality Incentives Program (EQIP) and Conservation Stewardship Program (CSP) [58,59]. EQIP provides financial and technical assistance to agricultural producers and non-industrial forest operators to address natural resource issues and to deliver environmental benefits, such as improving water and air quality, protecting groundwater and surface water, increasing soil health, reducing soil erosion and sedimentation, improving or creating wildlife habitats, and mitigating drought and increasing weather fluctuations. CSP aims to reduce the contribution of agricultural operations to dust and greenhouse gas emissions, among other things. Improving the quality of cropland soils is one of the priorities of EQIP and CSP. As a significant emitter of organic carbon in North America, the Canadian government has invested more than $1.6 million in new technologies for efficient fertilizers [60]. Since the release of Canada’s Enhanced Climate Plan, the Canadian government has been working to improve the environmental sustainability of fertilizers and announced a national target to reduce greenhouse gas emissions from fertilizers by 30% by 2030, compared to 2020 levels, in December 2020. Sustainable types of fertilizer will be more conducive to soil quality conservation and will promote increased food production. The development of new technologies for efficient fertilizers has been identified as a way to achieve carbon reduction in fertilizer emissions.
In Europe, the UK has relatively high emissions at the national level and currently operates the Sustainable Farming Incentive Scheme, the first of three new environmental land management schemes introduced under the Agricultural Transformation Program [61]. These programs will invest in the foundations of food production: healthy soils, water, and biodiversity ecosystems to ensure long-term food security.
In Asia, the regions with high organic carbon losses are northeast China and south-central India. Northeast China is one of the four largest black soil areas in the world and has included the protection of black soil in legislation that is dedicated to the protection of black soil, construction of agricultural infrastructure, improvement of black land quality, restoration and improvement of the black land, and prohibition of poaching and indiscriminate excavation [62]. Heilongjiang and Jilin provinces in northeast China have issued several policy initiatives related to black soil conservation and black soil protection master plans in response to national and global soil conservation programs [62,63].

4.4. Uncertainty in Estimating Dust Emission and SOC Loss by Wind Erosion

The optimized CMAQ-FENGSHA module is used to estimate global farmland dust emissions. The algorithm has been well-verified in previous studies. Zhang et al. [17] estimated the results in the simulation study of black soil erosion in Northeast China to be almost consistent with the actual observations. In Cao’s study, the results of farmland dust simulation were compared with the local monitoring data in the United States [31]. In addition, the results were compared with other dust mechanisms (e.g., SH2004, AG2001, MB1995, GP1988, OW1964, etc.). Overall, the method is more accurate in estimating dust emissions from farmland. However, because of the accuracy of the data (e.g., GFS meteorological data, global soil data, etc.), there is still some uncertainty about the estimated results.
The global organic carbon loss from farmland was estimated based on the global dust emissions from farmland combined with the global soil organic matter weight percentage data. However, this study did not consider that the dry and wet deposition process of dust may lead to a high amount of organic carbon loss. In addition to this, the interpolation calculation method and resolution of global soil organic carbon weight percent data may also lead to some uncertainty in the organic carbon loss results.

5. Conclusions

This study estimated the global emissions of dust and organic carbon from agricultural land due to wind erosion from 2017–2021. The results show that the spatial characteristics of dust and organic carbon emissions are largely consistent, but emissions vary considerably. The regions with high emissions of dust and sand from farmland are concentrated in the UK, the border area from Ukraine to Russia, Canada and the USA, Argentina, northeast China, and south-central India, showing a spatial distribution of three “belts” and one “zone”. The spatial distribution of organic carbon loss from farmland is basically consistent with that of dust. The global annual emissions of dust from farmland are 1.65 × 10⁹ g/s, 1.69 × 10⁹ g/s, 1.71 × 10⁹ g/s, 1.83 × 10⁹ g/s, and 1.89 × 10⁹ g/s from 2017–2021, with an annual growth rate of 14%, respectively. In addition, from 2017–2021, the annual global organic carbon loss from farmland was 2877 Gg, 2781 Gg, 2867 Gg, 3175 Gg, and 3149 Gg, respectively, with an annual growth rate of 9%. It can be seen that both dust emissions and organic carbon losses are increasing. These results are important for the study of the global carbon cycle, dust emissions, and black soil conservation.

Author Contributions

Investigation, H.Z. and G.Z.; methodology, X.C.; writing—original draft, Y.L.; writing—review and editing, H.Z., G.Z., X.C., X.Z. and A.X. All authors have read and agreed to the published version of the manuscript.

Funding

This work was financially supported by National Key R&D Plan of China (No. 2022YFC3701203), the Natural Science Found for Outstanding Young Scholars in Jilin Province (No. 20230508106RC), and the National Natural Science Foundation of China (No. 41301082).

Data Availability Statement

The data presented in this study are available upon request from the corresponding author.

Conflicts of Interest

The authors declare no conflict of interest.

References

  1. De Nijs, E.A.; Cammeraat, E.L.H. The stability and fate of soil organic carbon during the transport phase of soil erosion. Earth Sci. Rev. 2020, 201, 103067. [Google Scholar] [CrossRef]
  2. Du, H.; Wang, T.; Xue, X.; Li, S. Estimation of soil organic carbon, nitrogen, and phosphorus losses induced by wind erosion in northern china. Land Degrad. Dev. 2019, 30, 1006–1022. [Google Scholar] [CrossRef]
  3. Chen, W.; Meng, H.; Song, H.; Zheng, H. Progress in dust modelling, global dust budgets, and soil organic carbon dynamics. Land 2022, 11, 176. [Google Scholar] [CrossRef]
  4. Tong, D.Q.; Dan, M.; Wang, T.; Lee, P. Long-term dust climatology in the western united states reconstructed from routine aerosol ground monitoring. Atmos. Chem. Phys. 2012, 12, 5189–5205. [Google Scholar] [CrossRef] [Green Version]
  5. Tegen, I.; Schepanski, K. The global distribution of mineral dust. IOP Conf. Ser. Earth Environ. Sci. 2009, 7, 012001. [Google Scholar] [CrossRef]
  6. Tegen, I.; Werner, M.; Harrison, S.P.; Kohfeld, K.E. Relative importance of climate and land use in determining present and future global soil dust emission. Geophys. Res. Lett. 2004, 31, L05105. [Google Scholar] [CrossRef] [Green Version]
  7. Wang, X.; Zhao, W.; Liu, S.; An, Y.; Pereira, P. Ecosystems impact on aeolian dust emissions in inner mongolia from 2001 to 2018. Geoderma 2022, 422, 115938. [Google Scholar] [CrossRef]
  8. Kok, J.F.; Ward, D.S.; Mahowald, N.M.; Evan, A.T. Global and regional importance of the direct dust-climate feedback. Nat. Commun. 2018, 9, 241. [Google Scholar] [CrossRef] [Green Version]
  9. Yang, Y.; Russell, L.M.; Lou, S.; Liao, H.; Guo, J.; Liu, Y.; Singh, B.; Ghan, S.J. Dust-wind interactions can intensify aerosol pollution over eastern china. Nat. Commun. 2017, 8, 15333. [Google Scholar] [CrossRef]
  10. Attiya, A.A.; Jones, B.G. An extensive dust storm impact on air quality on 22 november 2018 in sydney, australia, using satellite remote sensing and ground data. Environ. Monit. Assess. 2022, 194, 432. [Google Scholar] [CrossRef]
  11. Yan, H.; Wang, S.; Wang, C.; Zhang, G.; Patel, N. Losses of soil organic carbon under wind erosion in china. Glob. Chang. Biol. 2005, 11, 828–840. [Google Scholar] [CrossRef]
  12. Angelopoulou, T.; Chabrillat, S.; Pignatti, S.; Milewski, R.; Karyotis, K.; Brell, M.; Ruhtz, T.; Bochtis, D.; Zalidis, G. Evaluation of airborne hyspex and spaceborne PRISMA hyperspectral remote sensing data for soil organic matter and carbonates estimation. Remote Sens. 2023, 15, 1106. [Google Scholar] [CrossRef]
  13. Ozlu, E.; Arriaga, F.J.; Bilen, S.; Gozukara, G.; Babur, E. Carbon footprint management by agricultural practices. Biology 2022, 11, 1453. [Google Scholar] [CrossRef]
  14. Chappell, A.; Baldock, J.A. Wind erosion reduces soil organic carbon sequestration falsely indicating ineffective management practices. Aeolian Res. 2016, 22, 107–116. [Google Scholar] [CrossRef]
  15. Ma, S.; Zhang, X.; Gao, C.; Tong, D.Q.; Xiu, A.; Wu, G.; Cao, X.; Huang, L.; Zhao, H.; Zhang, S.; et al. Multimodel simulations of a springtime dust storm over northeastern china: Implications of an evaluation of four commonly used air quality models (CMAQ v5.2.1, CAMx v6.50, CHIMERE v2017r4, and WRF-Chem v3.9.1). Geosci. Model Dev. 2019, 12, 4603–4625. [Google Scholar] [CrossRef] [Green Version]
  16. Shao, Y. A model for mineral dust emission. J. Geophys. Res. Atmos. 2001, 106, 20239–20254. [Google Scholar] [CrossRef]
  17. Zhang, X.; Zhou, Q.; Chen, W.; Wang, Y.; Tong, D.Q. Observation and modeling of black soil wind-blown erosion from cropland in northeastern china. Aeolian Res. 2015, 19, 153–162. [Google Scholar] [CrossRef]
  18. Vogel, C.; Heister, K.; Buegger, F.; Tanuwidjaja, I.; Haug, S.; Schloter, M.; Kögel-Knabner, I. Clay mineral composition modifies decomposition and sequestration of organic carbon and nitrogen in fine soil fractions. Biol. Fertil. Soils 2015, 51, 427–442. [Google Scholar] [CrossRef]
  19. Diego, I.; Pelegry, A.; Torno, S.; Toraño, J.; Menendez, M. Simultaneous CFD evaluation of wind flow and dust emission in open storage piles. Appl. Mathmat. Model. 2009, 33, 3197–3207. [Google Scholar] [CrossRef]
  20. Lal, R. Erosion-crop productivity relationships for soils of africa. Soil Sci. Soc. Am. J. 1995, 59, 661–667. [Google Scholar] [CrossRef]
  21. Chappell, A.; Webb, N.P.; Butler, H.J.; Strong, C.L.; McTainsh, G.H.; Leys, J.F.; Viscarra Rossel, R.A. Soil organic carbon dust emission: An omitted global source of atmospheric CO2. Glob. Chang. Biol. 2013, 19, 3238–3244. [Google Scholar] [CrossRef] [PubMed]
  22. Owen, P.R. Saltation of uniform grains in air. J. Fluid Mech. 1964, 20, 225–242. [Google Scholar] [CrossRef]
  23. Woodruff, N.P.; Siddoway, F.H. A wind erosion equation. Soil Sci. Soc. Am. J. 1965, 29, 602–608. [Google Scholar] [CrossRef]
  24. Gomes, L.; Rajot, J.L.; Alfaro, S.C.; Gaudichet, A. Validation of a dust production model from measurements performed in semi-arid agricultural areas of spain and niger. Catena 2003, 52, 257–271. [Google Scholar] [CrossRef]
  25. Shao, Y.P. Simplification of a dust emission scheme and comparison with data. J. Geophys. Res. 2004, 109, D10202. [Google Scholar] [CrossRef] [Green Version]
  26. Sitch, S.; Smith, B.; Prentice, I.C.; Arneth, A.; Bondeau, A.; Cramer, W.; Kaplan, J.O.; Levis, S.; Lucht, W.; Sykes, M.T.; et al. Evaluation of ecosystem dynamics, plant geography and terrestrial carbon cycling in the lpj dynamic global vegetation model. Glob. Chang. Biol. 2003, 9, 161–185. [Google Scholar] [CrossRef]
  27. Shannon, S.; Lunt, D.J. A new dust cycle model with dynamic vegetation: Lpj-dust version 1.0. Geosci. Model Dev. 2011, 4, 85–105. [Google Scholar] [CrossRef] [Green Version]
  28. Lal, R. Soil carbon sequestration impacts on global climate change and food security. Science 2004, 304, 1623–1627. [Google Scholar] [CrossRef] [Green Version]
  29. Broeg, T.; Blaschek, M.; Seitz, S.; Taghizadeh-Mehrjardi, R.; Zepp, S.; Scholten, T. Transferability of covariates to predict soil organic carbon in cropland soils. Remote Sens. 2023, 15, 876. [Google Scholar] [CrossRef]
  30. Zobeck, T.M.; Sterk, G.; Funk, R.; Rajot, J.L.; Stout, J.E.; Van Pelt, R.S. Measurement and data analysis methods for field-scale wind erosion studies and model validation. Earth Surf. Process. Land. 2003, 28, 1163–1188. [Google Scholar] [CrossRef]
  31. Cao, X. Global Emissions of Particulate Matter (PM10 and PM2.5) from Cropland Wind Erosion. Ph.D. Thesis, Unverisity of Chinese Academy of Sciences, Changchun, China, 2019. (In Chinese). [Google Scholar]
  32. Marticorena, B.; Bergametti, G. Modeling the atmospheric dust cycle: 1. Design of a soil-derived dust emission scheme. J. Geophys. Res. 1995, 100, 16415–16430. [Google Scholar] [CrossRef] [Green Version]
  33. Astitha, M.; Lelieveld, J.; Kader, M.A.; Pozzer, A.; de Meij, A. Parameterization of dust emissions in the global atmospheric chemistry-climate model emac: Impact of nudging and soil properties. Atmos. Chem. Phys. 2012, 12, 11057–11083. [Google Scholar] [CrossRef] [Green Version]
  34. Fecan, F.; Marticorena, B.; Bergametti, G. Parametrization of the increase of the aeolian erosion threshold wind friction velocity due to soil moisture for arid and semi-arid areas. Ann. Geophys.-Atmos. Hydrosph. Space Sci. 1999, 17, 149–157. [Google Scholar] [CrossRef]
  35. Shangguan, W.; Dai, Y.J.; Duan, Q.Y.; Liu, B.Y.; Yuan, H. A global soil data set for earth system modeling. J. Adv. Model. Earth Syst. 2014, 6, 249–263. [Google Scholar] [CrossRef]
  36. Hall, D.K.; Riggs, G.A. Modis/Terra Snow Cover Daily L3 Global 0.05Deg CMG, Version 61. 2021. Available online: http://dx.doi.org/10.5067/MODIS/MOD10C1.061 (accessed on 3 December 2022).
  37. Hansen, M.C.; Reed, B. A comparison of the igbp discover and university of maryland 1 km global land cover products. Int. J. Remote Sens. 2000, 21, 1365–1373. [Google Scholar] [CrossRef]
  38. Klingmuller, K.; Metzger, S.; Abdelkader, M.; Karydis, V.A.; Stenchikov, G.L.; Pozzer, A.; Lelieveld, J. Revised mineral dust emissions in the atmospheric chemistry-climate model emac (messy 2.52 du_astitha1 kkdu2017 patch). Geosci. Model Dev. 2018, 11, 989–1008. [Google Scholar] [CrossRef] [Green Version]
  39. Sacks, W.J.; Deryng, D.; Foley, J.A.; Ramankutty, N. Crop planting dates: An analysis of global patterns. Glob. Ecol. Biogeogr. 2010, 19, 607–620. [Google Scholar] [CrossRef]
  40. Martinez-Grana, A.M.; Goy, J.; Gutierrez, I.D.; Cardena, C.Z. Characterization of environmental impact on resources, using strategic assessment of environmental impact and management of natural spaces of “las batuecas-sierra de francia” and “quilamas” (Salamanca, Spain). Environ. Earth Sci. 2014, 71, 39–51. [Google Scholar] [CrossRef]
  41. Martinez-Grana, A.M.; Goy, J.L.; Zazo, C. Cartographic procedure for the analysis of aeolian erosion hazard in natural parks (central system, Spain). Land Degrad. Dev. 2015, 26, 110–117. [Google Scholar] [CrossRef]
  42. Otto, C.; Piontek, F.; Kalkuhl, M.; Frieler, K. Event-based models to understand the scale of the impact of extremes. Nat. Energy 2020, 5, 111–114. [Google Scholar] [CrossRef]
  43. Zhang, X.X.; Sharratt, B.; Chen, X.; Wang, Z.F.; Liu, L.Y.; Guo, Y.H.; Li, J.; Chen, H.S.; Yang, W.Y. Dust deposition and ambient pm10 concentration in northwest china: Spatial and temporal variability. Atmos. Chem. Phys. 2017, 17, 1699–1711. [Google Scholar] [CrossRef] [Green Version]
  44. Mugizi, F.M.P.; Matsumoto, T. Population pressure and soil quality in Sub-Saharan Africa: Panel evidence from Kenya. Land Use Policy 2020, 94, 104499. [Google Scholar] [CrossRef]
  45. Guan, X.; Huang, J.; Zhang, Y.; Xie, Y.; Liu, J. The relationship between anthropogenic dust and population over global semi-arid regions. Atmos. Chem. Phys. 2016, 16, 5159–5169. [Google Scholar] [CrossRef] [Green Version]
  46. Munkhtsetseg, E.; Shinoda, M.; Ishizuka, M.; Mikami, M.; Kimura, R.; Nikolich, G. Anthropogenic dust emissions due to livestock trampling in a mongolian temperate grassland. Atmos. Chem. Phys. 2017, 17, 11389–11401. [Google Scholar] [CrossRef] [Green Version]
  47. Labiadh, M.; Bergametti, G.; Kardous, M.; Perrier, S.; Grand, N.; Attoui, B.; Sekrafi, S.; Marticorena, B. Soil erosion by wind over tilled surfaces in South Tunisia. Geoderma 2013, 202–203, 8–17. [Google Scholar] [CrossRef]
  48. Zhao, Y.; Xin, Z.; Ding, G. Spatiotemporal variation in the occurrence of sand-dust events and its influencing factors in the Beijing-Tianjin sand source region, China, 1982–2013. Reg. Environ. Chang. 2018, 18, 2433–2444. [Google Scholar] [CrossRef]
  49. Pi, H.; Webb, N.P.; Huggins, D.R.; Sharratt, B. Critical standing crop residue amounts for wind erosion control in the inland pacific northwest, USA. Catena 2020, 195, 104742. [Google Scholar] [CrossRef]
  50. Yang, J.; Jia, X.; Ma, H.; Chen, X.; Liu, J.; Shangguan, Z.; Yan, W. Effects of warming and precipitation changes on soil ghg fluxes: A meta-analysis. Sci. Total Environ. 2022, 827, 154351. [Google Scholar] [CrossRef]
  51. Zhang, F.; Wang, J.A.; Zou, X.; Mao, R.; Gong, D.; Feng, X. Wind erosion climate change in northern China during 1981–2016. Int. J. Disaster Risk Sci. 2020, 11, 484–496. [Google Scholar] [CrossRef]
  52. Meng, G.; Zhang, Y.; Gu, W.; Zhang, Y.; Yu, N.; Zou, H. The characteristics of labile organic carbon in paddy soils in Hei Longjiang province. Ecol. Environ. Sci. 2015, 24, 785–790. [Google Scholar] [CrossRef]
  53. Stephens, E.; Timsina, J.; Martin, G.; van Wijk, M.; Klerkx, L.; Reidsma, P.; Snow, V. The immediate impact of the first waves of the global COVID-19 pandemic on agricultural systems worldwide: Reflections on the COVID-19 special issue for agricultural systems. Agric. Syst. 2022, 201, 103436. [Google Scholar] [CrossRef] [PubMed]
  54. Li, H.; Wu, Y.; Liu, S.; Zhao, W.; Xiao, J.; Winowiecki, L.A.; Vagen, T.G.; Xu, J.; Yin, X.; Wang, F.; et al. The grain-for-green project offsets warming-induced soil organic carbon loss and increases soil carbon stock in chinese loess plateau. Sci. Total Environ. 2022, 837, 155469. [Google Scholar] [CrossRef] [PubMed]
  55. Wiesmeier, M.; Urbanski, L.; Hobley, E.; Lang, B.; von Lützow, M.; Marin-Spiotta, E.; van Wesemael, B.; Rabot, E.; Ließ, M.; Garcia-Franco, N.; et al. Soil organic carbon storage as a key function of soils—A review of drivers and indicators at various scales. Geoderma 2019, 333, 149–162. [Google Scholar] [CrossRef]
  56. Xu, X.; Du, C.; Ma, F.; Qiu, Z.; Zhou, J. A framework for high-resolution mapping of soil organic matter (SOM) by the integration of fourier mid-infrared attenuation total reflectance spectroscopy (FTIR-ATR), sentinel-2 images, and DEM derivatives. Remote Sens. 2023, 15, 1072. [Google Scholar] [CrossRef]
  57. Ozlu, E.; Gozukara, G.; Acar, M.; Bilen, S.; Babur, E. Field-scale evaluation of the soil quality index as influenced by dairy manure and inorganic fertilizers. Sustainability 2022, 14, 7593. [Google Scholar] [CrossRef]
  58. United States Department of Agriculture. Environmental Quality Incentives Program. Available online: https://www.Nrcs.Usda.Gov/wps/portal/nrcs/main/national/programs/financial/eqip/ (accessed on 5 January 2023).
  59. United States Department of Agriculture. Conservation Stewardship Program. Available online: https://www.Nrcs.Usda.Gov/wps/portal/nrcs/main/national/programs/financial/csp/ (accessed on 5 January 2023).
  60. Agriculture and Agri-Food Canada. Government of Canada Invests over $1.6 Million in New Technology for High-Efficiency Fertilizers. Available online: https://www.Canada.Ca/en/agriculture-agri-food/news/2022/07/government-of-canada-invests-over-16-million-in-new-technology-for-high-efficiency-fertilizers.Html (accessed on 6 December 2022).
  61. GOV.UK. Sustainable Farming Incentive Opens for Applications. Available online: https://www.Gov.Uk/government/news/sustainable-farming-incentive-opens-for-applications (accessed on 12 January 2023).
  62. Ge, Q.; Wang, J.; Zhu, H. Overall promotion of black soil protection and rural revitalization: Internal logic, main routes and policy suggestions. Bull. Chin. Acad. Sci. 2021, 36, 1175–1183. [Google Scholar]
  63. Guo, H.; Zhao, W.; Pan, C.; Qiu, G.; Xu, S.; Liu, S. Study on the influencing factors of farmers’ adoption of conservation tillage technology in black soil region in china: A logistic-ism model approach. Int. J. Environ. Res. Public Health 2022, 19, 7762. [Google Scholar] [CrossRef]
Figure 1. Spatial distribution of global dust emissions from agricultural lands in 2017–2021.
Agriculture 13 00781 g001
Figure 2. Global monthly dust emissions from agricultural land, 2017–2021.
Agriculture 13 00781 g002
Figure 3. Global daily dust emissions from agricultural land, 2017–2021. Note: 1–365 or 366 for January 1st to December 31st of each year.
Agriculture 13 00781 g003
Figure 4. The spatial distribution of organic carbon loss from farmland and soil SOC concentration. (a) Global average loss of farmland organic carbon, 2017–2021; (b) percentage weight of organic carbon in the soil. These data are the percentage of organic carbon by weight in the soil surface layer (0–4.5 cm) multiplied by a correlation coefficient to obtain the final percentage value.
Agriculture 13 00781 g004
Figure 5. Global monthly organic carbon losses from farmland, 2017–2021.
Agriculture 13 00781 g005
Figure 6. Global daily loss of organic carbon from farmland, 2017–2021. Note: 1-365 or 366 for January 1st to December 31st of each year.
Agriculture 13 00781 g006
Table 1. Annual loss of farmland organic carbon through wind erosion on different continents, 2017–2021.
Region20172018201920202021Average
Unit: Gg
Asia469553536529618541
Europe92089493011421030983
Africa334546474744
Oceania0.010.010.010.010.010.01
North America1051928991107111111030
South America404361364387342371
Antarctica000000
Global287727812867317531492970
Disclaimer/Publisher’s Note: The statements, opinions and data contained in all publications are solely those of the individual author(s) and contributor(s) and not of MDPI and/or the editor(s). MDPI and/or the editor(s) disclaim responsibility for any injury to people or property resulting from any ideas, methods, instructions or products referred to in the content.

