

Assessment of NDVI Dynamics of Maize (Zea mays L.) and Its Relation to Grain Yield in a Polyfactorial Experiment Based on Remote Sensing
 , ,
, ,  , ,
, ,
Abstract
:1. Introduction
2. Materials and Methods
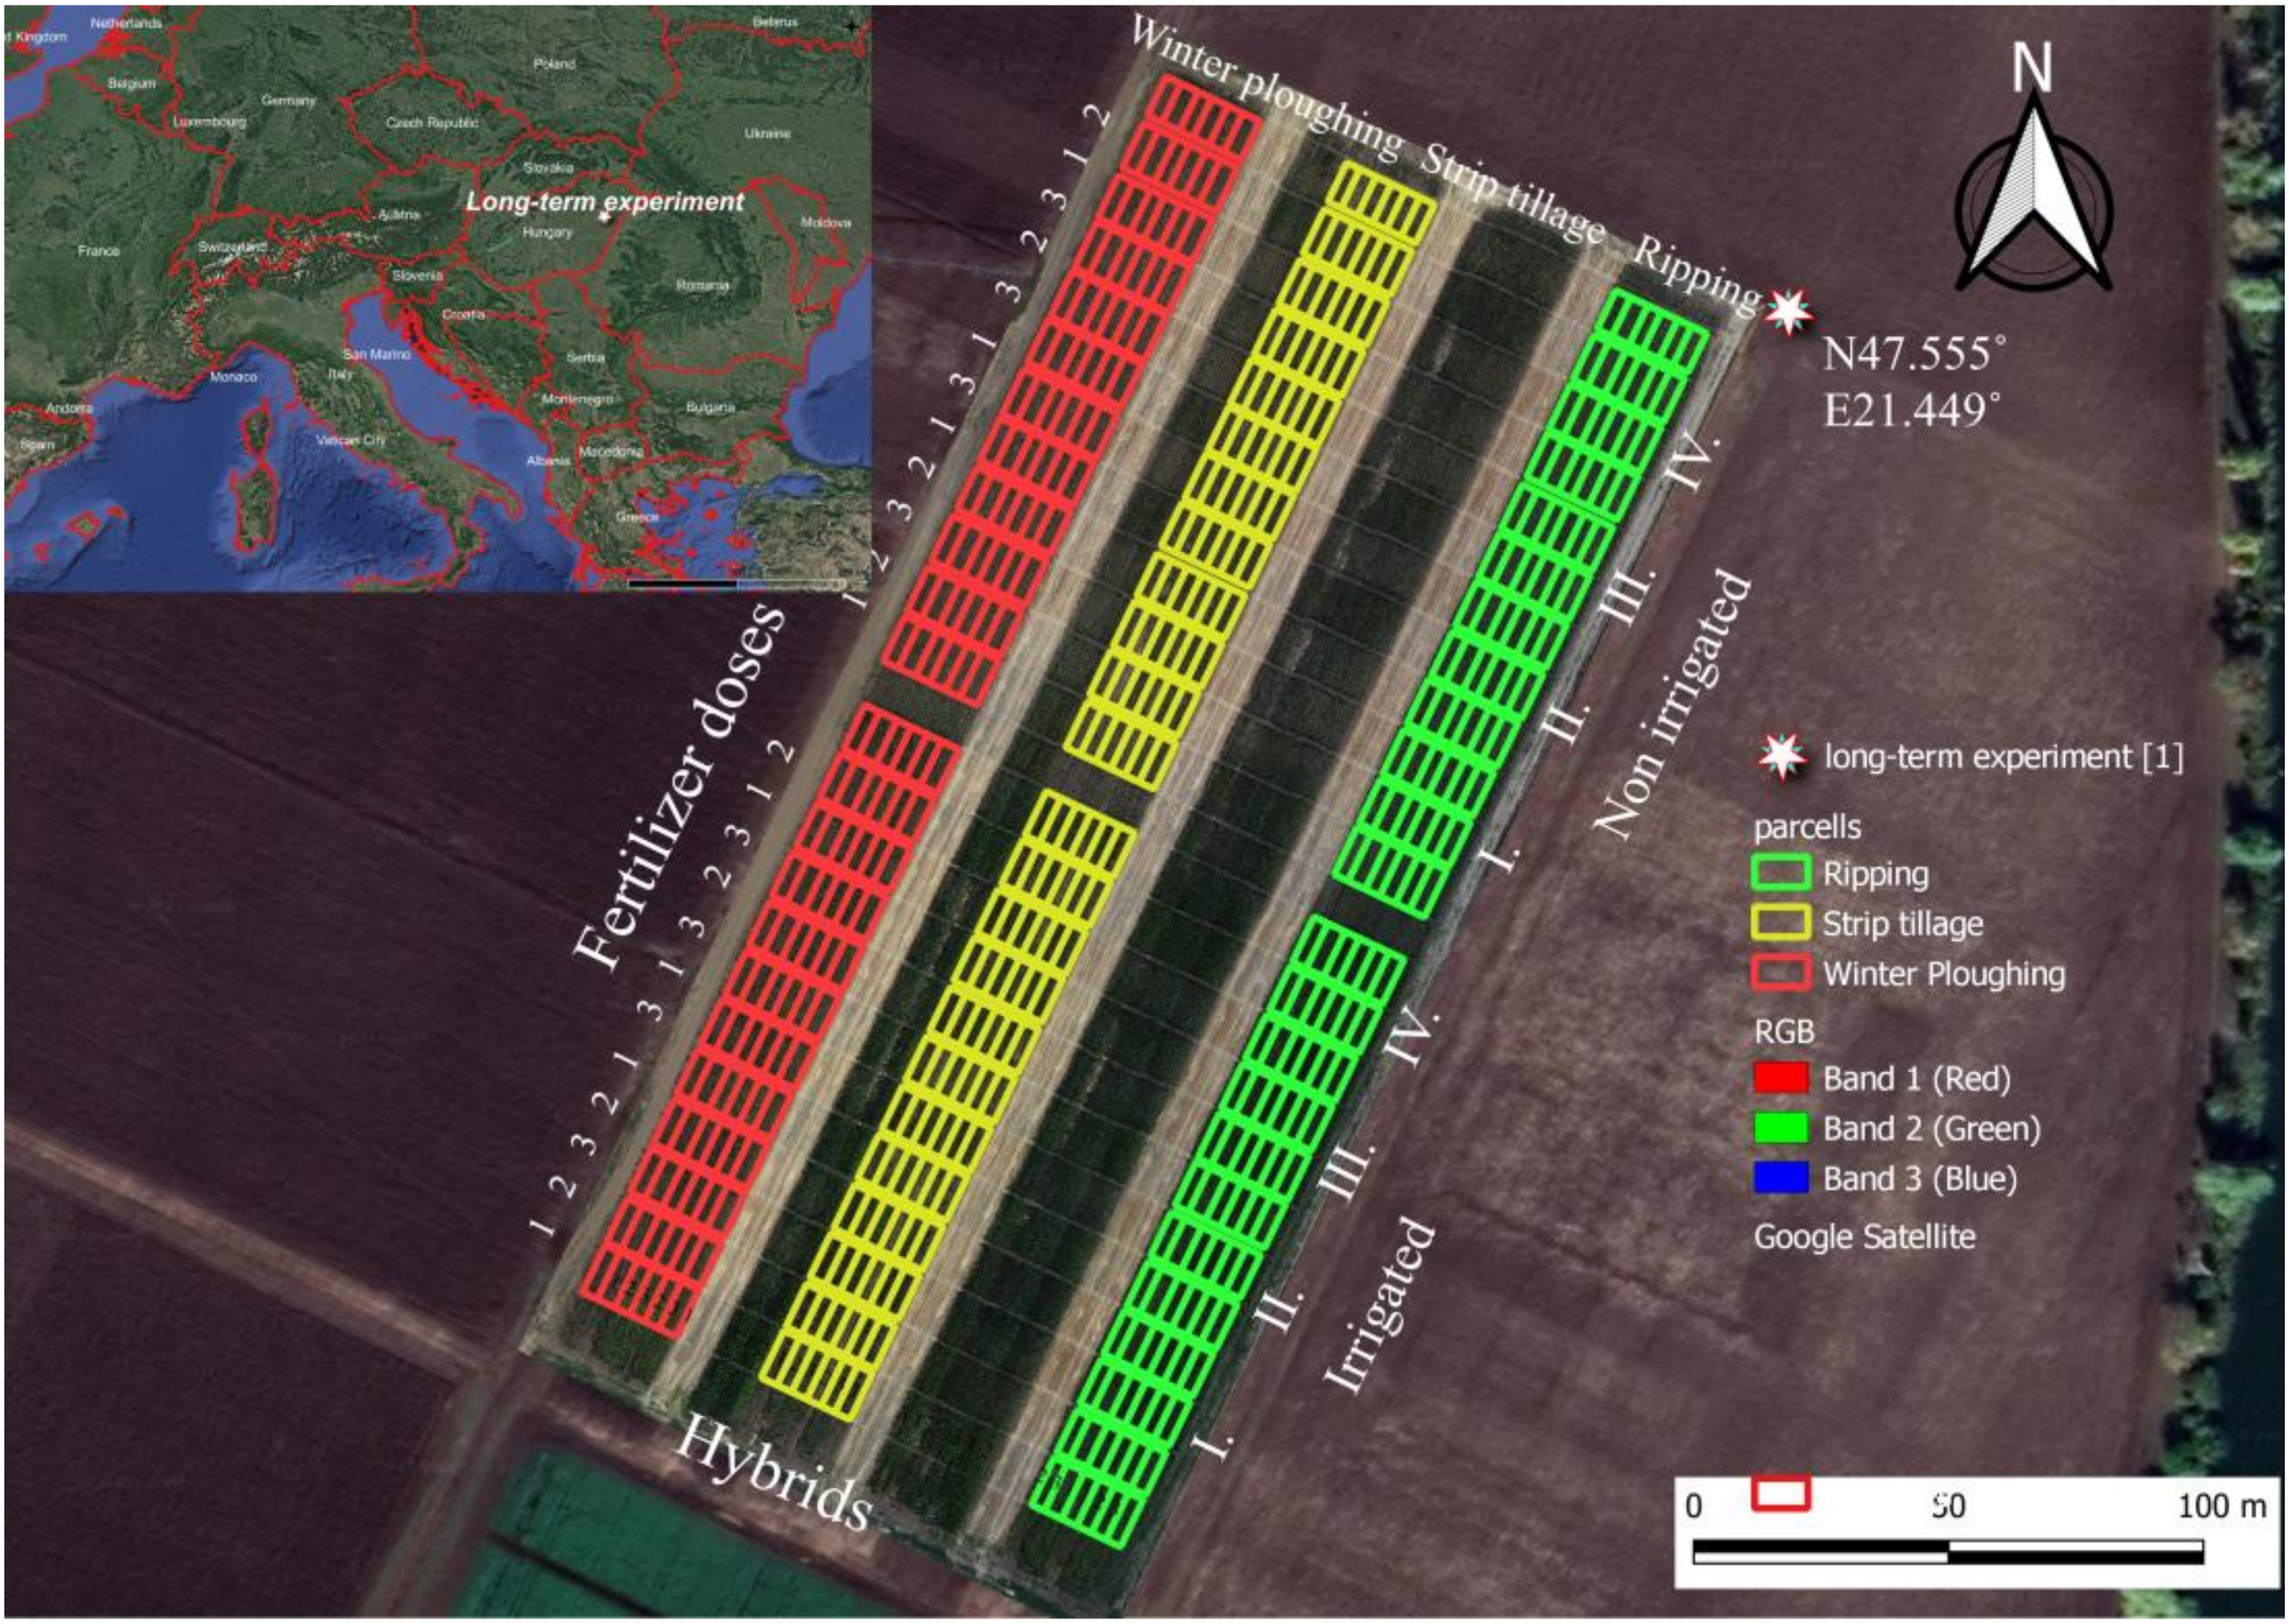
2.1. Experimental Location and Setup
2.2. Soil Characteristics of the Experiment
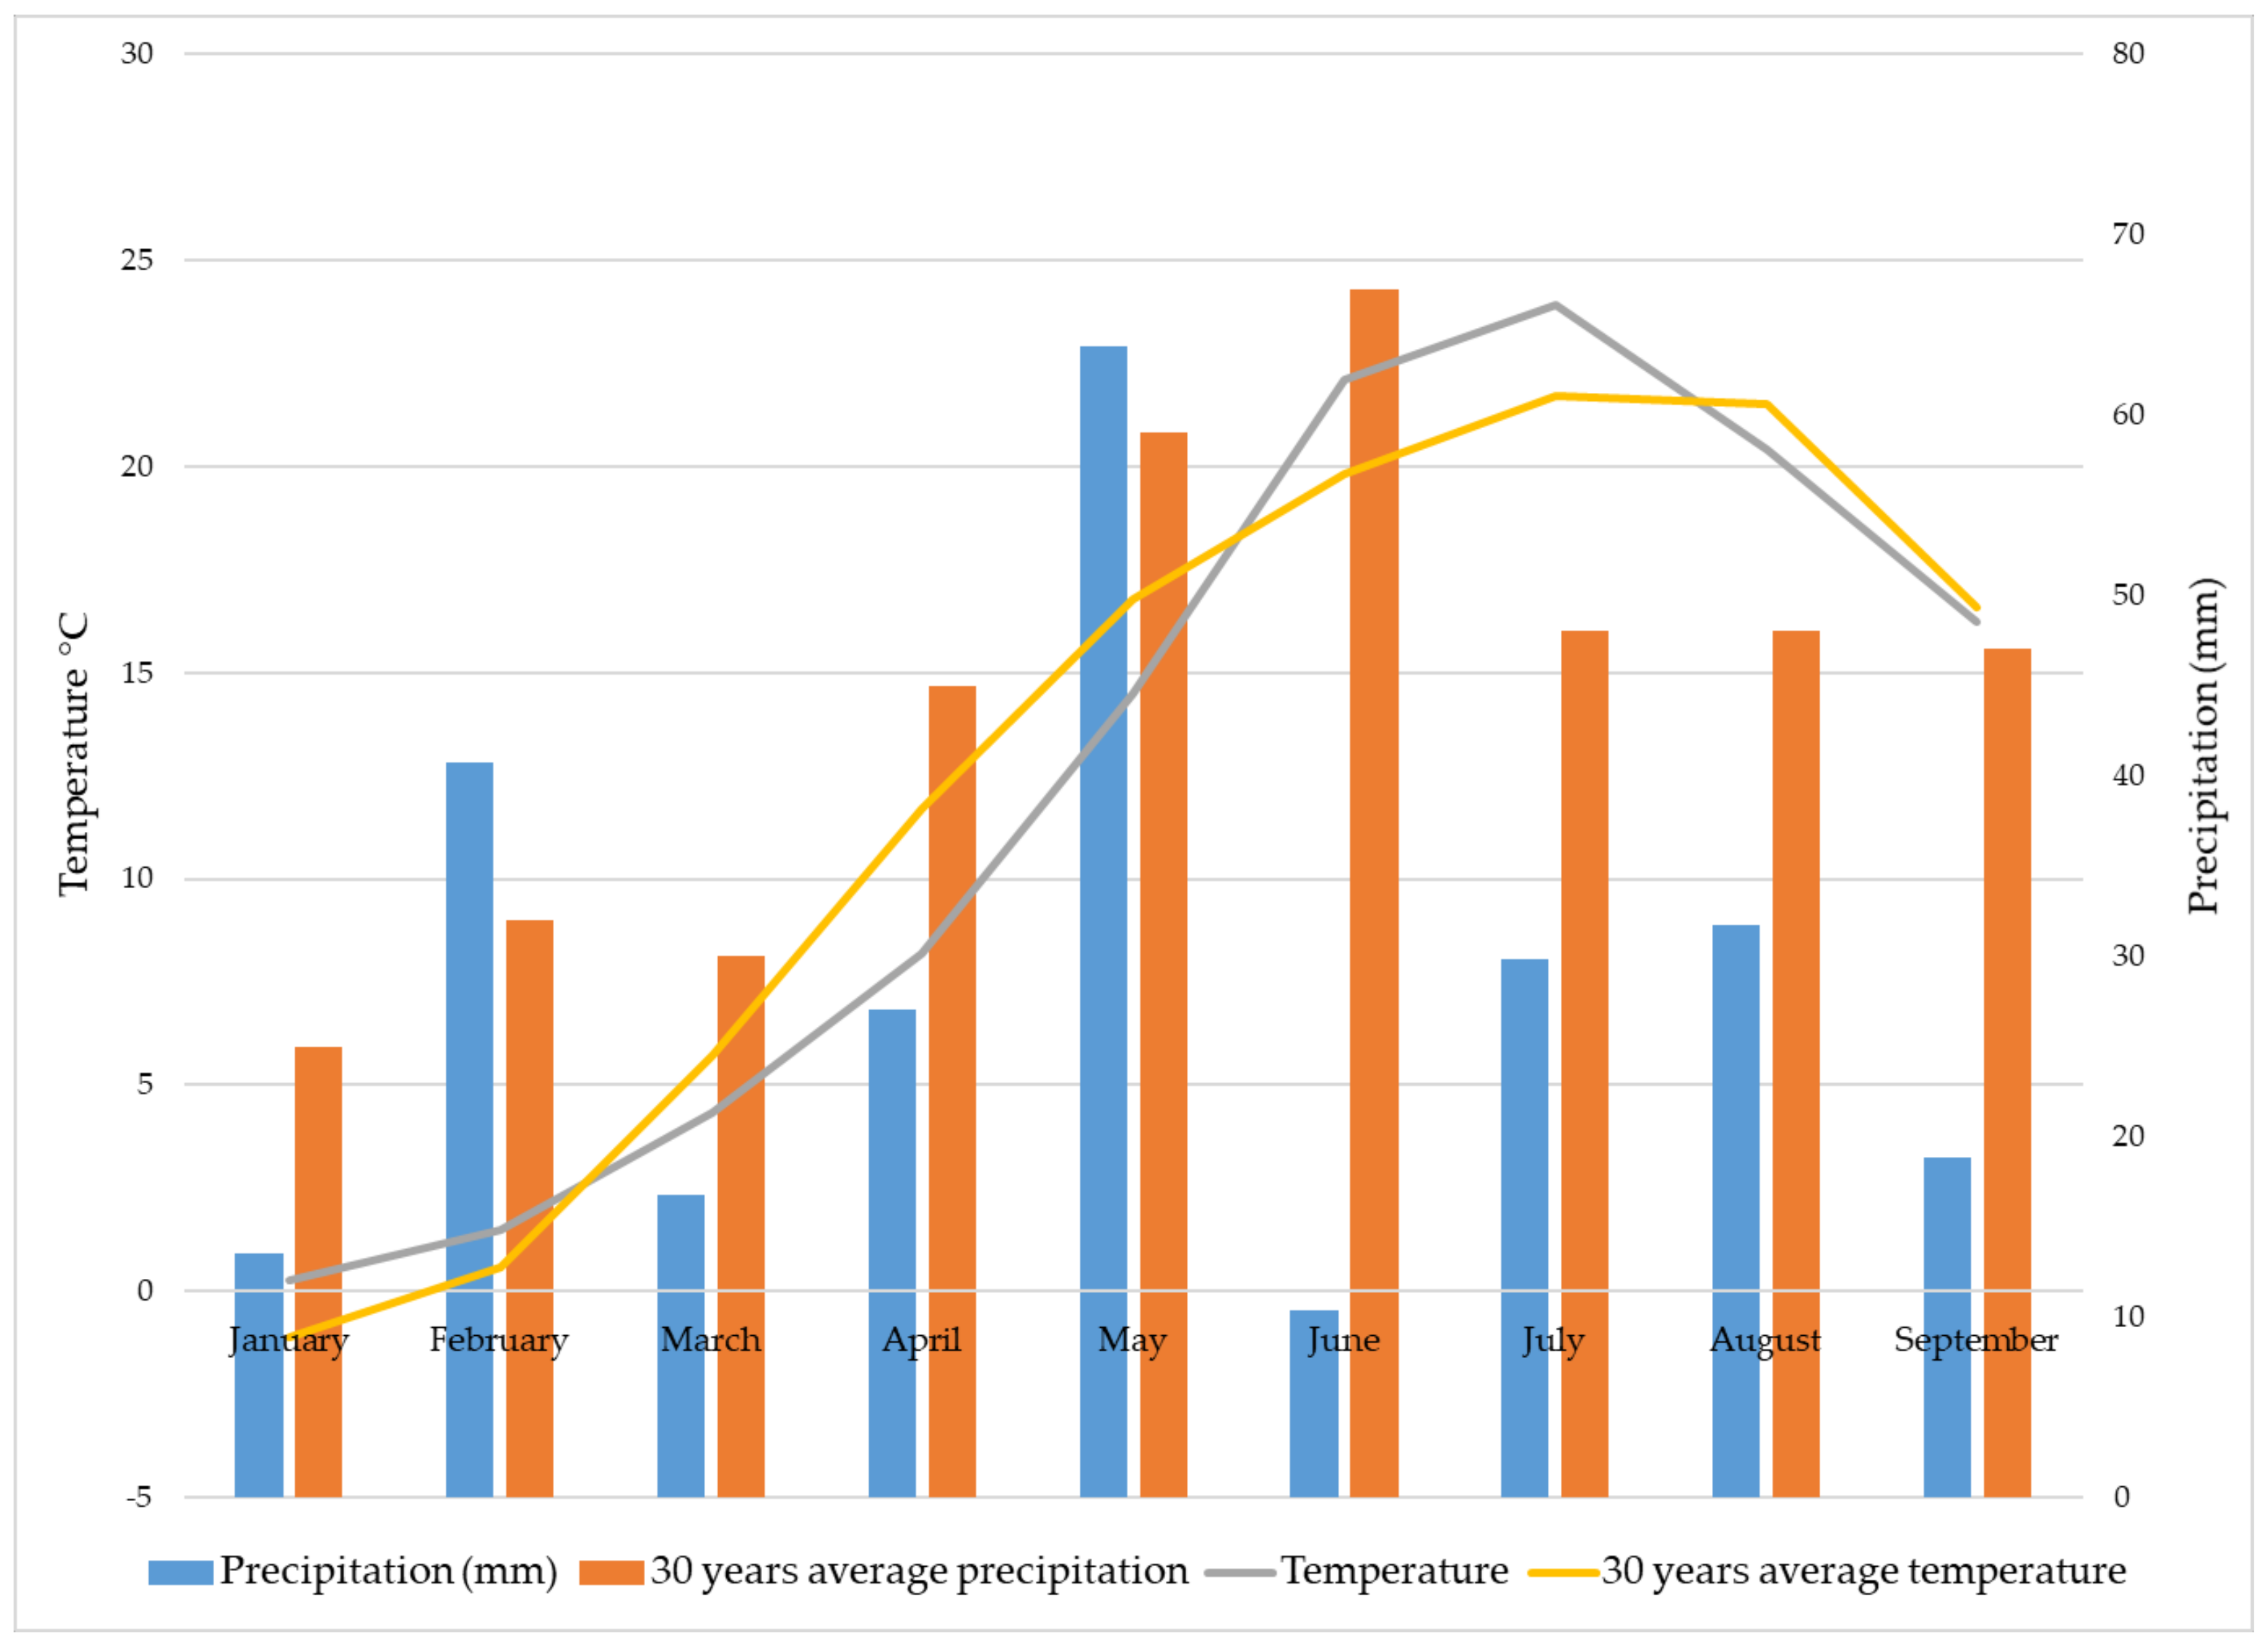
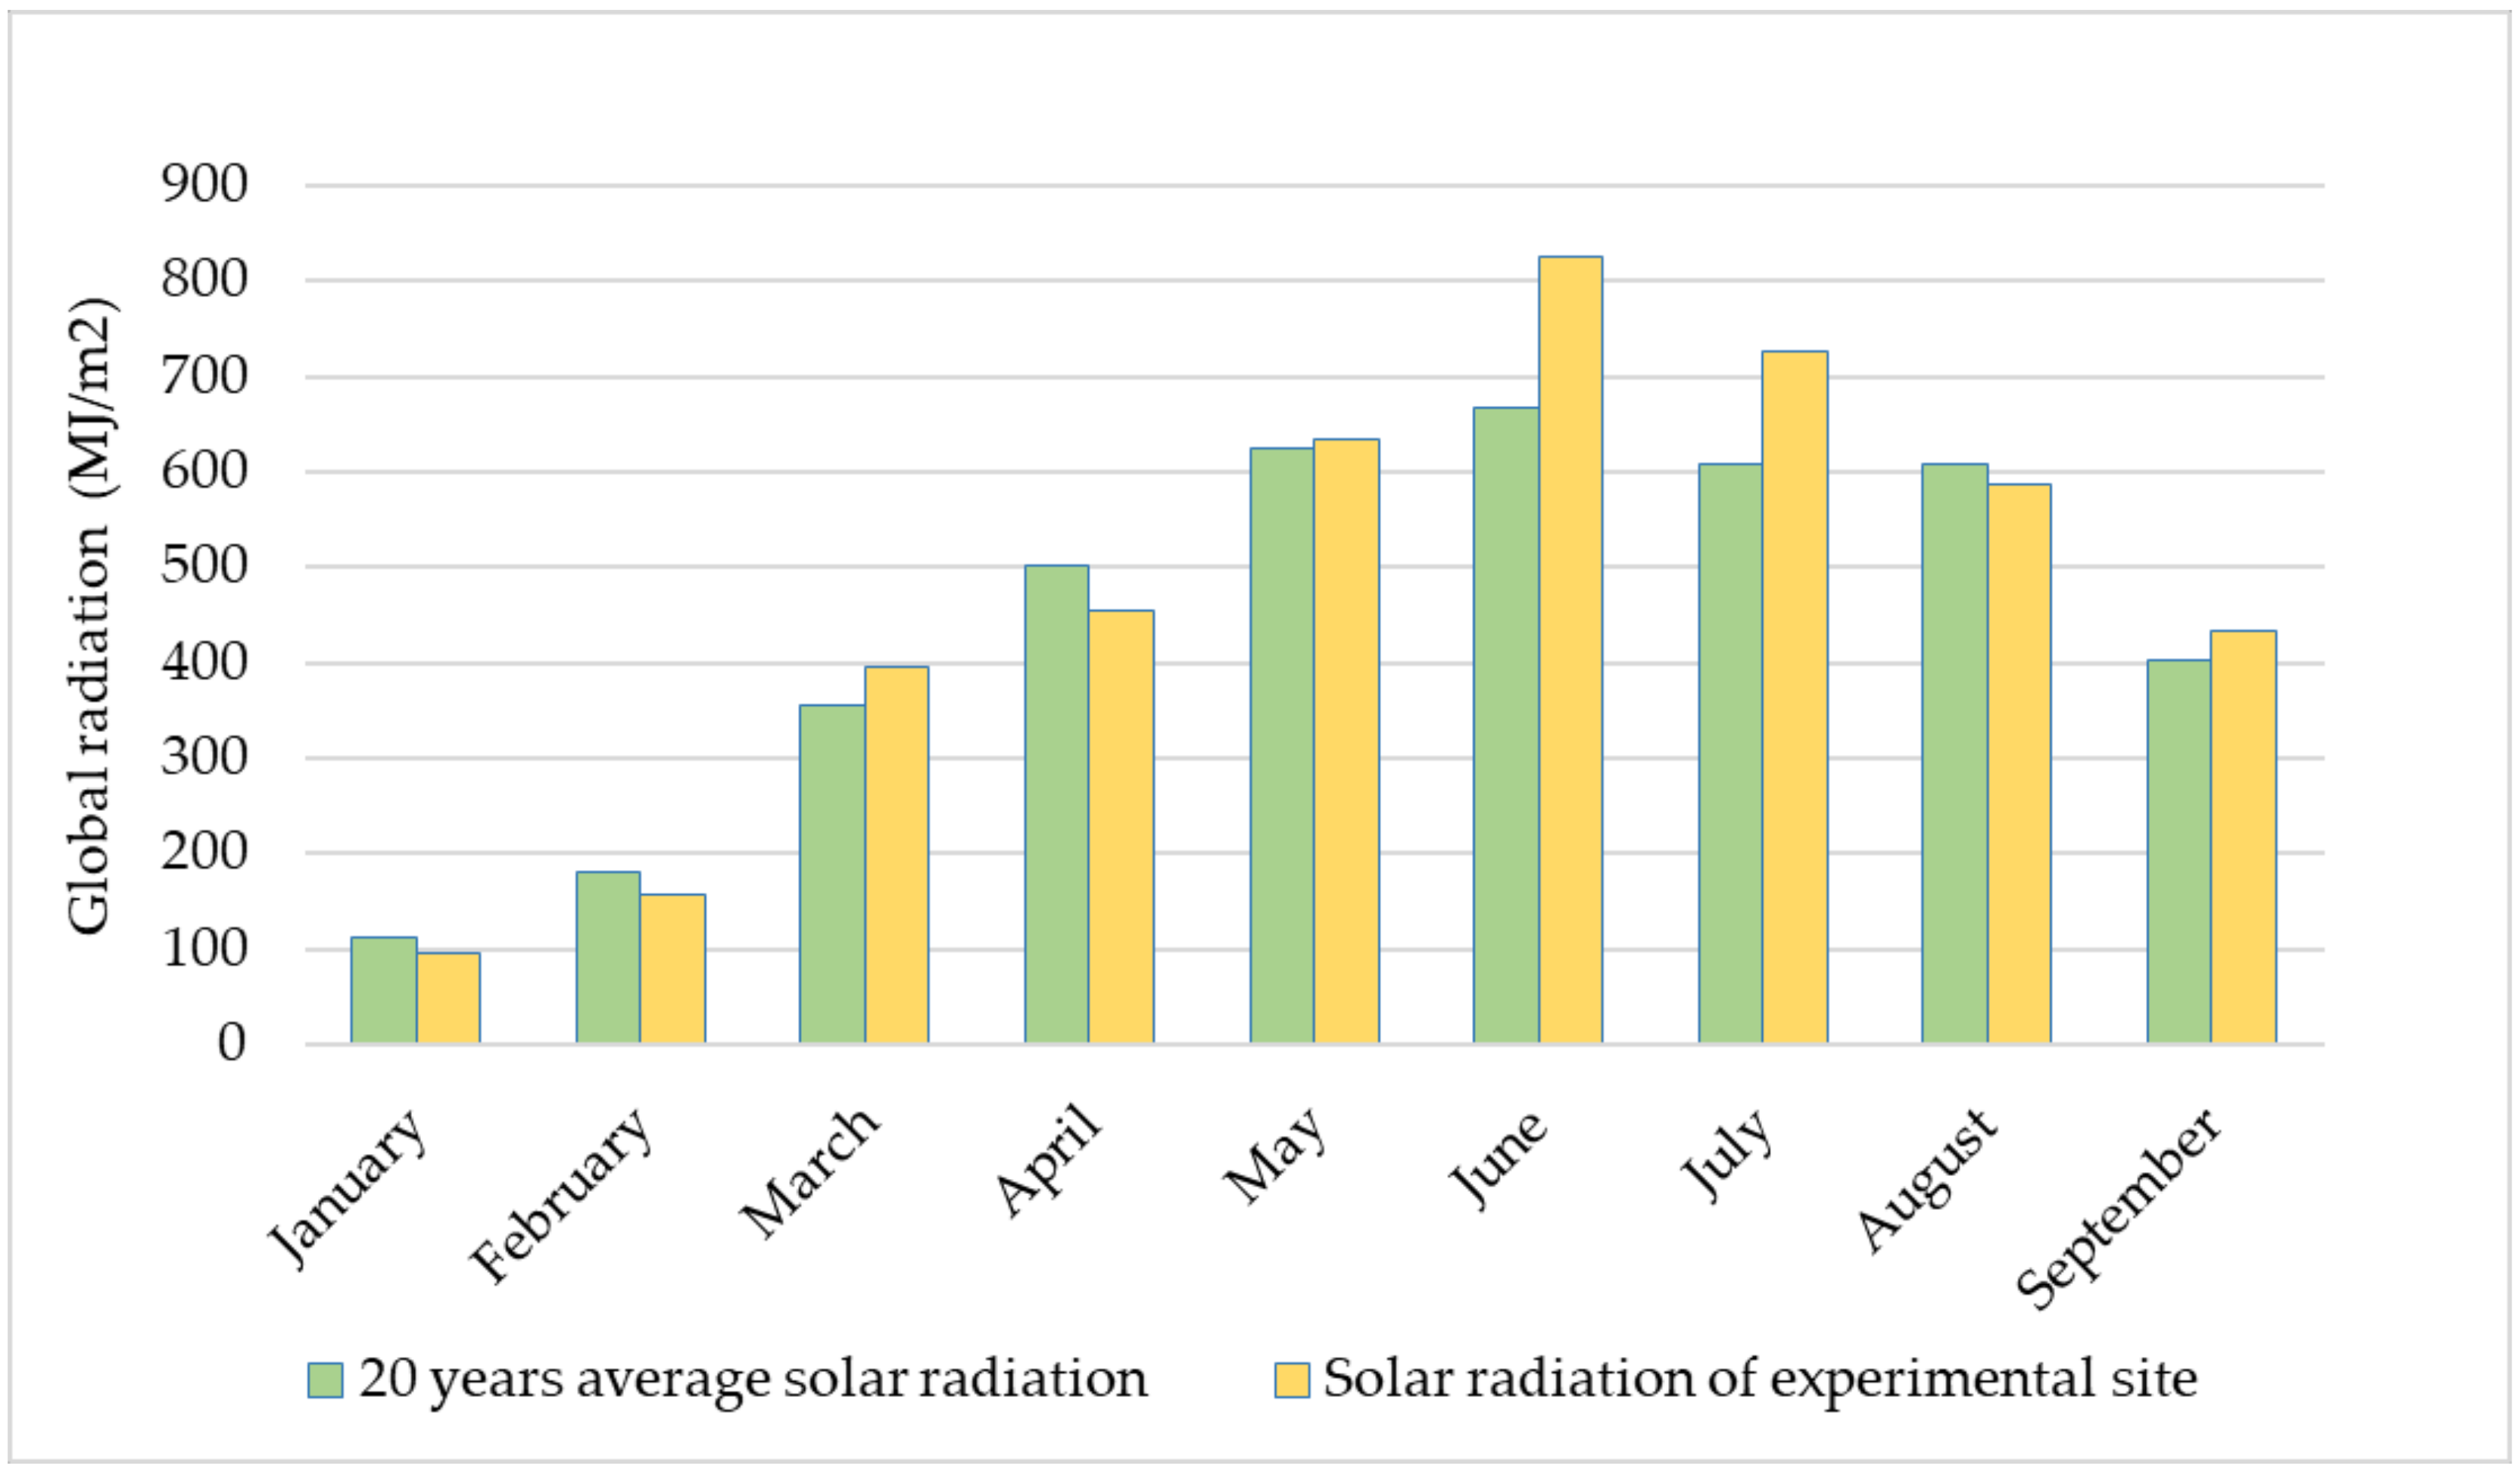
2.3. Weather Characteristics of the Crop Season
2.4. Methodology of Measurements and Calculations
2.5. Data Analysis
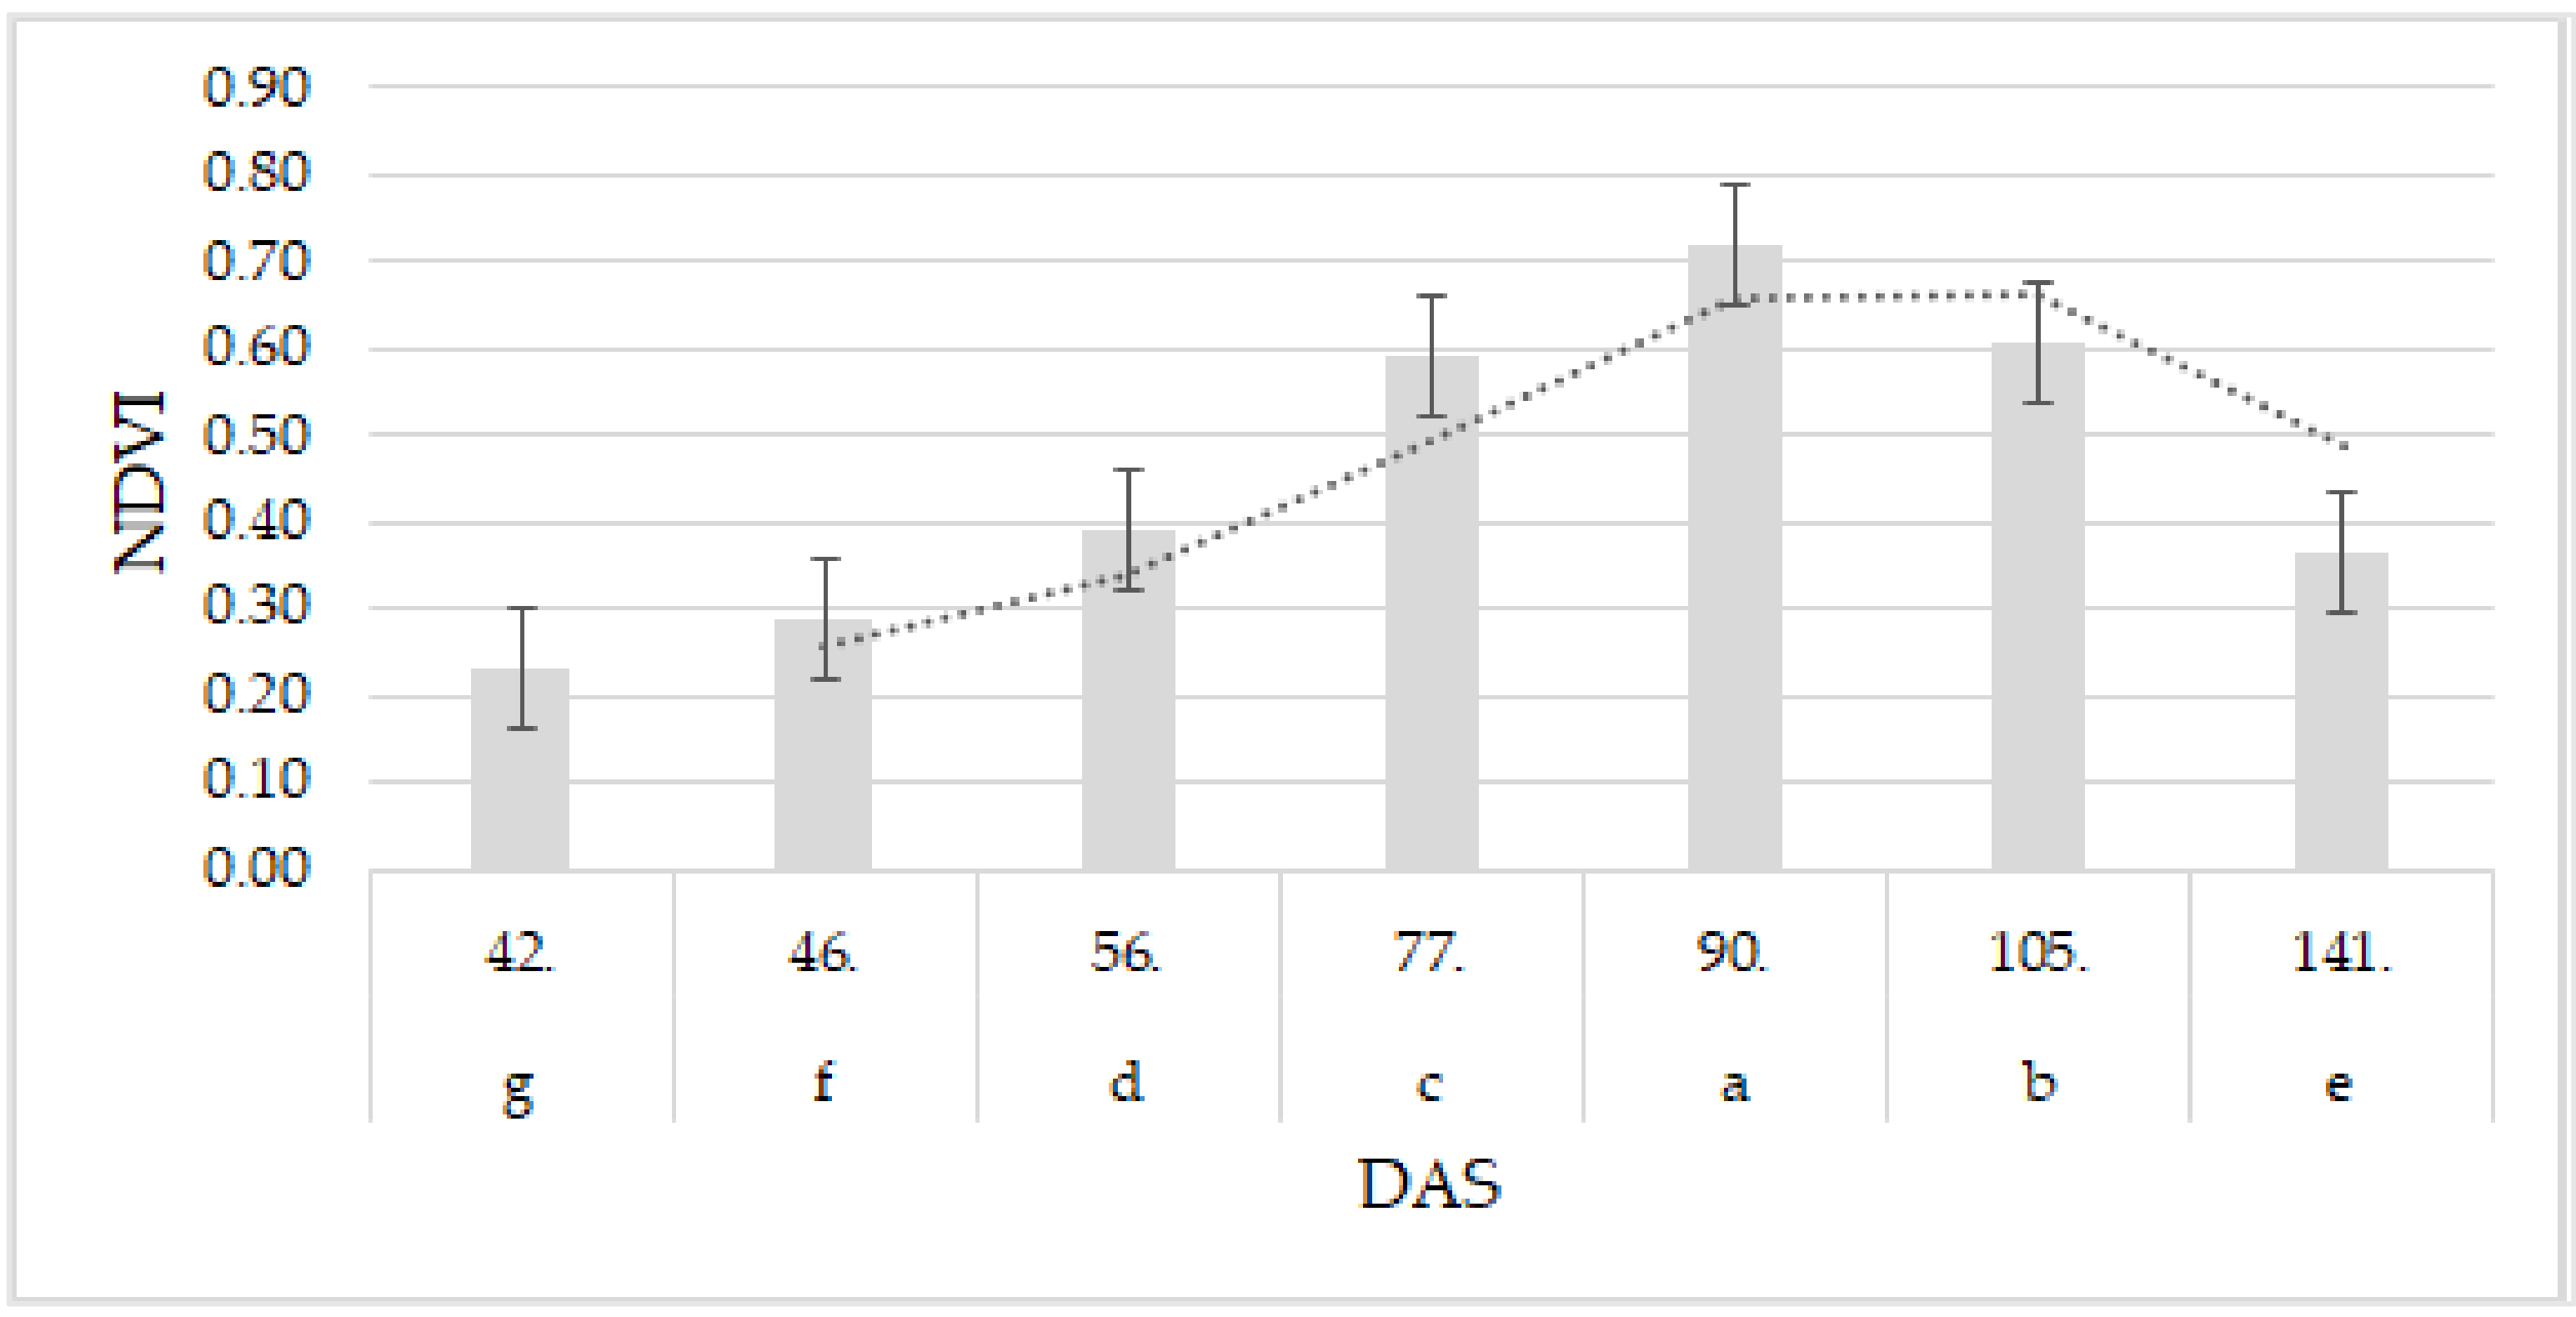
3. Results
4. Discussion
5. Conclusions
Author Contributions
Funding
Data Availability Statement
Conflicts of Interest
References
- Chen, X.; Cui, Z.; Fan, M.; Vitousek, P.; Zhao, M.; Ma, W.; Wang, Z.; Zhang, W.; Yan, X.; Yang, J.; et al. Producing more grain with lower environmental costs. Nature 2014, 514, 486–489. [Google Scholar] [CrossRef] [PubMed]
- Hou, P.; Liu, Y.; Liu, W.; Liu, G.; Xie, R.; Wang, K.; Ming, B.; Wang, Y.; Zhao, R.; Zhang, W.; et al. How to increase maize production without extra nitrogen input. Resour. Conserv. Recycl. 2020, 160, 104913. [Google Scholar] [CrossRef]
- Széles, A.; Huzsvai, L. Modelling the effect of sowing date on the emergence, silking and yield of maize (Zea mays L.) in a moderately warm and dry production area. Agron. Res. 2020, 18, 579–594. [Google Scholar]
- Huzsvai, L.; Zsembeli, J.; Kovács, E.; Juhász, C. Can Technological Development Compensate for the Unfavorable Impacts of Climate Change? Conclusions from 50 Years of Maize (Zea mays L.) Production in Hungary. Atmosphere 2020, 11, 1350. [Google Scholar] [CrossRef]
- Harsányi, E.; Bashir, B.; Alsilibe, F.; Alsafadi, K.; Alsalman, A.; Széles, A.; Rahman, M.H.U.; Bácskai, I.; Juhász, C.; Rátonyi, T.; et al. Impact of agricultural drought on sunflower production across hungary. Atmosphere 2020, 12, 1339. [Google Scholar] [CrossRef]
- Elbeltagi, A.; Nagy, A.; Mohammed, S.; Pande, C.B.; Kumar, M.; Bhat, S.A.; Zsembeli, J.; Huzsvai, L.; Tamás, J.; Kovács, E.; et al. Combination of Limited Meteorological Data for Predicting Reference Crop Evapotranspiration Using Artificial Neural Network Method. Agronomy 2022, 12, 516. [Google Scholar] [CrossRef]
- Torriani, D.; Calanca, P.; Lips, M.; Amman, H.; Beniston, M.; Fuhrer, J. Regional assessment of climate change impacts on maize productivity and associated production risk in Switzerland. Region. Environ. Chang. 2007, 7, 209–221. [Google Scholar] [CrossRef]
- Noromiarilanto, F.; Brinkmann, K.; Faramalala, M.H.; Buerkert, A. Assessment of food self-sufficiency in smallholder farming systems of south-western Madagascar using survey and remote sensing data. Agric. Syst. 2016, 149, 139–149. [Google Scholar] [CrossRef]
- Széles, A.; Nagy, J.; Rátonyi, T.; Harsányi, E. Effect of differential fertilisation treatments on maize hybrid quality and performance under environmental stress condition in Hungary. Maydica 2019, 64, 1–14. [Google Scholar]
- Horváth, É.; Gombos, B.; Széles, A. Evaluation phenology, yield and quality of maize genotypes in drought stress and non-stress environments. Agron. Res. 2021, 19, 408–422. [Google Scholar] [CrossRef]
- Araus, J.L.; Serret, M.D.; Edmeades, G.O. Phenotyping maize for adaptation to drought. Front. Physiol. 2012, 3, 305. [Google Scholar] [CrossRef] [PubMed] [Green Version]
- Yin, Z.T.; Qin, Q.X.; Wu, F.F.; Zhang, J.M.; Chen, T.T.; Sun, Q. Quantitative trait locus mapping of chlorophyll a fuorescence parameters using a recombinant inbred line population in maize. Euphytica 2015, 205, 25–35. [Google Scholar] [CrossRef]
- Nagy, J. Maize Production; Akadémiai Kiadó: Budapest, Hungary, 2008; pp. 42–276. [Google Scholar]
- Bojtor, C.; Mousavi, S.M.N.; Illés, Á.; Széles, A.; Nagy, J.; Marton, C.L. Stability and Adaptability of Maize Hybrids for Precision Crop Production in a Long-Term Field Experiment in Hungary. Agronomy 2021, 11, 2167. [Google Scholar] [CrossRef]
- Mousavi, S.M.N.; Bojtor, C.; Illés, Á.; Nagy, J. Genotype by Trait Interaction (GT) in Maize Hybrids on Complete Fertilizer. Plants 2021, 10, 2388. [Google Scholar] [CrossRef]
- Rácz, D.; Szőke, L.; Tóth, B.; Kovács, B.; Horváth, É.; Zagyi, P.; Duzs, L.; Széles, A. Examination of the Productivity and Physiological Responses of Maize (Zea mays L.) to Nitrapyrin and Foliar Fertilizer Treatments. Plants 2021, 10, 2426. [Google Scholar] [CrossRef]
- Olesen, J.; Trnka, M.; Kersebaum, K.; Peltonen-Sainio, P.; Rossi, F.; Kozyra, J.; Micale, F.; Seguin, B.; Skjelvåg, A. Impacts and adaptation of European crop production systems to climate change. Eur. J. Agron. 2011, 34, 96–112. [Google Scholar] [CrossRef]
- Rehman, T.; Mahmud, M.S.; Chang, Y.; Jin, J.; Shin, J. Current and future applications of statistical machine learning algorithms for agricultural machine vision systems. Comput. Electron. Agric. 2018, 156, 585–605. [Google Scholar] [CrossRef]
- Elavarasan, D.; Vincent, D.R.; Sharma, V.; Zomaya, Y.A.; Srinivasan, K. Forecasting yield by integrating agrarian factors and machine learning models: A survey. Comput. Electron. Agric. 2018, 155, 257–282. [Google Scholar] [CrossRef]
- Townsend, P.A.; Green, R.O.; Campbell, P.K.; Cavender-Bares, J.; Clark, M.L.; Couture, J.J. Global Terrestrial Ecosystem Functioning and Biogeochemical Processes. Available online: https://hyspiri.jpl.nasa.gov/downloads/RFI2_HyspIRI_related_160517/RFI2_final_Ecosystem_TownsendPhilipA.pdf (accessed on 22 December 2022).
- Jetz, W.; Cavender-Bares, J.; Pavlick, R.; Schimel, D.; Davis, F.W.; Asner, G.P. Monitoring plant functional diversity from space. Nat. Plants 2016, 2, 16024. [Google Scholar] [CrossRef] [PubMed] [Green Version]
- Verhulst, N.; Govaerts, B.; Nelissen, V.; Sayre, K.D.; Crossa, J.; Raes, D.; Deckers, J. The effect of tillage, crop rotation and residue management on maize and wheat growth and development evaluated with an optical sensor. Field Crops Res. 2011, 120, 58–67. [Google Scholar] [CrossRef]
- Hatfield, J.L.; Prueger, J.H. Value of Using Different Vegetative Indices to Quantify Agricultural Crop Characteristics at Different Growth Stages under Varying Management Practices. Remote Sens. 2010, 2, 562–578. [Google Scholar] [CrossRef] [Green Version]
- El-Hendawy, S.; Al-Suhaibani, N.; Mubushar, M.; Tahir, M.U.; Marey, S.; Refay, Y.; Tola, E. Combining Hyperspectral Reflectance and Multivariate Regression Models to Estimate Plant Biomass of Advanced Spring Wheat Lines in Diverse Phenological Stages under Salinity Conditions. Appl. Sci. 2022, 12, 1983. [Google Scholar] [CrossRef]
- Han, L.; Yang, G.; Yang, H.; Xu, B.; Li, Z.; Yang, X. Clustering field-based maize phenotyping of plant-height growth and canopy spectral dynamics using a UAV remote-sensing approach. Front. Plant Sci. 2018, 9, 1638. [Google Scholar] [CrossRef] [PubMed] [Green Version]
- Duan, T.; Chapman, S.C.; Guo, Y.; Zheng, B. Dynamic monitoring of NDVI in wheat agronomy and breeding trials using an unmanned aerial vehicle. Field Crops Res. 2017, 210, 71–80. [Google Scholar] [CrossRef]
- Potgieter, A.B.; George-Jaeggli, B.; Chapman, S.C.; Laws, K.; Cadavid, L.A.S.; Wixted, J.; Watson, J.; Eldridge, M.; Jordan, D.R.; Hammer, G.L. Multi-spectral imaging from an unmanned aerial vehicle enables the assessment of seasonal leaf area dynamics of sorghum breeding lines. Front. Plant Sci. 2017, 8, 1532. [Google Scholar] [CrossRef] [PubMed]
- Adao, T.; Hruska, J.; Padua, L.; Bessa, J.; Peres, E.; Morais, R. Hyperspectral Imaging: A review on UAV-based sensors, data processing and applications for agriculture and forestry. Remote Sens. 2017, 9, 1110. [Google Scholar] [CrossRef] [Green Version]
- Burkart, A.; Hecht, V.L.; Kraska, T.; Rascher, U. Phenological analysis of unmanned aerial vehicle based time series of barley imagery with high temporal resolution. Precis. Agric. 2018, 19, 134–146. [Google Scholar] [CrossRef]
- Burke, M.; Lobell, D.B. Satellite-based assessment of yield variation and its determinants in smallholder African systems. Proc. Natl. Acad. Sci. USA 2017, 114, 2189–2194. [Google Scholar] [CrossRef] [Green Version]
- Swain, K.C.; Thomson, S.J.; Jayasuriya, H.P.W. Adoption of an unmanned helicopter for low-altitude remote sensing to estimate yield and total biomass of a rice crop. Am. Soc. Agric. Biol. Eng. 2010, 53, 21–27. [Google Scholar]
- Szabó, A.; Mousavi, S.M.N.; Bojtor, C.; Ragán, P.; Nagy, J.; Vad, A.; Illés, Á. Analysis of Nutrient-Specific Response of Maize Hybrids in Relation to Leaf Area Index (LAI) and Remote Sensing. Plants 2022, 11, 1197. [Google Scholar] [CrossRef]
- Fejér, P.; Széles, A.; Horváth, É.; Rátonyi, T.; Ragán, P. Effects of some agronomic practices on the quality of starch content of maize grains. Agron. Res. 2022, 20, 124–133. [Google Scholar] [CrossRef]
- Rátonyi, T.; Tamás, A.; Ujpál, I.; Juhász, C.; Ragán, P. The impact of conventional and precision farming technology and year effect on maize yields. In International Congress on Sustainable Development in the Human Environment-Current & Future Challenges ICSDEC; Krakowiak-Bal, A., Atilgan, A., Rolbiecki, R., Aktas, H., Eds.; Proceedings Book: Alanya, Turkey, 2022; pp. 19.10.2022–22.10.2022. [Google Scholar]
- OMSZ—Hungarian National Meteorological Service. 2022. Available online: https://met.hu/eghajlat/magyarorszag_eghajlata/varosok_jellemzoi/Debrecen/ (accessed on 22 December 2022).
- Quantum GIS Development Team. Quantum GIS Geographic Information System. Open Source Geospatial Foundation Project. 2023. Available online: https://qgis.org (accessed on 22 December 2022).
- Csajbók, J.; Buday-Bódi, E.; Nagy, A.; Fehér, Z.Z.; Tamás, A.; Virág, I.C.; Bojtor, C.; Forgács, F.; Vad, A.M.; Kutasy, E. Multispectral Analysis of Small Plots Based on Field and Remote Sensing Surveys—A Comparative Evaluation. Sustainability 2022, 14, 3339. [Google Scholar] [CrossRef]
- Sentera Support. 2021. Available online: https://support.sentera.com/portal/en/kb/sentera (accessed on 22 December 2022).
- R Core Team. R: A language and Environment for Statistical Computing; R Foundation for Statistical Computing: Vienna, Austria, 2022; Available online: https://www.R-project.org/ (accessed on 22 December 2022).
- Posit Team. RStudio: Integrated Development Environment for R, Posit Software, PBC, Boston, MA. 2022. Available online: http://www.posit.co/ (accessed on 22 December 2022).
- Warnes, G.R.; Bolker, B.; Bonebakker, L.; Gentleman, R.; Liaw, W.H.A.; Lumley, T.; Maechler, M.; Magnusson, A.; Moeller, S.; Schwartz, M.; et al. Various R Programming Tools for Plotting Data. R Package Version 2.17.0. 2015. Available online: http://CRAN.R-project.org/package=gplots (accessed on 22 December 2022).
- Fox, J.; Weisberg, S. Companion to Applied Regression. [R Package]. 2020. Available online: https://cran.r-project.org/package=car (accessed on 22 December 2022).
- de Mendinburu, F. Agricolae: Statistical Procedures for Agricultural Research. R Package Version 1.3-5. 2021. Available online: http://CRAN.R-project.org/package=agricolae (accessed on 22 December 2022).
- Huzsvai, L.; Balogh, P. Lineáris Modellek az R-Ben; Seneca Books: Debrecen, Hungary, 2015; pp. 109–124. [Google Scholar]
- Tunca, E.; Köksal, E.S.; Taner, S.Ç. Silage maize yield estimation by using planetscope, sentinel-2A and landsat 8 OLI satellite images. Smart Agric. Technol. 2023, 4, 100165. [Google Scholar] [CrossRef]
- Yang, B.; Zhu, W.; Rezaei, E.E.; Li, J.; Sun, Z.; Zhang, J. The Optimal Phenological Phase of Maize for Yield Prediction with High-Frequency UAV Remote Sensing. Remote Sens. 2022, 14, 1559. [Google Scholar] [CrossRef]
- Chivasa, W.; Mutanga, O.; Burgueño, J. UAV-based high-throughput phenotyping to increase prediction and selection accuracy in maize varieties under artificial MSV inoculation. Comput. Electron. Agric. 2021, 184, 106128. [Google Scholar] [CrossRef]
- Żarski, J.; Kuśmierek-Tomaszewska, R. Effects of Drip Irrigation and Top dressing Nitrogen Fertigation on Maize Grain Yield in Central Poland. Agronomy 2023, 13, 360. [Google Scholar] [CrossRef]
- Ihuoma, O.S.; Madramootoo, C.A. Recent advances in crop water stress detection. Comput. Electron. Agric. 2017, 141, 267–275. [Google Scholar] [CrossRef]
- Gałęzewski, L.; Jaskulska, I.; Kotwica, K.; Lewandowski, Ł. The Dynamics of Soil Moisture and Temperature—Strip-Till vs. Plowing—A Case Study. Agronomy 2023, 13, 83. [Google Scholar] [CrossRef]


| Layer 0–20 cm | Layer 20–40 cm | Layer 40–60 cm | |
|---|---|---|---|
| pH (KCl 1:2,5) | 7.44 | 7.50 | 7.75 |
| KA | 45.5 | 46 | 46 |
| CaCO3 (%) | 12.12 | 12.32 | 17.37 |
| Humus (%) | 2.86 | 3.09 | 2.11 |
| NO3 + NO2 (mg kg−1) | 5.07 | 3.53 | 2.77 |
| P O25 (AL) (mg kg−1) | 515.98 | 533.43 | 173.05 |
| K2 O (AL) (mg kg−1) | 351.73 | 300.97 | 174.24 |
| 95% Cl | |||||
|---|---|---|---|---|---|
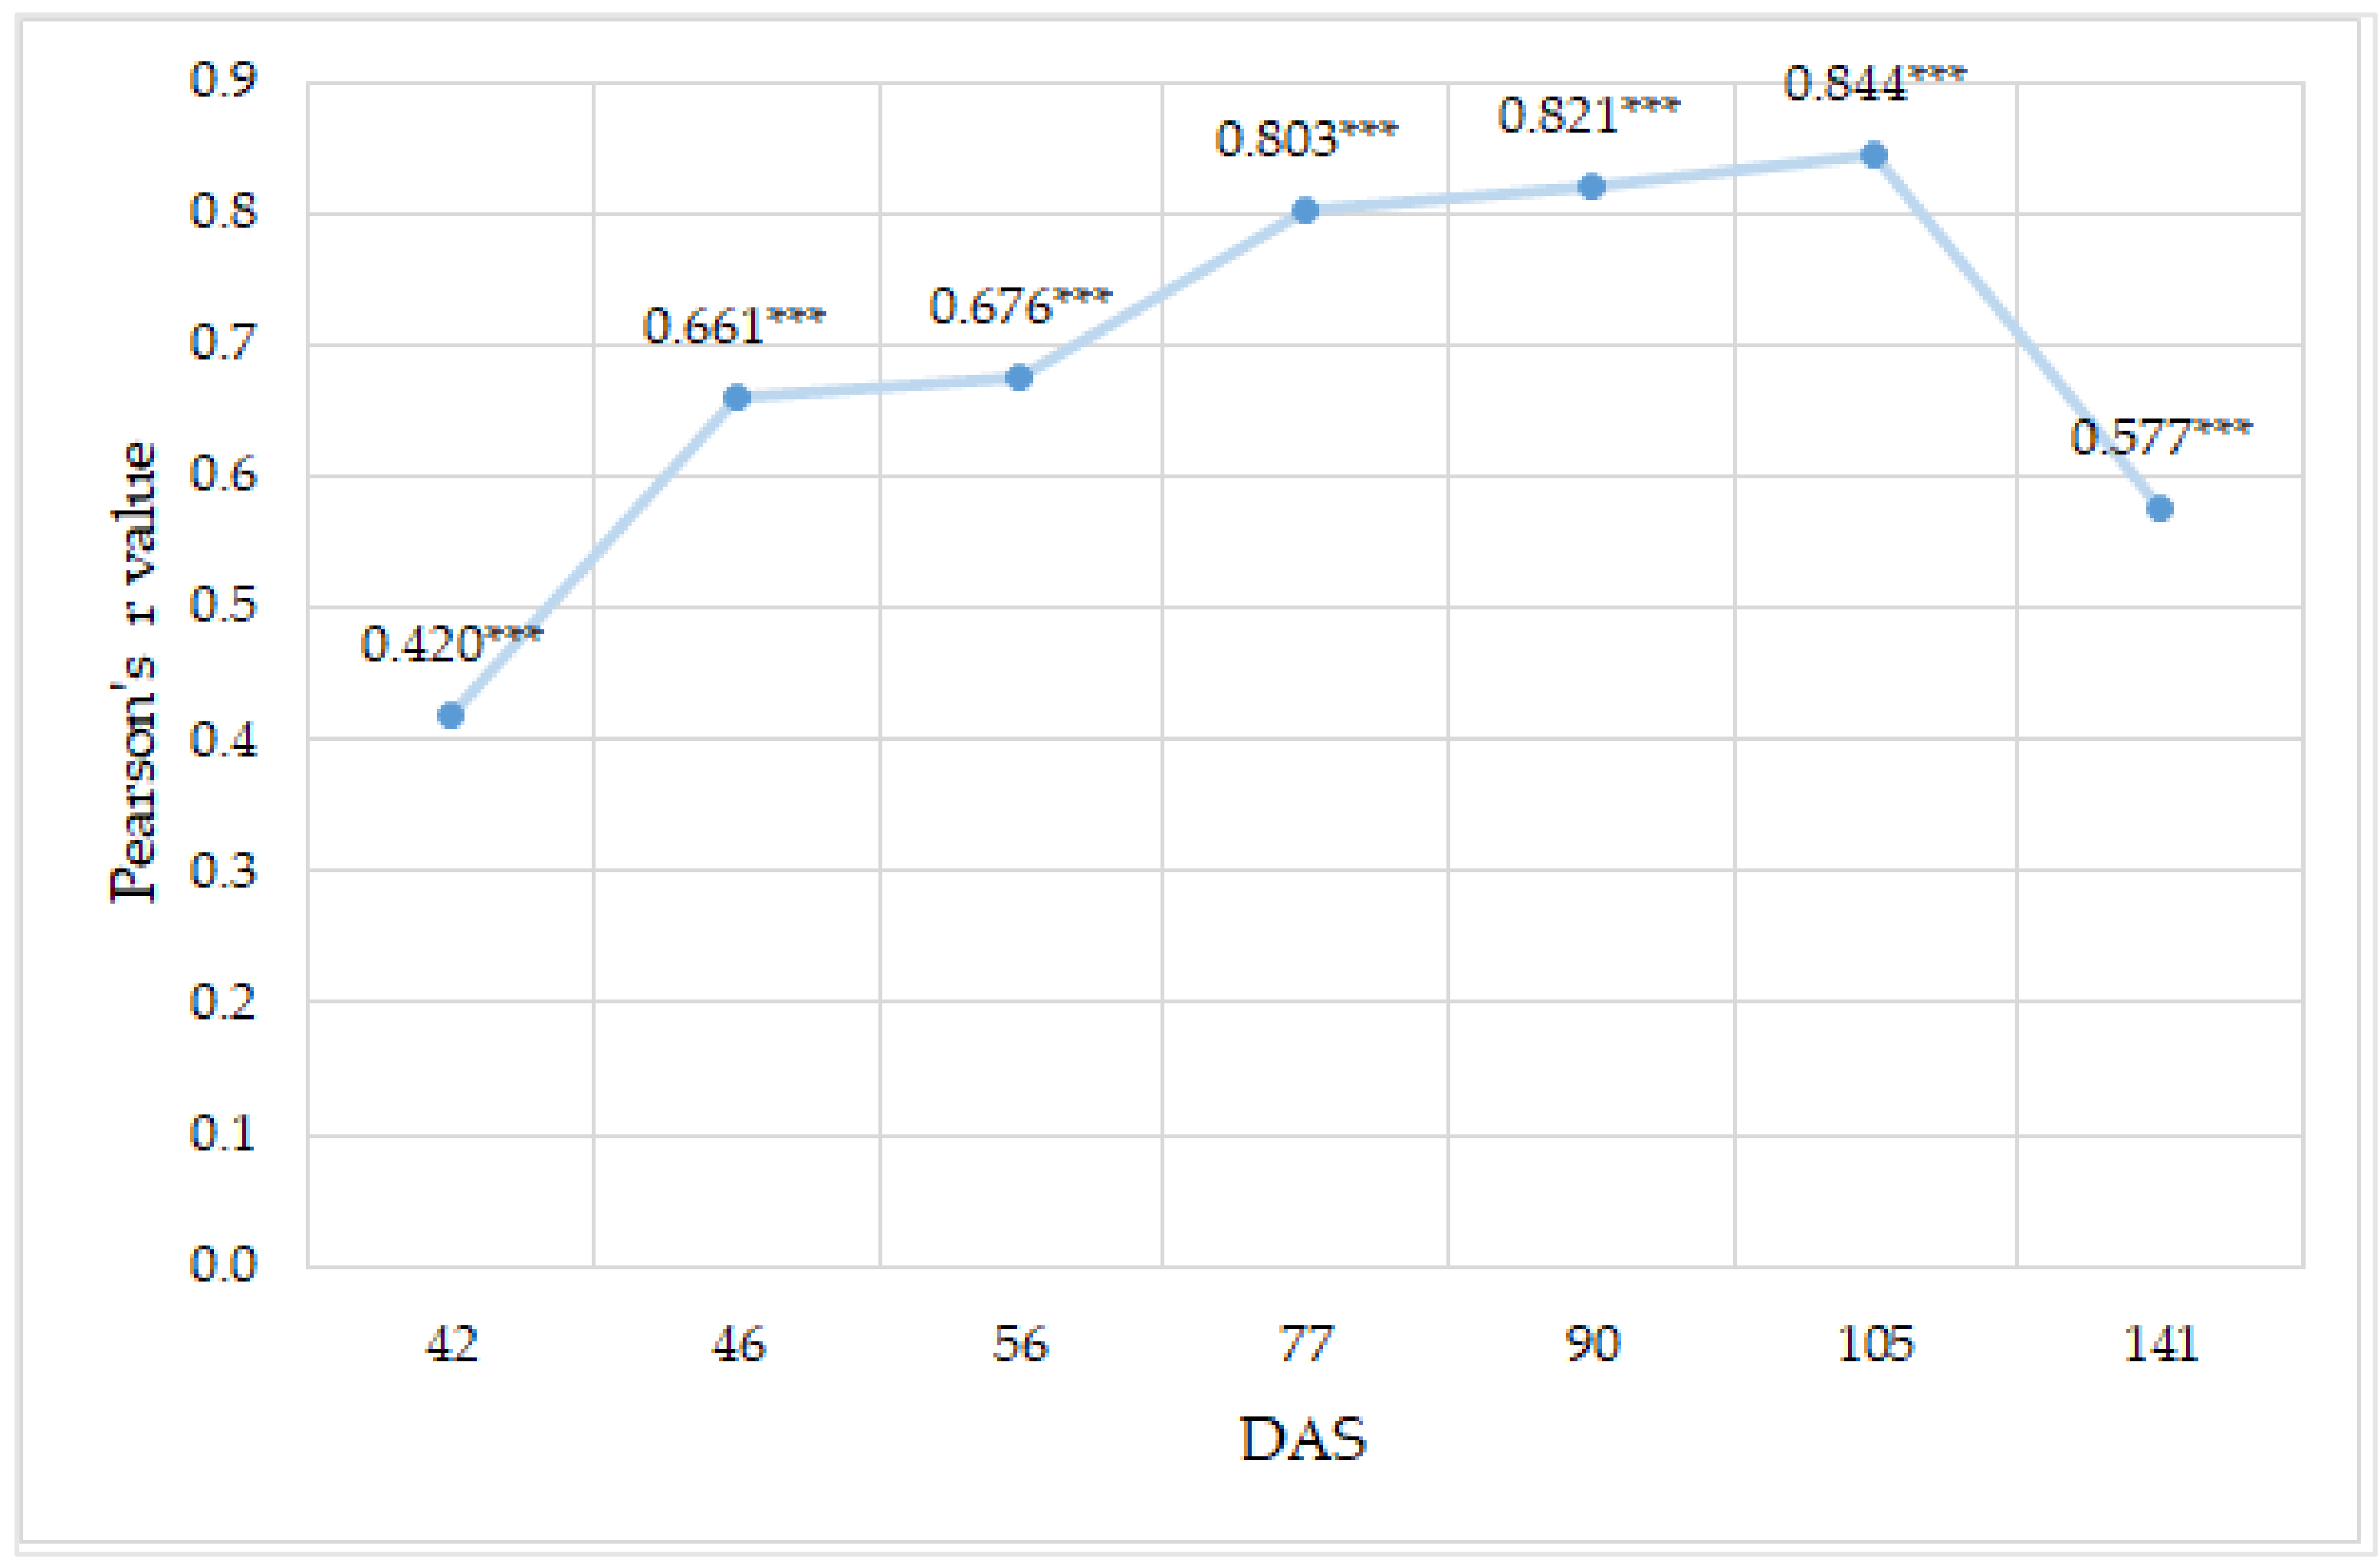
| DAS | Variables | Pearson’s r | Lower | Upper | N |
| 42 | NDVIUAV - Yield t ha−1 | 0.420 *** | 0.339 | 0.494 | 432 |
| 46 | NDVIUAV - Yield t ha−1 | 0.661 *** | 0.605 | 0.711 | 432 |
| 56 | NDVIUAV - Yield t ha−1 | 0.676 *** | 0.622 | 0.724 | 432 |
| 77 | NDVIUAV - Yield t ha−1 | 0.803 *** | 0.766 | 0.834 | 432 |
| 90 | NDVIUAV - Yield t ha−1 | 0.821 *** | 0.787 | 0.849 | 432 |
| 105 | NDVIUAV - Yield t ha−1 | 0.844 *** | 0.815 | 0.869 | 432 |
| 141 | NDVIUAV - Yield t ha−1 | 0.577 *** | 0.510 | 0.637 | 432 |
| 95% Cl | ||||||
|---|---|---|---|---|---|---|
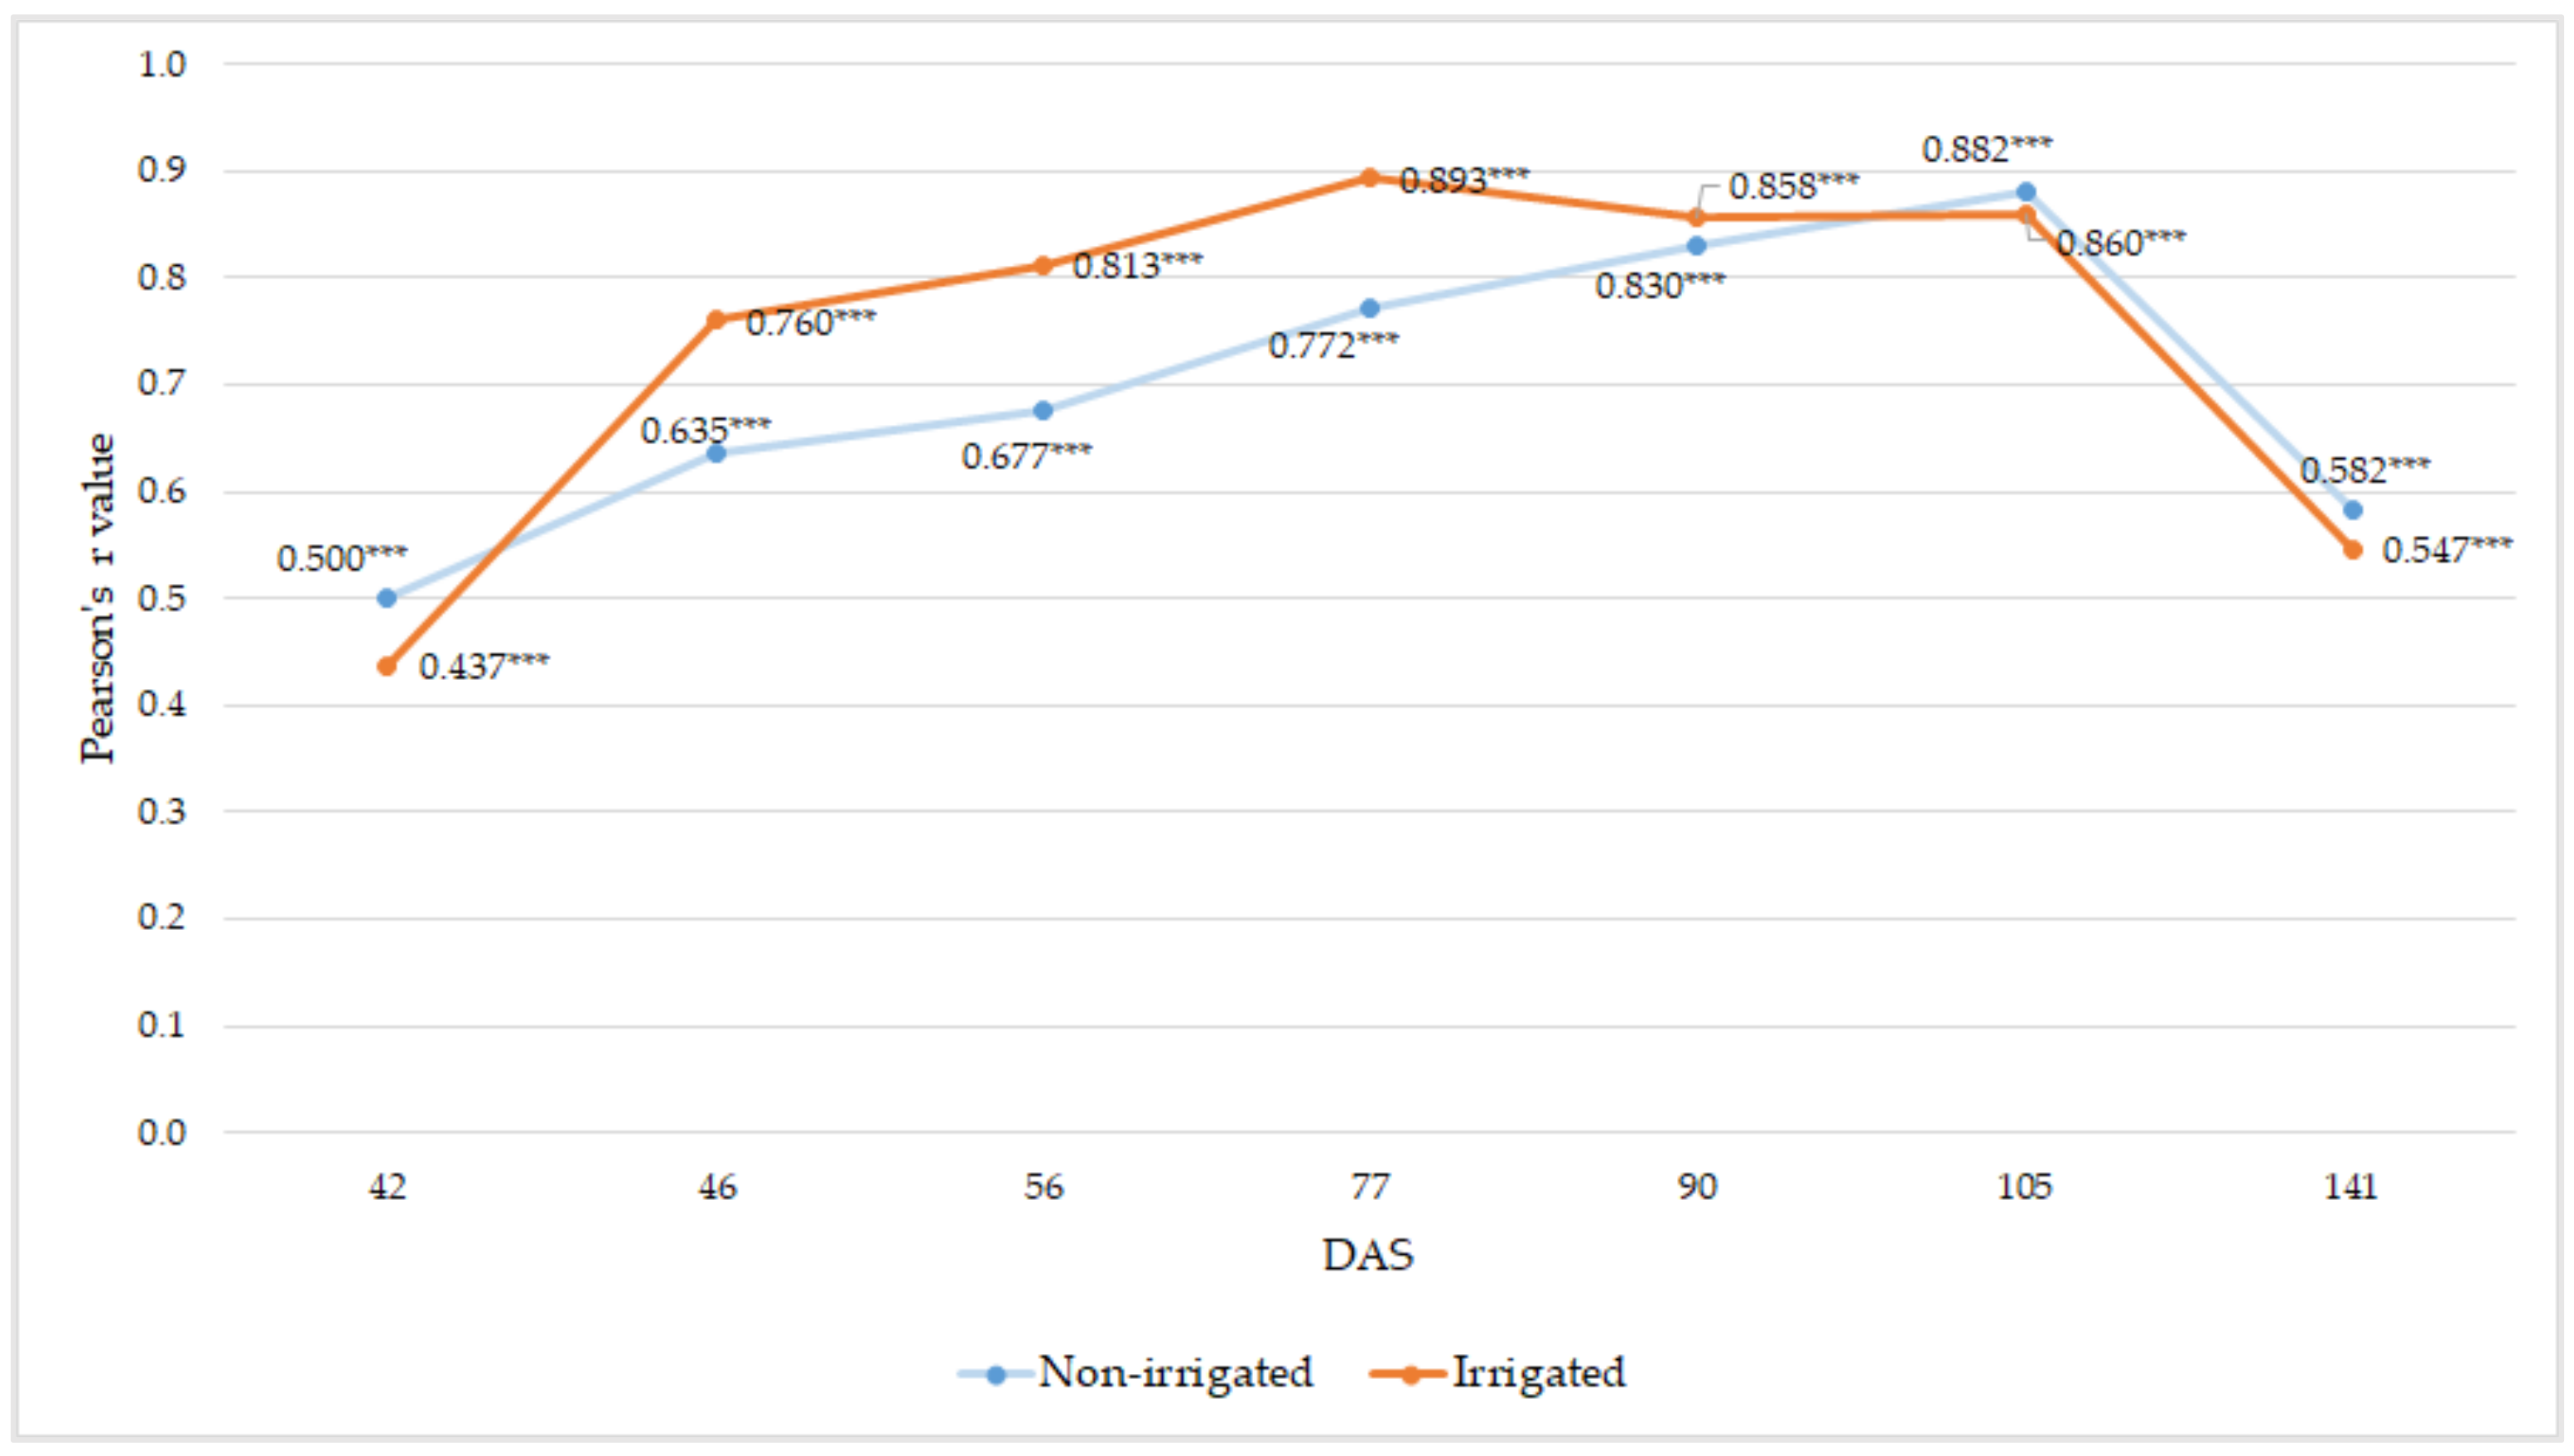
| DAS | Group | Variables | Pearson’s r | Lower | Upper | N |
| 42 | Non-irrigated | NDVIUAV - Yield t ha−1 | 0.500 *** | 0.393 | 0.594 | 216 |
| Irrigated | NDVIUAV - Yield t ha−1 | 0.437 *** | 0.322 | 0.539 | 216 | |
| 46 | Non-irrigated | NDVIUAV - Yield t ha−1 | 0.635 *** | 0.548 | 0.708 | 216 |
| Irrigated | NDVIUAV - Yield t ha−1 | 0.760 *** | 0.697 | 0.811 | 216 | |
| 56 | Non-irrigated | NDVIUAV - Yield t ha−1 | 0.677 *** | 0.598 | 0.743 | 216 |
| Irrigated | NDVIUAV - Yield t ha−1 | 0.813 *** | 0.762 | 0.854 | 216 | |
| 77 | Non-irrigated | NDVIUAV - Yield t ha−1 | 0.772 *** | 0.712 | 0.821 | 216 |
| Irrigated | NDVIUAV - Yield t ha−1 | 0.893 *** | 0.862 | 0.917 | 216 | |
| 90 | Non-irrigated | NDVIUAV - Yield t ha−1 | 0.830 *** | 0.784 | 0.868 | 216 |
| Irrigated | NDVIUAV - Yield t ha−1 | 0.858 *** | 0.818 | 0.889 | 216 | |
| 105 | Non-irrigated | NDVIUAV - Yield t ha−1 | 0.882 *** | 0.849 | 0.909 | 216 |
| Irrigated | NDVIUAV - Yield t ha−1 | 0.860 *** | 0.820 | 0.891 | 216 | |
| 141 | Non-irrigated | NDVIUAV - Yield t ha−1 | 0.582 *** | 0.486 | 0.664 | 216 |
| Irrigated | NDVIUAV - Yield t ha−1 | 0.547 *** | 0.446 | 0.634 | 216 | |
| 95% Cl | ||||||
|---|---|---|---|---|---|---|
| DAS | Group | Variables | Pearson’s r | Lower | Upper | N |
| 42 | Winter ploughing | NDVIUAV - Yield t ha−1 | 0.436 *** | 0.293 | 0.559 | 144 |
| Strip-till Ripping | NDVIUAV - Yield t ha−1 NDVIUAV - Yield t ha−1 | 0.129 *** 0.368 *** | −0.035 0.218 | 0.286 0.502 | 144 144 | |
| 46 | Winter ploughing | NDVIUAV - Yield t ha−1 | 0.657 *** | 0.553 | 0.741 | 144 |
| Strip-till Ripping | NDVIUAV - Yield t ha−1 NDVIUAV - Yield t ha−1 | 0.498 *** 0.650 *** | 0.365 0.545 | 0.612 0.736 | 144 144 | |
| 56 | Winter ploughing | NDVIUAV - Yield t ha−1 | 0.590 *** | 0.472 | 0.687 | 144 |
| Strip-till Ripping | NDVIUAV - Yield t ha−1 NDVIUAV - Yield t ha−1 | 0.587 *** 0.719 *** | 0.469 0.630 | 0.685 0.790 | 144 144 | |
| 77 | Winter ploughing | NDVIUAV - Yield t ha−1 | 0.813 *** | 0.749 | 0.862 | 144 |
| Strip-till Ripping | NDVIUAV - Yield t ha−1 NDVIUAV - Yield t ha−1 | 0.712 *** 0.815 *** | 0.621 0.751 | 0.785 0.863 | 144 144 | |
| 90 | Winter ploughing | NDVIUAV - Yield t ha−1 | 0.846 *** | 0.792 | 0.887 | 144 |
| Strip-till Ripping | NDVIUAV - Yield t ha−1 NDVIUAV - Yield t ha−1 | 0.726 *** 0.869 *** | 0.638 0.823 | 0.795 0.904 | 144 144 | |
| 105 | Winter ploughing | NDVIUAV - Yield t ha−1 | 0.920 *** | 0.891 | 0.942 | 144 |
| Strip-till Ripping | NDVIUAV - Yield t ha−1 NDVIUAV - Yield t ha−1 | 0.825 *** 0.858 *** | 0.764 0.808 | 0.871 0.896 | 144 144 | |
| 141 | Winter ploughing | NDVIUAV - Yield t ha−1 | 0.685 *** | 0.587 | 0.763 | 144 |
| Strip-till Ripping | NDVIUAV - Yield t ha−1 NDVIUAV - Yield t ha−1 | 0.562 *** 0.624 *** | 0.438 0.513 | 0.664 0.715 | 144 144 | |
| 95% Cl | ||||||
|---|---|---|---|---|---|---|
| DAS | Group | Variables | Pearson’s r | Lower | Upper | N |
| 42 | Merida-380 | NDVIUAV - Yield t ha−1 | 0.436 *** | 0.293 | 0.559 | 144 |
| Corasano-490-510 Fornad-420 | NDVIUAV - Yield t ha−1 NDVIUAV - Yield t ha−1 | 0.129 *** 0.368 *** | −0.035 0.218 | 0.286 0.502 | 144 144 | |
| 46 | Merida-380 | NDVIUAV - Yield t ha−1 | 0.657 *** | 0.553 | 0.741 | 144 |
| Corasano-490-510 Fornad-420 | NDVIUAV - Yield t ha−1 NDVIUAV - Yield t ha−1 | 0.498 *** 0.650 *** | 0.365 0.545 | 0.612 0.736 | 144 144 | |
| 56 | Merida-380 | NDVIUAV - Yield t ha−1 | 0.590 *** | 0.472 | 0.687 | 144 |
| Corasano-490-510 Fornad-420 | NDVIUAV - Yield t ha−1 NDVIUAV - Yield t ha−1 | 0.587 *** 0.719 *** | 0.469 0.630 | 0.685 0.790 | 144 144 | |
| 77 | Merida-380 | NDVIUAV - Yield t ha−1 | 0.813 *** | 0.749 | 0.862 | 144 |
| Corasano-490-510 Fornad-420 | NDVIUAV - Yield t ha−1 NDVIUAV - Yield t ha−1 | 0.712 *** 0.815 *** | 0.621 0.751 | 0.785 0.863 | 144 144 | |
| 90 | Merida-380 | NDVIUAV - Yield t ha−1 | 0.846 *** | 0.792 | 0.887 | 144 |
| Corasano-490-510 Fornad-420 | NDVIUAV - Yield t ha−1 NDVIUAV - Yield t ha−1 | 0.726 *** 0.869 *** | 0.638 0.823 | 0.795 0.904 | 144 144 | |
| 105 | Merida-380 | NDVIUAV - Yield t ha−1 | 0.920 *** | 0.891 | 0.942 | 144 |
| Corasano-490-510 Fornad-420 | NDVIUAV - Yield t ha−1 NDVIUAV - Yield t ha−1 | 0.825 *** 0.858 *** | 0.764 0.808 | 0.871 0.896 | 144 144 | |
| 141 | Merida-380 | NDVIUAV - Yield t ha−1 | 0.685 *** | 0.587 | 0.763 | 144 |
| Corasano-490-510 Fornad-420 | NDVIUAV - Yield t ha−1 NDVIUAV - Yield t ha−1 | 0.562 *** 0.624 *** | 0.438 0.513 | 0.664 0.715 | 144 144 | |
| 95% Cl | ||||||
|---|---|---|---|---|---|---|
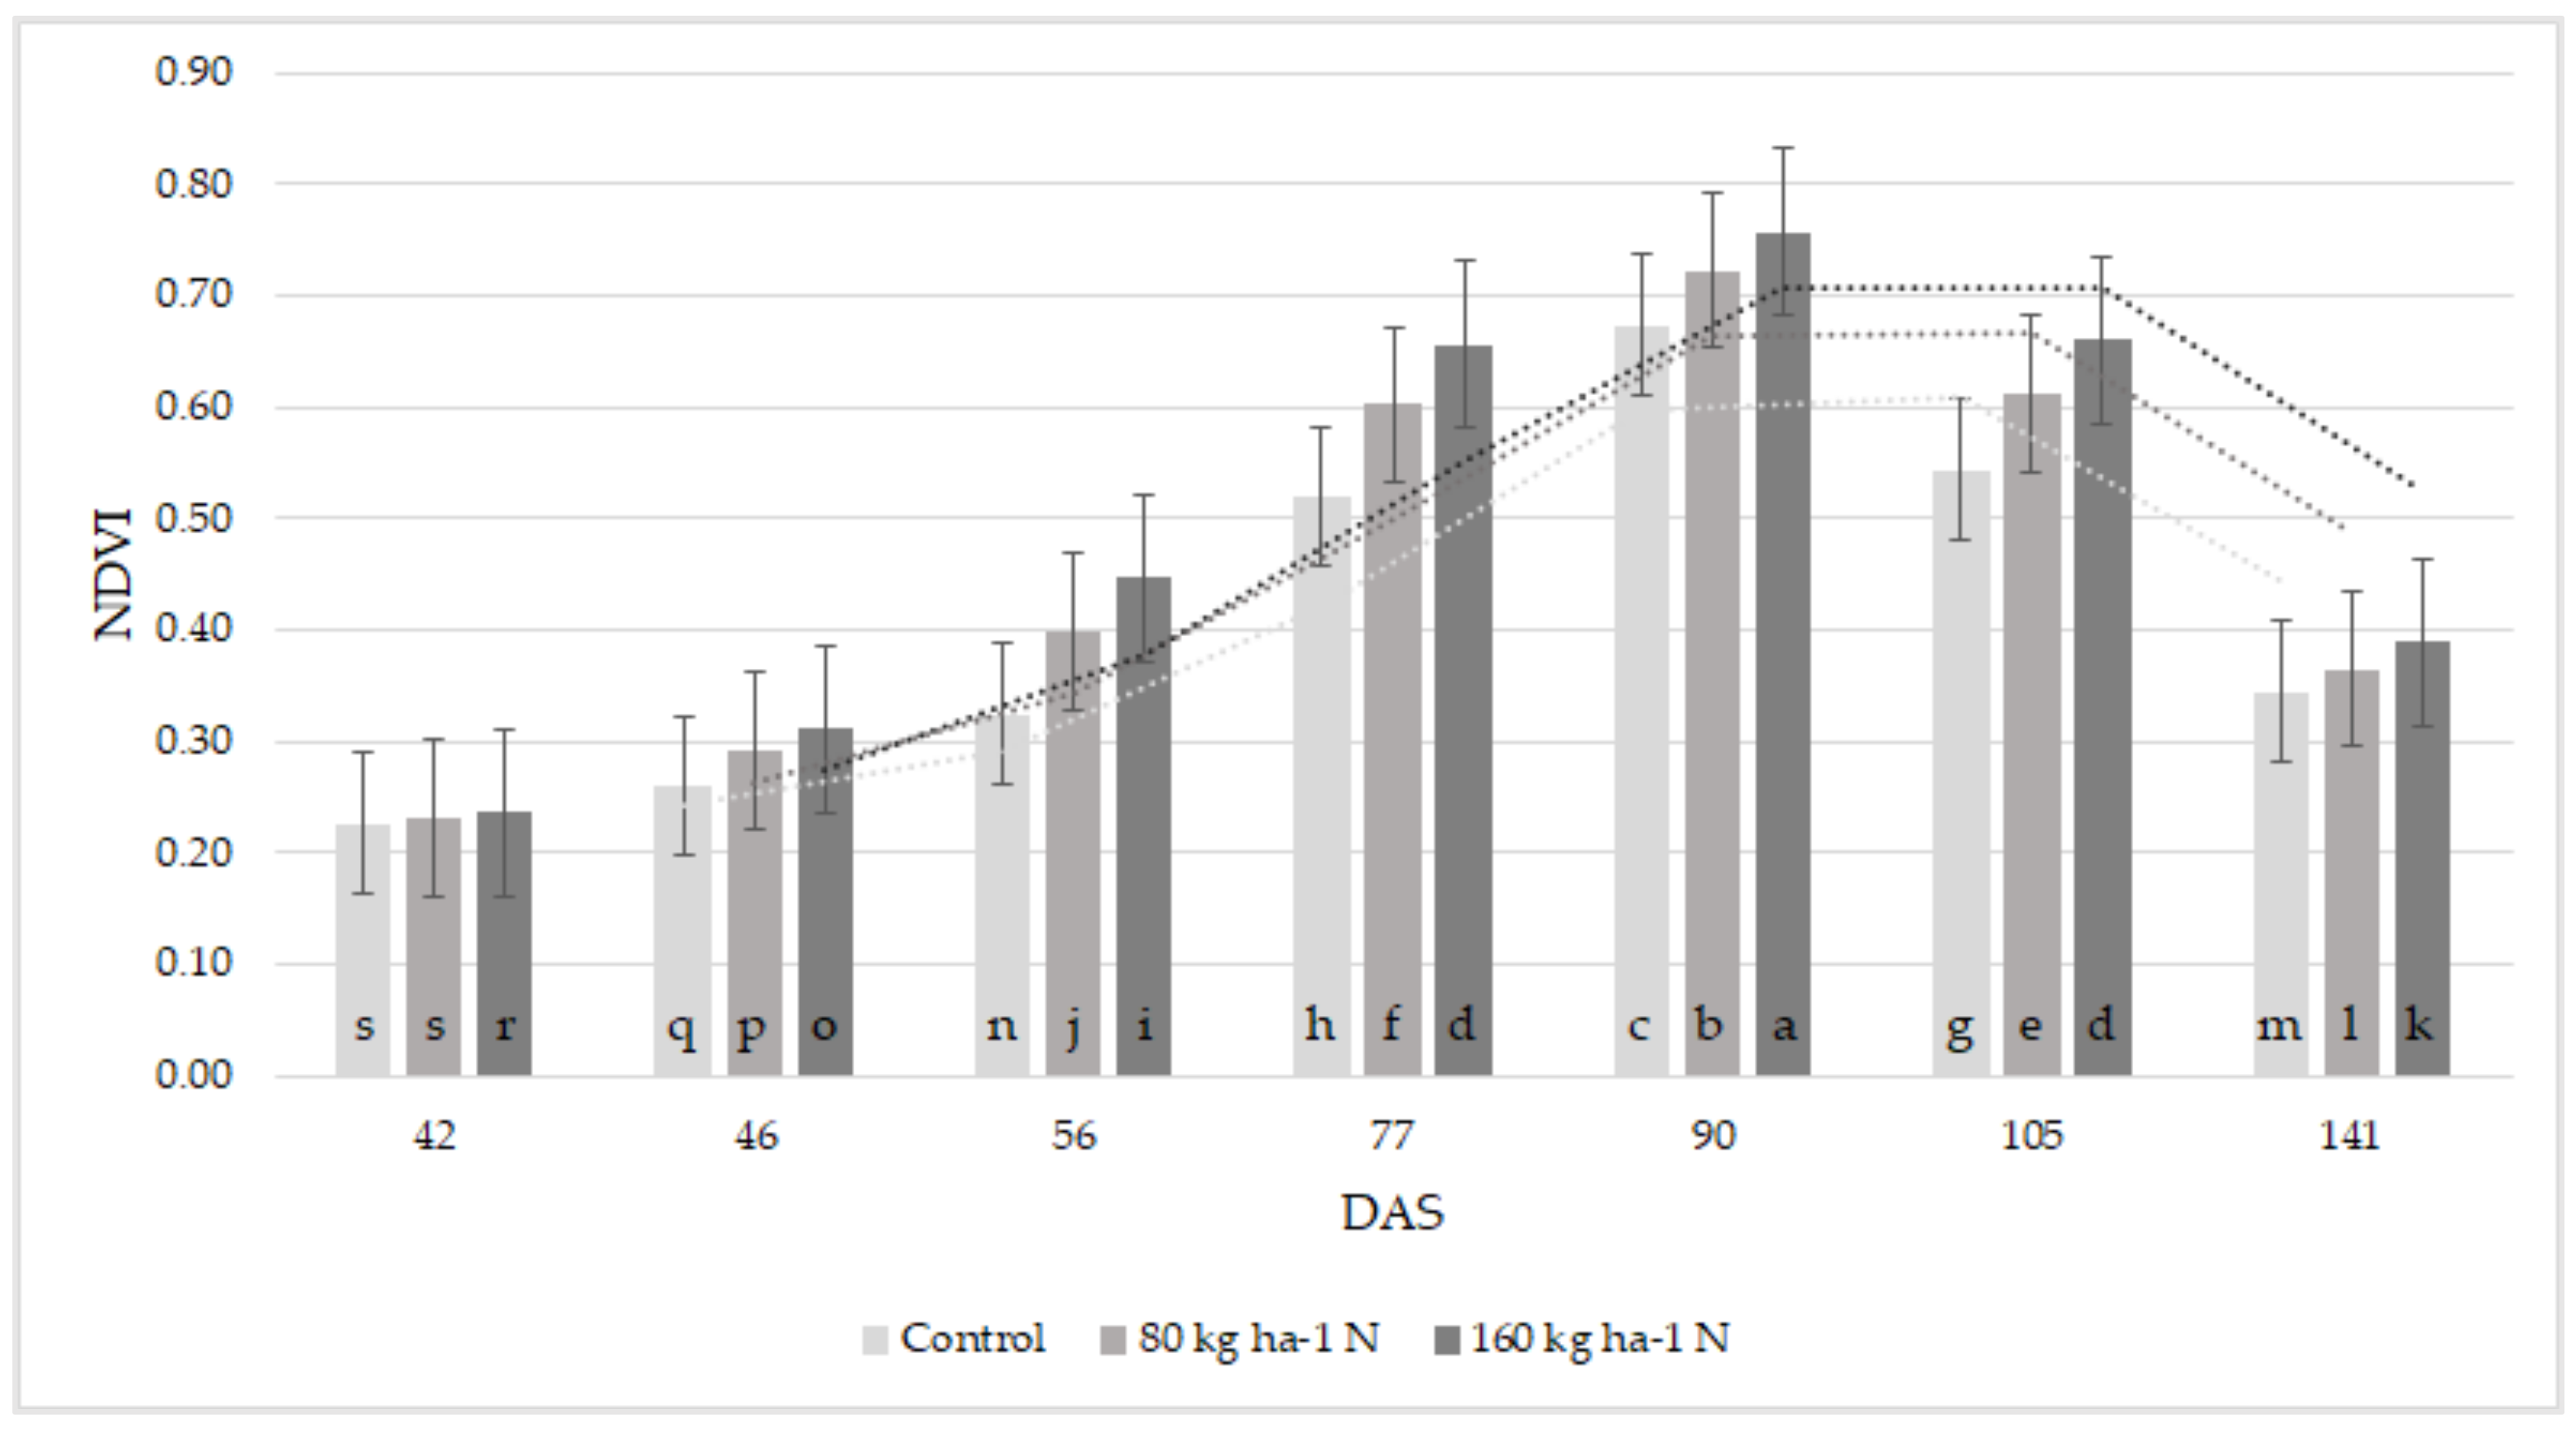
| DAS | Group | Variables | Pearson’s r | Lower | Upper | N |
| 42 | Control | NDVIUAV - Yield t ha−1 | −0.058 *** | −0.219 | 0.107 | 144 |
| 80 kg N ha−1 160 kg N ha−1 | NDVIUAV - Yield t ha−1 NDVIUAV - Yield t ha−1 | 0.514 *** 0.149 *** | 0.383 −0.015 | 0.625 0.305 | 144 144 | |
| 46 | Control | NDVIUAV - Yield t ha−1 | 0.258 *** | 0.099 | 0.405 | 144 |
| 80 kg N ha−1 160 kg N ha−1 | NDVIUAV - Yield t ha−1 NDVIUAV - Yield t ha−1 | 0.623 *** 0.268 *** | 0.511 0.110 | 0.714 0.414 | 144 144 | |
| 56 | Control | NDVIUAV - Yield t ha−1 | 0.179 *** | 0.016 | 0.333 | 144 |
| 80 kg N ha−1 160 kg N ha−1 | NDVIUAV - Yield t ha−1 NDVIUAV - Yield t ha−1 | 0.561 *** 0.224 *** | 0.438 0.063 | 0.664 0.374 | 144 144 | |
| 77 | Control | NDVIUAV - Yield t ha−1 | 0.550 *** | 0.425 | 0.655 | 144 |
| 80 kg N ha−1 160 kg N ha−1 | NDVIUAV - Yield t ha−1 NDVIUAV - Yield t ha−1 | 0.704 *** 0.801 *** | 0.610 0.734 | 0.778 0.853 | 144 144 | |
| 90 | Control | NDVIUAV - Yield t ha−1 | 0.563 *** | 0.440 | 0.666 | 144 |
| 80 kg N ha−1 160 kg N ha−1 | NDVIUAV - Yield t ha−1 NDVIUAV - Yield t ha−1 | 0.721 *** 0.566 *** | 0.633 0.444 | 0.792 0.668 | 144 144 | |
| 105 | Control | NDVIUAV - Yield t ha−1 | 0.535 *** | 0.407 | 0.643 | 144 |
| 80 kg N ha−1 160 kg N ha−1 | NDVIUAV - Yield t ha−1 NDVIUAV - Yield t ha−1 | 0.648 *** 0.717 *** | 0.542 0.627 | 0.734 0.788 | 144 144 | |
| 141 | Control | NDVIUAV - Yield t ha−1 | 0.225 *** | 0.063 | 0.375 | 144 |
| 80 kg N ha−1 160 kg N ha−1 | NDVIUAV - Yield t ha−1 NDVIUAV - Yield t ha−1 | 0.299 *** 0.296 *** | 0.142 0.139 | 0.441 0.438 | 144 144 | |
Disclaimer/Publisher’s Note: The statements, opinions and data contained in all publications are solely those of the individual author(s) and contributor(s) and not of MDPI and/or the editor(s). MDPI and/or the editor(s) disclaim responsibility for any injury to people or property resulting from any ideas, methods, instructions or products referred to in the content. |
© 2023 by the authors. Licensee MDPI, Basel, Switzerland. This article is an open access article distributed under the terms and conditions of the Creative Commons Attribution (CC BY) license (https://creativecommons.org/licenses/by/4.0/).
Share and Cite
Tamás, A.; Kovács, E.; Horváth, É.; Juhász, C.; Radócz, L.; Rátonyi, T.; Ragán, P. Assessment of NDVI Dynamics of Maize (Zea mays L.) and Its Relation to Grain Yield in a Polyfactorial Experiment Based on Remote Sensing. Agriculture 2023, 13, 689. https://doi.org/10.3390/agriculture13030689
Tamás A, Kovács E, Horváth É, Juhász C, Radócz L, Rátonyi T, Ragán P. Assessment of NDVI Dynamics of Maize (Zea mays L.) and Its Relation to Grain Yield in a Polyfactorial Experiment Based on Remote Sensing. Agriculture. 2023; 13(3):689. https://doi.org/10.3390/agriculture13030689
Chicago/Turabian StyleTamás, András, Elza Kovács, Éva Horváth, Csaba Juhász, László Radócz, Tamás Rátonyi, and Péter Ragán. 2023. "Assessment of NDVI Dynamics of Maize (Zea mays L.) and Its Relation to Grain Yield in a Polyfactorial Experiment Based on Remote Sensing" Agriculture 13, no. 3: 689. https://doi.org/10.3390/agriculture13030689