The Presence of the Biochar Interlayer Effectively Inhibits Soil Water Evaporation and Salt Migration to the Soil Surface


Abstract
:1. Introduction
2. Materials and Methods
2.1. Test Materials
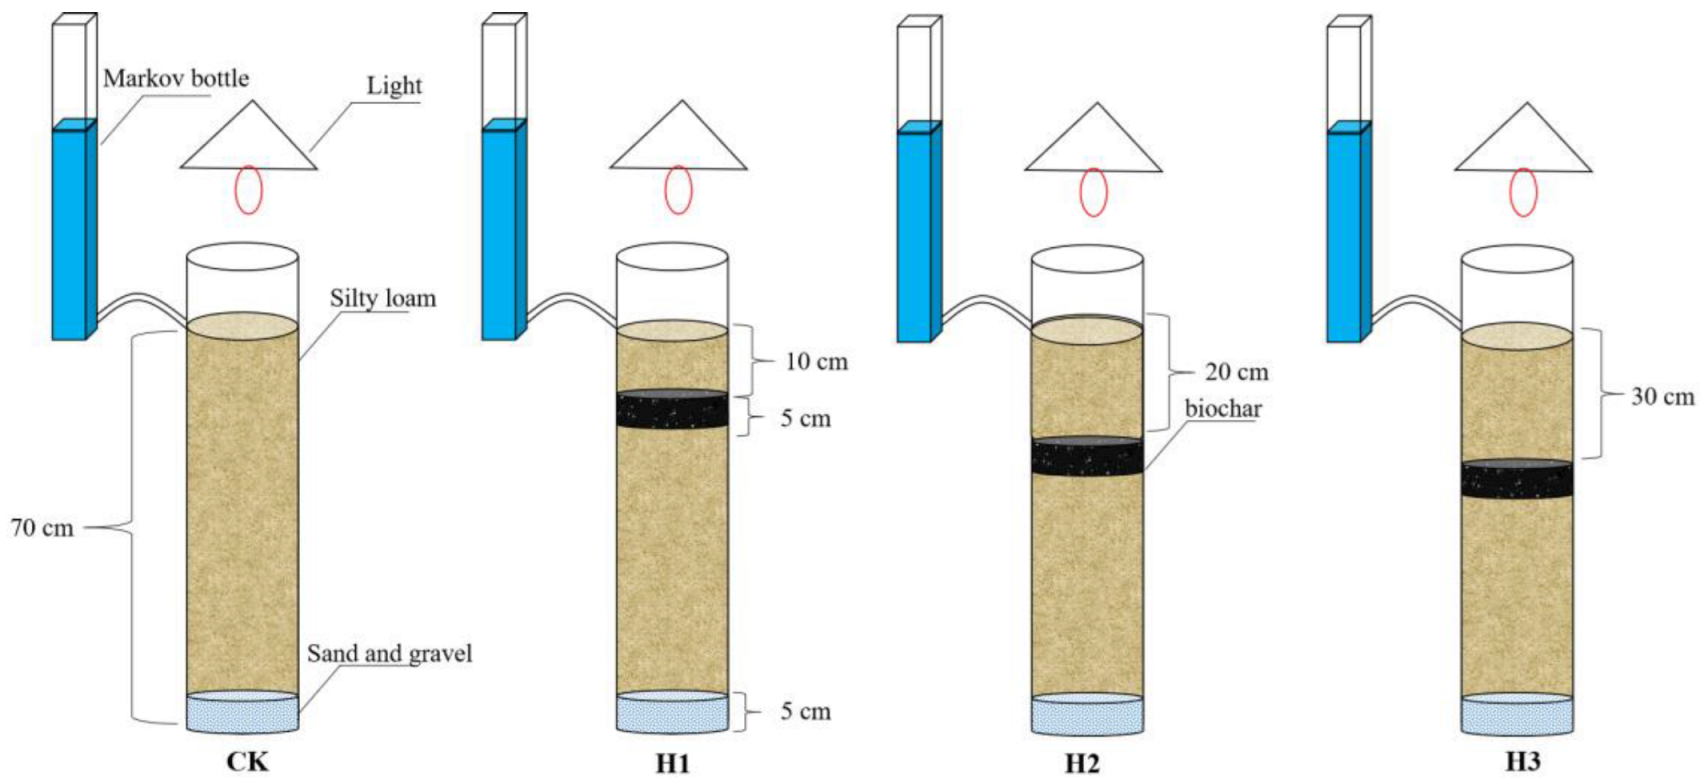
2.2. Test Design
2.3. Test Operation Process
2.4. Soil Sample Collection and Determination Method
2.5. Data Processing
3. Results and Analysis
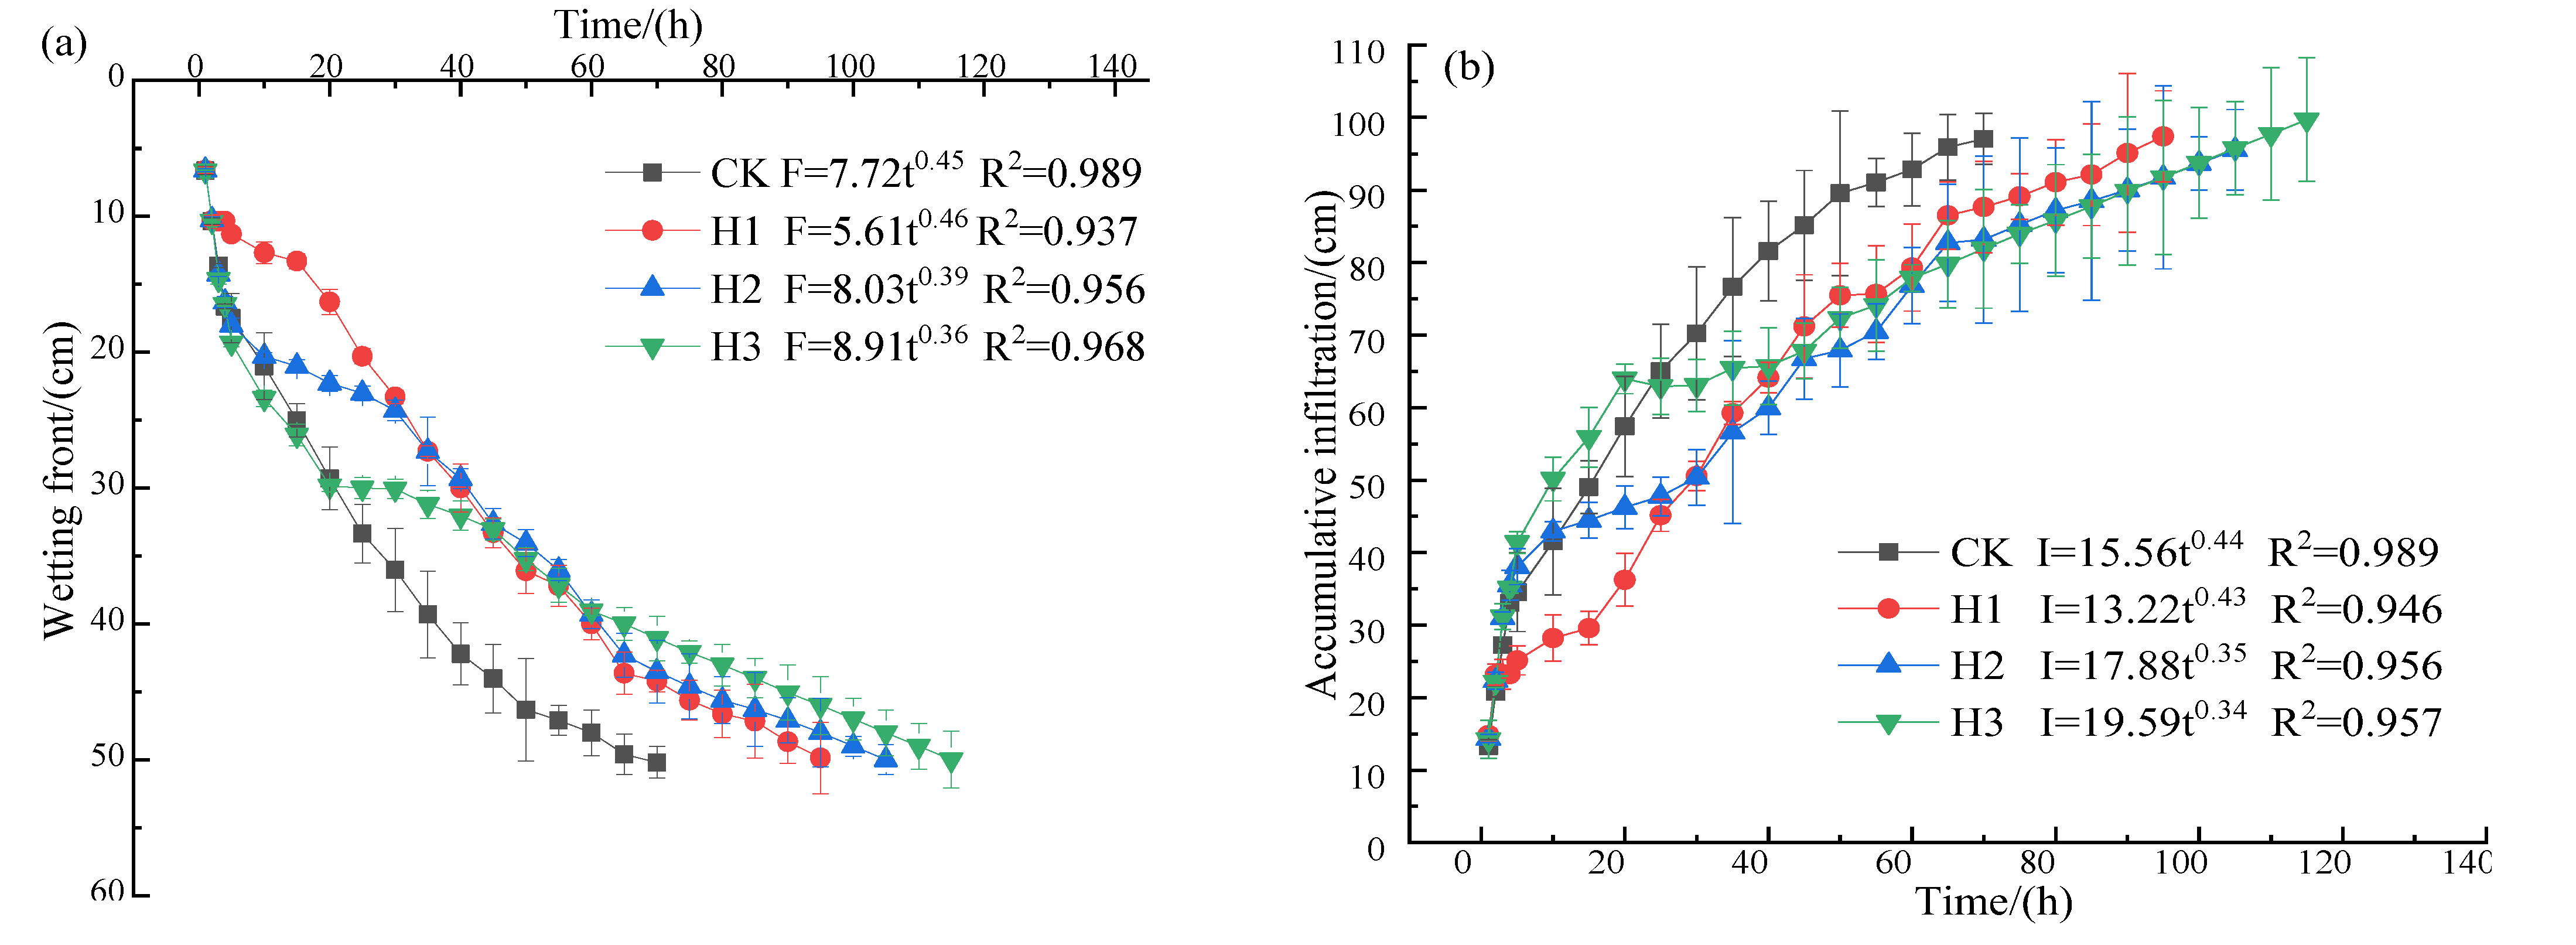
3.1. Effect of the Biochar Interlayer on Infiltration Characteristics
3.2. Effect of the Biochar Interlayer on Soil Profile Water Content
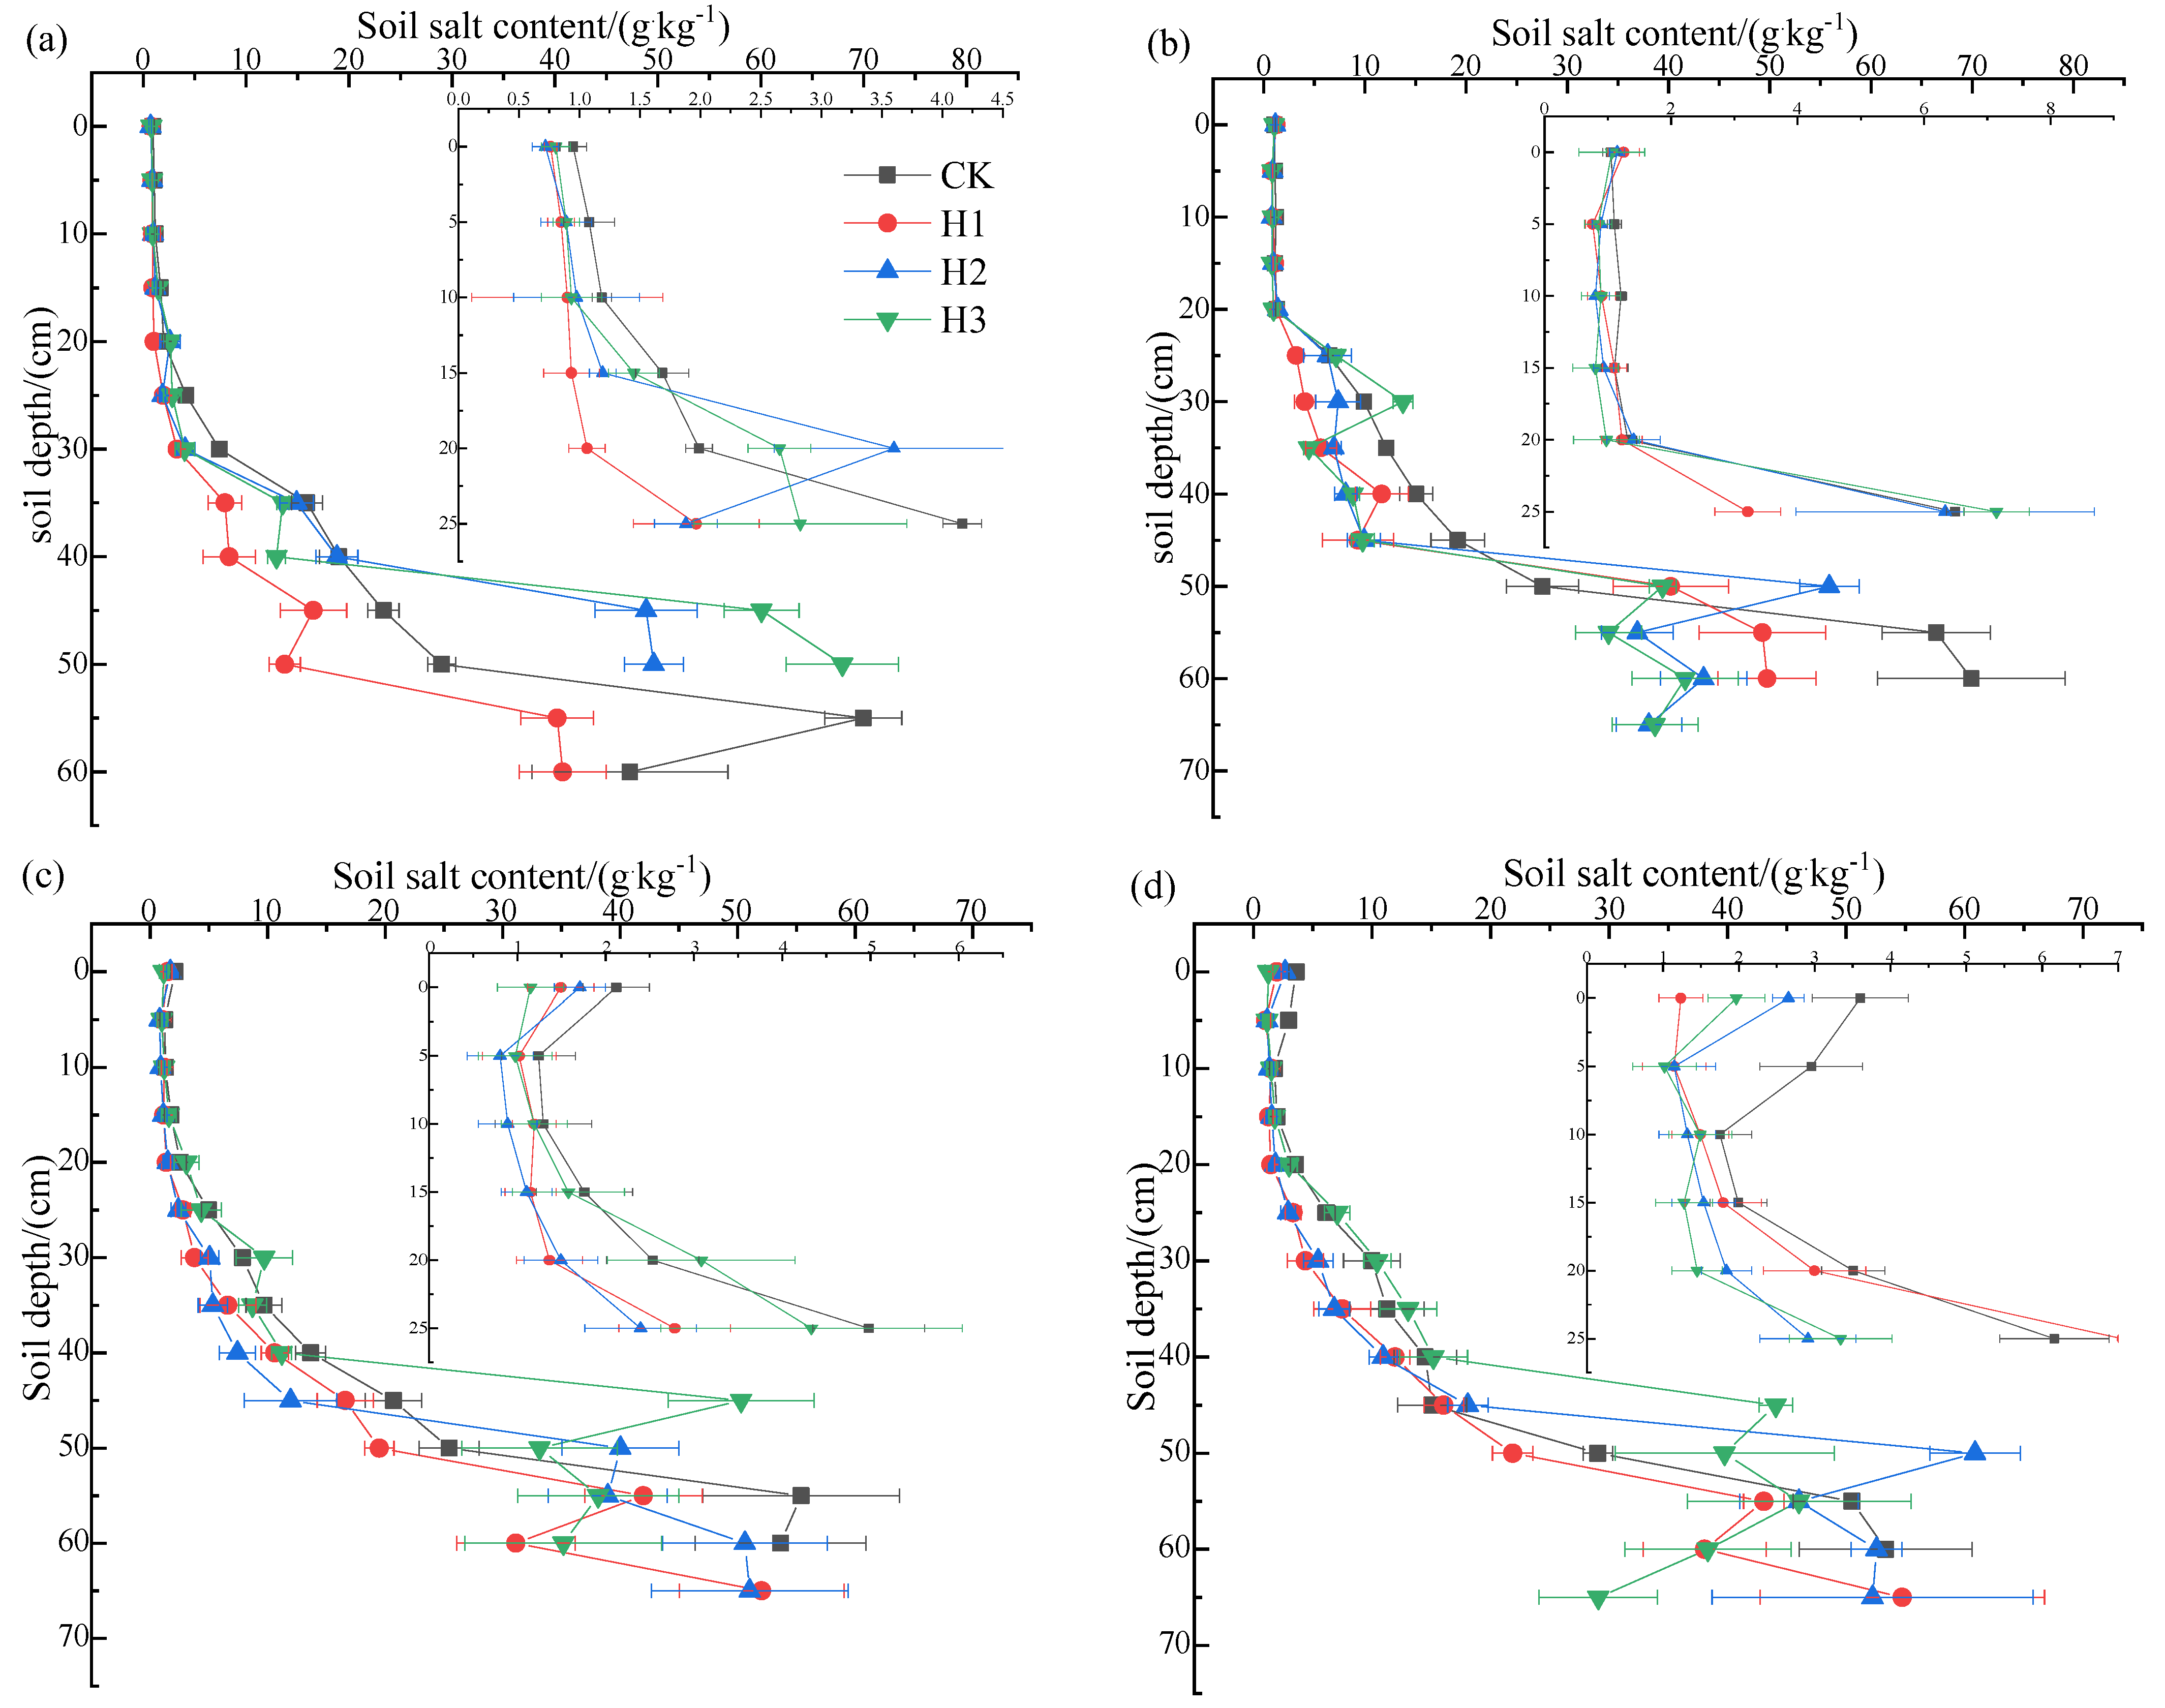
3.3. Effect of the Biochar Interlayer on the Salt Content of the Soil Profile
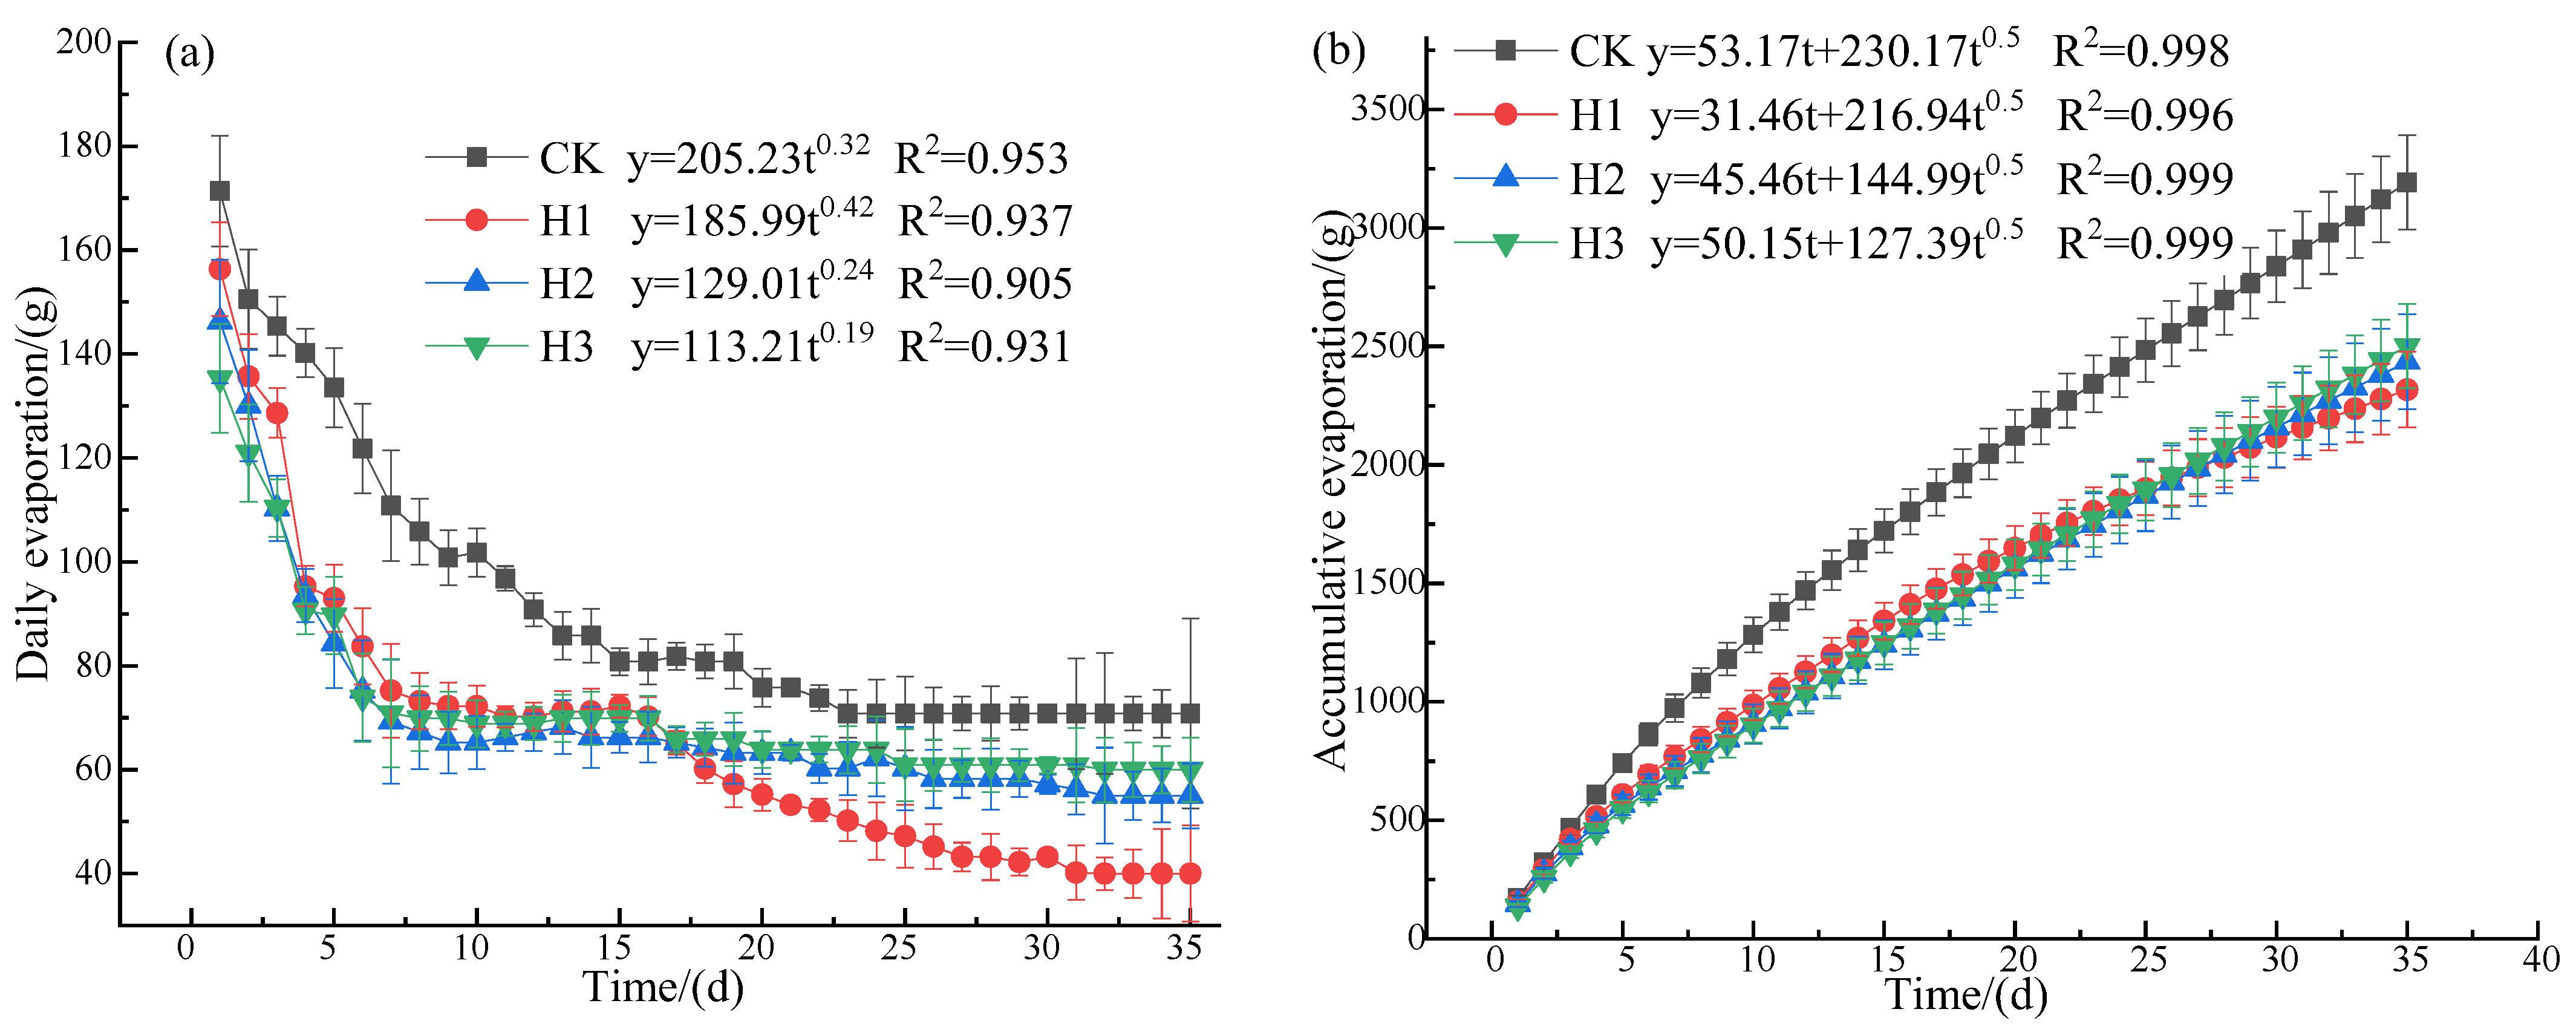
3.4. Effect of the Biochar Interlayer on Evaporation Intensity and Cumulative Evaporation
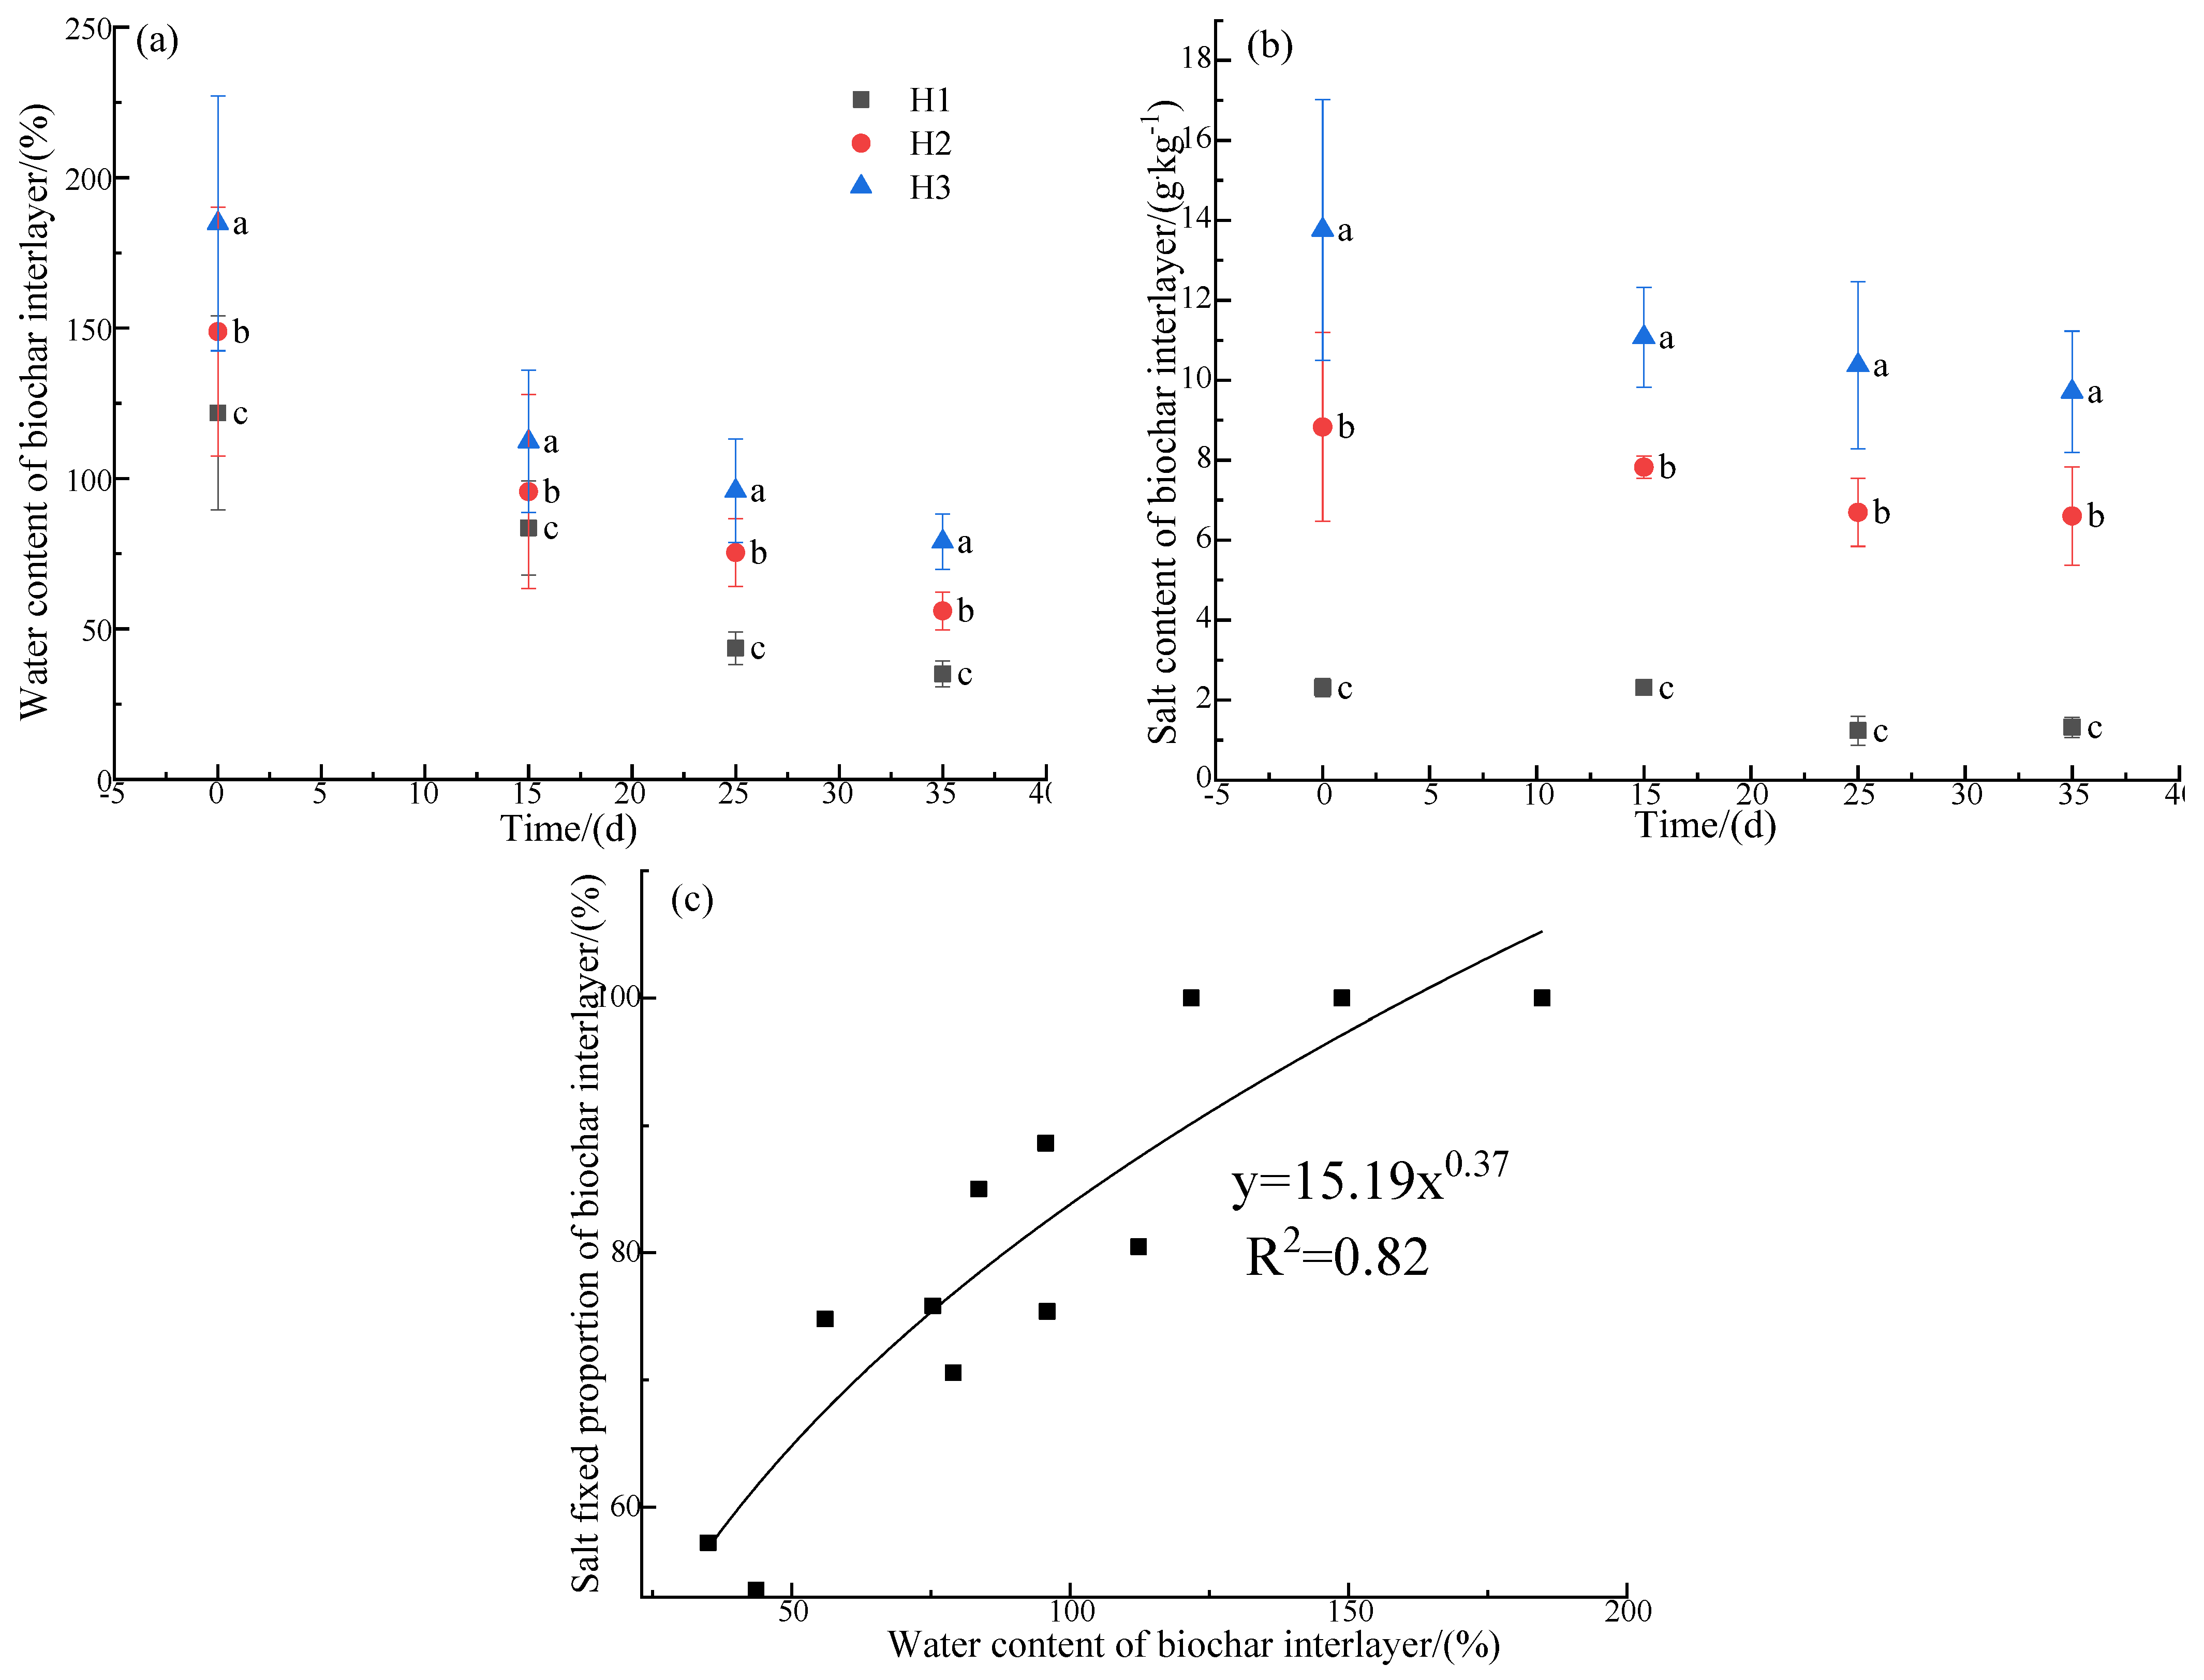
3.5. Changes in Water and Salt Content in the Biochar Interlayer
4. Discussion
4.1. Effect of the Biochar Interlayer on Infiltration Characteristics
4.2. Effect of the Biochar Barrier on Water and Salt Contents of the Soil Profile
4.3. Changes in Water and Salt Contents of the Biochar Interlayer
5. Conclusions
- (1)
- The biochar barrier decreased the soil water infiltration capacity.
- (2)
- The biochar interlayer optimized the distribution of soil water and salt.
- (3)
- The biochar interlayer inhibited soil water evaporation.
- (4)
- The biochar barrier played a role in long-term water storage and salt adsorption.
Author Contributions
Funding
Institutional Review Board Statement
Informed Consent Statement
Data Availability Statement
Acknowledgments
Conflicts of Interest
References
- Hu, M.F.; Tian, C.Y.; Zhao, Z.Y.; Wang, L.X. Salinization causes and research progress of technologies improving saline-alkali soil in Xinjiang. J. Northwest A F Univ. Nat. Sci. Ed. 2012, 40, 111–117. [Google Scholar]
- Wang, R.; Yang, F.; Xu, L.; Liu, Z.; Zhang, X.; Wang, H.; Li, X. The effects of biochar application in the cotton fields of Kashgar Oasis Xinjiang Uygur autonomous region, China. Earth Environ. 2014, 42, 757–763. [Google Scholar]
- Pang, H.C.; Li, Y.Y.; Yang, J.S.; Liang, Y.S. Effect of brackish water irrigation and straw mulching on soil salinity and crop yields under monsoonal climatic conditions. Agric. Water Manag. 2010, 97, 1971–1977. [Google Scholar] [CrossRef]
- Liu, T.; Cao, Y.; Zhang, Y.; Wang, R.; Xiao, H.; Wang, B.; Si, L. Soil environment and growth adaptation strategies of Amorpha fruticosa as affected by mulching in a moderately saline wasteland. Land Degrad. Dev. 2020, 31, 2672–2683. [Google Scholar] [CrossRef]
- Liu, T.; Wang, B.; Xiao, H.; Wang, R.; Yang, B.; Cao, Q.; Cao, Y. Differentially improved soil microenvironment and seedling growth of Amorpha fruticosa by plastic, sand and straw mulching in a saline wasteland in northwest China. Ecol. Eng. 2018, 122, 126–134. [Google Scholar] [CrossRef]
- Zhao, Y.; Li, Y.; Hu, X.; Wang, J.; Pang, H. Effects of plastic mulching and deep burial of straw on dynamics of soil water and salt in micro-plot field cultivation. Acta Pedologica Sinica 2013, 50, 1129–1137. [Google Scholar]
- Zhao, Y.; Wang, J.; Li, Y.; Pang, H. Reducing evaporation from phreatic water and soil resalinization by using straw interlayer and plastic mulch. Trans. Chin. Soc. Agric. Eng. 2013, 29, 109–117. [Google Scholar]
- Chen, L.; Yang, X.; Zhai, D.; Song, N.; Yang, M.; Hou, J. Effects of mulching with Caragana powder and plastic film on soil water and maize yield. Trans. Chin. Soc. Agric. Eng. 2015, 31, 108–116. [Google Scholar]
- Li, Q.; Liu, J.; Zhang, L.; Qin, C.; Yu, J.; Surya, N.A. Using water-retaining agent and mulch to improve growth and yield of potato under dry farming. Trans. Chin. Soc. Agric. Eng. 2013, 29, 83–90. [Google Scholar]
- Lin, W. Influence of Plastic Mulch and Straw Mulch on Soil Reservoir and Crop Yield on the Loess Plateau. Ph.D. Thesis, Research Center for Water and Soil Conservation and Ecological Environment, Ministry of Education, Chinese Academy of Sciences, Beijing, China, 2017. [Google Scholar]
- Lu, C.; Zhang, H.; Liu, N.; Zhang, X.; Pang, H.; Li, Y. Increasing soil organic carbon in aggregates and microflora diversity in moderate salt-affected soils through no till combined with plastic film mulching. Trans. Chin. Soc. Agric. Eng. 2019, 35, 116–124. [Google Scholar]
- Zhou, S.S. Processes of Transpiration and Field Evapotranspiration in a Rainfed Maize Field and Their Responses to Plastic Film Mulching on the Loess Tableland. Ph.D. Thesis, Northwest Agricultural and Forestry University, Xi’an, China, 2018. [Google Scholar]
- Ding, F.; Lv, J.; Liu, Q.; Guo, Y.; He, W.Q.; Wang, L.; Yan, C.R. Migration of cotton planting regions and residual pollution of mulch film in China. J. Huazhong Agric. Univ. 2021, 40, 60–67. [Google Scholar]
- Zhang, J.Z.; Wang, Z.H.; Hudan, T. Influence of straw mulching on soil water/salt movement and cotton root distribution under drip irrigation. Chin. J. Eco-Agric. 2013, 21, 1467–1476. [Google Scholar] [CrossRef]
- Guo, X.P.; Yang, B.; Wang, Z.C.; Chen, S.; Liu, M.H.; Chen, R. Influence of straw interlayer on the water and salt movement of costal saline soil. J. Irrig. Drain. 2016, 35, 22–27. [Google Scholar]
- Lu, C.; Pang, H.; Zhang, H.; Zhang, J.; Zhang, H.; Li, Y. Spring irrigation combined with straw interlayer promoting soil desalination and increasing microflora diversity. Trans. Chin. Soc. Agric. Eng. 2017, 33, 87–94. [Google Scholar]
- Wang, J.; Pang, H.; Ren, T.; Li, Y.; Zhao, Y. Effect of plastic film mulching and straw buried on soil water-salt dynamic in Hetao plain. Trans. Chin. Soc. Agric. Eng. 2012, 28, 52–59. [Google Scholar]
- Zhang, J.Z. Regulation Effect of Straw Mulching on Soil Water and Salt Distribution and Cotton Growth under Drip Irrigation in Arid Region. Ph.D. Thesis, Xinjiang Agricultural University, Urumqi, China, 2013. [Google Scholar]
- Chen, W.; Zhang, W.; Meng, J. Advances and prospect in research of biochar utilization in agriculture. Sci. Agric. Sin. 2013, 46, 3324–3333. [Google Scholar]
- Chen, W.; Meng, J.; Han, X.; Lan, Y.; Zhang, W. Past, present, and future of biochar. Biochar 2019, 1, 75–87. [Google Scholar] [CrossRef] [Green Version]
- Mavi, M.S.; Marschner, P.; Chittleborough, D.J.; Cox, J.W.; Sanderman, J. Salinity and sodicity affect soil respiration and dissolved organic matter dynamics differentially in soils varying in texture. Soil Biol. Biochem. 2012, 45, 8–13. [Google Scholar] [CrossRef]
- Li, Z.; Qi, X.; Fan, X.; Wu, H.; Du, Z.; Li, P.; Lü, M. Influences of biochars on growth, yield, water use efficiency and root morphology of winter wheat. Trans. Chin. Soc. Agric. Eng. 2015, 31, 119–124. [Google Scholar]
- Qu, Z.; Hu, M.; Wang, L.; Ding, Y.; Gao, X. Effects of different improvement measures on hydrothermal carbon and Sunflower Yield in salinized soil. Trans. Chin. Soc. Agric. Mach. 2020, 51, 268–275. [Google Scholar]
- Van Zwieten, L.; Kimber, S.; Morris, S.; Chan, K.Y.; Downie, A.; Rust, J.; Joseph, S.; Cowie, A. Effects of biochar from slow pyrolysis of papermill waste on agronomic performance and soil fertility. Plant Soil 2010, 327, 235–246. [Google Scholar] [CrossRef]
- Major, J.; Rondon, M.; Molina, D.; Riha, S.J.; Lehmann, J. Maize yield and nutrition during 4 years after biochar application to a Colombian savanna oxisol. Plant Soil 2010, 333, 117–128. [Google Scholar] [CrossRef]
- Ibrahim, M.E.H.; Ali, A.Y.A.; Elsiddig, A.M.I.; Zhou, G.; Nimir, N.E.A.; Ahmad, I.; Suliman, M.S.E.; Elradi, S.B.M.; Salih, E.G.I. Biochar improved sorghum germination and seedling growth under salinity stress. Agron. J. 2020, 112, 911–920. [Google Scholar] [CrossRef]
- Cen, R.; Qu, Z.; Sun, G.; Yang, F. Effects of biochar on the physical properties and infiltration of clay loam. Res. Soil Water Conserv. 2016, 23, 284–289. [Google Scholar]
- Zhan, S.; Song, M.; Li, Z.; Ma, H. Effects of different straw biochars on soil water infiltration and evaporation. J. Soil Water Conserv. 2021, 35, 294–300. [Google Scholar]
- Zhao, Y.G. The Process and Mechanism of Water and Salt Transport of Saline Soil in Hetao Irrigation Area under the Control of “Mulch and Straw”. Ph.D. Thesis, Chinese Academy of Agricultural Sciences, Beijing, China, 2014. [Google Scholar]
- Qu, C.X.; Wang, W. Study on water storage function and mechanism of sandy interlayer in soil profile. J. Huazhong Agric. Univ. 1997, 5, 43–50. [Google Scholar]
- Zhao, Y.; Pang, H.; Wang, J.; Huo, L.; Li, Y. Effects of straw mulch and buried straw on soil moisture and salinity in relation to sunflower growth and yield. Field Crops Res. 2014, 161, 16–25. [Google Scholar] [CrossRef]
- Franzluebbers, A.J. Water infiltration and soil structure related to organic matter and its stratification with depth. Soil Tillage Res. 2002, 66, 197–205. [Google Scholar] [CrossRef]
- Chen, R.; Lin, H.; Wang, Z. Feasible evaluation of quantifying soil preferential flow in an oasis agroecosystem: A review. Trans. Chin. Soc. Agric. Eng. 2022, 38, 151–161. [Google Scholar]
- Ning, R.; Leng, Y.; He, Z.; Li, Z.; Ma, Z. Pore scale preferential flow characteristics of loess based on CT. Sci. Technol. Eng. 2022, 22, 9927–9936. [Google Scholar]
- Wang, Y.; Wei, Y.; Sun, J.; Zhang, Y. Soil water infiltration and distribution characteristics under different biochar addition amount. Trans. Chin. Soc. Agric. Eng. 2016, 32, 113–119. [Google Scholar]
- Zhang, H.; Pang, H.; Lu, C.; Liu, N.; Zhang, X.; Li, Y. Pore characteristics of straw interlayer based on computed tomography images and its influence on soil water infiltration. Trans. Chin. Soc. Agric. Eng. 2019, 35, 114–122. [Google Scholar]
- Lei, Z.D. Soil Hydrodynamics; Tsinghua University Press: Beijing, China, 1988. [Google Scholar]
- Liu, N.; Li, Y.; Cong, P.; Wang, J.; Guo, W.; Pang, H.; Zhang, L. Depth of straw incorporation significantly alters crop yield, soil organic carbon and total nitrogen in the North China Plain. Soil Tillage Res. 2021, 205, 104772. [Google Scholar] [CrossRef]
- Yao, B.; Sun, S.; Li, F.; Li, Z.; Wang, X. Using cotton straw interlayer to reduce evaporation and salt migration from groundwater to the soil surface. J. Irrig. Drain. 2021, 40, 95–102. [Google Scholar]
- Zhang, H.; Pang, H.; Zhao, Y.; Lu, C.; Liu, N.; Zhang, X.; Li, Y. Water and salt exchange flux and mechanism in a dry saline soil amended with buried straw of varying thicknesses. Geoderma 2020, 365, 114213. [Google Scholar] [CrossRef]
- Qadir, M.; Schubert, S. Degradation processes and nutrient constraints in sodic soils. Land Degrad. Dev. 2002, 13, 275–294. [Google Scholar] [CrossRef]
- Dahlawi, S.; Naeem, A.; Rengel, Z.; Naidu, R. Biochar application for the remediation of salt-affected soils: Challenges and opportunities. Sci. Total Environ. 2018, 625, 320–335. [Google Scholar]
- Huang, M.; Zhang, Z.; Zhai, Y.; Lu, P.; Zhu, C. Effect of straw biochar on soil properties and wheat production under saline water irrigation. Agronomy 2019, 9, 457. [Google Scholar] [CrossRef] [Green Version]
- Huang, M.; Zhang, Z.; Zhu, C.; Zhai, Y.; Lu, P. Effect of biochar on sweet corn and soil salinity under conjunctive irrigation with brackish water in coastal saline soil. Sci. Hortic. 2019, 250, 405–413. [Google Scholar] [CrossRef]
- Cong, H.; Yao, Z.; Zhao, L.; Meng, H.; Wang, J.; Huo, L.; Yuan, Y.; Jia, J.; Xie, T.; Wu, Y. Distribution of crop straw resources and its industrial system and utilization path in China. Trans. Chin. Soc. Agric. Eng. 2019, 35, 132–140. [Google Scholar]
- Zhong, L.; Li, G.; Chen, G.; Wang, Y.; Chen, H.; Wu, W.; Li, J.; Song, Y.; Yan, B. Research progress on the distribution characteristics of crop straws and the preparation and application of straw carbon-based fertilizers in China. J. Agric. Resour. Environ. 2022, 39, 575–585. [Google Scholar]
- Gao, M.H. Effects of straw and biochar returning on soil fertility and yield increase. Master’s Thesis, Shenyang Agricultural University, Shenyang, China, 2020. [Google Scholar]
- Liu, X.; Lu, H.; Cui, H.; Hu, Y. Field application of straw biochar and its environment risk: A review. Jiangsu Agric. Sci. 2018, 46, 28–35. [Google Scholar]
- Hu, Y.; Shi, X.; Li, Y.; Shao, G.; Meng, X.; Sun, Y.; Zhang, Q. Effect of straw deep returning on soil and no-tillage mulch on soil-borne disease, pests and yield of maize. Heilongjiang Agric. Sci. 2019, 5, 60–63. [Google Scholar]


| Texture | Soil Bulk Density /g·cm−3 | Field Water Holding Capacity/% | Salt Content /g·kg−1 | Organic Carbon /g·kg−1 | Total N /g·kg−1 | Total P /g·kg−1 | K /g·kg−1 | Ca /g·kg−1 | Mg /g·kg−1 |
|---|---|---|---|---|---|---|---|---|---|
| Silty loam | 1.40 | 26.46 | 26.56 | 4.63 | 0.39 | 0.75 | 12.35 | 6.28 | 4.51 |
| Biochar | 0.51 | — | 3.36 | 521.69 | 25.72 | 11.02 | 20.58 | 19.63 | 4.26 |
Disclaimer/Publisher’s Note: The statements, opinions and data contained in all publications are solely those of the individual author(s) and contributor(s) and not of MDPI and/or the editor(s). MDPI and/or the editor(s) disclaim responsibility for any injury to people or property resulting from any ideas, methods, instructions or products referred to in the content. |
© 2023 by the authors. Licensee MDPI, Basel, Switzerland. This article is an open access article distributed under the terms and conditions of the Creative Commons Attribution (CC BY) license (https://creativecommons.org/licenses/by/4.0/).
Share and Cite
Xu, Q.; Liu, H.; Li, M.; Li, P. The Presence of the Biochar Interlayer Effectively Inhibits Soil Water Evaporation and Salt Migration to the Soil Surface. Agriculture 2023, 13, 638. https://doi.org/10.3390/agriculture13030638
Xu Q, Liu H, Li M, Li P. The Presence of the Biochar Interlayer Effectively Inhibits Soil Water Evaporation and Salt Migration to the Soil Surface. Agriculture. 2023; 13(3):638. https://doi.org/10.3390/agriculture13030638
Chicago/Turabian StyleXu, Qiang, Hongguang Liu, Mingsi Li, and Pengfei Li. 2023. "The Presence of the Biochar Interlayer Effectively Inhibits Soil Water Evaporation and Salt Migration to the Soil Surface" Agriculture 13, no. 3: 638. https://doi.org/10.3390/agriculture13030638