Article

Differences in CO2 Emissions on a Bare-Drained Peat Area in Sarawak, Malaysia, Based on Different Measurement Techniques

1
Malaysian Palm Oil Board, No. 6, Persiaran Institusi Bandar Baru Bangi, Kajang 43000, Selangor, Malaysia
2
Environmental Technology Division, School of Industrial Technology, Universiti Sains Malaysia, Penang 11800, Malaysia
3
Independent Researcher, Bangi 43000, Selangor, Malaysia
4
Universiti Malaysia Perlis, Sg. Chuchuh, Arau, Jalan Wang Ulu, Kangar 01000, Perlis, Malaysia
5
Renewable Biomass Transformation Cluster, School of Industrial Technology, Universiti Sains Malaysia, Penang 11800, Malaysia
*
Author to whom correspondence should be addressed.
Agriculture 2023, 13(3), 622; https://doi.org/10.3390/agriculture13030622
Submission received: 9 December 2022 / Revised: 26 February 2023 / Accepted: 1 March 2023 / Published: 5 March 2023
(This article belongs to the Special Issue Ecological Monitoring and Restoration of Agricultural Environment)

Abstract

:
The drainage and cultivation of peatlands will lead to subsidence and mineralisation of organic matter, increasing carbon (C) loss as more CO2 is emitted. There is little information about carbon emissions from bare peat soil. A study was undertaken to measure the CO2 emissions from a logged-over peat swamp area that was purposely vegetation-free. We aimed to report CO2 emissions from a bare, drained peatland developed for an oil palm plantation. For 12 months, we used eddy covariance (EC), closed chambers, and soil subsidence measurements to derive CO2 emissions from a logged-over peat swamp area. Significant variations in the estimated soil CO2 efflux were observed in the three tested measurement techniques. The average CO2 flux rate measured by the EC technique was 4.94 ± 0.12 µmol CO2 m−2 s−1 (or 68.55 tonnes CO2 ha−1 year−1). Meanwhile, the soil CO2 efflux rate measured by the closed chamber technique was 4.19 ± 0.22 µmol CO2 m−2 s−1 (or 58.14 tonnes CO2 ha−1 year−1). Subsidence amounted to 1.9 cm year−1, corresponding to 36.12 tonnes CO2 ha−1 year−1. The estimation of the C loss was found to be highest by the EC technique, lower by the soil chamber technique, and lowest by the peat subsidence rate technique. The higher CO2 emission rate observed in the EC technique could be attributed to soil microbial respiration and decomposing woody residues in the nearby stacking rows due to the large EC footprint. It could also be affected by CO2 advection from oil palms adjacent to the study site. Despite the large differences in the CO2 emission rates by the different techniques, this study provides valuable information on the soil heterotrophic respiration of deep peat in Sarawak. Carbon emissions from a bare peat area cover only a fraction of the soil CO2 respiration component, i.e., the soil heterotrophic respiration. Further investigations are needed to determine the CO2 emissions by soil microbial activities and plant roots from other peat areas in Sarawak.

1. Introduction

Malaysia has 2,426,600 hectares (ha) of tropical peatland, and approximately 65% or 1,588,142 ha of it is in Sarawak. The remaining areas are peninsular Malaysia: 716,944 ha, and Sabah: 121,514 ha [1]. Wahid et al. [1] reported that the total peatland area planted with oil palm in Malaysia was 666,038 ha, with 37.45% located in Sarawak.
Tropical peatland is known for its unique ecosystem and is vital in storing large amounts of carbon. The conversion of tropical peatland into cultivation area leads to carbon emissions when the peat is drained [2,3,4]. Carbon loss and greenhouse gas (GHG) emissions from tropical peatlands are a major concern since they contribute to climate change.
There has been much debate on the magnitude of drainage-induced carbon fluxes of tropical peatlands [5,6]. It is known that the development of oil palm plantations on tropical peatlands with a water table of 60 cm requires drainage to a level below the peat surface [7,8]. Drainage in peatlands raises soil oxygen levels, accelerating decomposition and leading to increased respiration and elevated GHG emissions [9]. The process of drainage and cultivation of peat soils will also lead to peat subsidence [10,11], partly due to consolidation and compaction.
Soil respiration represents the second-largest carbon flux between the atmosphere and terrestrial ecosystems. Components of soil respiration consist of autotrophic and heterotrophic respirations [12]. Autotrophic respiration is the metabolic respiration of live roots associated with mycorrhiza and symbiotic N-fixing nodules. Heterotrophic respiration is caused by the microbial decomposition of root exudates in the rhizosphere above and below the ground in the litter and soil organic matter [12].
There is less information on soil heterotrophic respiration in tropical peatlands. Various methods exist to assess CO2 fluxes from peat soils. The most common methods are the eddy covariance technique [6,13,14], closed-chamber measurements [15,16,17], and subsidence-based assessments [11,18]. Here, we present results on CO2 emissions measured using the three methods on soil with heterotrophic respiration in a bare, drained tropical peatland.
There is relatively little information regarding the carbon flux measurements from drained tropical peatlands that are kept free of vegetation, particularly in Malaysia. Thus, this study was undertaken to measure CO2 emissions. The bare, drained peatland chosen for this study was earmarked for an oil palm plantation. Thus, the results reveal CO2 emissions of the soil heterotrophic respiration.

2. Materials and Methods

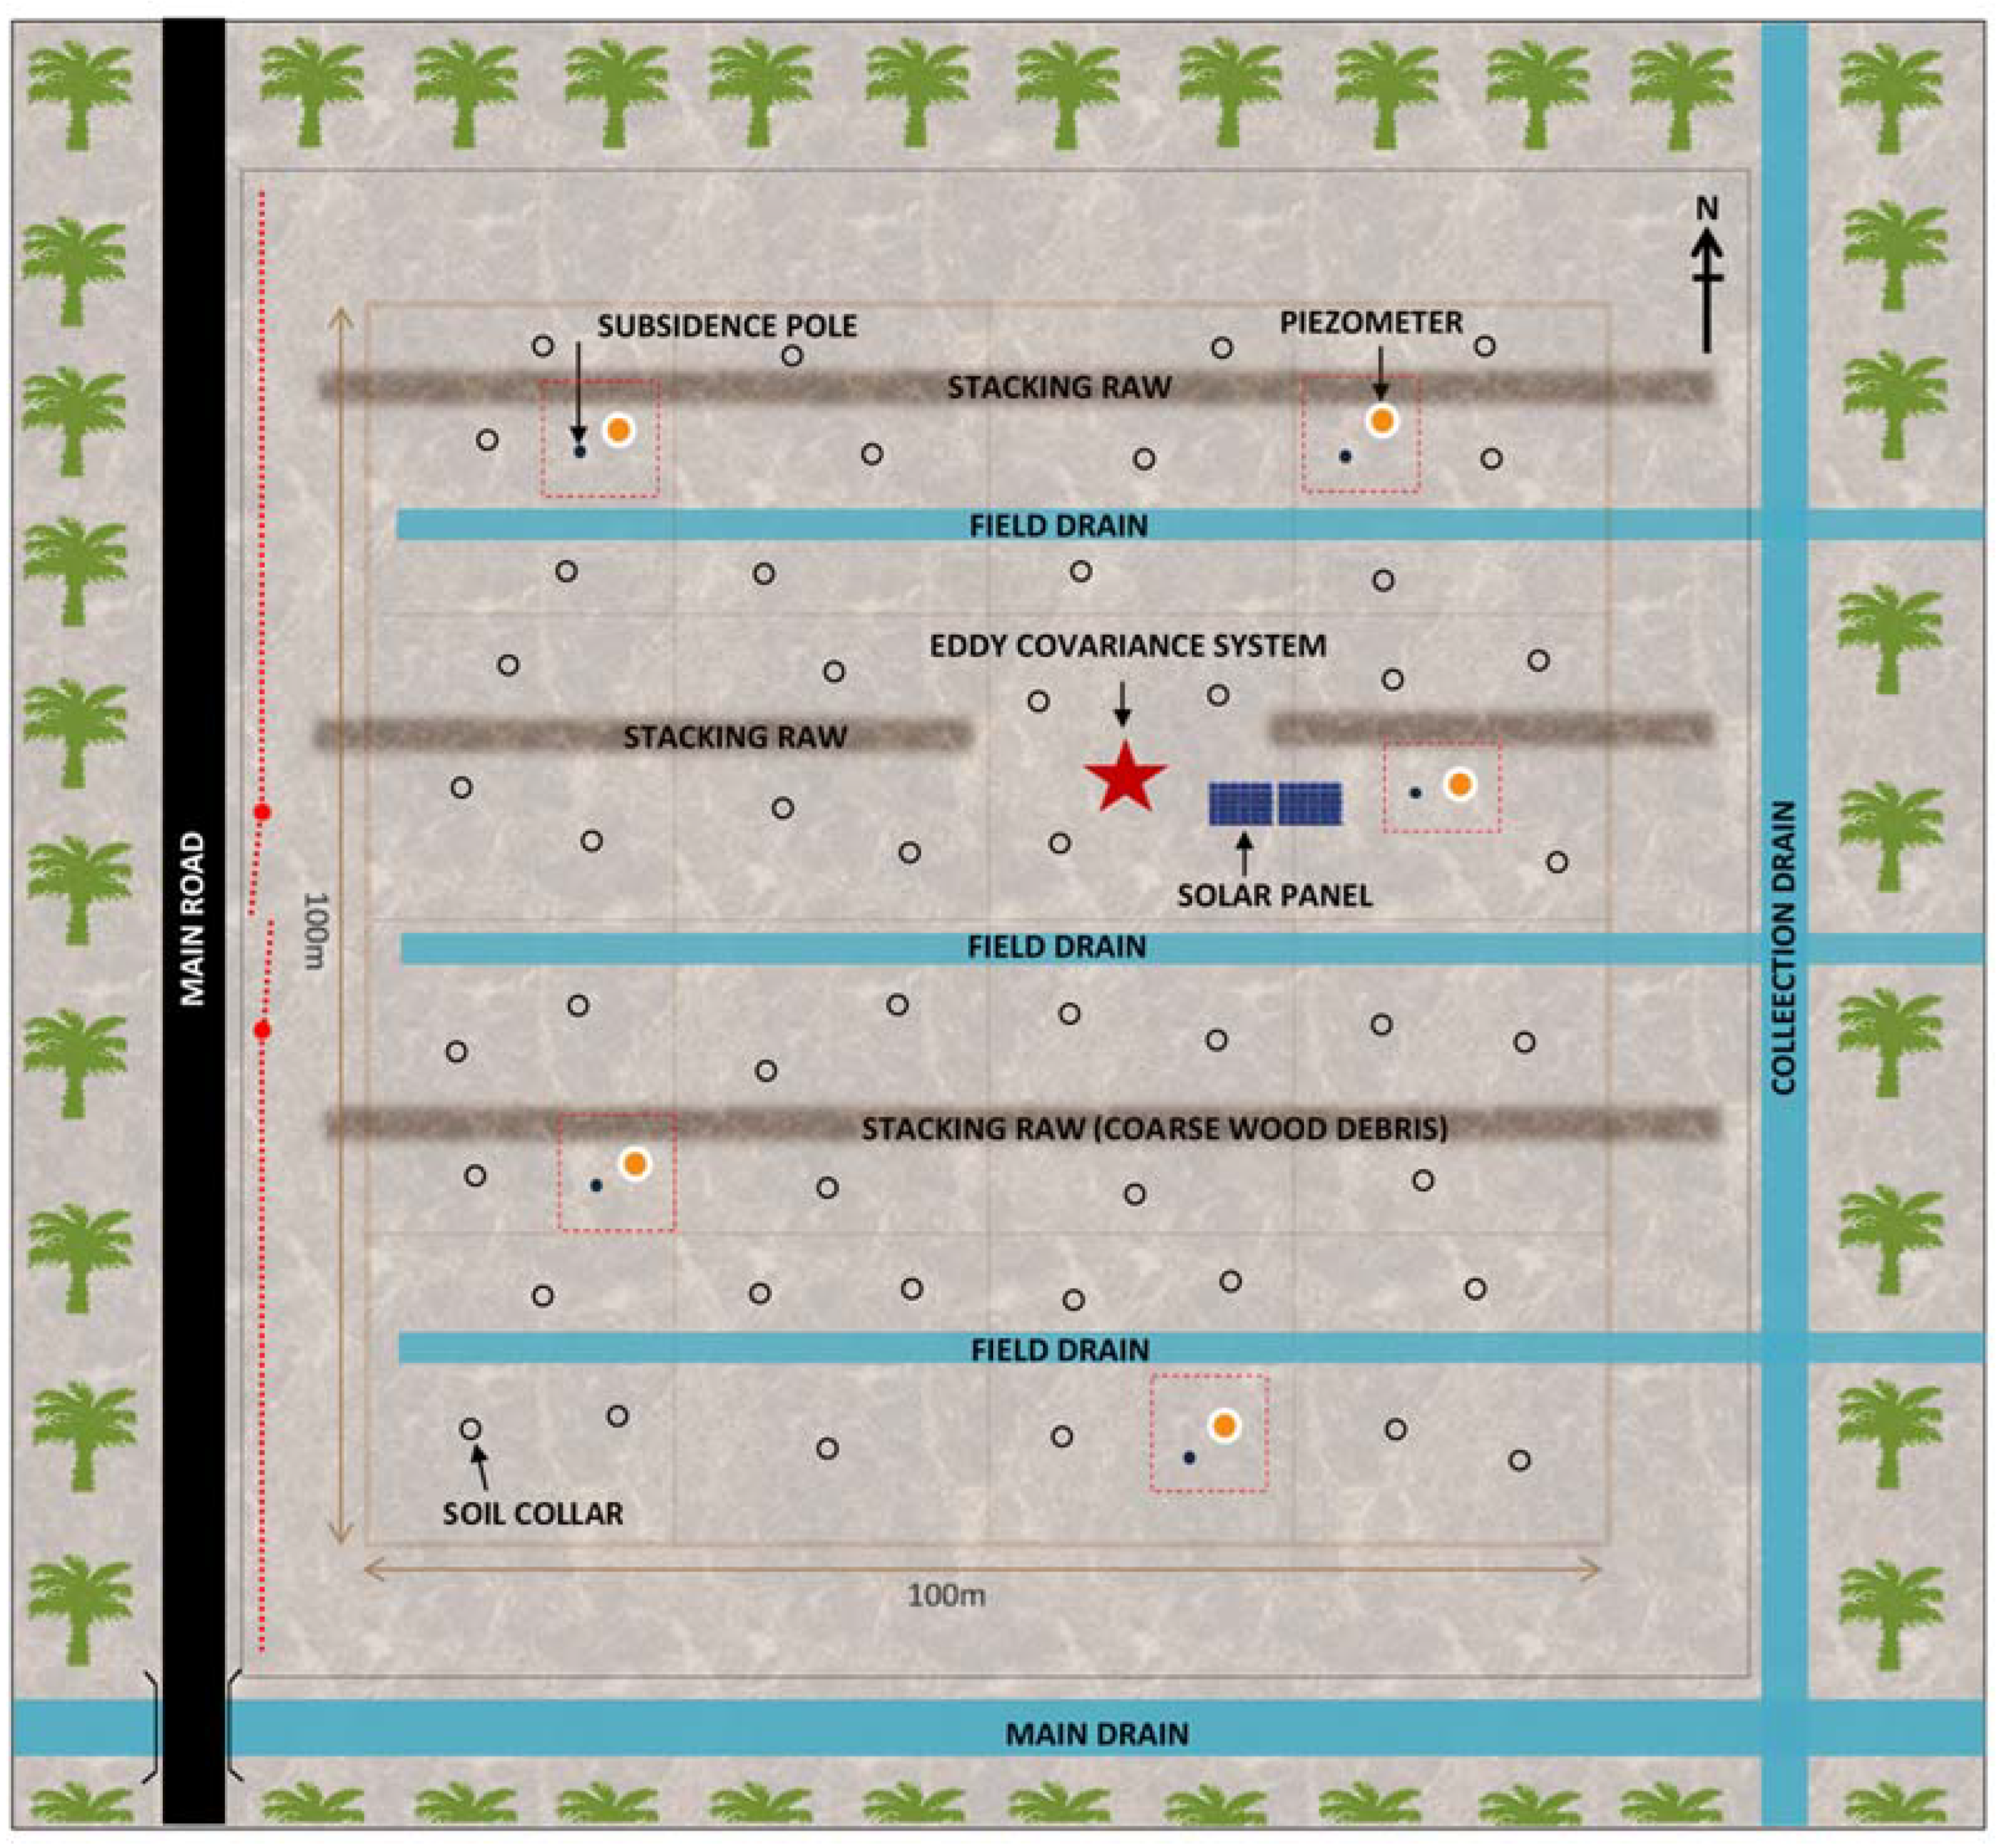
2.1. Site Description

The study site was identified as a newly logged-over secondary peat area located at an oil palm estate near Sibu, Sarawak (111°58′04.891″ E, 02°33′58.800″ N). The area development for oil palm cultivation started in 2009, and the actual oil palm planting was carried out in 2010.
The measurement campaign was conducted from January 2011 to December 2011. A one-hectare area was kept vegetation-free by occasionally spraying herbicide when necessary, and weeds were removed manually. Land preparation was performed according to the standard estate practices, which consisted of compaction, stacking of woody biomass residues between planting rows, and water draining to a depth of 60 cm from the surface through collection drains. The instrument layout within the one-hectare plot is illustrated in Figure 1.
The peat was classified as the Anderson 3 (Records of Soils Division, Department of Agriculture, Sarawak) and the Kenyana Series peat, a very deep peat phase consisting of sapric materials with undecomposed wood within the 100 cm depth [19]. On the Sub-Group level, the soil was classified as TypicHaplosaprist [20] and Sapric-Ombrogambists [21].
The peat depth ranged from 6 to 8 m, measured using a peat depth rod. The site has a flat topography with gentle slopes, consisting of 0 to 4% levels; the elevation in the area was less than 5 m [21].

2.2. The Water Table

The water table depth below the peat surface was monitored using five automatic water level recorders (Cera-Diver, Van Essen Instruments, Delft, Netherlands, and STS Sensor Datalogger DL/N 70, Sinarch, Switzerland). The divers were installed in an open-ended piezometer made from perforated 10 cm diameter polyvinyl chloride (PVC) pipes installed near the subsidence poles. The piezometer was inserted into the peat to the 160 cm depth, with 40 cm of the device remaining above the peat surface. The automatic water level recorders recorded the field water table at hourly intervals, and the data were downloaded bi-weekly.

2.3. The Eddy Covariance Technique

In this study, the EC instruments for measuring atmospheric CO2 fluxes were installed on a telescopic mast tower at 1.70 m above the peat surface. The EC system consisted of a CSAT-3 sonic anemometer (Campbell Scientific Inc., Logan, UT, USA) and an LI-7500 open-path infrared gas analyser (LI-COR Inc., Lincoln, NE, USA). It was oriented towards the prevailing wind direction (southwest). The outputs from these sensors were logged at 10 Hz and integrated as hourly means by a data logger (CR5000, Campbell Scientific Inc.). The logger was programmed to analyse and compute the hourly fluxes of CO2, as described by Henson [22].
Data were filtered for signal spikes, and the Webb–Pearman–Leuning (WPL) correction was made to compensate for fast gas density effects on the gas flux [23]. The effect of in situ fluxes of the simultaneous transfer of sensible and latent heat was considered. The effect of the correction was to slightly increase the water vapour flux while reducing that of the CO2 [24,25].
The dataset was filtered for insufficient quality data due to rain or moisture formation on the open-path gas analyser head. Foken’s quality control procedures were implemented to identify and remove fluxes flagged as bad due to under-developed turbulence [26]. Precipitation would also affect measurement accuracy; thus, flux data coinciding with rain events were omitted. Gap-filling for the EC data was performed using the online gap-filling and flux-partitioning tool [27].
The telescopic mast was also equipped with other sensors to measure short-wave and long-wave radiations (CNR-2, Kipp & Zonen, Delft, The Netherlands), air temperature and humidity (CS500, CSI, Logan, UT, USA), and soil heat fluxes (HFP01SC, CSI, Logan, UT, USA). Two 12 VDC 150 A-hr deep-cycle batteries that were charged by three 110-W mono-crystalline solar panels gave power to the EC instruments. An automatic weather station (ET170, CSI, Logan, UT, USA) installed adjacent to the site provided additional meteorological data. The weather station measured wind speed, wind direction, air temperature, relative humidity, rainfall, and solar radiation.

2.4. The Closed Chamber Technique

Soil CO2 efflux rate was measured using the closed chamber technique. A portable CO2 analyser system (EGM-4, PP-System, Amesbury, MA, USA) consists of an IRGA connected to an opaque cylindrical soil chamber SRC-1 of a diameter of 10 cm and a height of 15 cm), equipped with a fan to homogenise pressure, CO2 gradients, and temperature. This system is a non-dispersive infrared measurement that adapts to environmental conditions and ensures the long-term stability of the CO2 signal.
The soil chamber was placed on the soil PVC collar installed a week before measurement began. These soil collars (diameter of 10 cm and height of 5 cm) were inserted into the soil to depths of 3 cm and 2 cm above the soil surface [28]. To minimise leakage, we placed a stainless-steel rim at the bottom of the soil chamber that fitted well with the soil PVC collars.
Each measurement interval was determined by a maximum increase in CO2 concentration of 50 ppm and a maximum duration of 120 s. The rate of increase in CO2 concentration with time within the chamber was then monitored. Soil CO2 efflux rate was calculated by performing linear regression on the CO2 concentration data versus time, the volume of the entire system, and the enclosed soil surface area. The measurements were performed monthly over eleven months in 16 sub-plots (25 m × 25 m) in the one-hectare study plot. At each measuring point, soil temperature was measured using the STP-1 Soil Temperature Probe attached to the EGM-4 (PP-System, Amesbury, MA, USA). Soil moisture for the volumetric water content (%) was measured using HydroSense CD620 & CS620 (CSI, Logan, UT, USA) at 5 to 10 cm depths below the peat surface. Other parameters also measured were air temperature and relative humidity near the peat surface using a handheld sensor (HM45, Vaisala, Vantaa, Finland).

2.5. Peat Subsidence

The peat surface level was measured using five subsidence poles made from 5 cm diameter acrylonitrile butadiene styrene (ABS). Each pole was inserted vertically into the peat to a depth of 9 m until it was firmly anchored in the underlying mineral substrate. The initial peat level was marked on the pole using a sharp knife. Measurements were taken at one to three-month intervals. Each subsidence pole area was fenced at 0.5 m radii to prevent any disturbances that could affect the measurement. The calculation of CO2 emission and the 60% oxidation rate estimation were determined using the formula described by Wösten et al. [11]. Although not all C loss is attributed to CO2 fluxes, a small portion may be exported as dissolved organic matter in groundwater and ditch water, which may not necessarily be transformed into CO2 or methane downstream [29,30,31].
The C loss was calculated according to Equation (1).
C = 0.54 C   content × 0.6 Oxidation   ~   60 % × S × B D
CO 2 eq   flux = C × 44 12  
where
C = Carbon [t C ha−1 yr−1]
CO 2 eq = Carbon dioxide equivalent [t CO 2 eq ha−1 yr−1]
S = Subsidence [cm−3 ha−1 yr−1]
B D = Bulk density [kg m−3]

2.6. Peat Sampling and Analysis

Peat samples, to 5 cm depths, were taken from the peat surface with three replicates for each subplot (n = 48) using a sampling ring (5 cm height × 5 cm diameter). The soil samples were randomly collected near the CO2 emission-measuring locations after the measurements were performed. The undisturbed soil volume was analysed using the Three-Phase Meter (DIK-1130, Daiki Rika Kogyo, Japan) to determine the water-filled pore space (WFPS). This step was followed by oven-drying the peat samples at 105 °C until a constant weight was achieved, and then they were weighed to determine the dry bulk density and moisture content. The soil moisture content of the peat was expressed as a percentage of the total pore space filled with water (% water-filled pore space = % WFPS). This value indicated the ratio of the volumetric moisture content (cm3 H2O cm−3) to the total soil porosity. The additional samples were analysed for total carbon (C) and nitrogen content using the dry-combustion method using a CNS-2000 elemental analyser (LECO, St. Joseph, MI, USA).

3. Results and Discussion

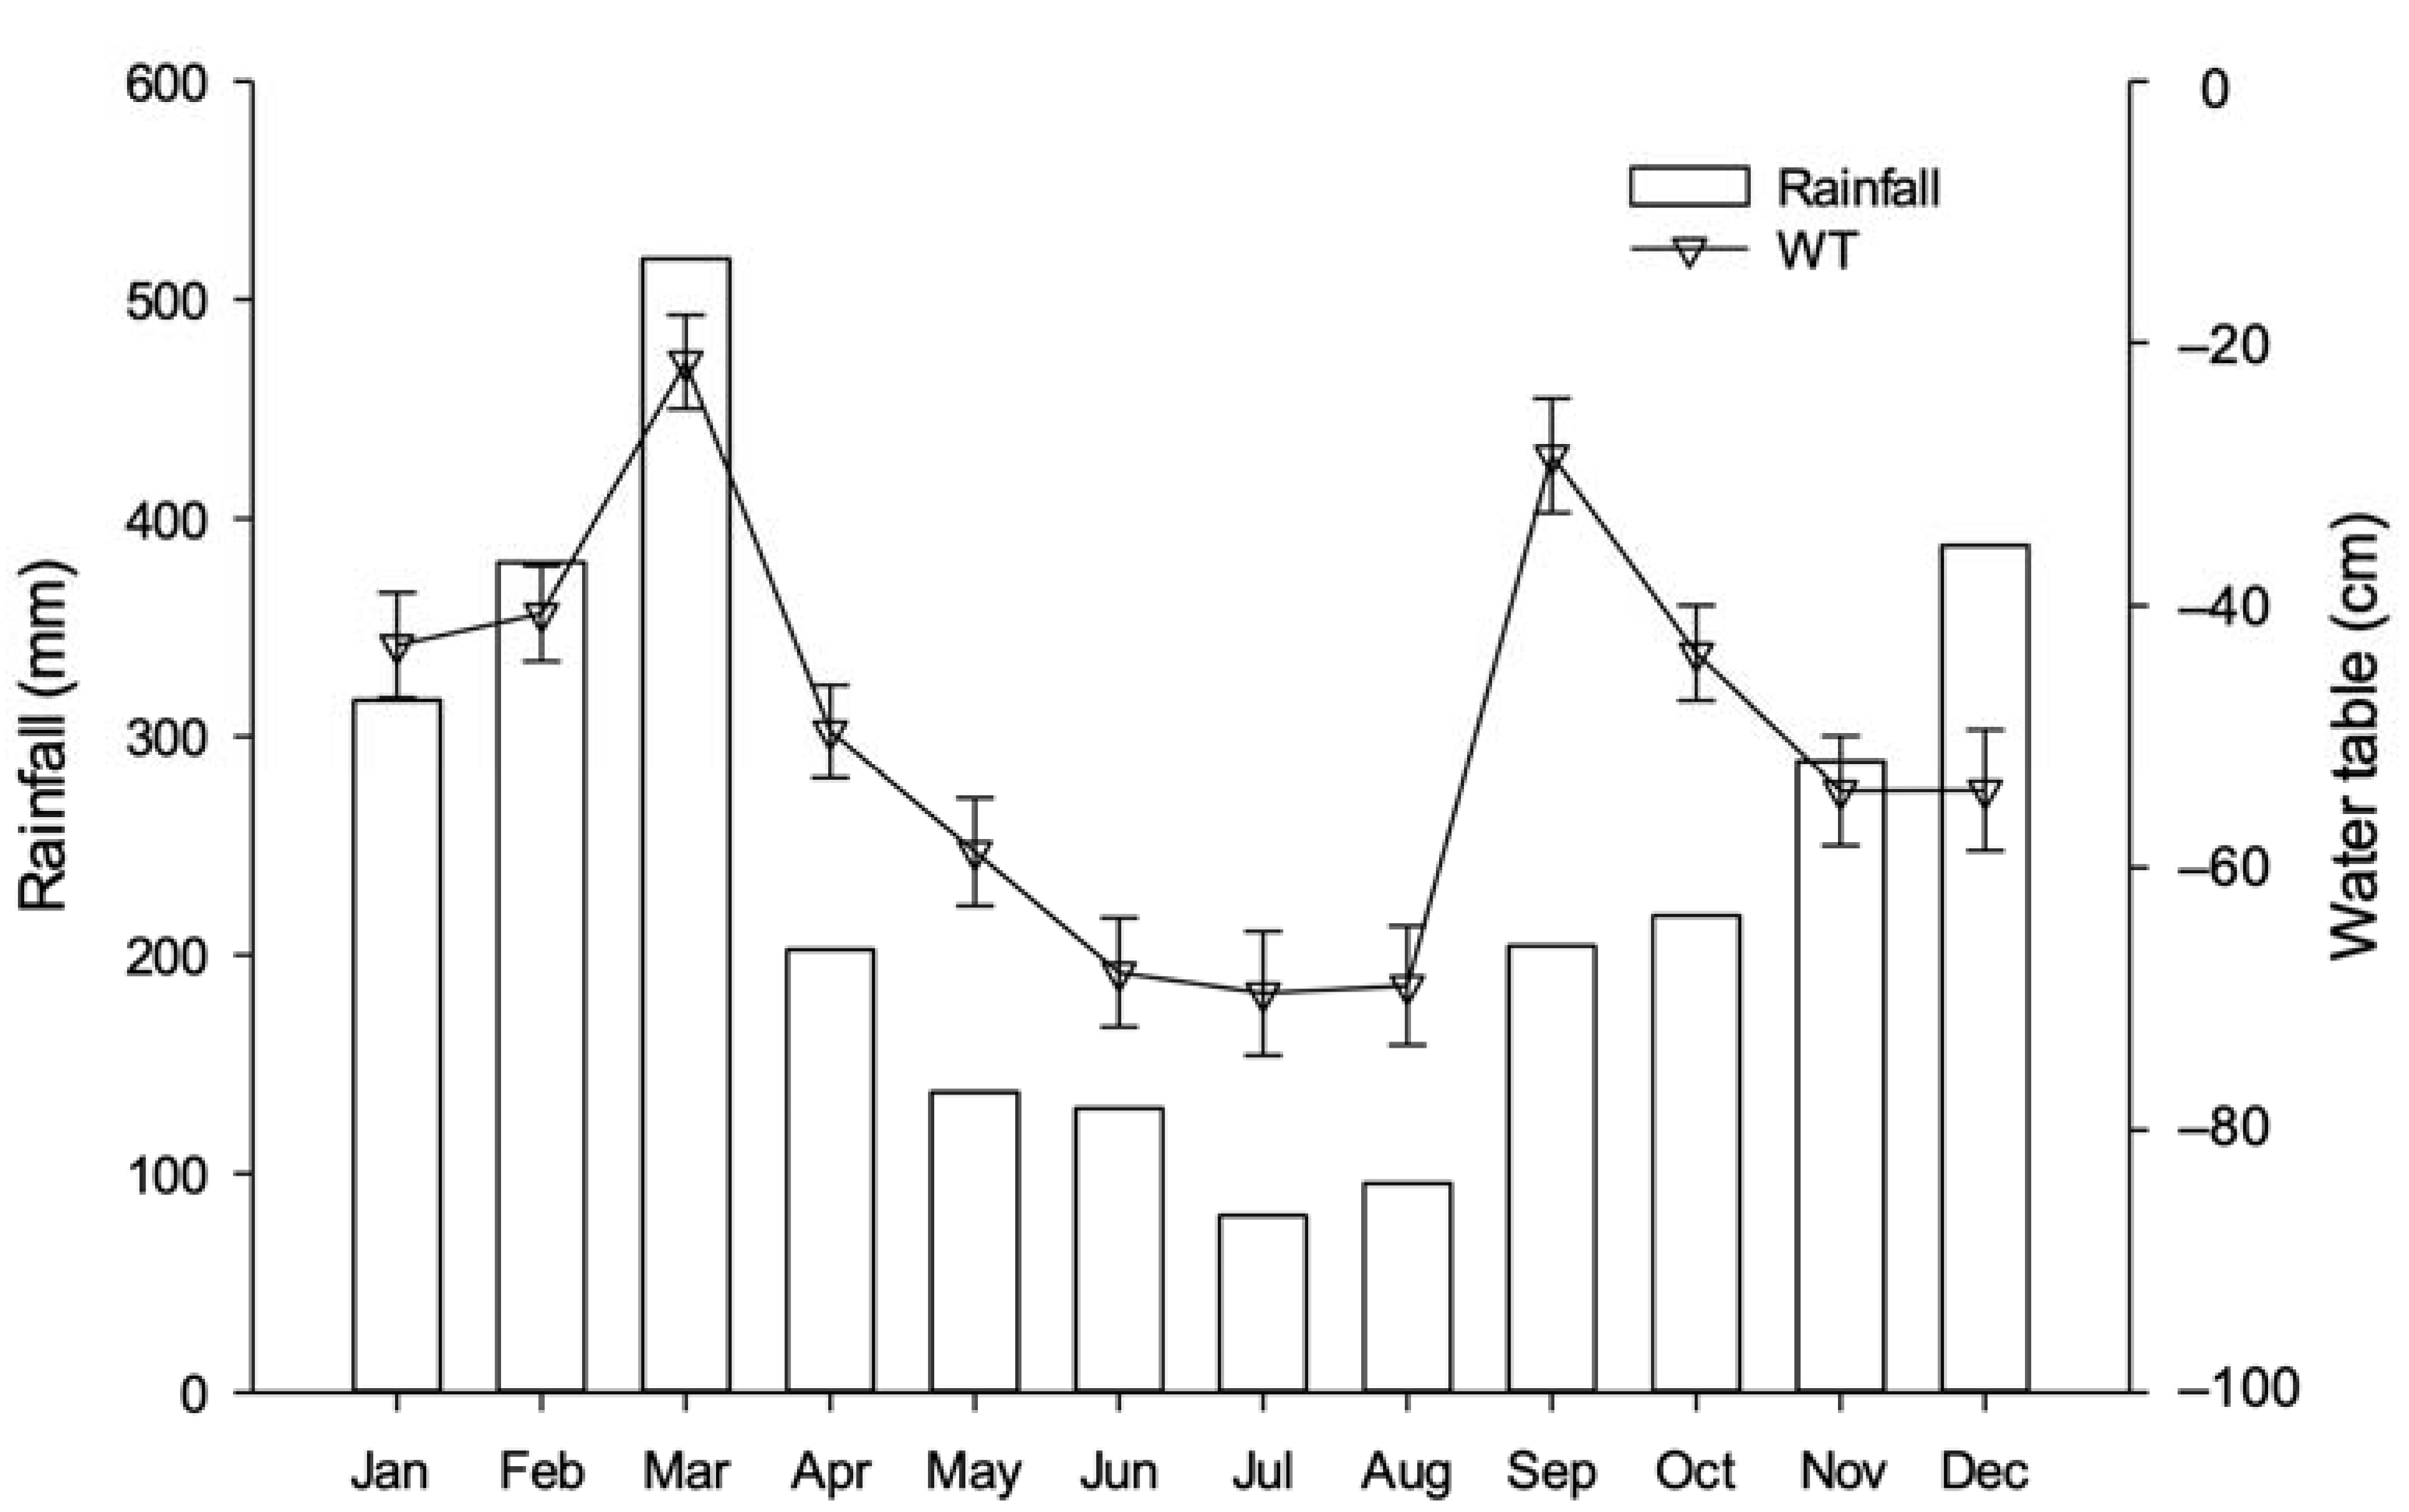
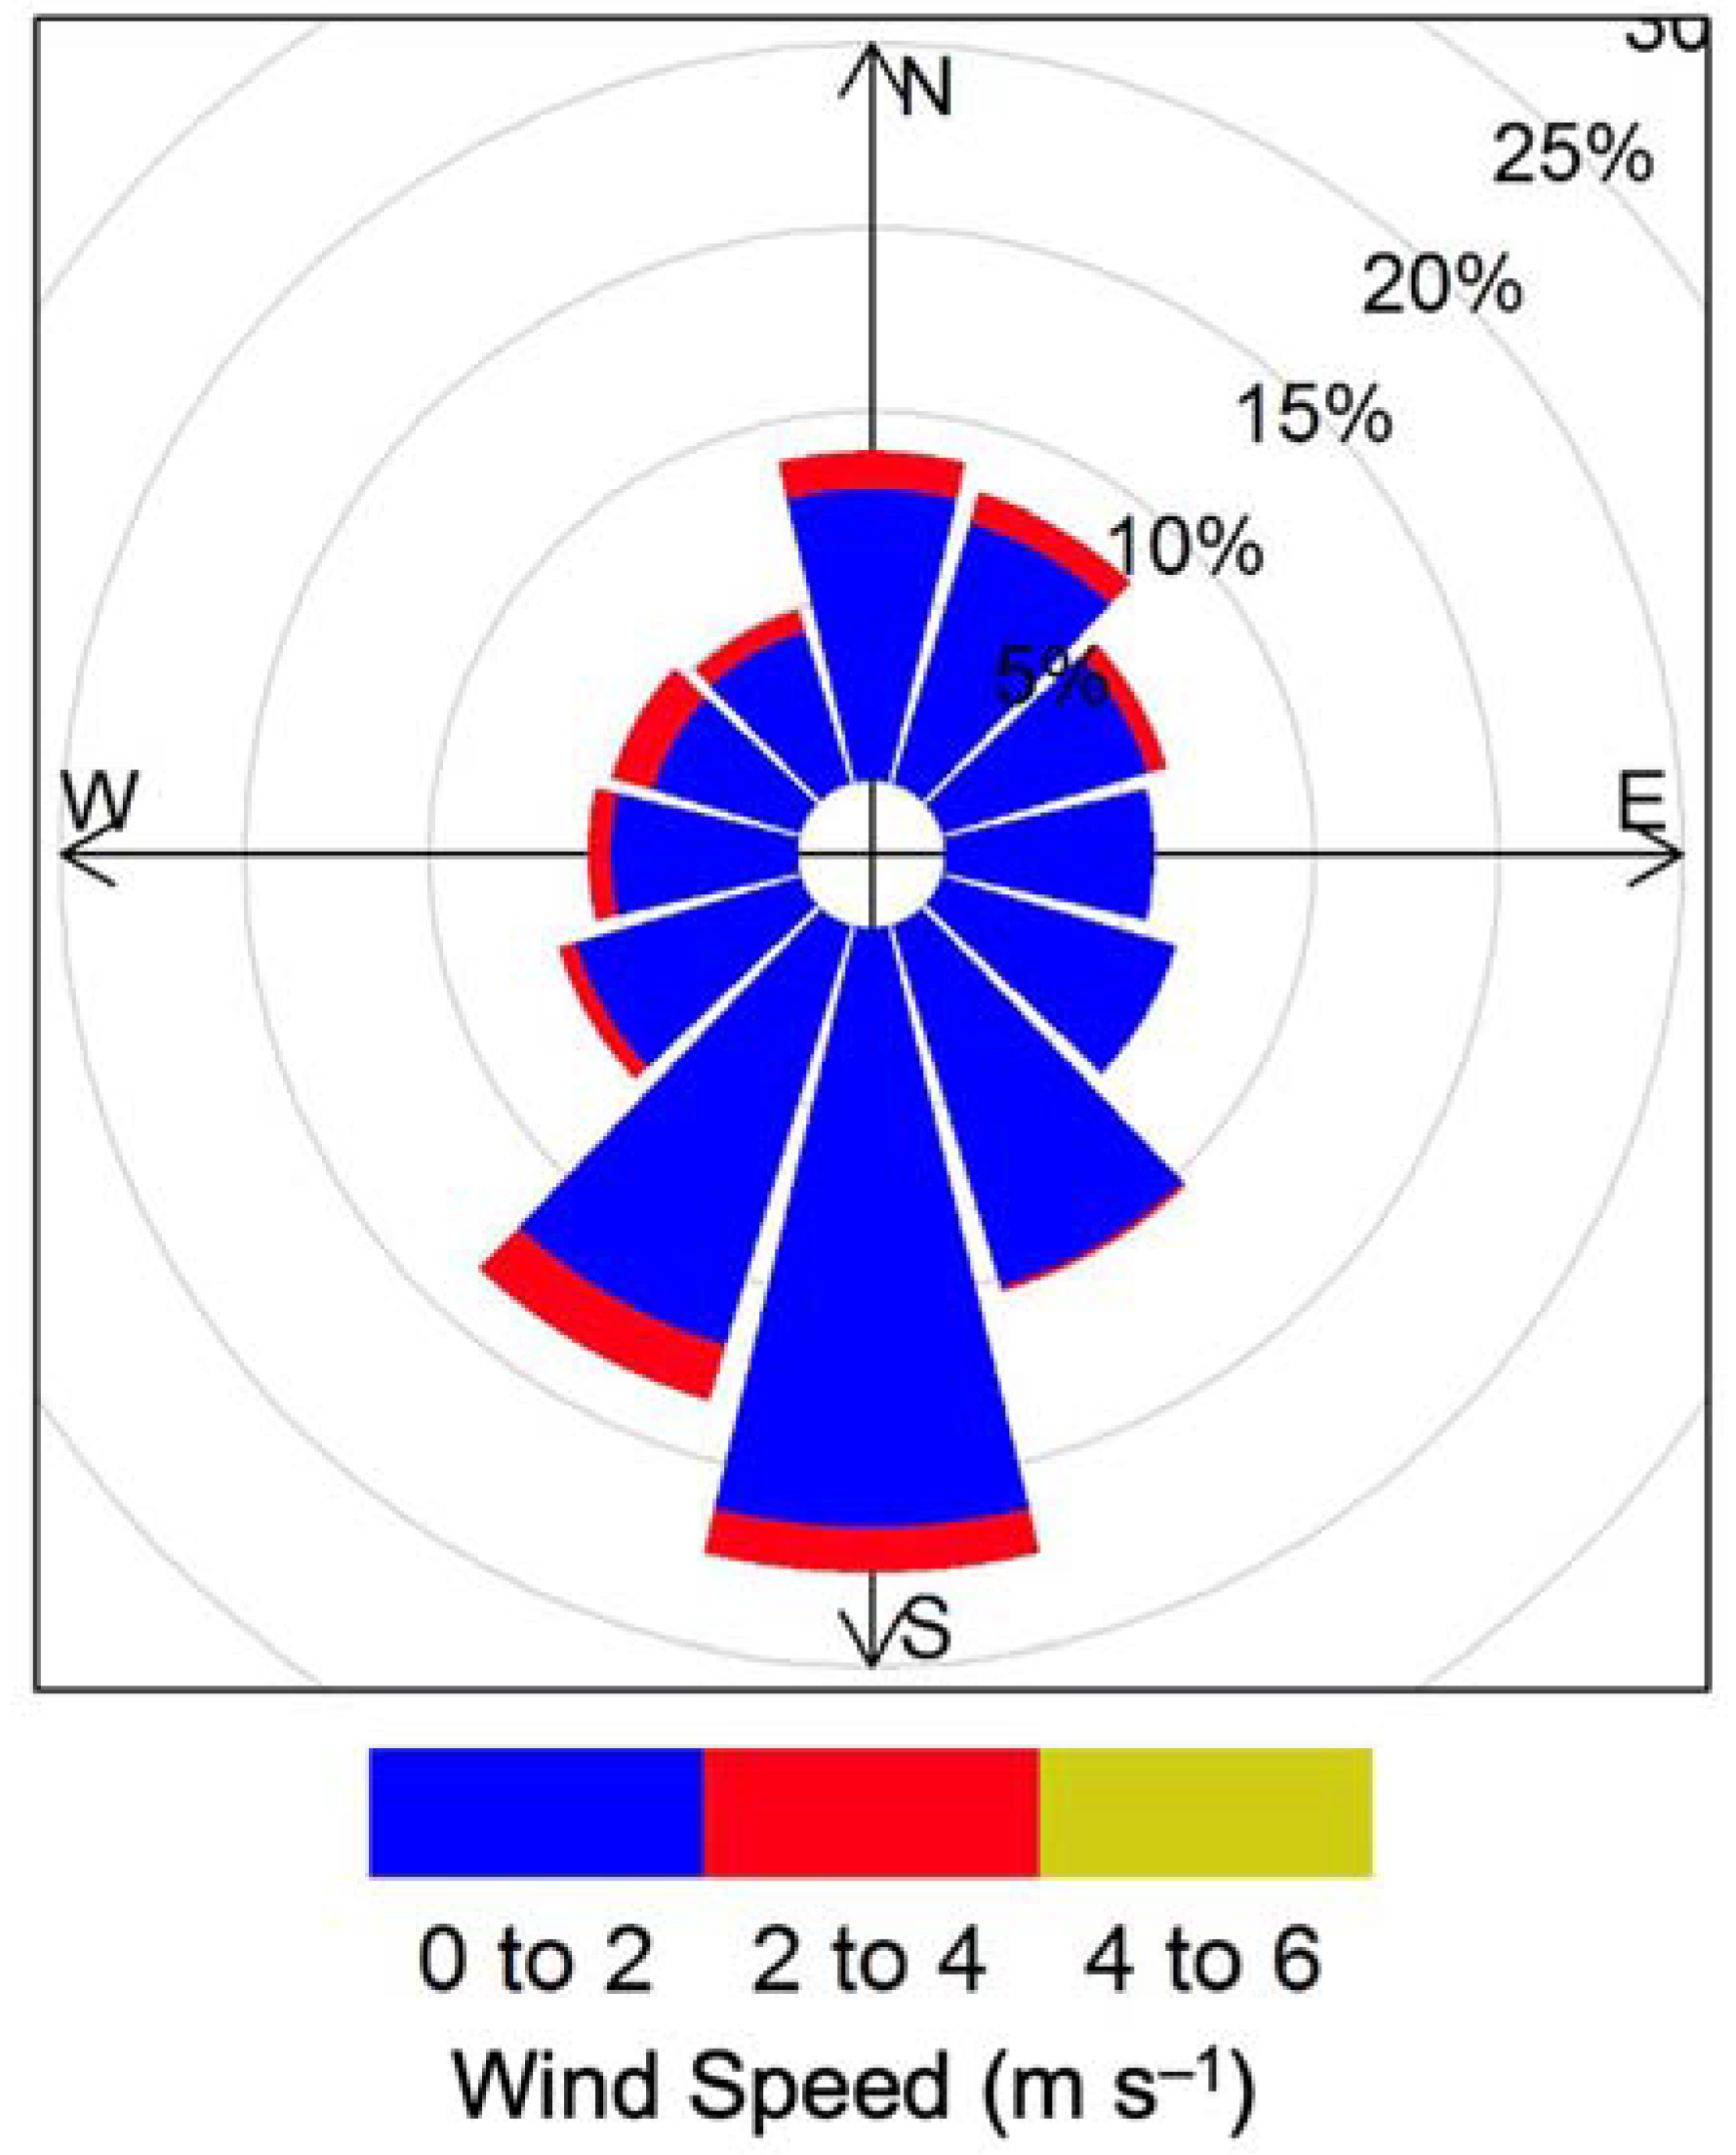
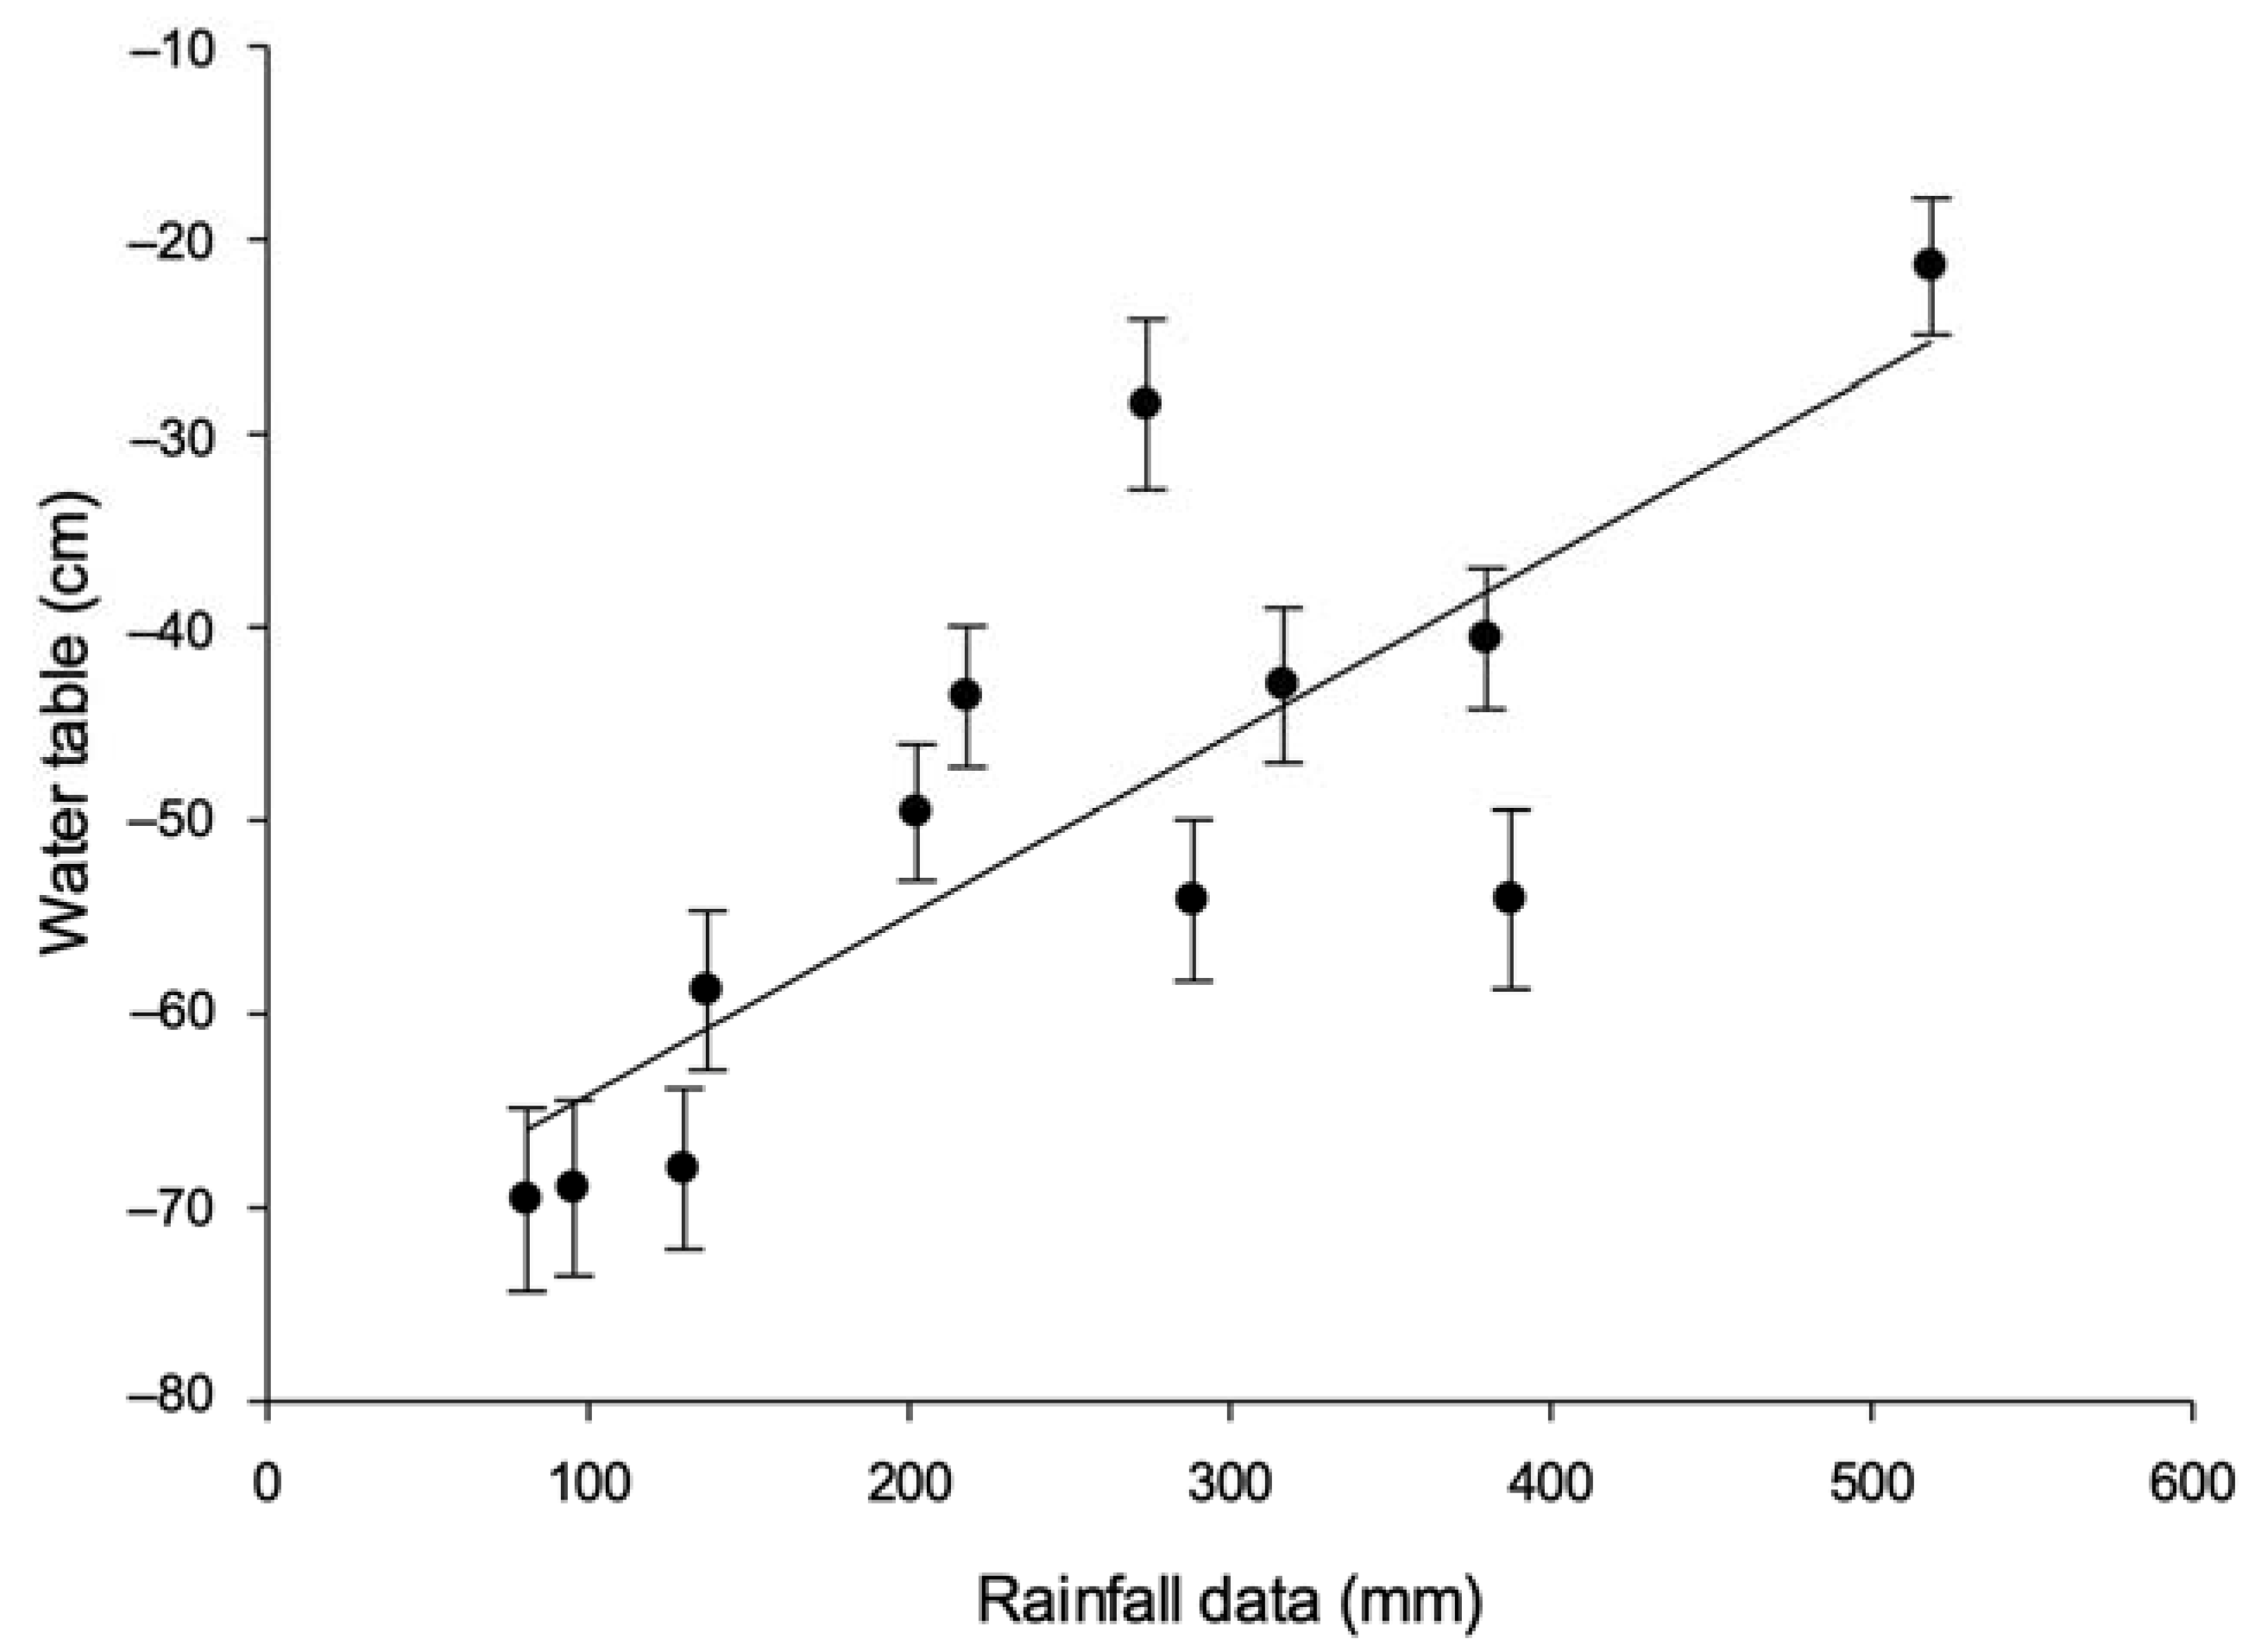
3.1. The Meteorology and Water Table

In 2011, the site received monthly cumulative rainfall between 100 and 500 mm with an annual rainfall of 3029 mm. The total rain days were 240, with an average monthly precipitation of 252 mm and air temperature of 26 °C. Despite the high precipitation values and rain days recorded, there were significant variations in rain intensity (e.g., light, moderate, or heavy rain) and duration (e.g., >24 h, >30 min, or >15 min). Thus, it was not constantly raining at the site to a point where it could negatively affect the quality of the flux measured. The relationship between the water table and rainfall in the year’s second half differed from that in the first half because of intermittent water table sensor interruptions, particularly in September (Figure 2).
The prevailing wind direction was from the southwest, as shown by the wind rose (Figure 3). Wind speeds were generally >2 m s−1; lower wind speeds promote weaker net CO2 uptake at sheltered wetlands. However, the relationship between wind speed and net ecosystem exchange (NEE) at higher wind speeds was weak [32]. Hence, >2 m s−1 wind would promote CO2 uptake.
The water table was managed by maintaining a water level of 60 cm below the peat surface at the collection drain. The monitored average water table was ~50 cm and ranged between −20 and −68 cm below the peat surface (Figure 2). It was significantly correlated (r = 0.80) to the monthly rainfall pattern (Figure 4).

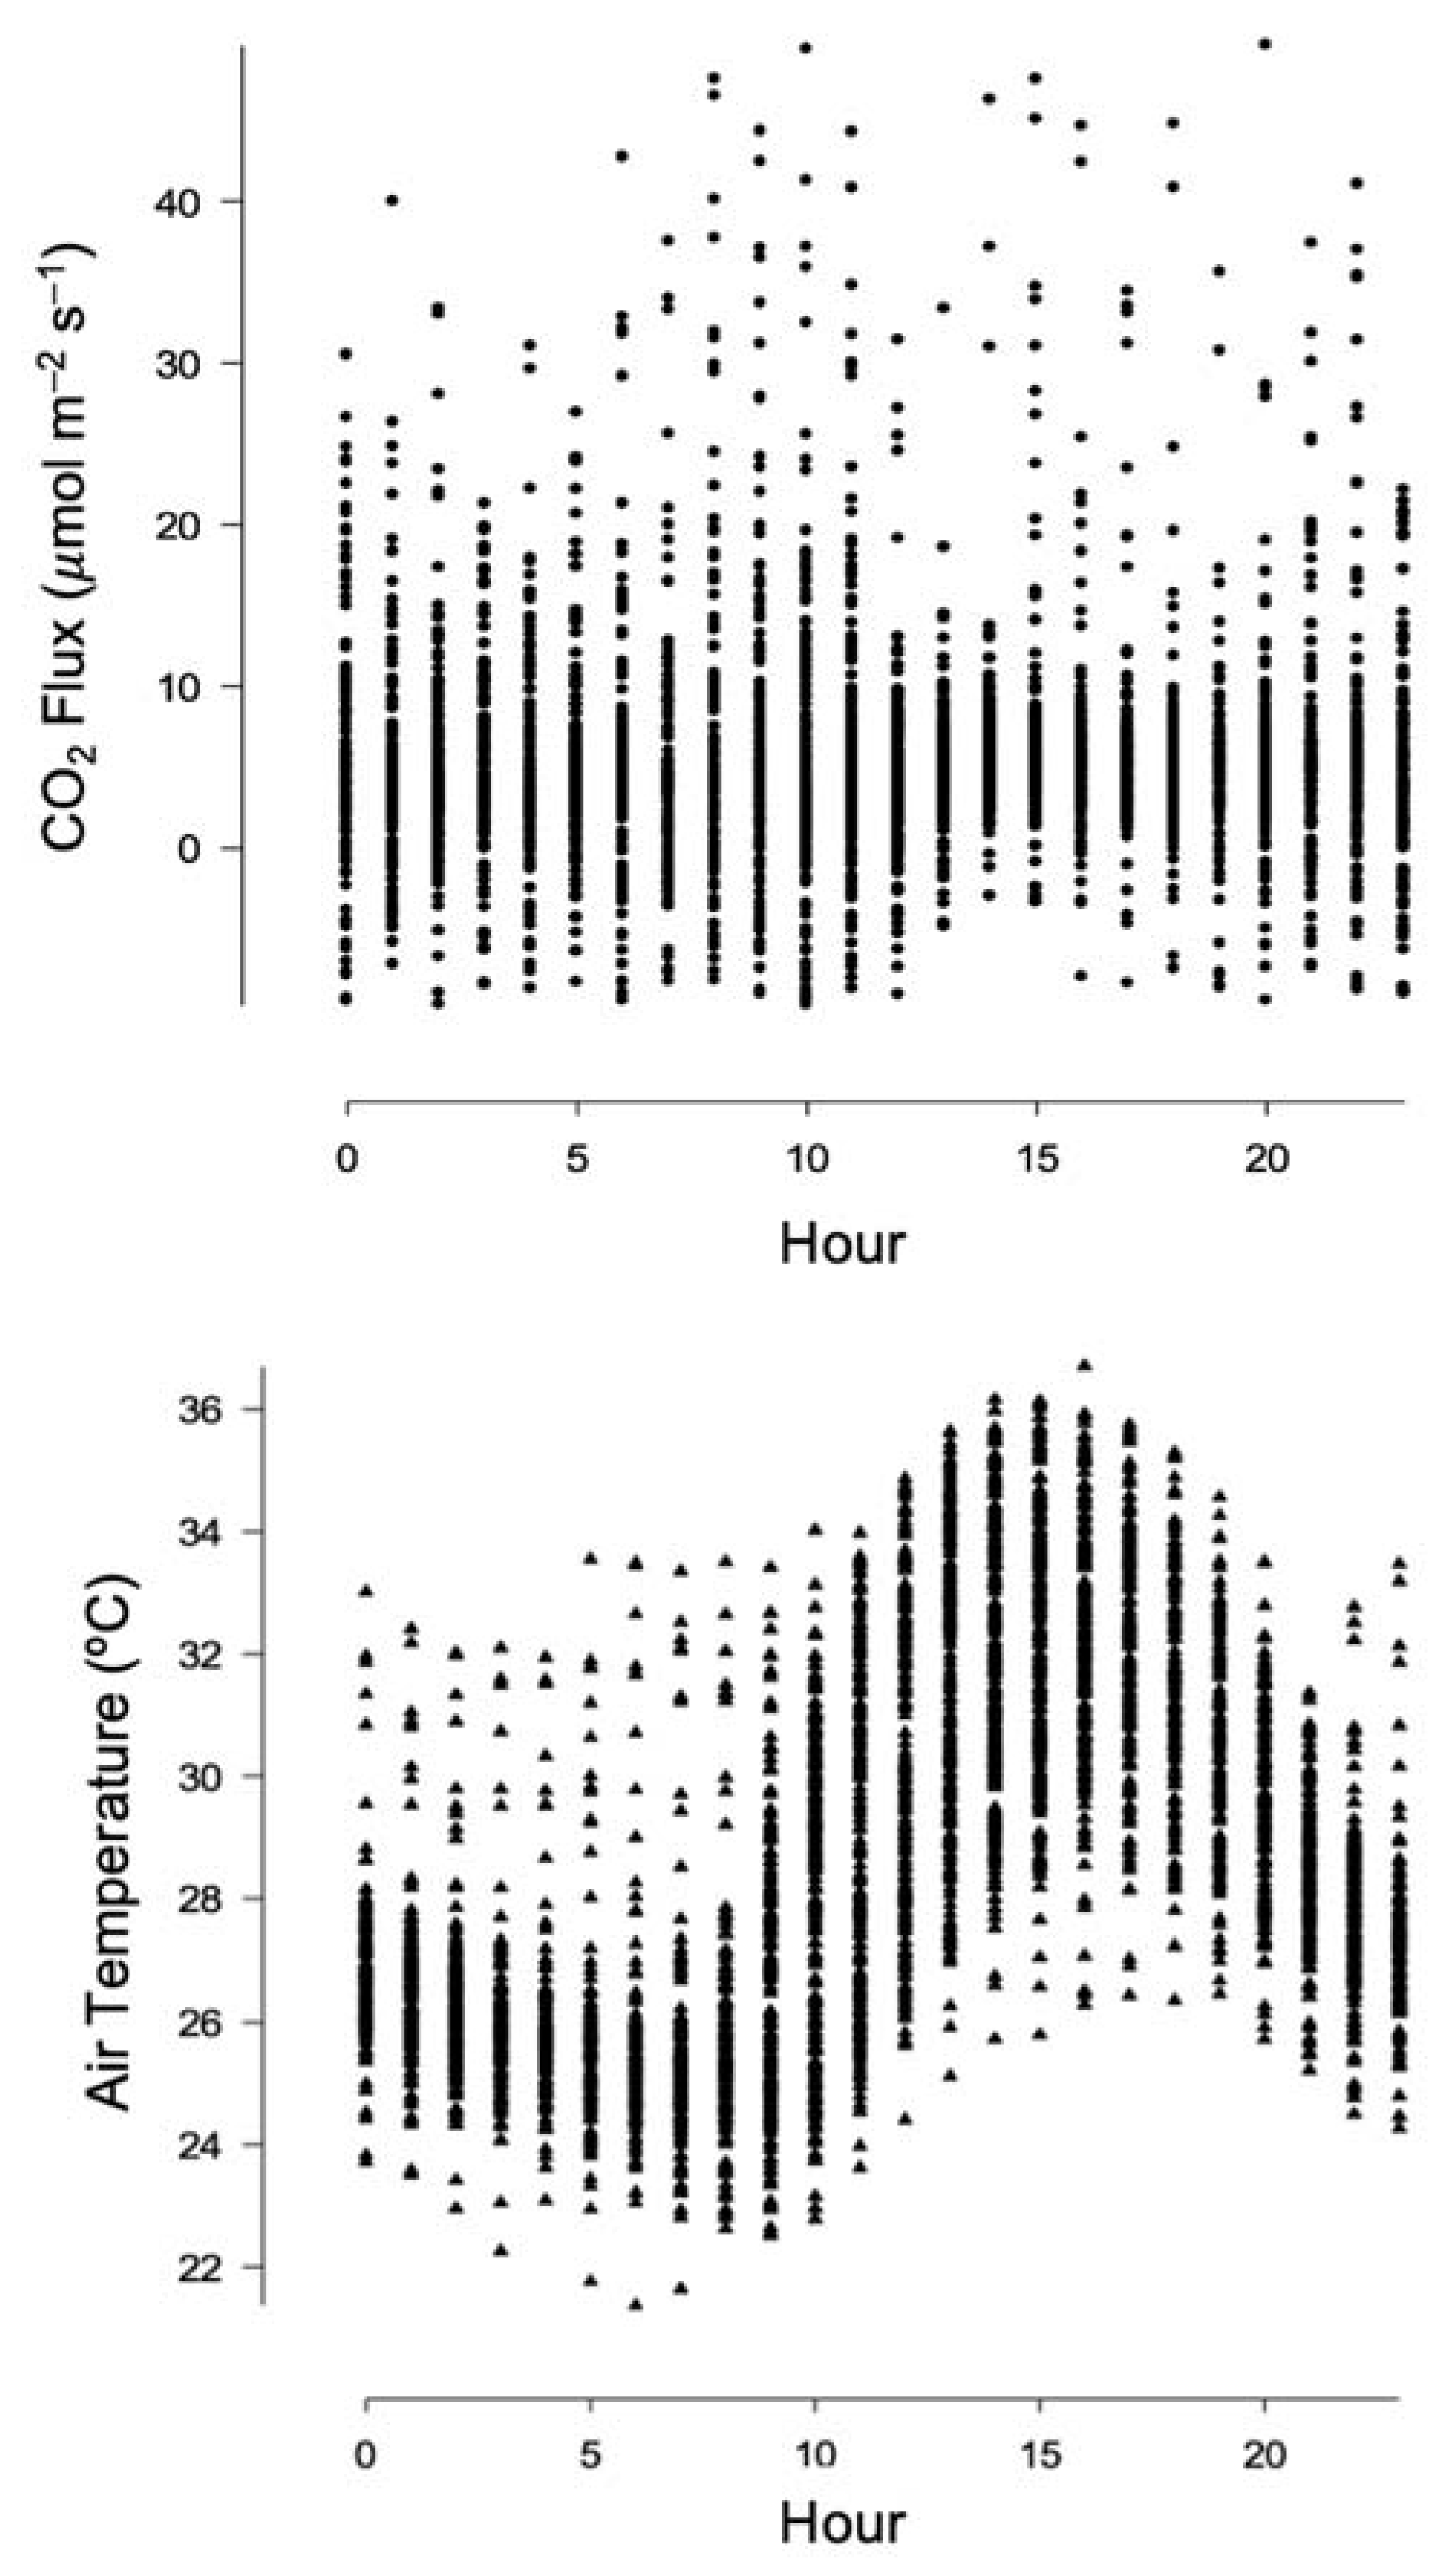
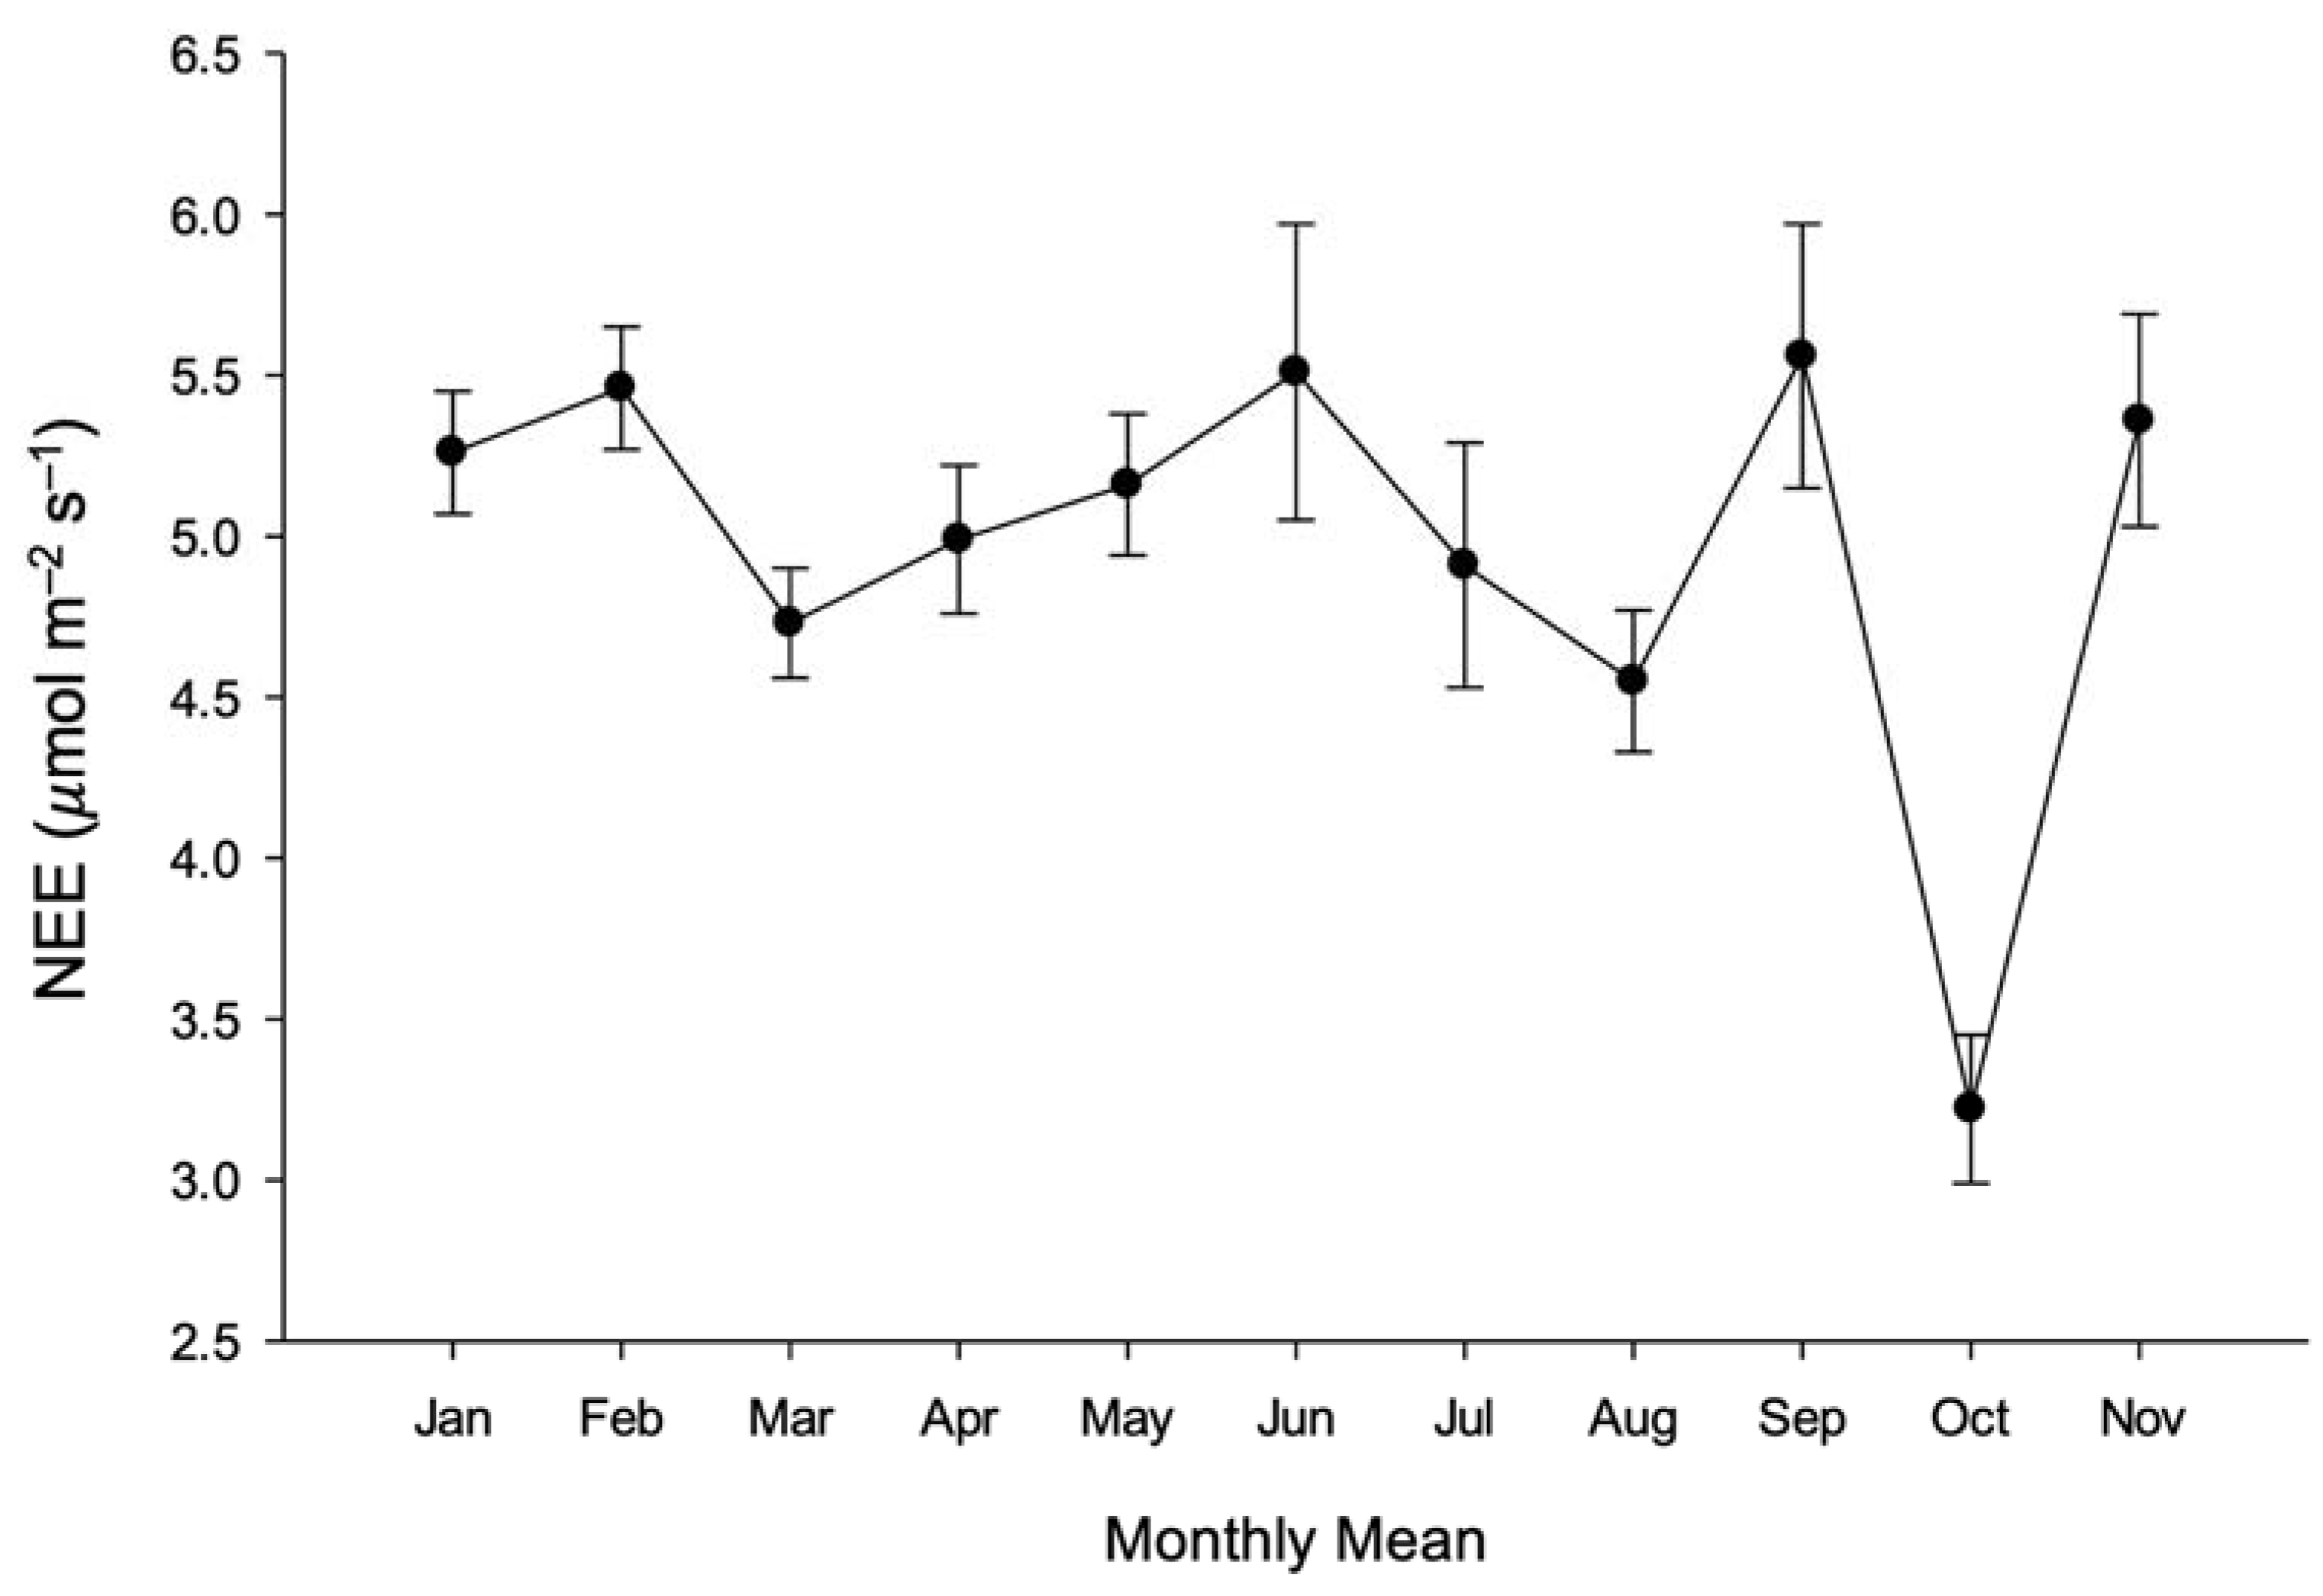
3.2. Eddy Covariance (EC) CO2 Fluxes

The eddy covariance (EC) CO2 flux analysis was based on the data collected from January 2011 to November 2011. The average daily CO2 flux rate was 4.94 ± 0.12 µmol CO2 m−2 s−1, see Figure 5. The daily trend of the CO2 flux rate varied between 4.25 and 6.25 µmol CO2 m−2 s−1 during daytime and night-time periods. No significant correlation was found between CO2 flux rates and air temperature.
On this bare plot, there was no uptake of CO2 during the daytime due to the lack of vegetation. Figure 6 shows positive values for the monthly net ecosystem exchange (NEE), which can be assumed to be the same as the soil respiration rate. It ranged from 3 µmol CO2 m−2 s−1 to 6 µmol CO2 m−2 s−1. There were some measurement interruptions in June due to sensor issues and power shortages, particularly in October. The estimated C loss was about 68.55 t CO2 ha−1 yr−1; this value is within the range reported by Hatano et al. [32]. The authors reported annual C loss rates of 54.8 t CO2 ha−1 yr−1 in natural peat forests, 34.0 t CO2 ha−1 yr−1 in fire-affected regrowing forests, and 94.4 t CO2 ha−1 yr−1 in croplands in Kalimantan.
A previous analysis of an existing dataset shows a relationship between the water table and the CO2 flux. We conducted a similar analysis for this dataset and found that the water table correlated with the flux [31,33,34]. However, it correlated lower than the previous analysis due to measurement interruptions. A study is underway to investigate it further.
A factor that could contribute to the high CO2 emission measured by the EC method is the decomposition of organic matter and surface litter, such as woody residues in the stacking rows [35]. This could explain the 15% higher CO2 emissions of the EC method compared to the soil-chamber-measured emissions, which only account for the soil in its chamber. The results of the soil chamber measurement are discussed in the following sub-section. Wood debris decomposition at the site remains to be studied.
The higher EC-measured C losses than the emissions estimated by the other techniques studied might be due to the unique landscape of the bare peat site. It could be due to possible CO2 advected from the surrounding oil palm area, which could also explain the high CO2 fluxes obtained during night-time. This might be attributed to the bare plot being warmer at night, causing its hot air to rise and drawing the CO2-rich air from the surrounding area. The flux variations observed at night could also be due to the incomplete air mixing caused by the lack of turbulence [36,37]. Under such conditions, the turbulent flux at the measurement height would not necessarily be related to soil efflux [38].
The flux can be influenced by precipitation, pressure variations, turbulence, and soil restoration [39,40]. The latter effect is likely more substantial in soils with a heavy litter layer and less permeable, exposed soils, such as bare peatlands. Under turbulent conditions, carbon dioxide stored in the porous peat layer exchanges more quickly.
The potential uncertainty associated with the EC technique was random errors due to the limited data available due to the limitation of the open-path analyser in rainy conditions. Furthermore, the limited fetch of a 1 ha plot hampered the CO2 flux measurement within the targeted area. The site’s radius was equal to 100 times the height of the tower, representing a maximum probable flux footprint or effect area of the site [41]. The measurement footprint can reach up to 2 km, which far exceeds the 1 ha plot, especially during calm weather at night. Since the EC technique has a large footprint and measured the above-ground CO2 fluxes, it was not favourable in measuring soil CO2 efflux in this site due to the footprint. When used above large uniform surfaces, the eddy covariance technique can provide reliable monitoring of net ecosystem CO2 fluxes [36]; however, it has limited value for estimating CO2 flux in complex ecosystems due to uncertainty in separating CO2 sources and sinks over the measured surface [42].

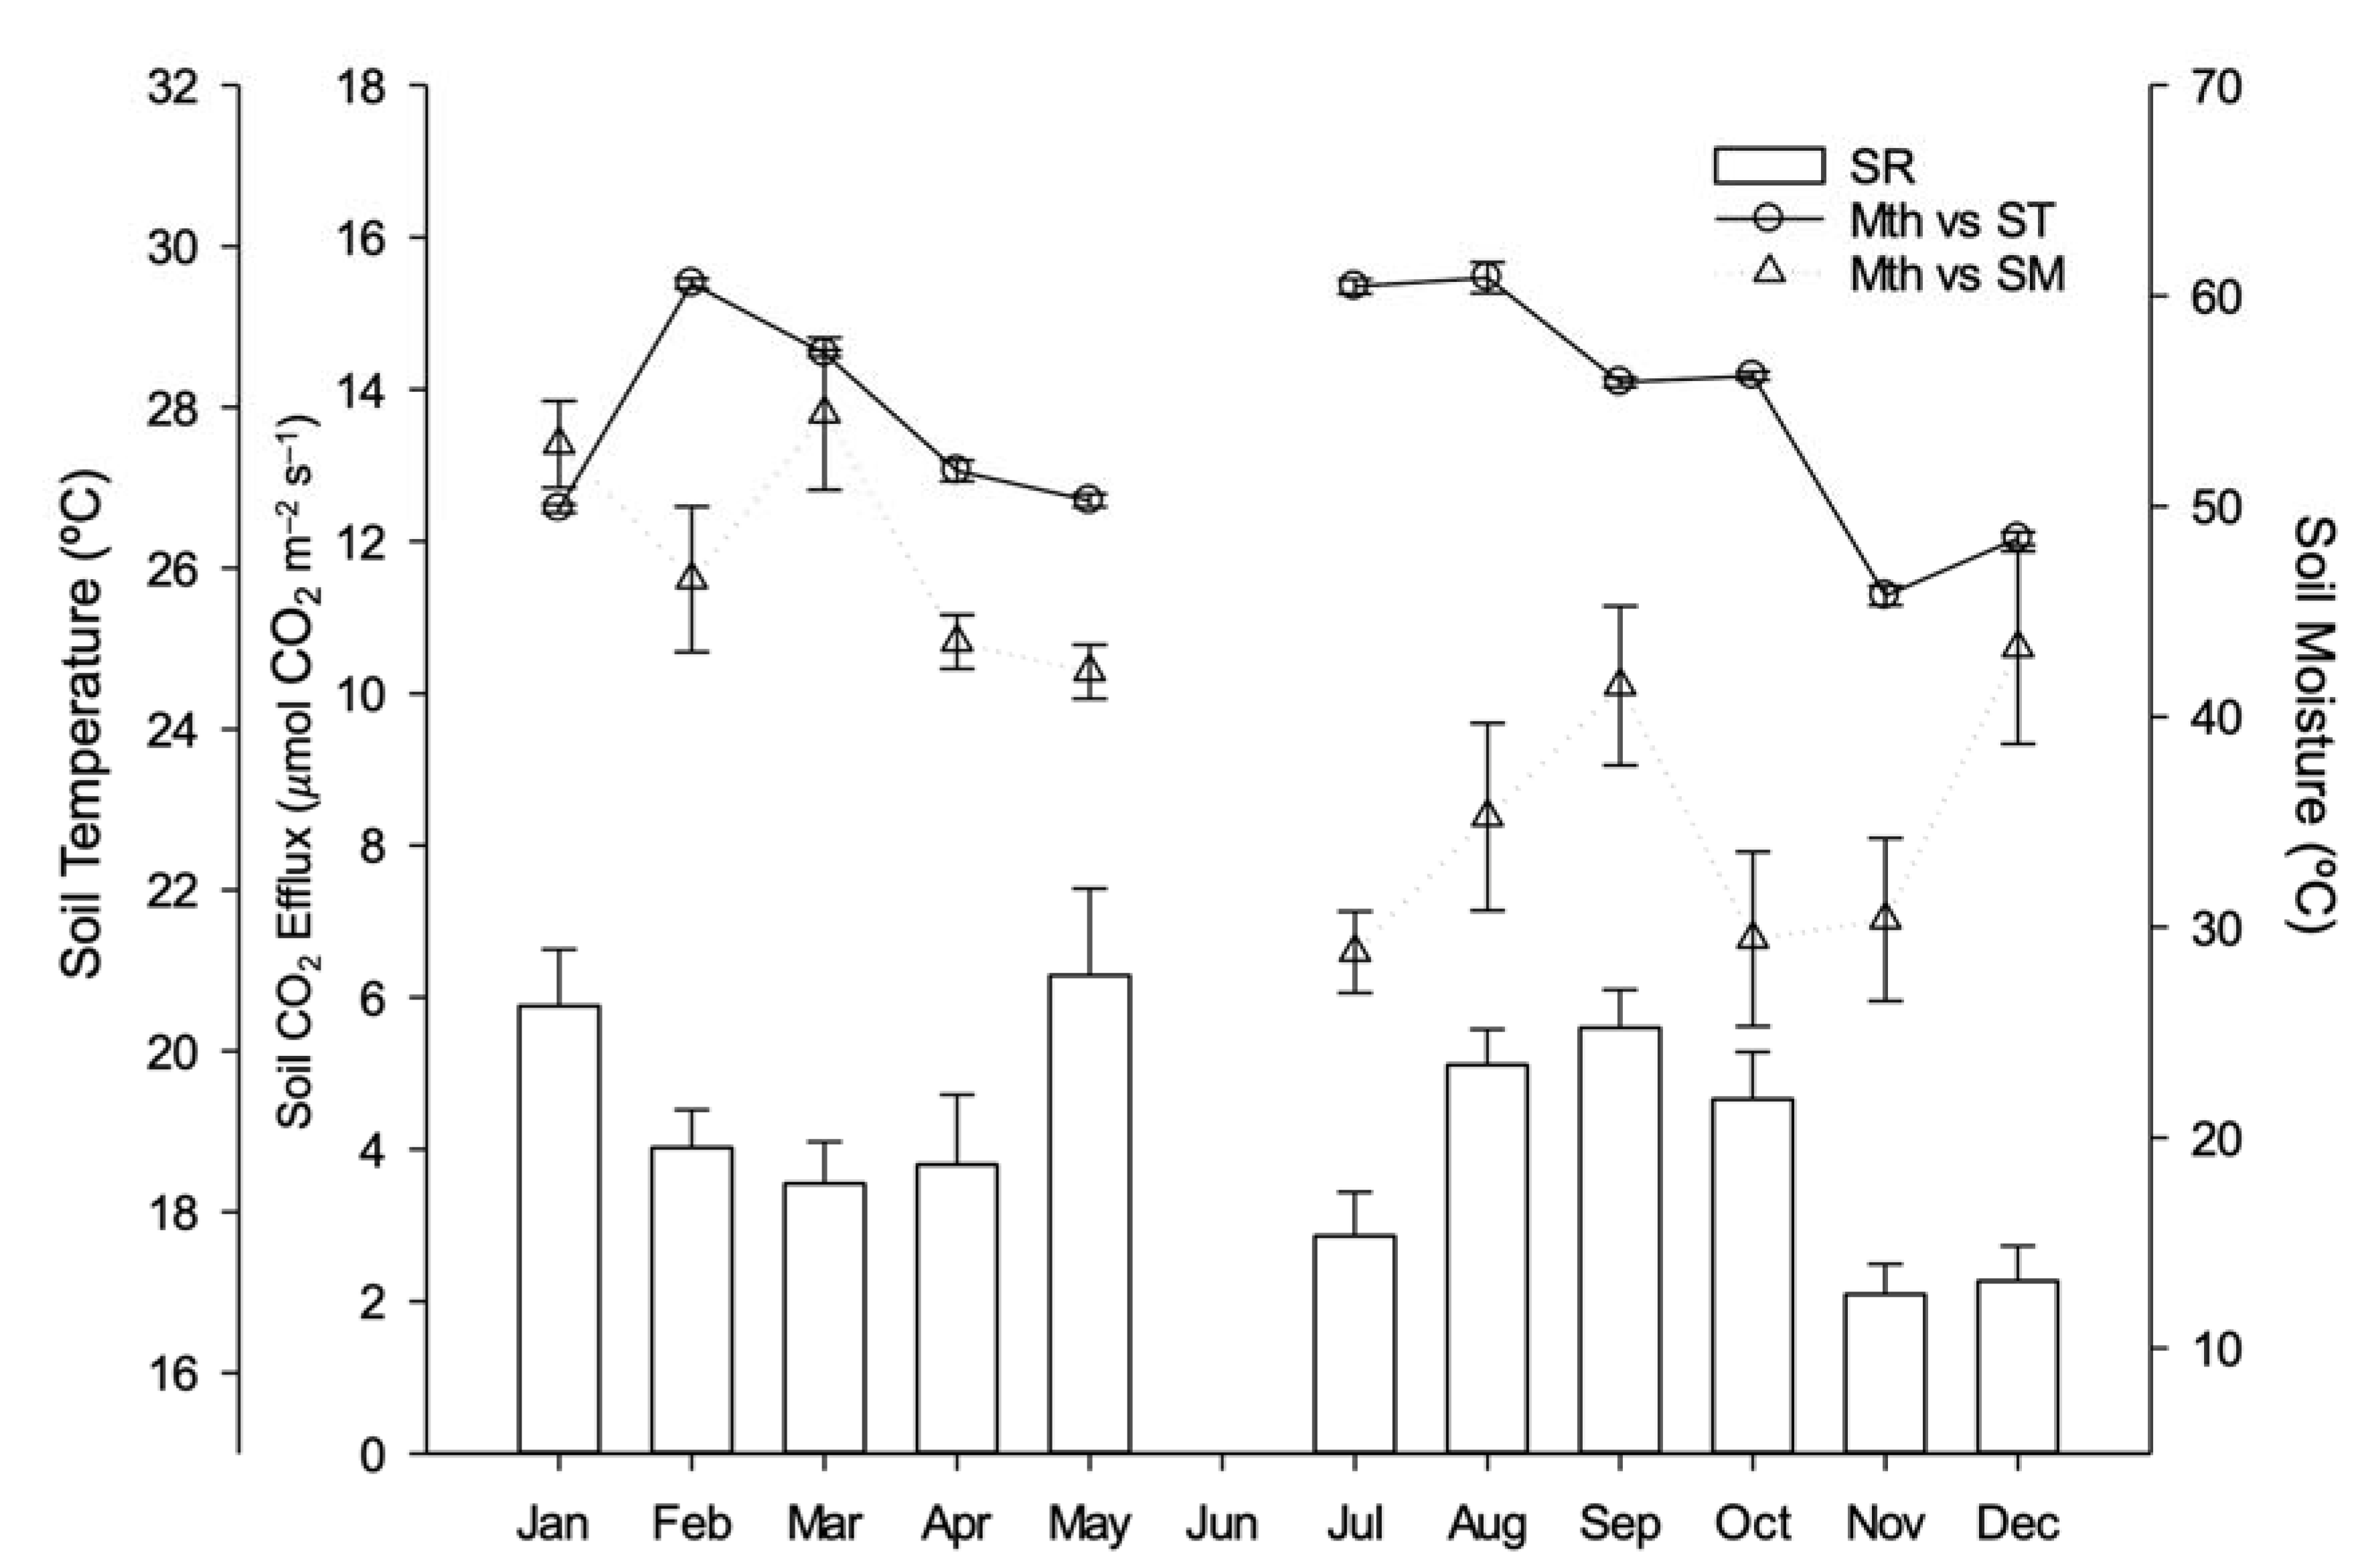
3.3. Closed Chamber Soil CO2 Efflux

The average soil CO2 efflux rate was 4.19 ± 0.22 µmol CO2 m−2 s−1, while the soil temperature was 27.90 ± 0.11 °C and the soil moisture at 38.80 ± 1.41%. There were missing data owing to an instrumental fault in June. The gap in soil temperature and moisture plots after June differed from those between January and May (Figure 7). This is attributed to the soil moisture sensors that were less sensitive in dry soil. A quality check was performed on the instrument before deployment and after servicing, and it performed well at the nearby oil palm research plots [28]. Furthermore, decreased rainfall was observed between July and November.
Since plant roots were absent, the soil CO2 efflux from this bare site was mainly contributed by soil heterotrophic respiration. There was no correlation between rainfall, soil temperature, soil moisture, and soil CO2 efflux rates. Due to the heterogeneous peat properties, there was a sizeable spatial difference in soil CO2 efflux rates between the sampling points at the site. Soil CO2 efflux is known to have a substantial spatial variation, even at the centimetre scale [43,44]. The annual C loss was estimated at 58.14 t CO2 ha−1 yr−1 and was slightly higher than the C loss from a natural peat forest [33] but lower than cropland on peat in Kalimantan. A study conducted by Kusumawati et al. [17] using the infrared gas analyser (IRGA) method to record CO2 emission on bare land after the land was cleared revealed that the land’s emission was 59.0 t CO2 ha−1 yr−1, 47.0 0 t CO2 ha−1 yr−1 for inter-cropped plants in the vegetation phase, 51.6 0 t CO2 ha−1 yr−1 for inter-cropped plants in the generative phase, and 42.9 0 t CO2 ha−1 yr−1 for one-year-old oil palms.
The bare peat surface was expected to have a higher soil CO2 flux rate since studies had shown that bare soils would respire more when the moisture content was not limited [44].
Soil CO2 efflux measured using the closed chamber method has certain limitations [45,46,47,48]. The underestimation of soil CO2 efflux could be attributed to the porous peat properties at the one-hectare bare plot that could cause CO2 to diffuse laterally from beneath the soil chamber to the surrounding area. This could happen when the bare peat surface is exposed to the sun, causing its temperature to increase, leading to the peat drying and increasing its porosity. The disturbance caused by the fan may also induce CO2 leakage at the edges of the chamber. This could explain the improved results of soil CO2 efflux when measured without the soil collars [49].
An ideal chamber system for measuring soil CO2 efflux should not drastically change the ambient conditions within the chamber [50]. Although there are significant uncertainties in soil CO2 fluxes measured using a closed chamber in this study, they provide valuable information about soil CO2 efflux from a drained peat area kept bare from any vegetation. Further information is needed to understand better the different sources of CO2 emissions from peatlands, such as soil microbial respiration and decomposing woody residues in the stacking rows. Long-term measurements are also required to cover the seasonal and inter-annual differences that could affect CO2 emissions.

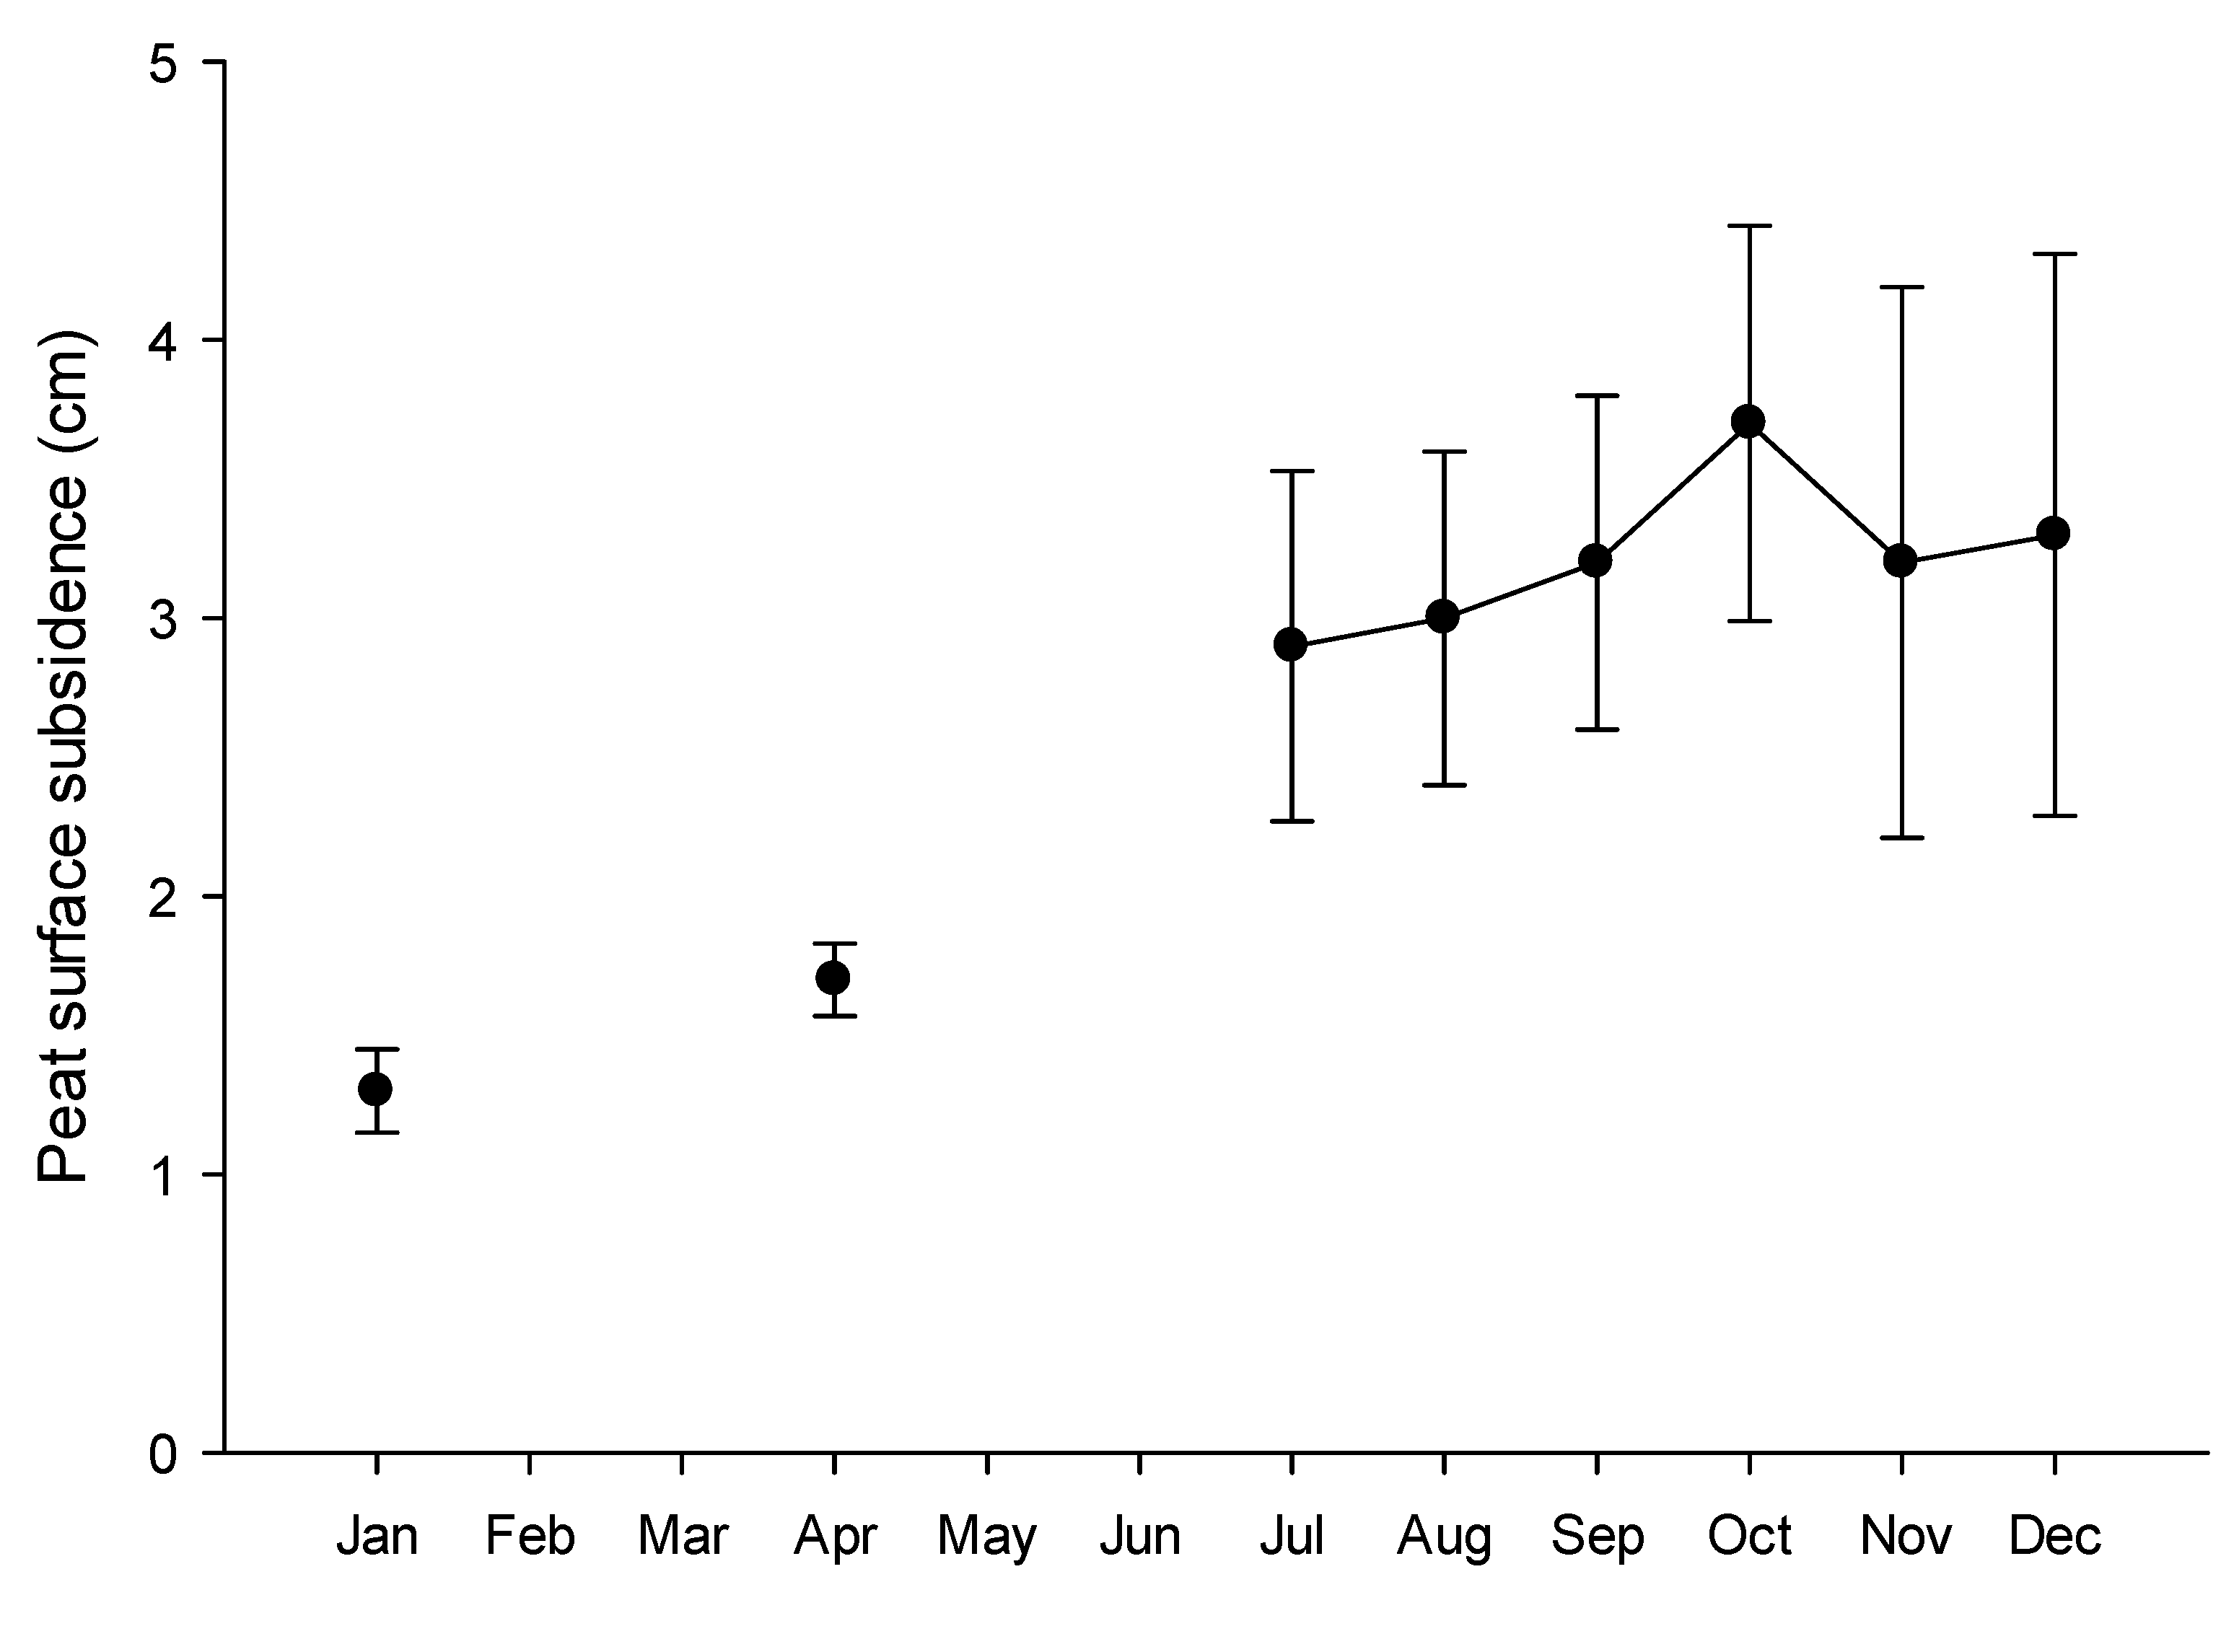
3.4. Peat Subsidence

The average peat subsidence rate was 1.90 cm yr−1 (Figure 8). This value was low compared to work by Deshmukh et al. [14] and could be due to good management practices employed at this site. The subsidence rate was used to estimate the amount of carbon loss described by Wösten et al. [11]. Total subsidence due to the drainage of peatland areas can be subdivided into three components: consolidation, oxidation, and shrinkage [51]. However, the subsidence data in this study reflected the effects of oxidation and shrinkage components that resulted in the peat volume reduction throughout the measurement period. There was no measured data on the consolidation component’s involvement as part of peat subsidence.
It was estimated that 60% of the peat volume reduction was due to oxidation, and the remaining 40% was caused by shrinkage, according to Wösten et al. [11]. Due to the lack of data available on oxidation components from tropical peatland, the total oxidation was rounded at an average of 60% based on the estimation reported by Wösten et al. [11]. These estimates fall within the wide range of 35–100% reported by other studies [47,52,53,54,55].
The calculation of the available data focused on the oxidation components, since CO2 was emitted through the oxidation process. Therefore, the estimation of carbon loss considered the peat bulk density or BD (0.16 g cm−3), C content (54%), and oxidation (60%). Using equation (2) and all the parameters involved, the amount of carbon loss was 36.12 t CO2-eq ha−1 yr−1. This was much lower than what was reported by Wösten et al. [11]. This result could be attributed to the excellent water management practices adopted in the plantation and the minimum operations conducted in the plot.
Furthermore, a high average water table was maintained at approximately −50 cm; water management strongly influences peat subsidence [3,11,56]. Correct design and construction of the drainage system with proper water control, such as water gates or weirs, were installed at the collection drains and main drains to control water tables in the plantation. Appropriate water management is crucial so that carbon emissions and peat subsidence can be controlled better, prolonging the peatland’s economic life and, thus, reducing the risk of the peat fire.
S = 1.90   cm   yr 1 = 190   cm 3   ha 1 yr 1
B D = 0.16   g   cm 3 = 160   kg   m 3
S × B D = 30 , 400   kg   ha 1   yr 1 = 30.4   t   ha 1   yr 1
C = 0.54 C   content × 0.6 Oxidation ~ 60 % × 30.4 = 9.85   t   C   ha 1   yr 1
CO 2 eq = 9.85 × 44 12 = 36.12   t   CO 2 eq   ha 1   yr 1
Peat subsidence results from compaction and peat loss processes, including oxidation and shrinkage [5,11,47,54,57]. The average peat subsidence rate was 1.9 cm yr−1 (Figure 8).
The subsidence rate was used to estimate the amount of carbon loss described by Wösten et al. [11]. The calculation was based on the peat BD (0.16 g cm−3), C content (54%), and the estimation of tropical peat oxidation (60%).
Peat subsidence gave the lowest CO2 emissions estimate compared to the other two direct methods studied. This could be due to the lower oxidative component (60%) of peat used in the C calculation, which accounted for 36.12 t CO2-eq ha−1 yr−1. This result is comparable to that of Deshmukh et al. [14]. They found that degraded peatlands in Indonesia emitted approximately 39.8 ± 2.9 t CO2 ha−1 yr−1 and subsided at a rate of 4.2 ± 1.3 cm yr−1 with an average groundwater level of −0.66 ± 0.21 m.
A study on peat subsidence in western Johore of Peninsular Malaysia found that 61% of secondary subsidence could be attributed to oxidation, ranging from 54% to 73%, measured in pineapple and oil palm plots. Wösten et al. [11] rounded this average to 60%. In a similar study, Jauhiainen et al. [52] reported oxidative losses responsible for about 40–60% of subsidence from peat decomposition on bare peat patches at the Ex-Mega Rice Project area, Kalimantan, Indonesia.
The estimated oxidation component in these previous studies fell within the wide range of 35–100% found in other parts of the world [47,53,54,55]. Hence, the calculated C loss using the peat subsidence rate has the lowest value, which could be influenced by the peat properties, such as BD and C content taken at the 5 cm depth. The calculated C loss would be 50 t CO2eq ha−1 yr−1 if an estimation of 80% were used for the oxidation component, BD of 0.16 g cm−3 and C content of 54%. Furthermore, the BD and C values used in this study were determined from peat cores taken at a depth of 5 cm, which does not represent the actual properties of different peat depths. Hooijer et al. [18] reported that the average rate of C loss over the first five years after drainage was 178 t CO2-eq ha−1yr−1, which was then reduced to 73 t CO2-eq ha−1yr−1 over subsequent years, and giving an average loss of about 100 t CO2-eq ha−1yr−1 over 25 years.

3.5. Peat Sample Analysis

The peat’s bulk density (BD) was 0.16 g cm−3, while the C and N content was 54% and 1.84%, respectively (Table 1). Warren et al. [58] measured peat BD in Indonesia and reported a range from 0.054 to 0.371 g cm−3 from 2- to 12-m depths, with the C content varying from 40.3 to 60.7%.
Undisturbed peat usually has a BD of around 0.10 to 0.15 g cm−3 and can increase to 0.20 g cm−3 after mechanical compaction. Andriesse [59] reported an average BD of 0.12 and 0.09 g cm−3 for Sarawak peat. Therefore, the BD and C content values from the study site were within the range previously reported by the literature.
The N content was also within the range reported by Melling et al. [60] for three different peat ecosystems, i.e., 1.77 to 1.99%. The soil WFPS was about 51%, slightly lower than the values reported for oil palm plots and forests [60].
A lower CO2 diffusion to the soil surface in soil with more water-filled pores might influence the soil CO2 efflux in this site. The C:N ratio value at 30.5 was slightly higher than that reported by Melling et al. [60] for three different ecosystems (22.6 in sago, 23.4 in oil palm, and 27.2 in forest). A high C:N ratio could significantly decrease the decomposition process, causing organic matter to accumulate while reducing the availability of nutrients [61,62]. The lower C:N ratio suggested that the drained peat had a higher decomposition rate related to significant cumulative CO2 emissions [63].

3.6. Overall Discussion

The three methods in assessing C losses from a bare drained peatland area in this study gave contrasting results (Figure 9). The estimated results listed in Table 2 were as follows: eddy covariance, 68.55 t CO2 ha−1 year−1, closed chamber, 58.14 t CO2 ha−1 year−1, and peat subsidence, 36.12 t CO2eq ha−1 year−1.
The differences in estimated C losses may not depend exclusively on the measurement method but also on the area and period of measurements. Each different approach used in this study has its advantages and disadvantages. Differences in temporal variability of measurement techniques in this study might contribute to the results obtained for each technique.
The data was logged every second for the EC technique, less or more than 2 min per measurement at monthly intervals for the soil chamber method, and every three months to every month for the subsidence technique.
Concisely, the EC technique measured CO2 flux 24 h a day, seven days a week, while the soil chamber measured soil CO2 efflux at only particular times.
The CO2 flux also varied depending on the season, such as the wet and dry seasons. The wet period occurred from November to March, and the dry period from April to October (refer to Figure 2).
Rainfall after the dry period significantly influenced CO2 fluxes from the soil [64,65,66]. A previous study by Rochette et al. [66] showed that soil CO2 flux increased immediately after the rainfall but decreased during light rainfall later in the day. The decreased soil CO2 flux during light rainfall may be due to the dissolution of soil-air CO2 into the infiltrating water or a decreased CO2 diffusivity in the wetter soil.
Spatial variability of measured CO2 flux is expected in this study, especially for the EC and soil chamber techniques. The large flux footprint using EC, especially at night, might explain the spatial variability of CO2 flux. Spatial heterogeneity of soil CO2 flux measured using the soil chamber happened due to soil heterogeneity in the site.
The magnitude of soil CO2 flux in this study could be subjected to microbial biomass, soil organic matter content, compaction, air porosity, and peat texture that may create hotspot areas due to the unique landscape within the 1 ha plot.
The location of subsidence pegs near the collection, and field drains in the site may contribute to the spatial variation of peat subsidence. A study conducted by Othman et al. [35] found that the water table was lower near the drains than the water table in the field. The low water table accelerated peat oxidation and, thus, contributed to CO2 emission.

4. Conclusions

The three measurement techniques tested recorded significant variations in the estimated soil CO2 efflux. This study demonstrated that CO2 emission rates could vary depending on the measurement techniques. However, it is challenging to determine the best technique to be used.
The carbon (C) loss estimation was found to be highest by the eddy covariance (EC) technique, followed by the soil chamber technique, and, lastly, the peat subsidence rate technique.
The higher CO2 emission rate observed in the EC technique could be attributed to soil microbial respiration and decomposing woody residues in the stacking rows since EC has a large footprint. It could also be affected by advection from oil palms adjacent to the site.
The soil chamber technique had a 15% lower CO2 emission rate than the EC technique since it only captured CO2 emission from a small peat surface area.
The calculated C loss from the peat subsidence rate method had the lowest value, which may have been influenced by peat properties, such as bulk density and C content taken at the 5 cm depth. Moreover, the low estimation of oxidation components of 60% might have also contributed to the lower CO2 emission estimates.
Despite the significant differences in the CO2 emission rates by the three techniques, this study provides valuable information on the soil heterotrophic respiration of the deep peat in Sarawak. Carbon emissions from the bare peat area cover only a fraction of the soil’s CO2 respiration component. This refers to the soil heterotrophic respiration within the short period before the area is developed into an oil palm plantation. Results presented in this study were site-specific and involved certain uncertainties, as discussed in the paper.
Best management practices in oil palm plantations, such as good water and nutrient management and planting cover crops, could help to control C emissions and peat subsidence. This was recommended in the guidelines for developing the standard operating procedure for oil palm cultivation on peat published by the Malaysian Palm Oil Board. Further investigations and long-term data are needed to determine spatial and temporal variability in CO2 emissions by soil microbial activities and plant roots from peat areas in Sarawak before these findings can be extensively interpreted.

Author Contributions

Conceptualization, H.M.; methodology, H.M.; software, A.S.I.; validation, H.M. and Y.Y.; formal analysis, H.M. and A.S.I.; investigation, H.M.; resources, M.H.H.; data curation, H.M.; writing—original draft preparation, H.M.; writing—review and editing, H.M., N M J and Y.Y.; visualization, A.S.I.; supervision, Y.Y.; project administration, Z.H. and N.M.J.; funding acquisition, Z.H. and Y.Y. All authors have read and agreed to the published version of the manuscript.

Funding

This research was funded by the Ministry of Education Malaysia, Malaysian Research University Network Long-Term Research Grant Scheme (MRUN-LRGS) grant number 203.PTEKIND.6777006 and the Malaysian Palm Oil Board with the project code R007808004. The APC was funded by the Research Creativity and Management Office, Universiti Sains Malaysia and the School of Industrial Technology, Universiti Sains Malaysia.

Institutional Review Board Statement

Not applicable.

Data Availability Statement

The data presented in this study are available on request from the corresponding author. The data are not publicly available due to data sharing policy of the Malaysian Palm Oil Board (MPOB).

Acknowledgments

We are grateful to the Ministry of Education Malaysia, Malaysian Research University Network Long-Term Research Grant Scheme (MRUN-LRGS) for providing us the support to perform the research through the grant numbered 203.PTEKIND.6777006. The authors thank the Director General of Malaysian Palm Oil Board (MPOB) for his permission to publish this paper. Also, thanks to the plantation management and all the Tropical Peat Research Institute (TROPI) Unit staff at MPOB for their valuable assistance. We thank the anonymous referees for their insightful and helpful comments on previous manuscript versions.

Conflicts of Interest

The authors declare no conflict of interest.

References

  1. Wahid, O.; Nordiana, A.; Ahmad, T.M.; Haniff, M.H.; Ahmad, K.D. Mapping of Oil Palm Cultivation on Peatland in Malaysia. MPOB Inf. Ser. 2010, 473, 529. [Google Scholar]
  2. Couwenberg, J. Greenhouse Gas Emissions from Managed Peat Soils: Is the IPCC Reporting Guidance Realistic? Mires Peat 2011, 8, 2. [Google Scholar]
  3. Hooijer, A.; Page, S.; Jauhiainen, J.; Lee, W.A.; Lu, X. Recent Findings on Subsidence and Carbon Loss in Tropical Peatlands: Reducing Uncertainties. In Proceedings of the Workshop on “Tropical Wetland Ecosystems of Indonesia: Science Need to Address Climate Change Adaptation and Mitigation”, Bali, Indonesia, 11–14 April 2010. [Google Scholar]
  4. Page, S.; Morrison, R.; Mallins, C.; Hooijer, A.; Rieley, J.O.; Jauhiainen, J. Review of Peat Surface Greenhouse Gas Emissions from Oil Palm Plantations in Southeast Asia, The International Council on Clean Transport, Indirect Effects of Biofuel Production Series; White Paper No. 15; International Council on Clean Transportation: Washington, DC, USA, 2011. [Google Scholar]
  5. Hooijer, A.; Page, S.; Canadell, J.G.; Silvius, M.; Kwadijk, J.; Wösten, H.; Jauhiainen, J. Current and Future CO2 Emissions from Drained Peatlands in Southeast Asia. Biogeosciences Discuss. 2009, 6, 7207–7230. [Google Scholar]
  6. Hirano, T.; Segah, H.; Harada, T.; Limin, S.; June, T.; Hirata, R.; Osaki, M. Carbon Dioxide Balance of a Tropical Peat Swamp Forest in Kalimantan, Indonesia. Glob. Chang. Biol. 2007, 13, 412–425. [Google Scholar] [CrossRef]
  7. Singh, G.; Pau, T.Y.; Padman, C.V.R.; Wah, L.F. Experiences on The Cultivation and Management of Oil Palm on Deep Peat in United Plantation Berhad. J. Plant. 1987, 63, 143–157. [Google Scholar]
  8. Hasnol, O.; Ahmad, T.M.; Farawahida, M.D.; Haniff, M.H.; Muhammad, P.Z. Best Management Practices for Oil Palm Cultivation on Peat: Ground Water-Table Maintenance in Relation to Peat Subsidence and Estimation of CO2 Emissions at Sessang, Sarawak. J. Oil Palm Res. 2011, 23, 1078–1086. [Google Scholar]
  9. Parveez, G.K.A.; Hishamuddin, E.; Loh, S.K.; Meilina, O.A.; Salleh, K.M.; Bidin, M.N.I.Z.; Sundram, S.; Hasan, Z.A.A.; Idris, Z. Oil Palm Economic Performance in Malaysia and R&D Progress in 2019. J. Oil Palm Res. 2020, 32, 159–190. [Google Scholar]
  10. Berglund, K. Cultivated Organic Soils in Sweden: Properties and Amelioration. Ph.D. Dissertation, Swedish University of Agricultural Sciences, Uppsala, Sweden, 1996; p. 39. [Google Scholar]
  11. Wösten, J.H.M.; Ismail, A.; Van Wijk, A.L.M. Peat Subsidence and Its Practical Implications: A Case Study in Malaysia. Geoderma 1997, 78, 25–36. [Google Scholar] [CrossRef]
  12. Luo, Y.; Zhou, X. Soil Respiration and the Environment; Elsevier, Inc.: Philadelphia, PA, USA, 2006. [Google Scholar]
  13. Kiew, F.; Hirata, R.; Hirano, T.; Xhuan, W.G.; Aries, E.B.; Kemudang, K.; Wenceslaus, J.; San, L.K.; Melling, L. Carbon Dioxide Balance of an Oil Palm Plantation Established on Tropical Peat. Agric. For. Meteorol. 2020, 295, 108189. [Google Scholar] [CrossRef]
  14. Deshmukh, C.S.; Julius, D.; Desai, A.R.; Chandra, S.; Asyhari, A.; Page, S.E.; Nardi, N.; Susanto, A.P.; Nurholis, N.; Hendrizal, M.; et al. Conservation slows down emission increase from a tropical peatland in Indonesia. Nat. Geosci. 2021, 14, 484–490. [Google Scholar] [CrossRef]
  15. Dariah, A.; Agus, F.; Susanti, E.; Jubaedah, J. Relationship between Sampling Distance and Carbon Dioxide Emission under Oil Palm Plantation. J. Trop. Soils 2013, 18, 125–130. [Google Scholar] [CrossRef]
  16. Hergoualc’h, K.; Hendry, D.T.; Mudiyarso, D.; Verchot, L.V. Total and Heterotrophic Soil Respiration in A Swamp Forest and Oil Palm Plantations on Peat in Central Kalimantan, Indonesia. Biogeochemistry 2017, 135, 2013–2220. [Google Scholar] [CrossRef] [Green Version]
  17. Kusumawati, S.A.; Yahya, S.; Hariyadi Mulatsih, S.; Istina, I.N. The Dynamic of Carbon Dioxide (CO2) Emission and Land Coverage on Intercropping System on Oil Palm Replanting Area. J. Oil Palm Res. 2020, 33, 267–277. [Google Scholar] [CrossRef]
  18. Hooijer, A.; Page, S.; Jauhiainen, J.; Lee, W.A.; Lu, X.; Idris, A.; Anshari, G. Subsidence and Carbon Loss in Drained Tropical Peatlands. Biogeosciences 2012, 9, 1053–1071. [Google Scholar] [CrossRef] [Green Version]
  19. Paramanathan, S. Report on The Detailed Soil Survey of The MPOB Trial Plots, Ladang Pelitanah 2, Tradewinds Retus, Sibu, Sarawak, Malaysia; Malaysian Palm Oil Board: Bandar Baru Bangi, Malaysia, 2012. [Google Scholar]
  20. Soil Survey Staff. Keys to Soil Taxonomy—Eleventh Edition; United States Department of Agriculture, Natural Resources Conservation Service: Washington, DC, USA, 2010. [Google Scholar]
  21. Paramanathan, S. Malaysian Soil Taxonomy—Revised Second Edition; Param Agricultural Soil Surveys (M) Sdn. Bhd.: Petaling Jaya, Malaysia, 2010. [Google Scholar]
  22. Henson, I.E. Carbon Assimilation, Water Use and Energy Balance of an Oil Palm Plantation Assessed using Micrometeorological Techniques. In Proceedings of the PORIM International Palm Oil Congress, Kuala Lumpur, Malaysia, 21–25 September 1993. [Google Scholar]
  23. Webb, E.K.; Pearman, G.; Leuning, R. Correction of Flux Measurements for Density Effects due to Heat and Water Vapor Transfer. Q. J. R. Meteorol. Soc. 1980, 106, 85–100. [Google Scholar] [CrossRef]
  24. Henson, I.E.; Haniff, M.H. The Influence of Climatic Conditions on Gas and Energy Exchanges Above a Young Oil Palm Stand in North Kedah, Malaysia. J. Oil Palm Res. 2005, 17, 73–91. [Google Scholar]
  25. Haniff, M.H.; Henson, I.E.; Mohd Roslan, M.N. Continuous Measurement of Canopy CO2 and H2O Fluxes of an Oil Palm Plantation using Eddy Correlation Technique. In Proceedings of the 15th Malaysian Society of Plant Physiology Conference, Advances in Plant Science, Port Dickson, Malaysia, 14–16 September 2004. [Google Scholar]
  26. Foken, T.; Göockede, M.; Mauder, M.; Mahrt, L.; Amiro, B.D.; Munger, J.W. Post-Field Data Quality Control Handbook of Micrometeorology: A Guide for Surface Flux Measurement and Analysis; Lee, X., Massman, W., Law, B., Eds.; Kluwer Academic Publishers: Dordrecht, The Netherlands, 2004; pp. 181–208. [Google Scholar]
  27. Eddy Covariance Gap-Filling & Flux-Partitioning Tool, Max Plank Institute for Biogeochemistry. Available online: http://www.bgc-jena.mpg.de/~MDIwork/eddyproc/ (accessed on 29 November 2011).
  28. Mos, H.; Haniff, M.H.; Kho, L.K.; Maisarah, N.J.; Afifah, A.R.; Amanina, N.S.; Othman, H.; Kamarudin, N.; Parveez, G.K.A.; Kushairi, A.D.; et al. Soil Carbon Dioxide (CO2) Efflux Rate and Oil Palm Yield from Different Peat Types in Sarawak, Malaysia. J. Oil Palm Res. 2021, 33, 257–266. [Google Scholar] [CrossRef]
  29. Inbushi, K.; Hadi, A.; Okazaki, M.; Yonebayashi, K. Effect of Converting Wetland Forest to Sago Palm Plantations on Methane Gas Flux and Organic Carbon Dynamics in Tropical Peat Soil. Hydrol. Process. 1998, 12, 2073–2080. [Google Scholar] [CrossRef]
  30. Jauhiainen, J.; Silvennoinen, H. Diffusion GHG Fluxes at Tropical Peatland Drainage Canal Water Surfaces. Suo 2012, 63, 93–105. [Google Scholar]
  31. Manning, F.C.; Kho, L.K.; Hill, T.C.; Cornulier, T.; Teh, Y.A. Carbon Emissions from Oil Palm Plantations on Peat Soil. Front. Front. For. Glob. Chang. 2019, 2, 37. [Google Scholar] [CrossRef] [Green Version]
  32. Turner, J.; Desai, A.R.; Thom, J.; Wickland, K.P.; Olson, B. Wind Sheltering Impacts on Land-Atmosphere Fluxes Over Fens. Front. Environ. Sci. 2019, 7, 179. [Google Scholar] [CrossRef]
  33. Hatano, R.; Takashi, I.; Untung, D.; Suwido, H.L.; Tomoaki, M.; Fumiaki, T.; Yo, T.; Hiroyuki, Y. Carbon Dioxide and Nitrous Oxide Emissions Associated with Tropical Peatland Degradation. In Proceedings of the 19th World Congress of Soil Science, Soil Solutions for a Changing World, Brisbane, Australia, 1–6 August 2010; pp. 13–16. [Google Scholar]
  34. McCalmont, J.; Kho, L.K.; Teh, Y.A.; Lewis, K.; Chocholek, M.; Rumpang, E.; Hill, T. Short- and long-term carbon emissions from oil palm plantations converted from logged tropical peat swamp forest. Glob. Chang. Biol. 2021, 27, 2361–2376. [Google Scholar] [CrossRef] [PubMed]
  35. Othman, H.; Mohammed, A.T.; Harun, M.H.; Darus, F.M.; Mos, H. Best management practises for oil palm planting on peat: Optimum groundwater table. MPOB Inf. Ser. 2010, 528, 1–7. [Google Scholar]
  36. Burba, G. Eddy Covariance Method for Scientific, Industrial, Agricultural and Regulatory Applications: A Field Book on Measuring Ecosystem Gas Exchange and Areal Emission Rates; LI-COR Biosciences: Lincoln, NE, USA, 2013; 331p. [Google Scholar]
  37. Aubinet, M.; Vesala, T.; Papale, D. (Eds.) Eddy Covariance: A Practical Guide to Measurement and Data Analysis; Springer Atmospheric Sciences: Berlin, Germany, 2012. [Google Scholar] [CrossRef]
  38. Janssens, I.A.; Kowalski, A.S.; Longdoz, B.; Ceulmans, R. Assessing Forest Soil CO2 Efflux: An in-situ Comparison of Four Techniques. Tree Physiol. 2000, 20, 23–32. [Google Scholar] [CrossRef] [Green Version]
  39. Baldocchi, D.D.; Meyers, T.P. Trace Gas Exchange at the Floor of a Deciduous Forest: I. Evaporation and CO2 Efflux. J. Geophys. Res. Atmos. 1991, 96, 7271–7285. [Google Scholar] [CrossRef]
  40. Hanson, P.J.; Wullschleger, S.D.; Bohlman, S.A.; Todd, D.E. Seasonal and Topographic Patterns of Forest Floor CO2 Efflux from an Upland Oak Forest. Tree Physiol. 1993, 13, 1–15. [Google Scholar] [CrossRef] [PubMed]
  41. Schmid, H.P. Footprint Modeling for Vegetation Atmosphere Exchange Studies: A Review and Perspective. Agric. For. Meteorol. 2002, 113, 159–183. [Google Scholar] [CrossRef]
  42. Norman, J.M.; Garcia, R.; Verma, S.B. Soil Surface CO2 Fluxes and the Carbon Budget of a Grassland. J. Geophys. Res. Atmos. 1992, 97, 18845–18853. [Google Scholar] [CrossRef]
  43. Davidson, E.A.; Savage, K.; Bolstad, P.; Clark, D.A.; Curtis, P.S.; Ellsworth, D.S.; Hanson, P.J.; Law, B.E.; Luo, Y.; Pregitzer, K.S.; et al. Below-ground Carbon Allocation in Forests Estimated from Litterfall and IRGA-Based Soil Respiration Measurements. Agric. For. Meteorol. 2002, 113, 39–51. [Google Scholar] [CrossRef]
  44. Smith, K.A.; Ball, T.; Conen, F.; Dobbie, K.E.; Massheder, J.; Rey, A. Exchange of Greenhouse Gases Between Soil and Atmosphere: Interactions of Soil Physical Factors and Biological Processes. Eur. J. Soil Sci. 2003, 54, 779–791. [Google Scholar] [CrossRef] [Green Version]
  45. Schneider, J.; Kutzbach, L.; Schulz, S.; Wilmking, M. Overestimation of CO2 Respiration Fluxes by The Closed Chamber Method in Low-turbulence Night-time Conditions. J. Geophys. Res. Biogeosciences 2009, 114, G03005. [Google Scholar] [CrossRef]
  46. Ventera, R.T.; Baker, J.M. Effects of Physical Nonuniformity on Chamber-Based Gas Flux Estimates. Soil Sci. Soc. Am. J. 2008, 72, 1410–1417. [Google Scholar] [CrossRef] [Green Version]
  47. Grønlund, A.; Hauge, A.; Hovde, A.; Rasse, D.P. Carbon Loss Estimates from Cultivated Peat Soils in Norway: A Comparison of Three Methods. Nutr. Cycl. Agroecosyst. 2008, 81, 157–167. [Google Scholar] [CrossRef]
  48. Pumpanen, J.; Ilvesniemi, H.; Perämäki, M.; Hari, P. Seasonal Patterns of Soil CO2 Efflux and Soil Air CO2 Concentration in a Scots Pine Forest: Comparison of Two Chamber Techniques. Glob. Chang. Biol. 2003, 9, 371–382. [Google Scholar] [CrossRef]
  49. Pumpanen, J.; Kolari, P.; Ilvesniemi, H.; Minkkinena, K.; Vesala, T.; Niinistö, S.; Lohila, A.; Larmola, T.; Morero, M.; Pihlatie, M.; et al. Comparison of Different Chamber Techniques for Measuring Soil CO2 Efflux. Agric. For. Meteorol. 2004, 123, 159–176. [Google Scholar] [CrossRef]
  50. Jensen, L.S.; Mueller, T.; Tate, K.R.; Ross, D.J.; Magid, J.; Neilsen, N.E. Soil Surface CO2 Flux as an Index of Soil Respiration in situ: A Comparison of Two Chamber Methods. Soil Biol. Biochem. 1996, 28, 1297–1306. [Google Scholar] [CrossRef]
  51. Department of Irrigation and Drainage. Water Management Guidelines for Agricultural Development in Lowland Peat Swamps of Sarawak; Department of Irrigation and Drainage, Sarawak: Sarawak, Malaysia, 2001. [Google Scholar]
  52. Jauhiainen, J.; Limin, S.; Silvennoinen, H.; Vasender, H. Carbon Dioxide and Methane Fluxes in Drained Tropical Peat Before and after Hydrological Restoration. Ecology 2008, 89, 3503–3514. [Google Scholar] [CrossRef]
  53. Price, J.S.; Schlotzhauer, S.M. Important of Shrinkage and Compression in Determining Water Storage Changes in Peat: The Case of a Mined Peatland. Hydrol. Process. 1999, 13, 2591–2601. [Google Scholar] [CrossRef]
  54. Schothorst, C.J. Subsidence of Low Moor Peat Soils in the Western Netherlands. Geoderma 1997, 17, 265–291. [Google Scholar] [CrossRef]
  55. Schothorst, C.J. Drainage and Behaviour of Peat Soils. In Symposium on Peat Lands Below Sea Level; ILRI Publication 30: Wageningen, The Netherlands, 1982; pp. 130–163. [Google Scholar]
  56. Nagano, T.; Osawa, K.; Ishida, T.; Sakai, K.; Vijarnsorn, P.; Jongskul, A.; Phetsuk, S.; Waijaroen, S.; Yamanoshita, T.; Norisada, M.; et al. Subsidence and Soil CO2 Efflux in Tropical Peatland in Southern Thailand under Various Water Table and Management Conditions. Mires Peat 2013, 11, 6. [Google Scholar]
  57. Couwenberg, J.; Hooijer, A. Towards Robust Subsidence-Based Soil Carbon Emission Factors for Peat Soils in South-east Asia, with Special Reference to Oil Palm Plantations. Mears Peat 2013, 12, 1. [Google Scholar]
  58. Warren, M.W.; Kauffman, J.B.; Murdiyarso, D.; Anshari, G.; Hergoualc’h, K.; Kurnianto, S.; Purbopuspito, J.; Gusmayanti, E.; Afifudin, M.; Rohajeo, J.; et al. A Cost-efficient Method to Assess Carbon Stocks in Tropical Peat Soil. Biogeosciences 2012, 9, 4477–4485. [Google Scholar] [CrossRef] [Green Version]
  59. Andriesse, J.P. Tropical Lowland Peats in South-East Asia; Communication No. 63; Royal Tropical Institute, Amsterdam, Department of Agricultural Research: Amsterdam, The Netherland, 1974. [Google Scholar]
  60. Melling, L.; Hatano, R.; Goh, K.J. Soil CO2 Flux from Three Ecosystems in Tropical Peatland of Sarawak, Malaysia. Tellus B Chem. Phys. Meteorol. 2005, 57, 1–11. [Google Scholar] [CrossRef]
  61. Abro, S.A.; Tian, X.; Wang, X.; Wu, F.; Kuyide, J.E. Decomposition Characteristic of Maize (Zea mays. L.) Strain with Different Carbon to Nitrogen (C/N) Ratios under Various Moisture Regimes. Afr. J. Biotechnol. 2011, 10, 10149–10156. [Google Scholar]
  62. Satrio, A.E.; Seca, G.; Osumanu, H.A.; Nik Muhamad, A.M. Influence of Chemical Properties on Soil Carbon Storage of a Tropical Peat Swamp Forest. Am. J. Appl. Sci. 2009, 6, 1969–1972. [Google Scholar] [CrossRef]
  63. Azizan, S.N.F.; Goto, Y.; Doi, T.; Kamardan, M.I.F.; Hara, H.; McTaggart, I.; Kai, T.; Noborio, K. Comparing GHG emissions from drained oil palm and recovering tropical peatland forests in Malaysia. Water 2021, 13, 3327. [Google Scholar] [CrossRef]
  64. Jiang, Z.; Bian, H.; Xu, L.; Li, M.; He, N. Pulse Effect of Precipitation: Spatial Patterns and Mechanisms of Soil Carbon Emissions. Front. Ecol. Evol. 2021, 9, 673310. [Google Scholar] [CrossRef]
  65. Xu, L.; McDermitt, D.; Arkebauer, T.; Baldocchi, D. Response of Soil CO2 Flux to Rain Events. In Proceedings of the AsiaFlux 2014, IRRI, Los Banos, Philippines, 18–24 August 2014; p. 25. [Google Scholar]
  66. Rochette, P.; Desjardins, R.L.; Pattey, E. Spatial and temporal variability of soil respiration in agricultural fields. Can. J. Soil Sci. 1991, 71, 189–196. [Google Scholar] [CrossRef]
Figure 1. The instrument layout at the one-hectare plot was kept free of vegetation in an oil palm estate in Sibu, Sarawak.
Agriculture 13 00622 g001
Figure 2. Monthly cumulative rainfall and water table (WT) with standard error bars.
Agriculture 13 00622 g002
Figure 3. The annual wind rose at the site.
Agriculture 13 00622 g003
Figure 4. Water table versus monthly cumulative rainfall.
Agriculture 13 00622 g004
Figure 5. The hourly, daily trend of the CO2 flux and air temperature at the site.
Agriculture 13 00622 g005
Figure 6. Monthly net ecosystem exchange (NEE) or CO2 emission rates measured using the eddy covariance (EC) technique.
Agriculture 13 00622 g006
Figure 7. Monthly mean soil CO2 efflux (SR), soil temperature (ST), and soil moisture (SM) with standard error bars.
Agriculture 13 00622 g007
Figure 8. Mean peat surface subsidence with error bars measured using five subsidence poles at the 1 ha site.
Agriculture 13 00622 g008
Figure 9. Mean CO2 flux with error bars was measured using the eddy covariance, soil chamber, and peat subsidence methods at the 1 ha site.
Agriculture 13 00622 g009
Table 1. Physical and chemical properties of peat soils from the site.
ParameterReading
Physical properties:
Bulk Density (g cm−3)0.16 ± 0.20
Water Fill Pore Space (%)51.46 ± 1.10
Chemical properties:
Carbon (%)54.41 ± 0.86
Nitrogen (%)1.84 ± 0.06
C:N ratio30.50 ± 1.13
Table 2. Peat CO2 emissions measured at the site.
TechniqueCO2 µmol m−2 s−1CO2 t ha−1 yr−1
(estimated)
Eddy Covariance4.94 ± 0.1268.55
Closed Chamber EGM-4 Survey **4.19 ± 0.2258.14
Subsidence/yearCO2-eq t ha−1 yr−1
Peat Subsidence1.9 cm36.12 *
* CO2 loss was calculated from the peat subsidence, bulk density, carbon content, and oxidation components. The equation to estimate carbon loss from peat subsidence was described in detail by Wösten et al. (1997). ** EGM-4 survey (n = 197).
Disclaimer/Publisher’s Note: The statements, opinions and data contained in all publications are solely those of the individual author(s) and contributor(s) and not of MDPI and/or the editor(s). MDPI and/or the editor(s) disclaim responsibility for any injury to people or property resulting from any ideas, methods, instructions or products referred to in the content.

