
Assessment of the Use of Infrared Laser for Dynamic Laser Speckle (DLS) Technique

 , , and
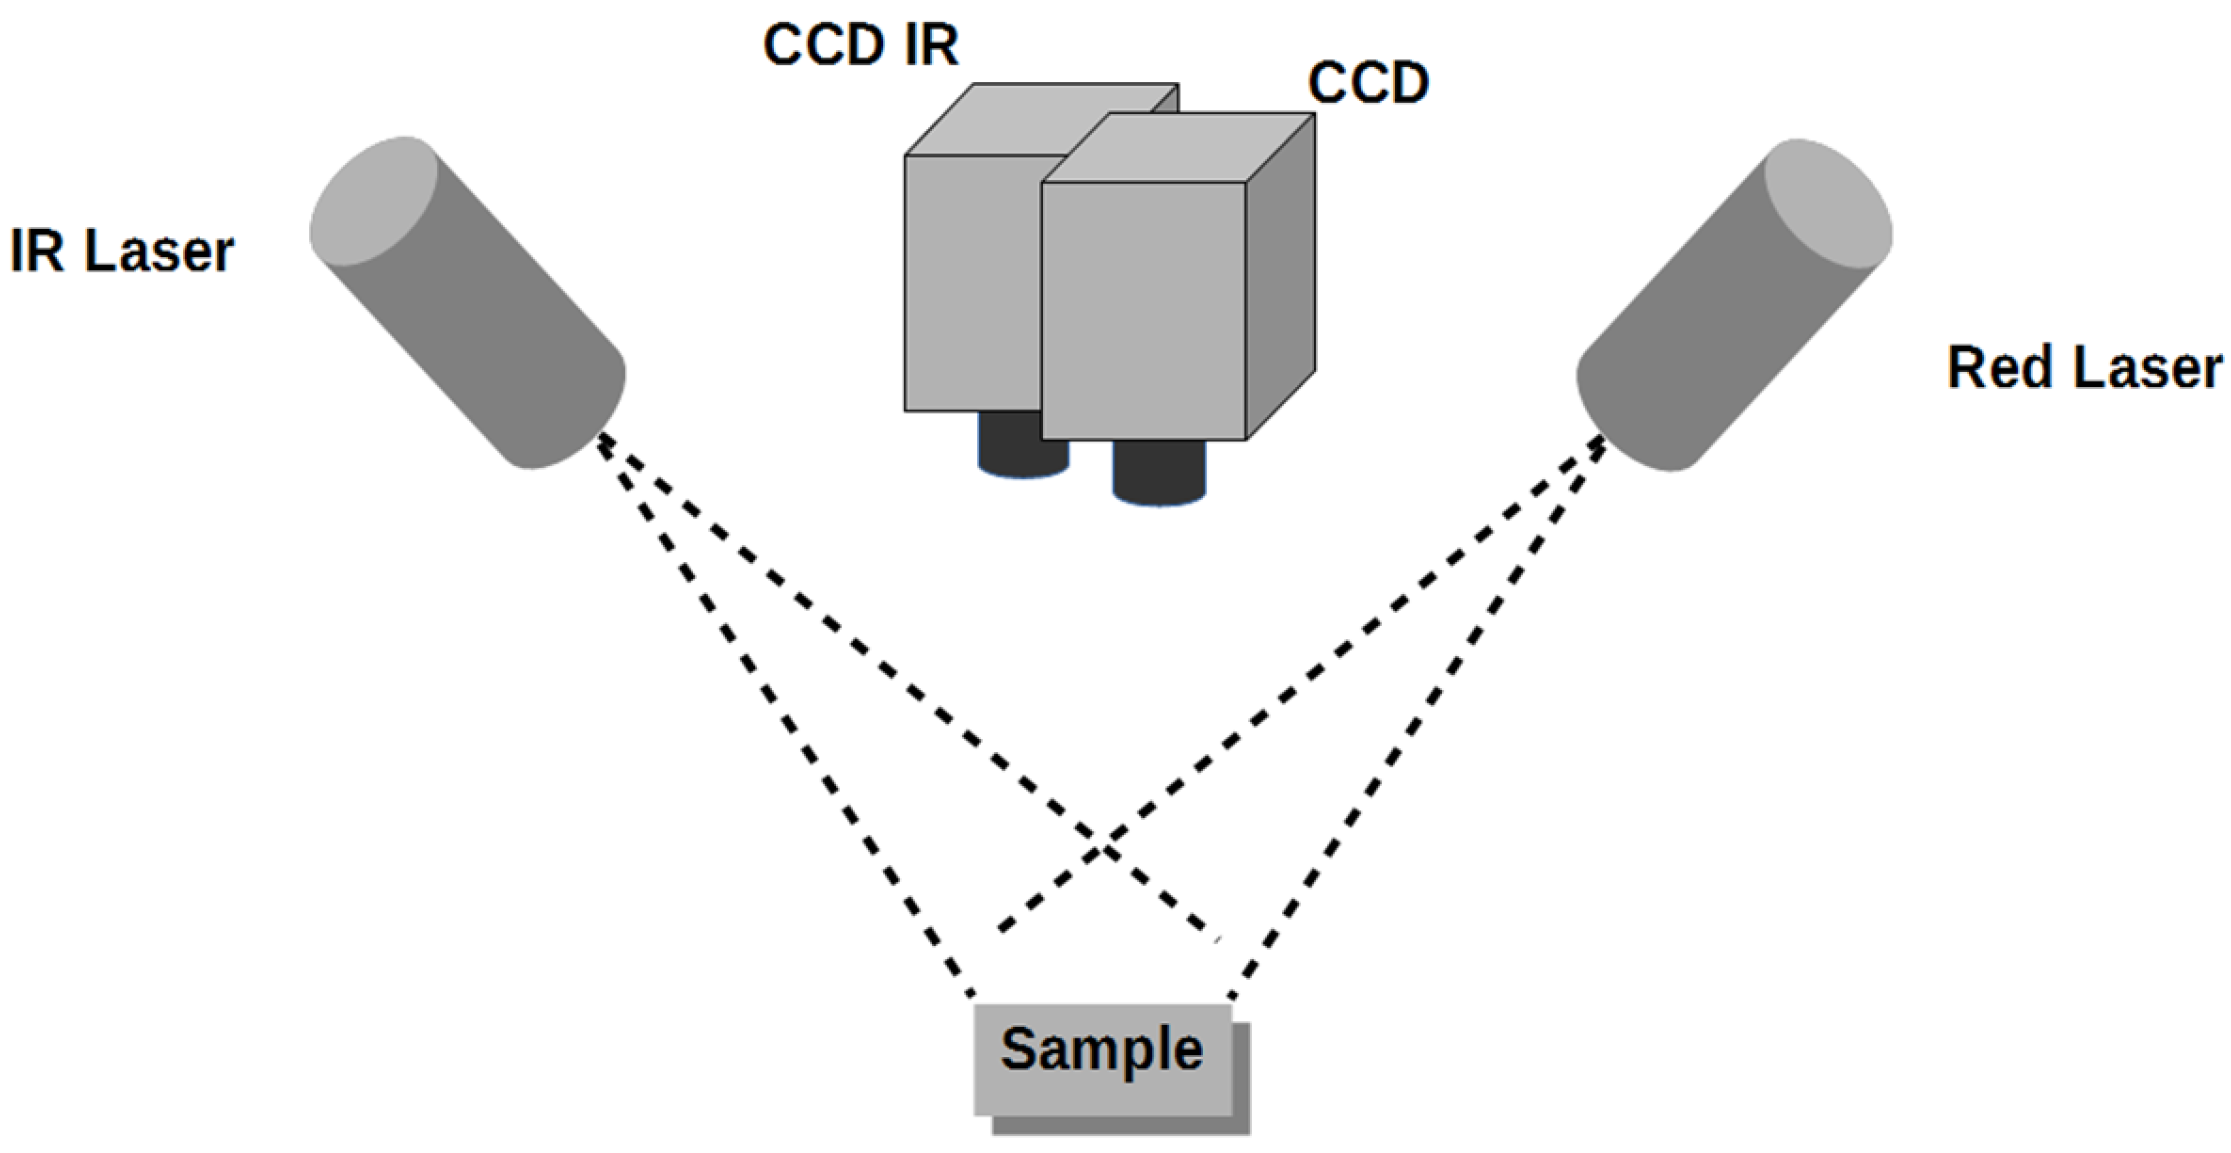
Abstract
:1. Introduction
2. Materials and Methods
2.1. Image Acquisition Set-Up
2.2. Testing of Pigment Effects Using Drying Paints
2.3. Plant Growth
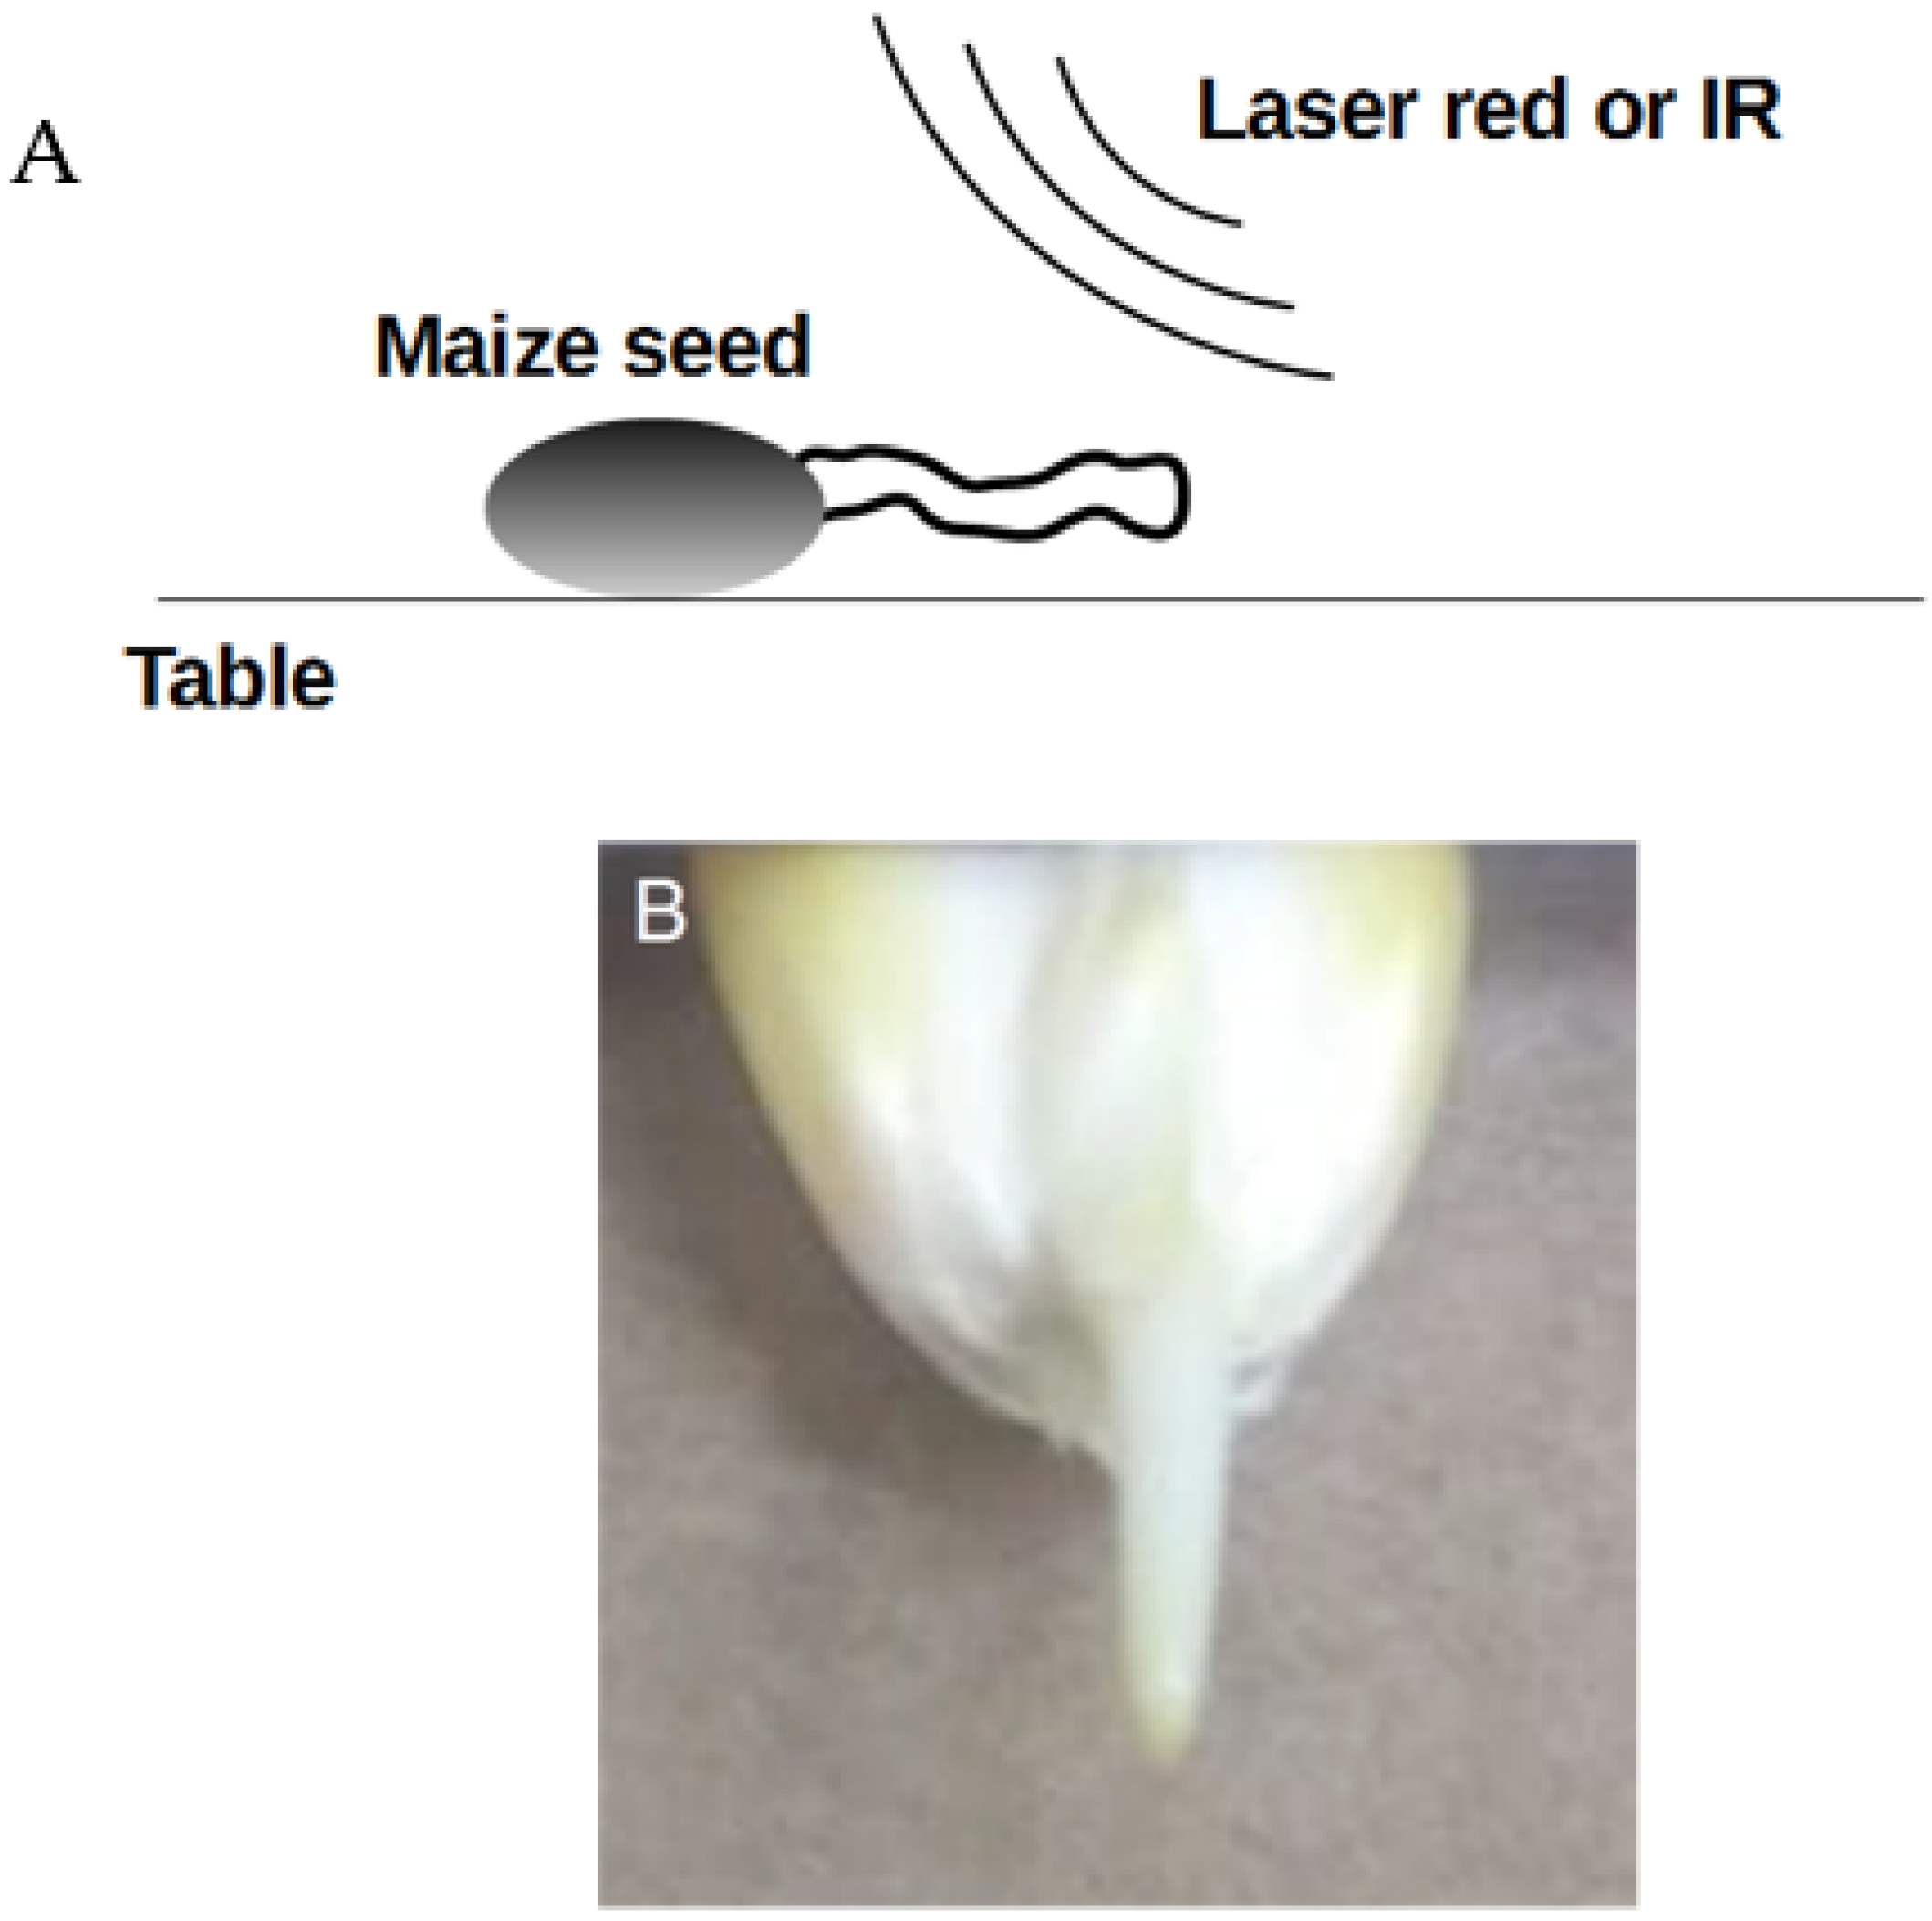
2.4. Direct Illumination of Maize Seedlings with Red and IR Lasers
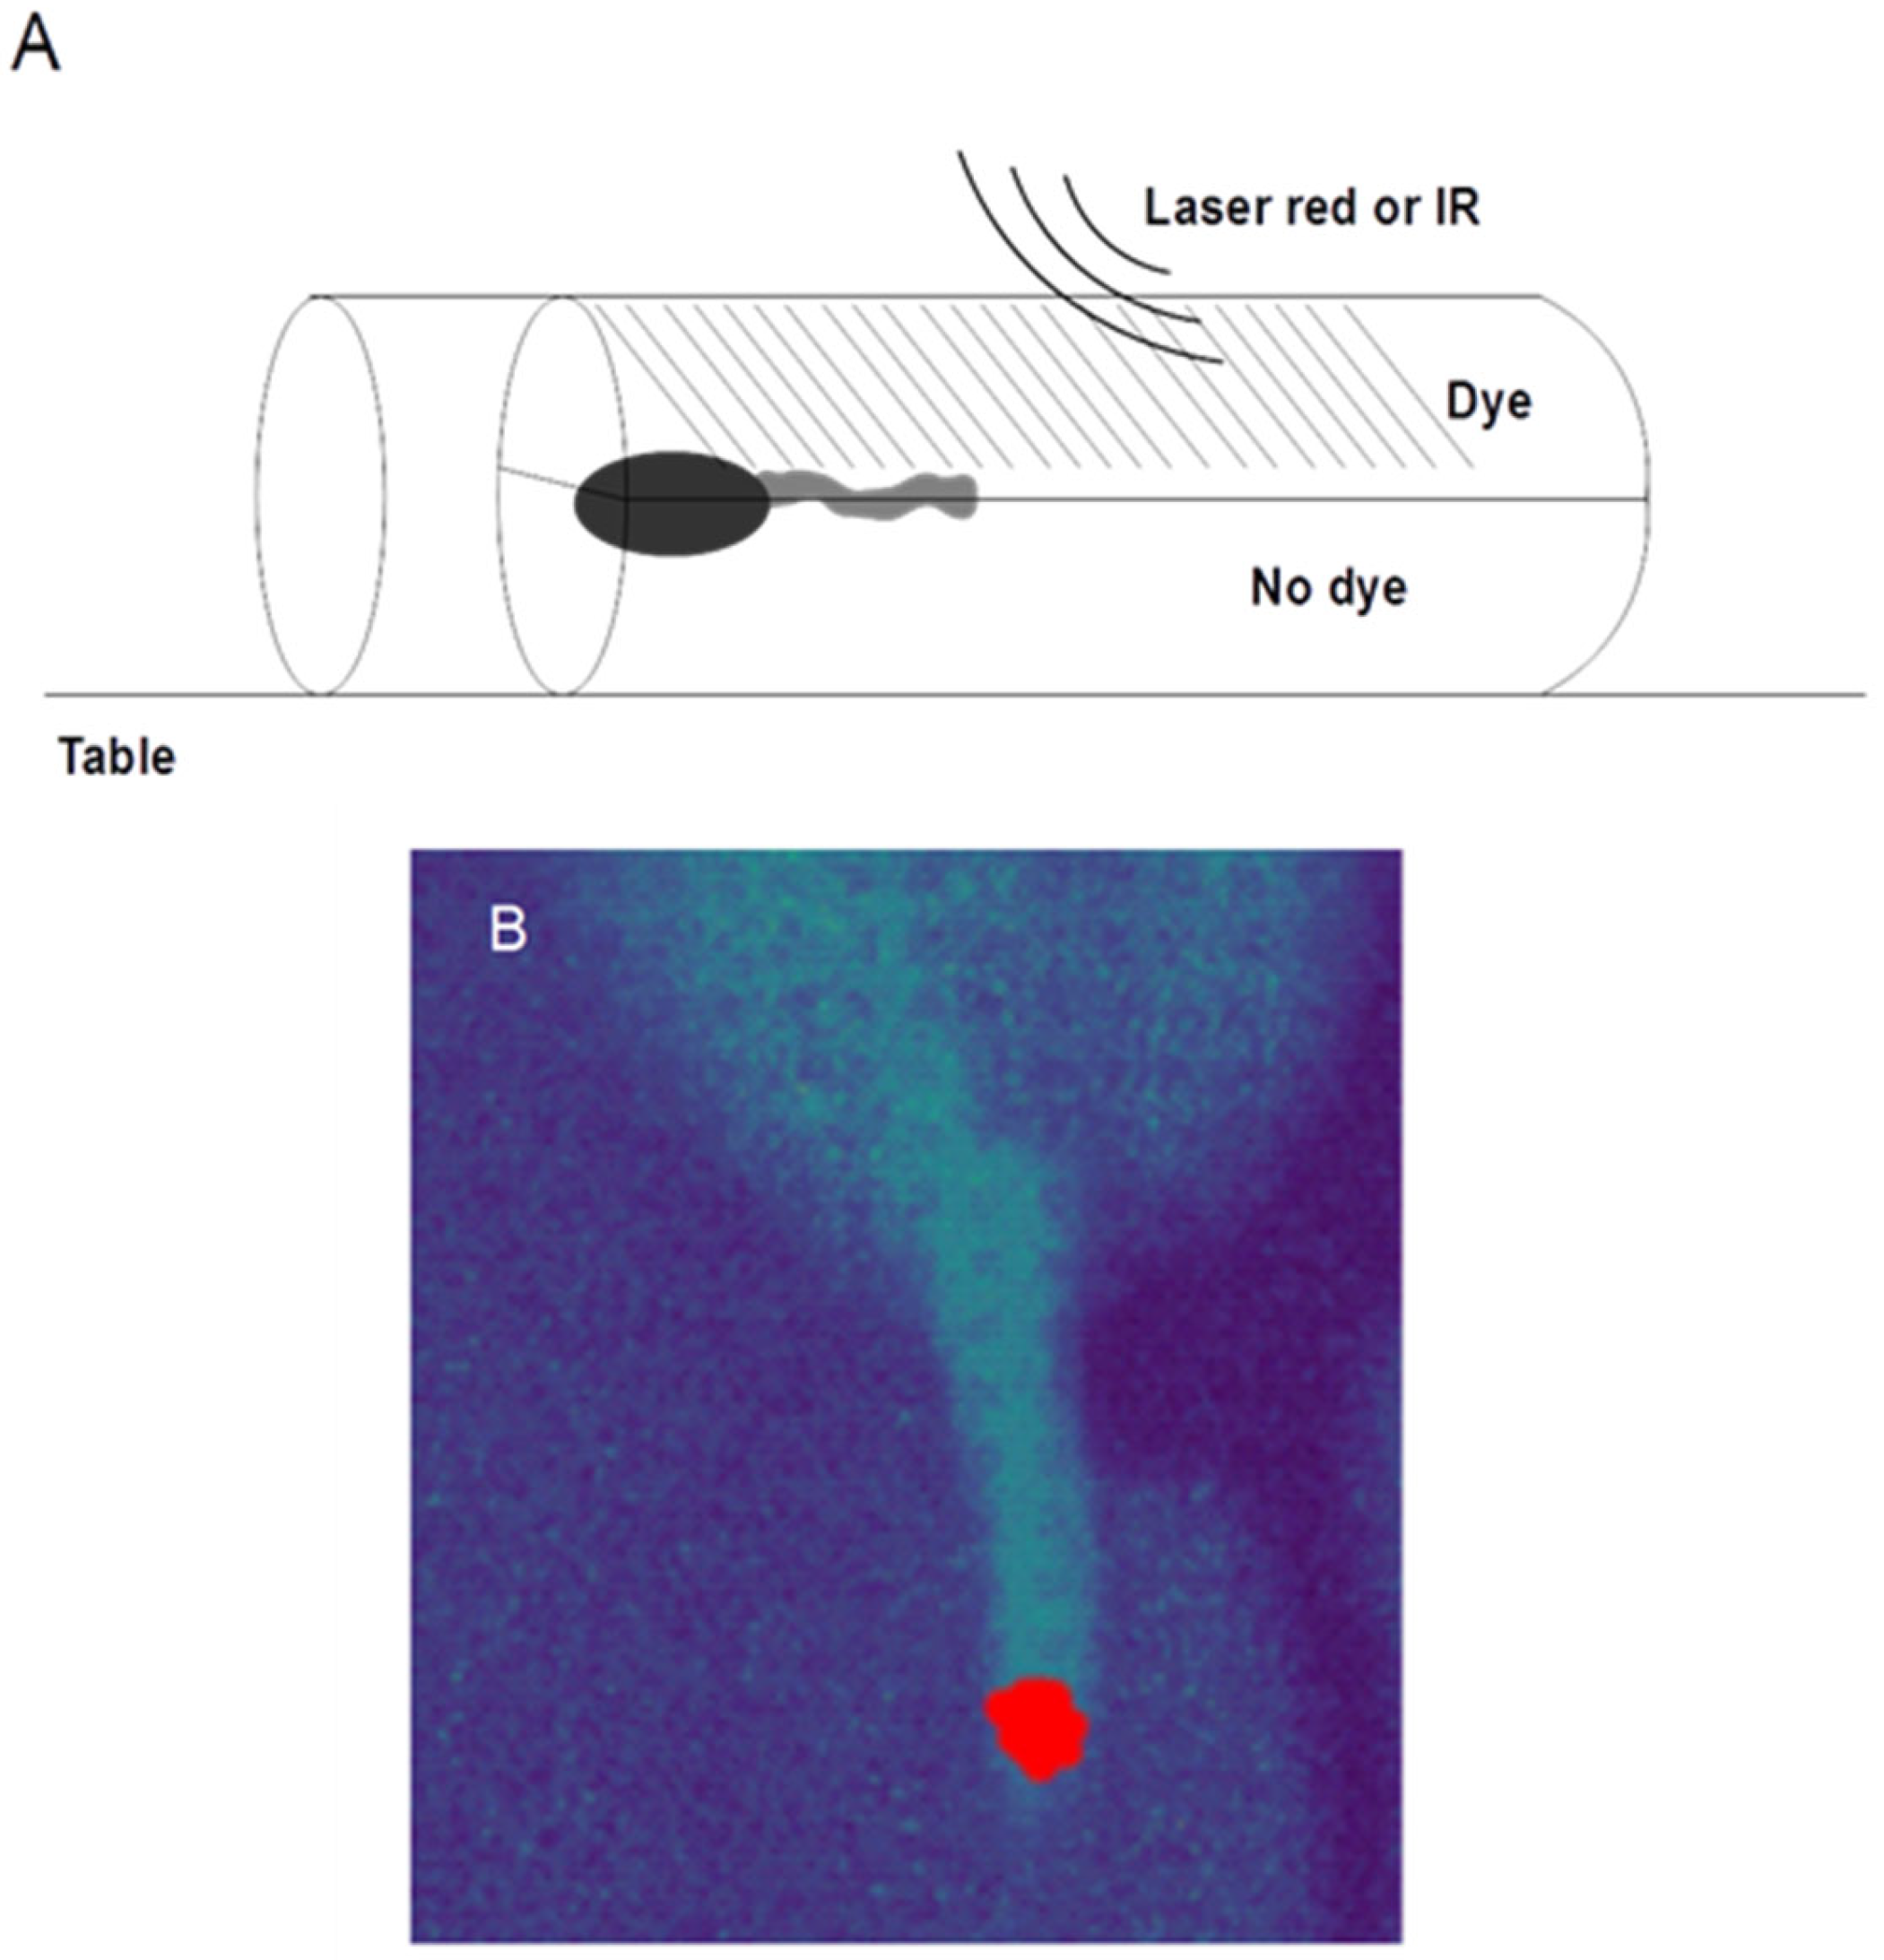
2.5. Effects of Substrate Transmittance on DLS Measurement
2.6. Data Analysis
3. Results and Discussions
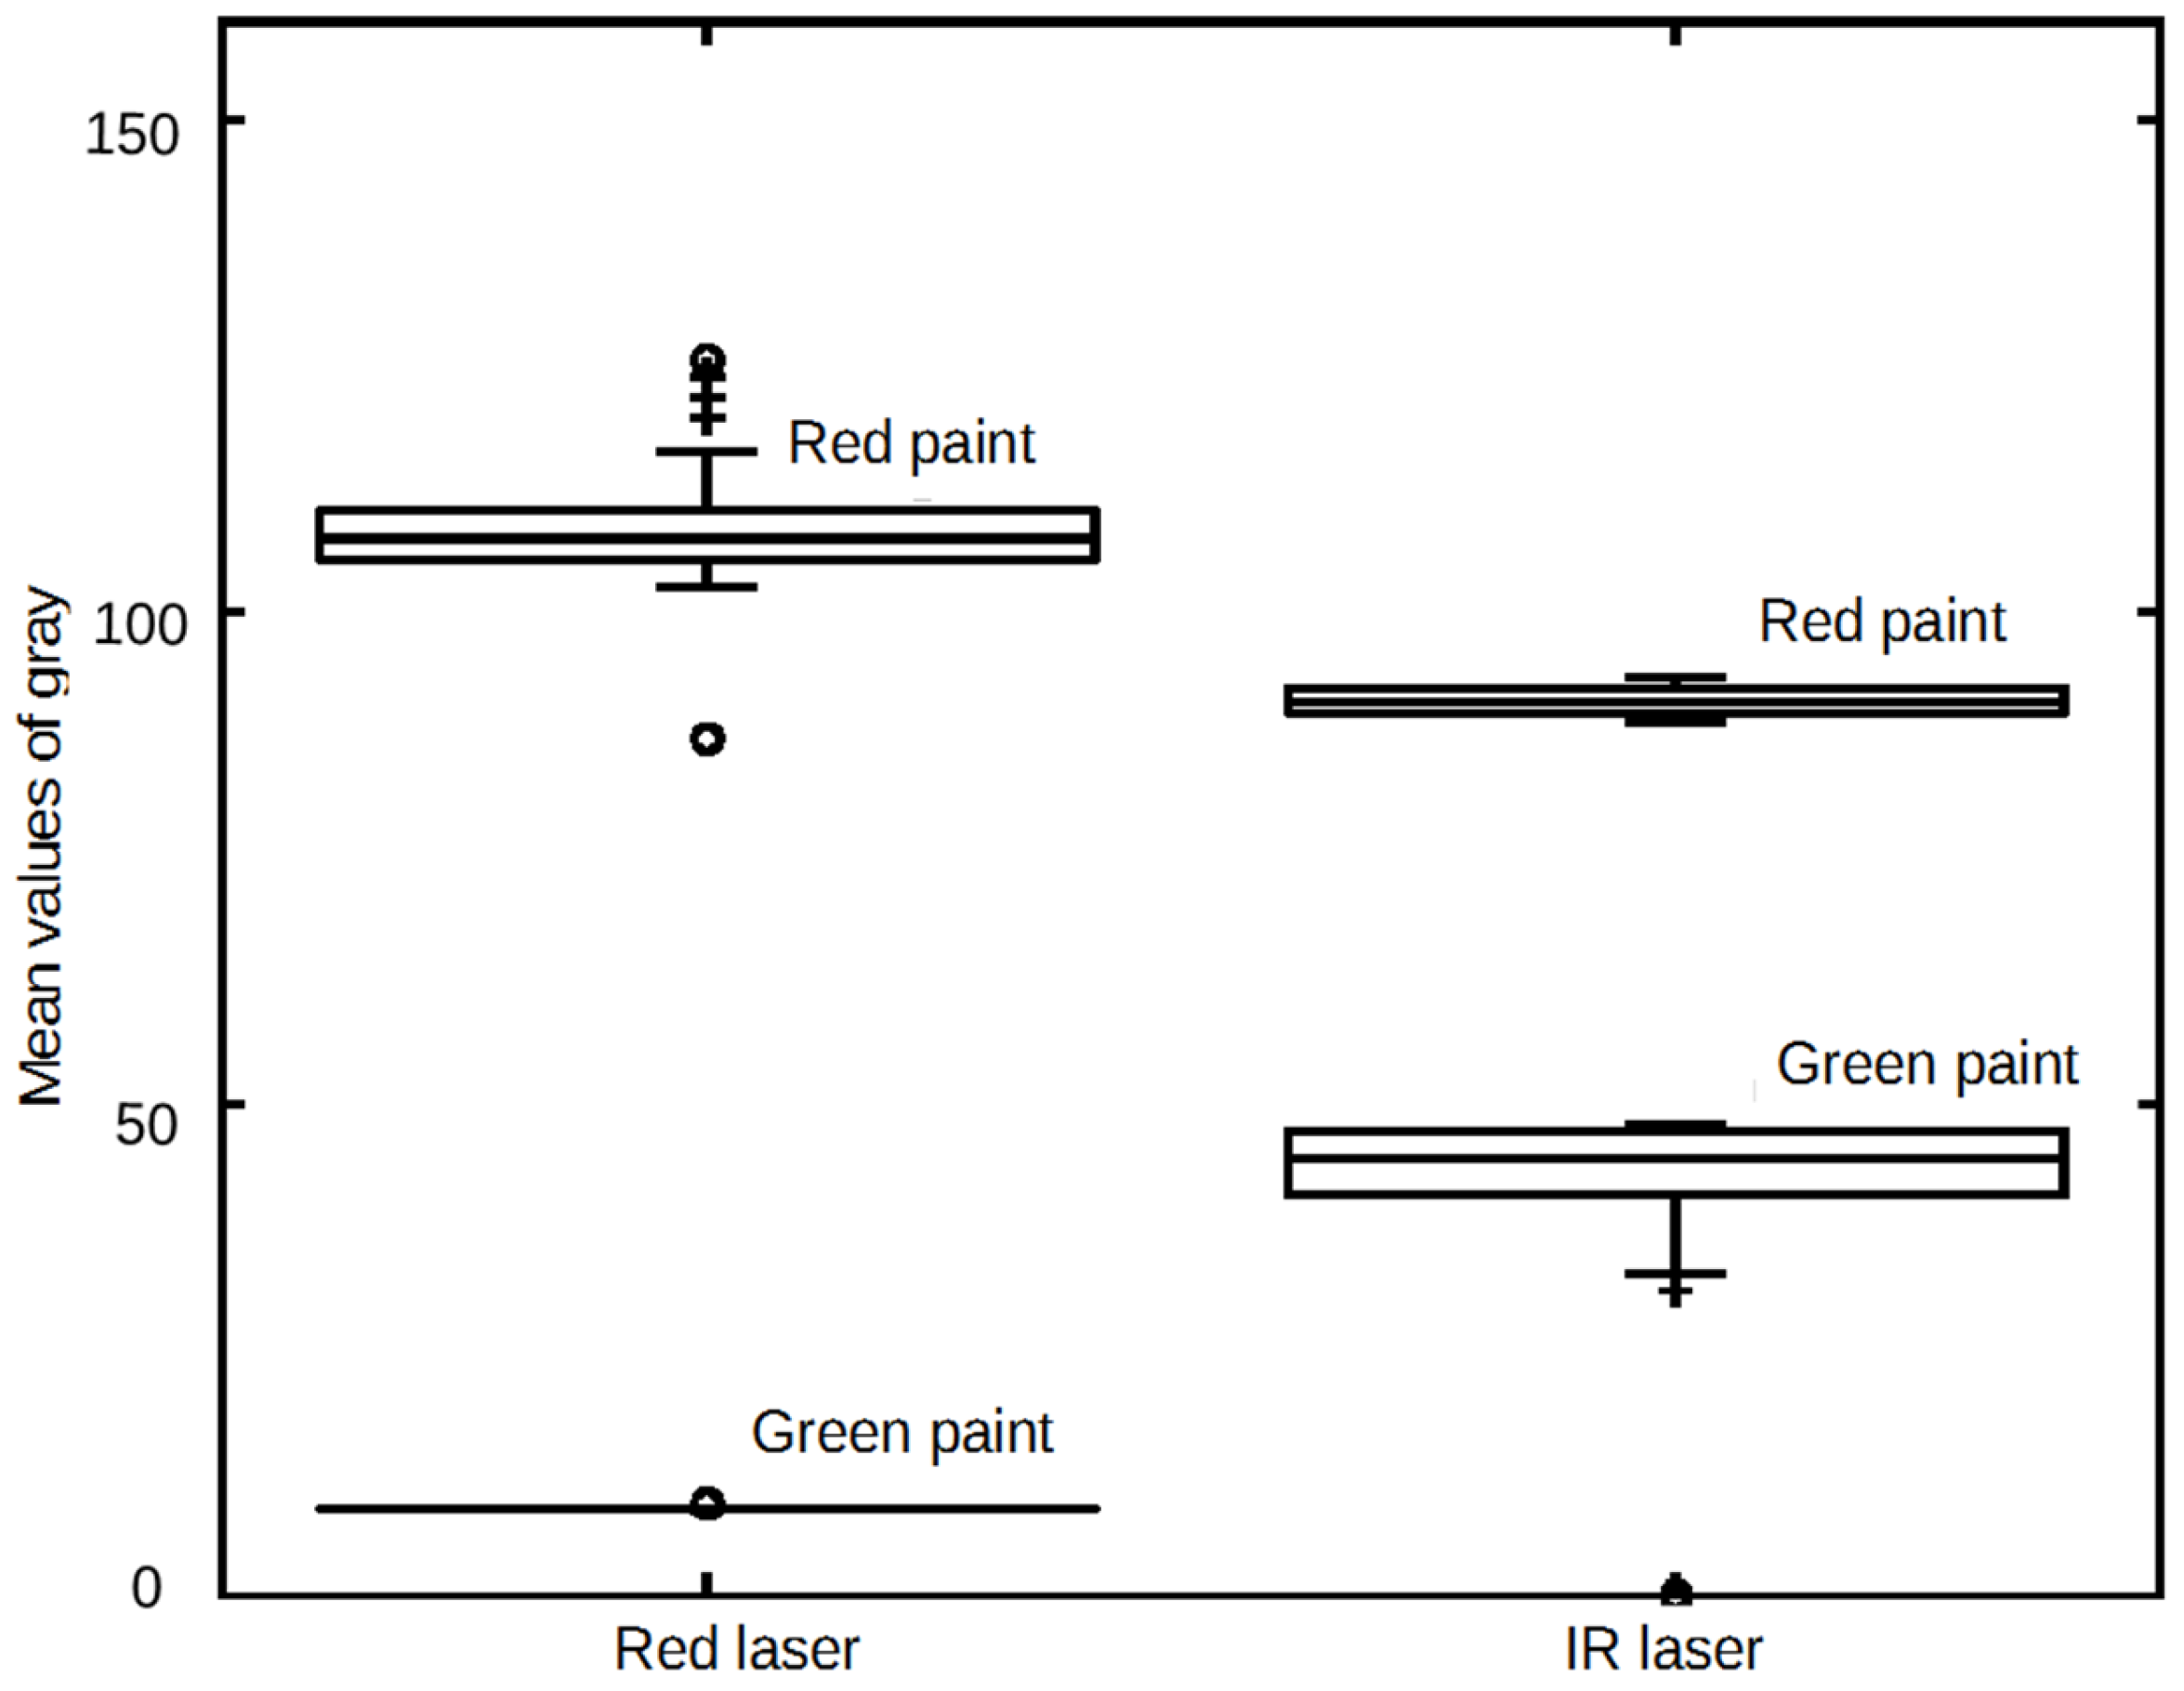
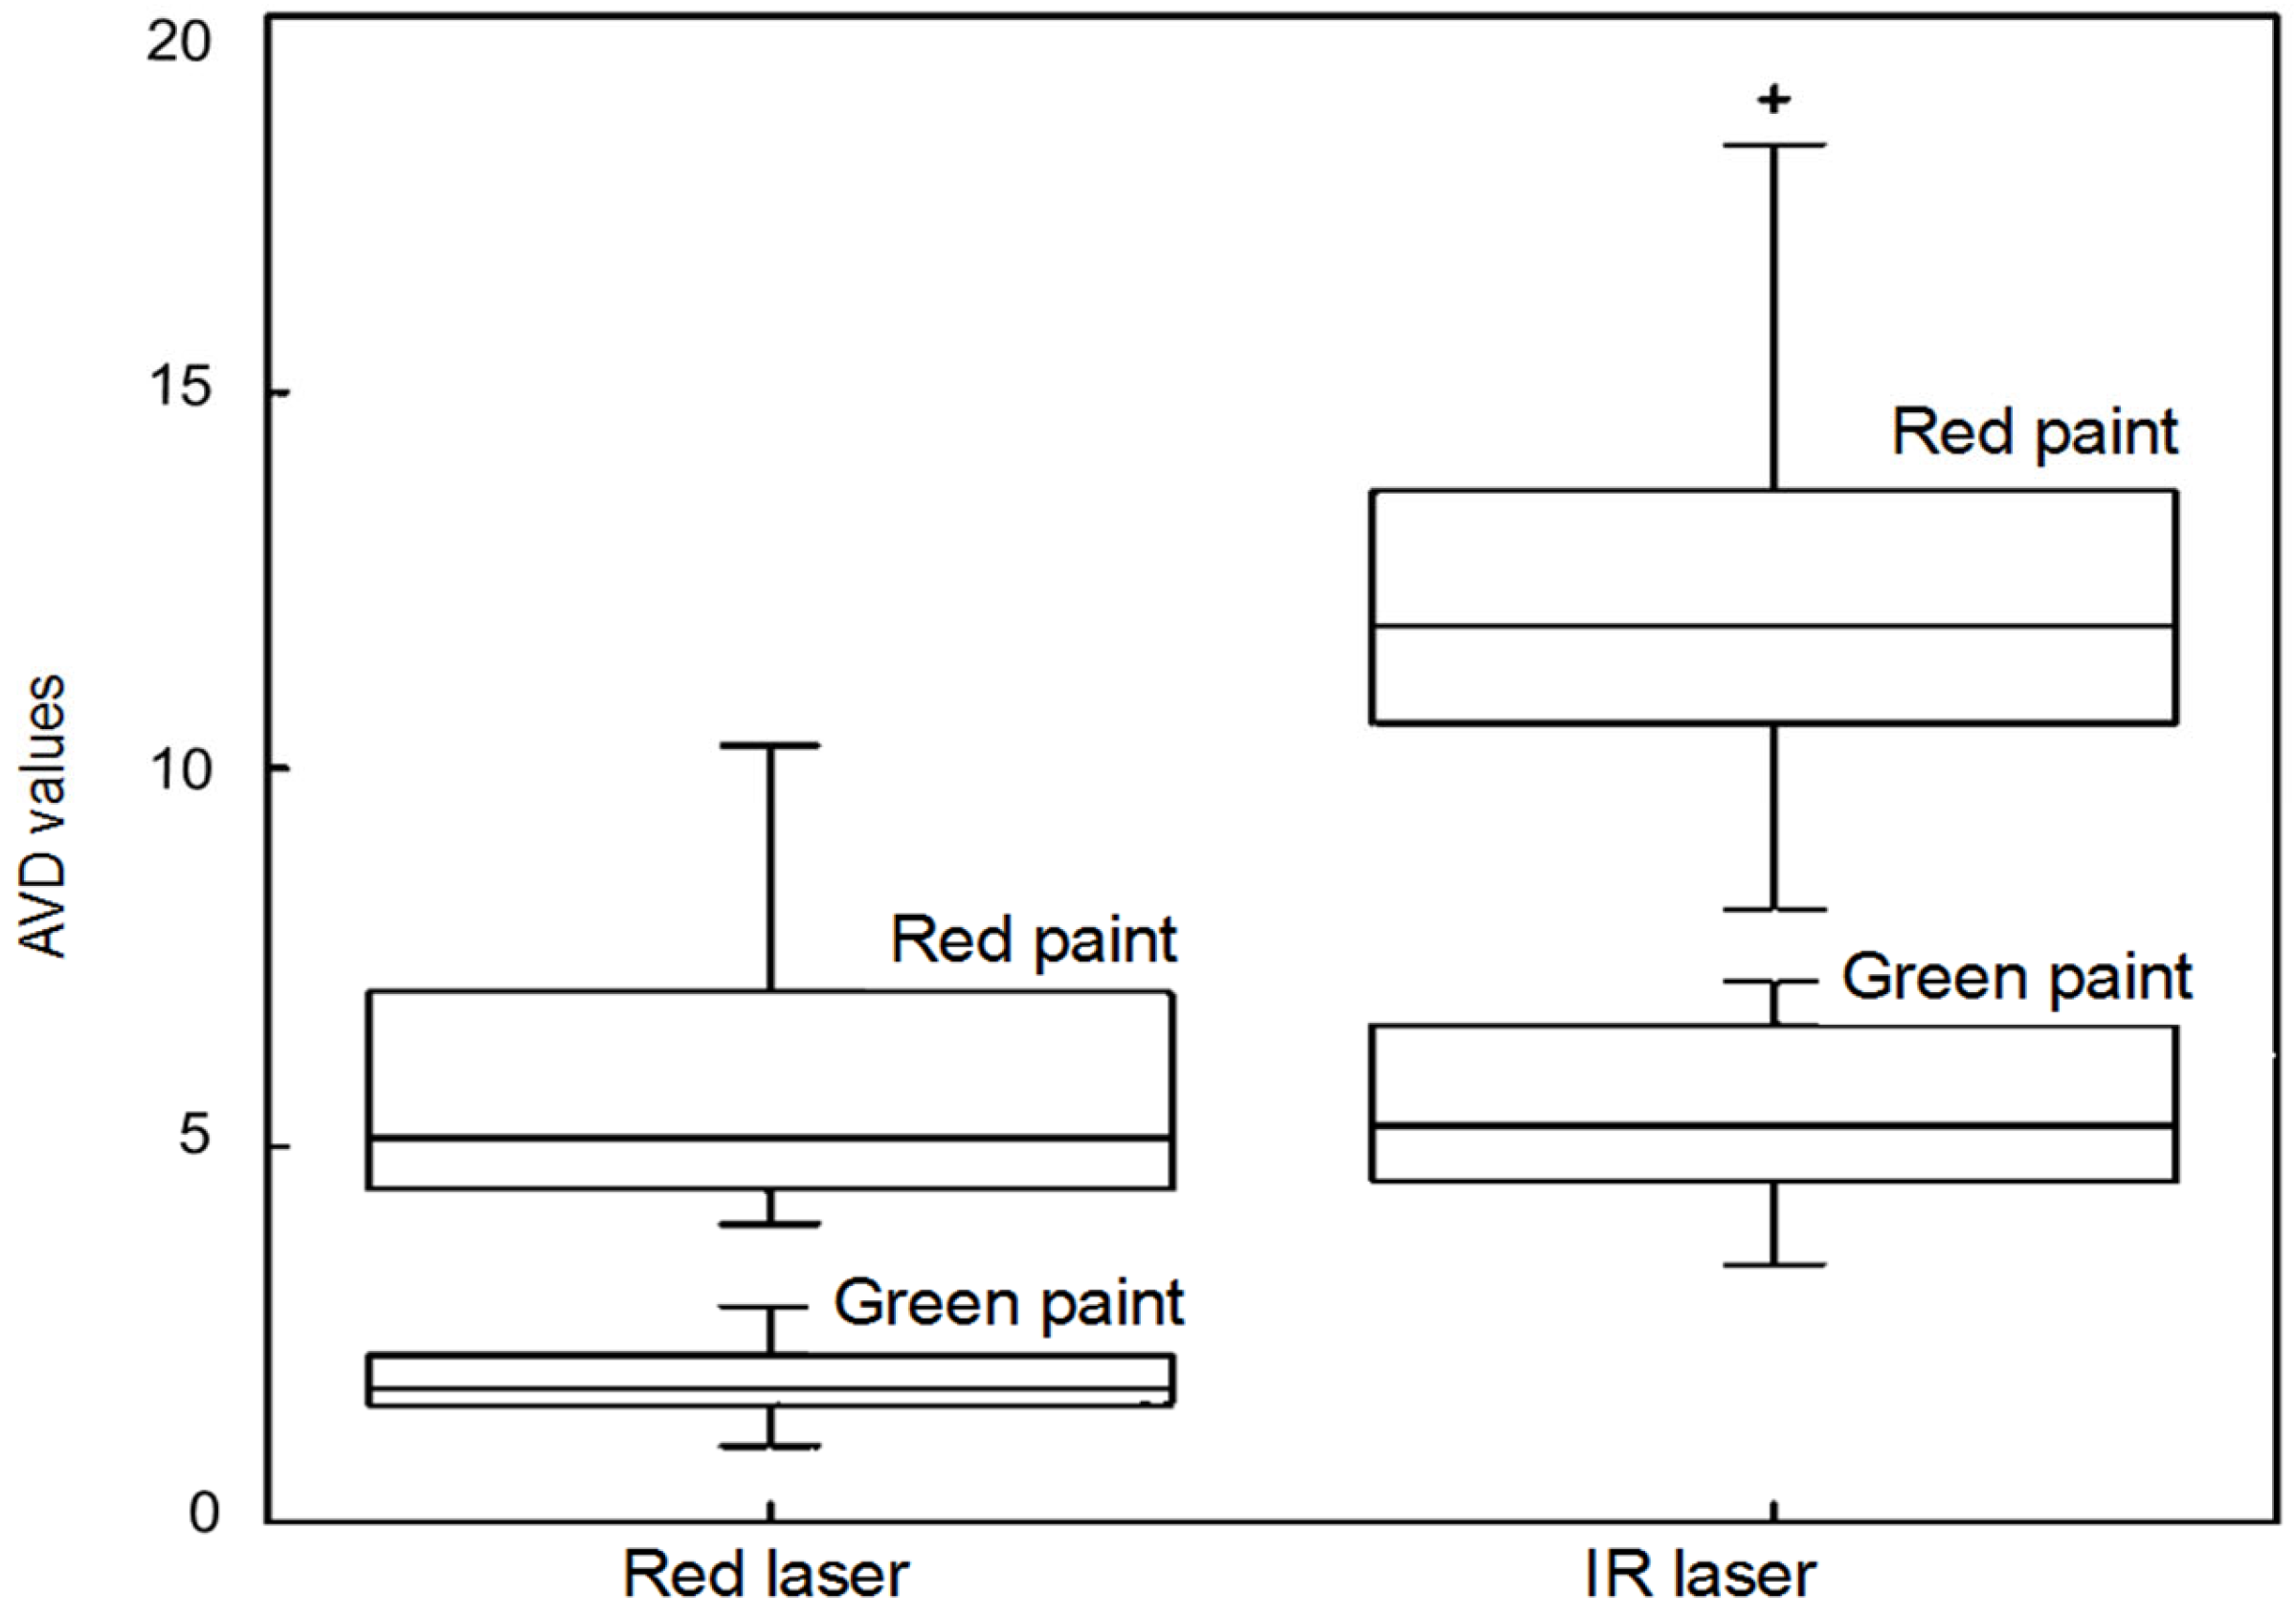
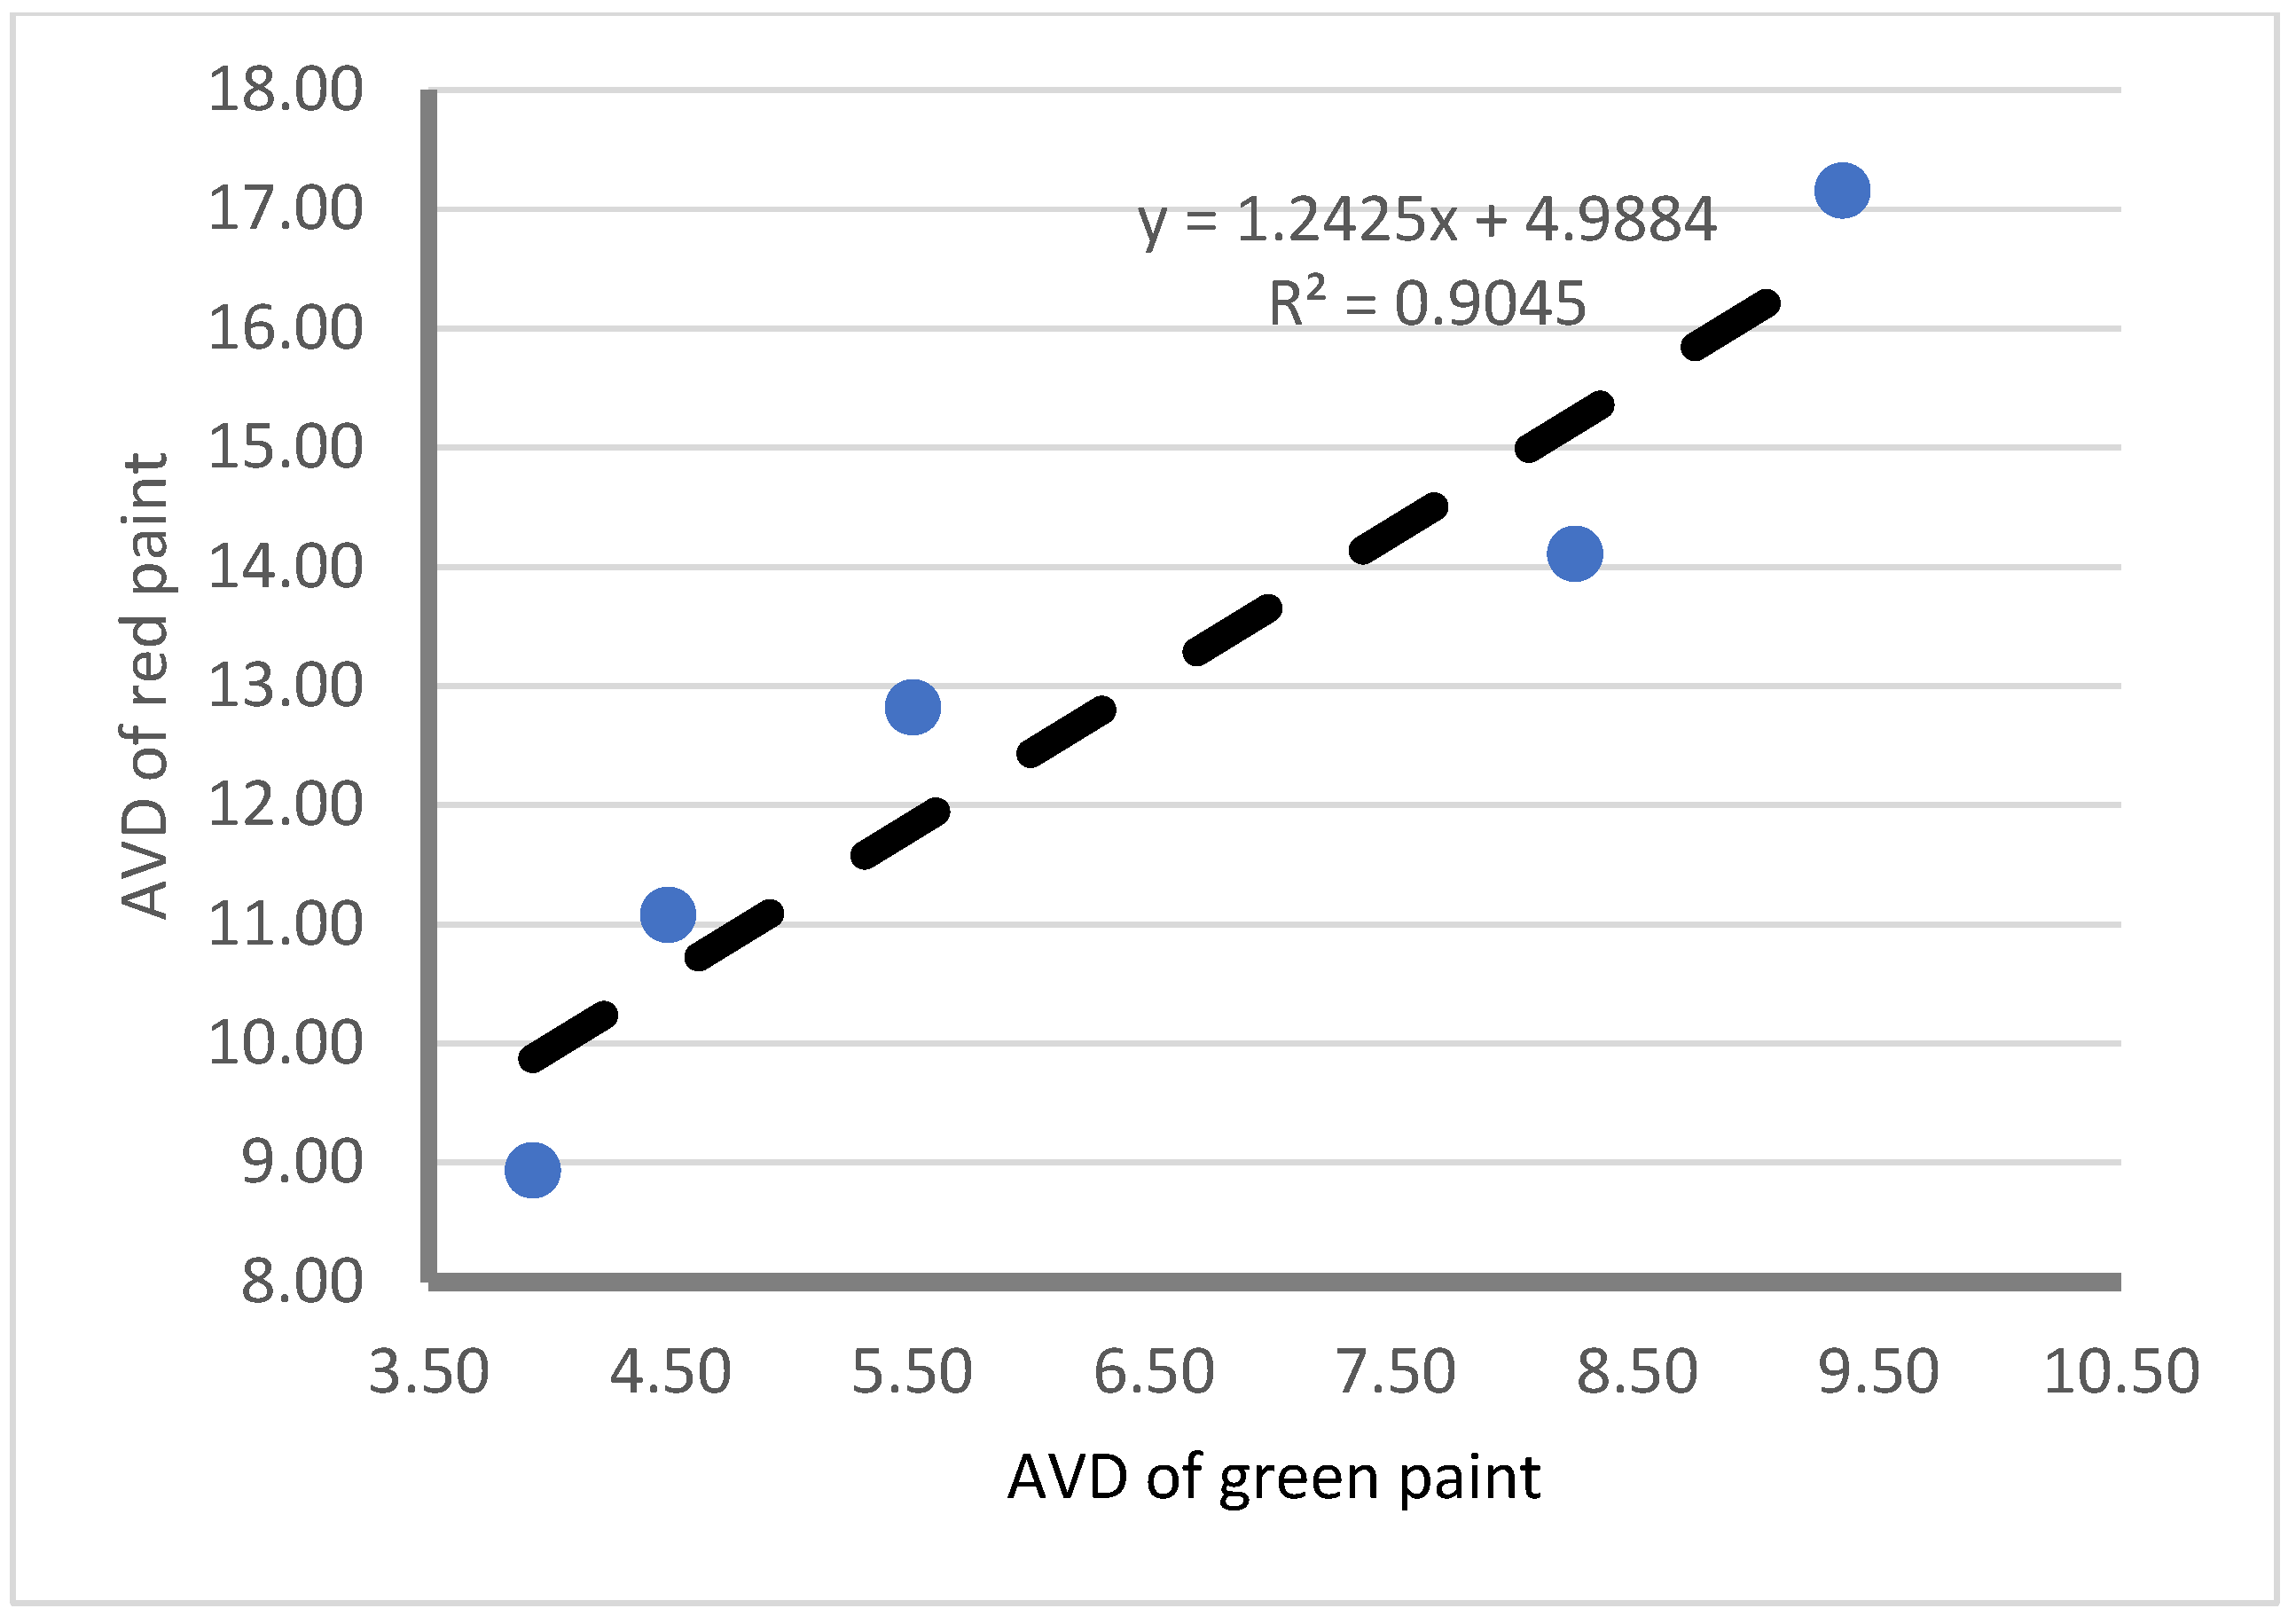
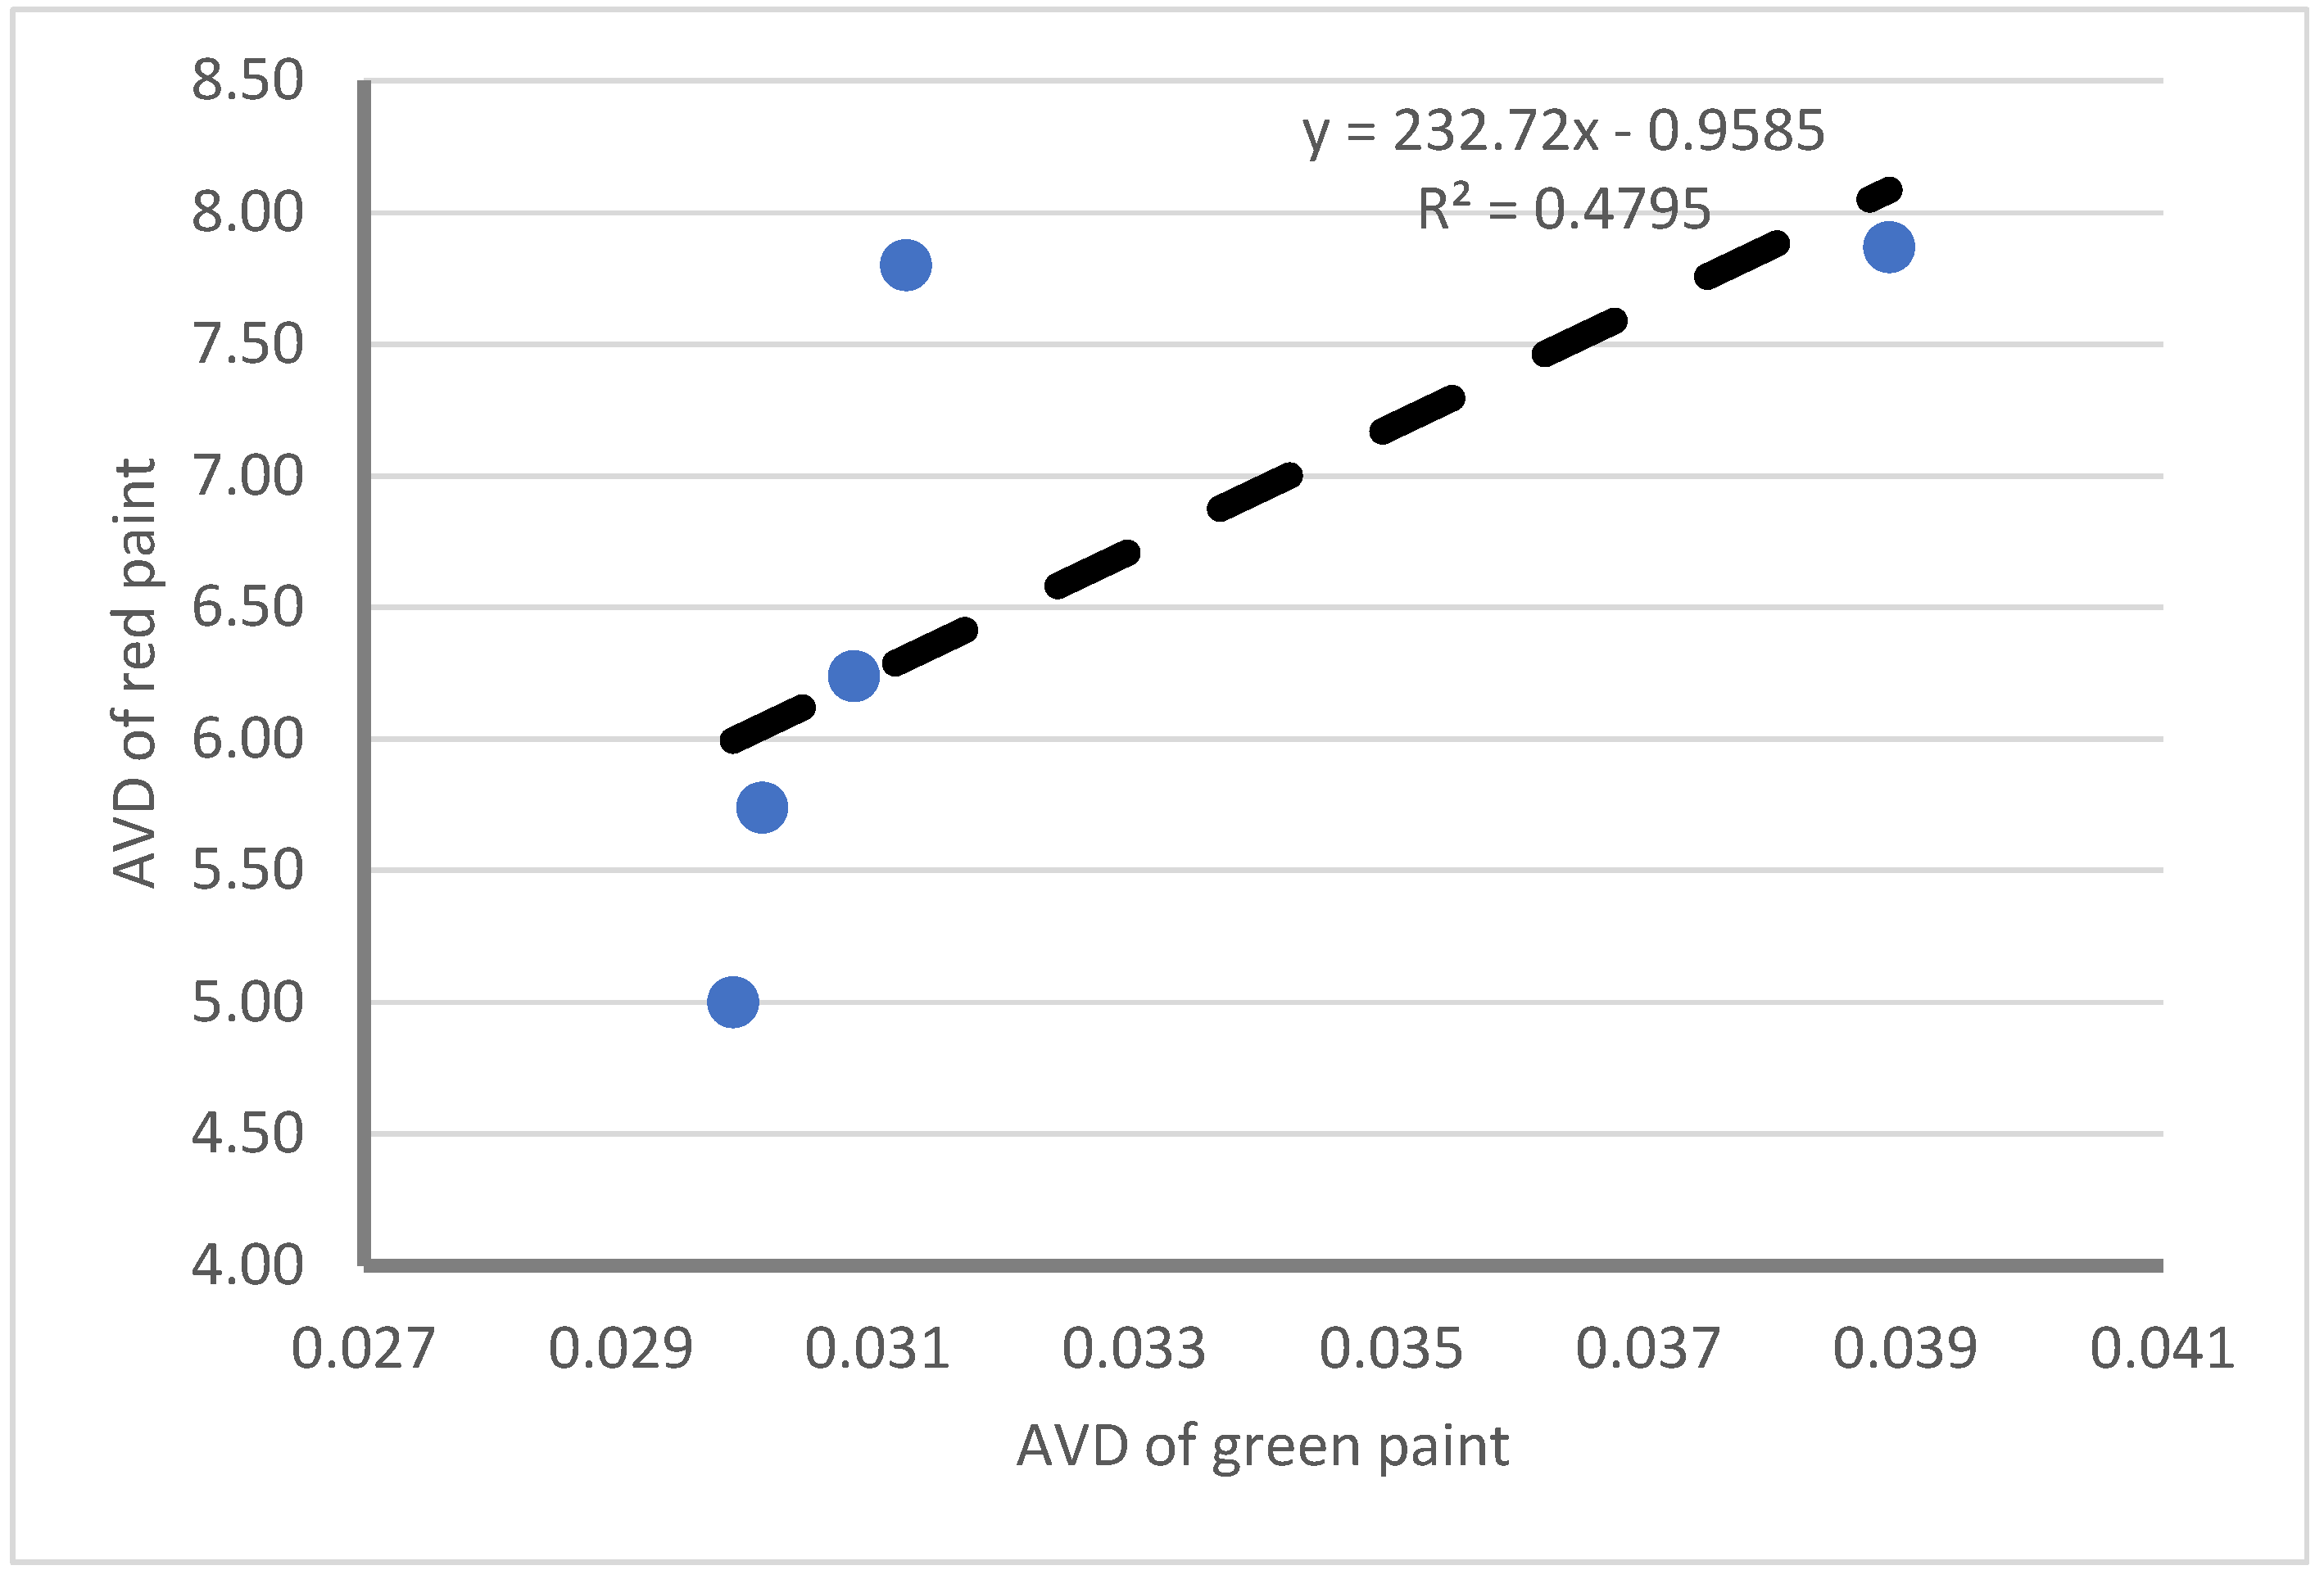
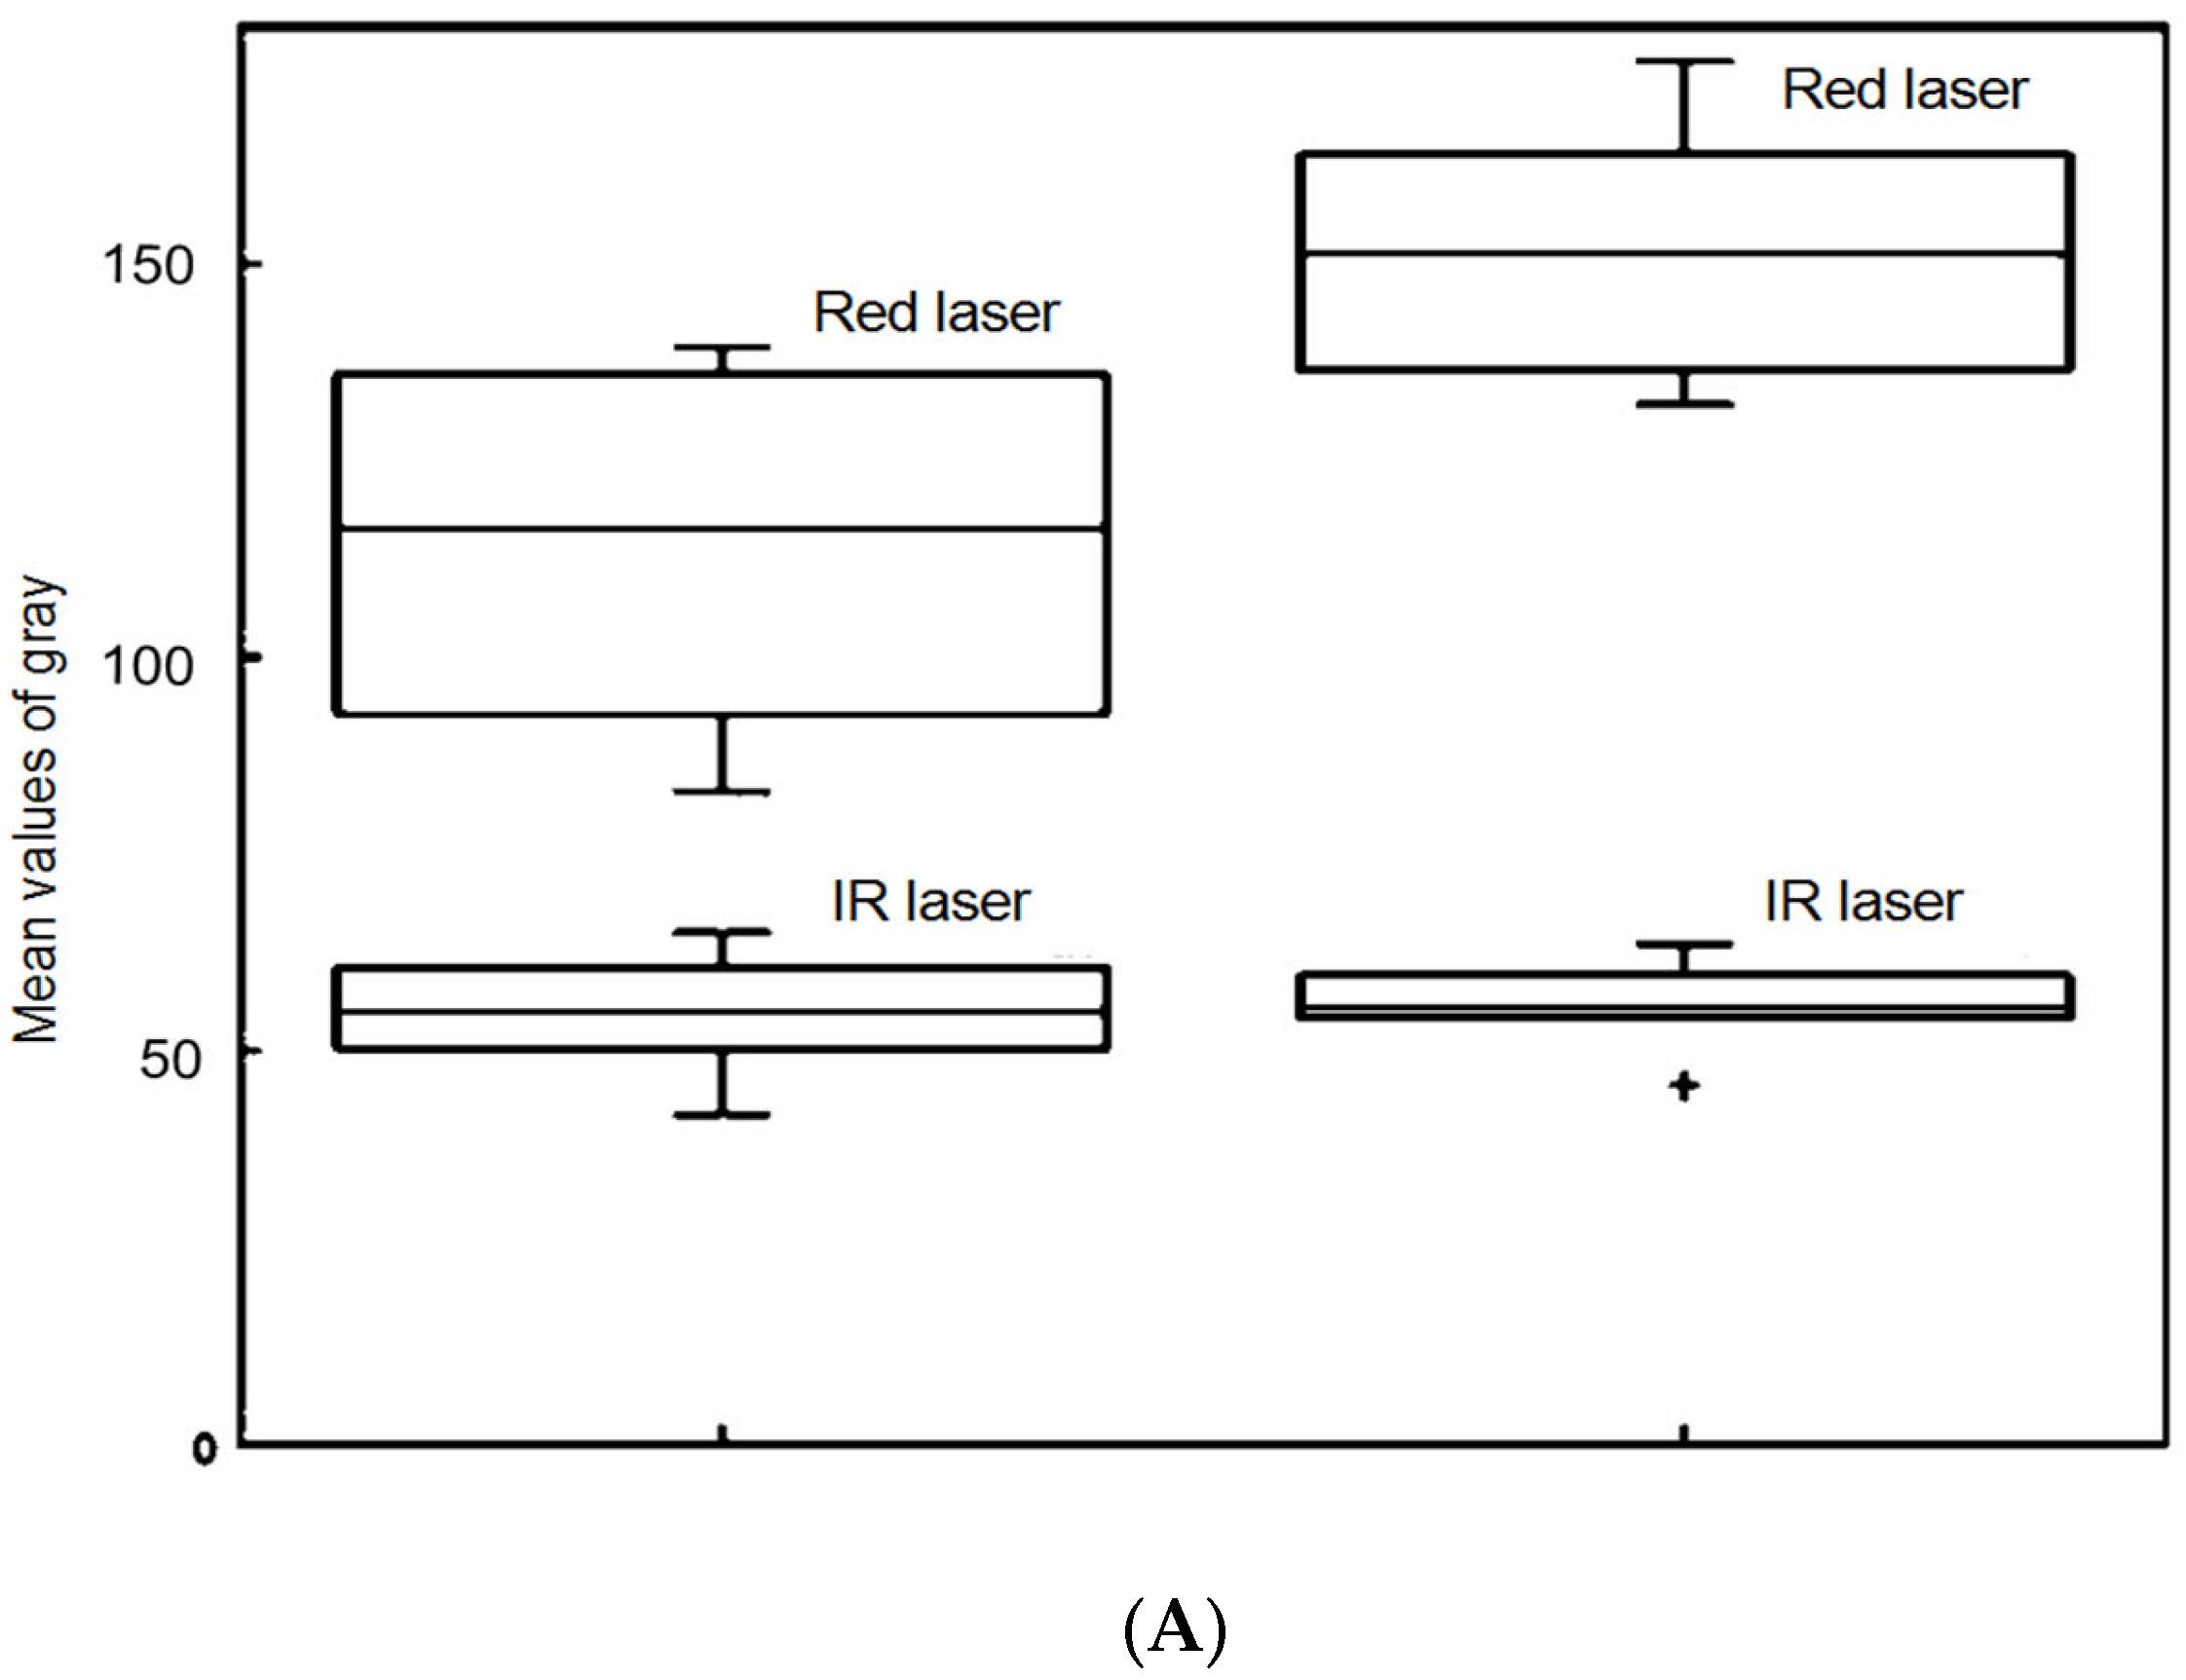
3.1. The Effect of Pigments on DLS Measurements from IR and Red Lasers
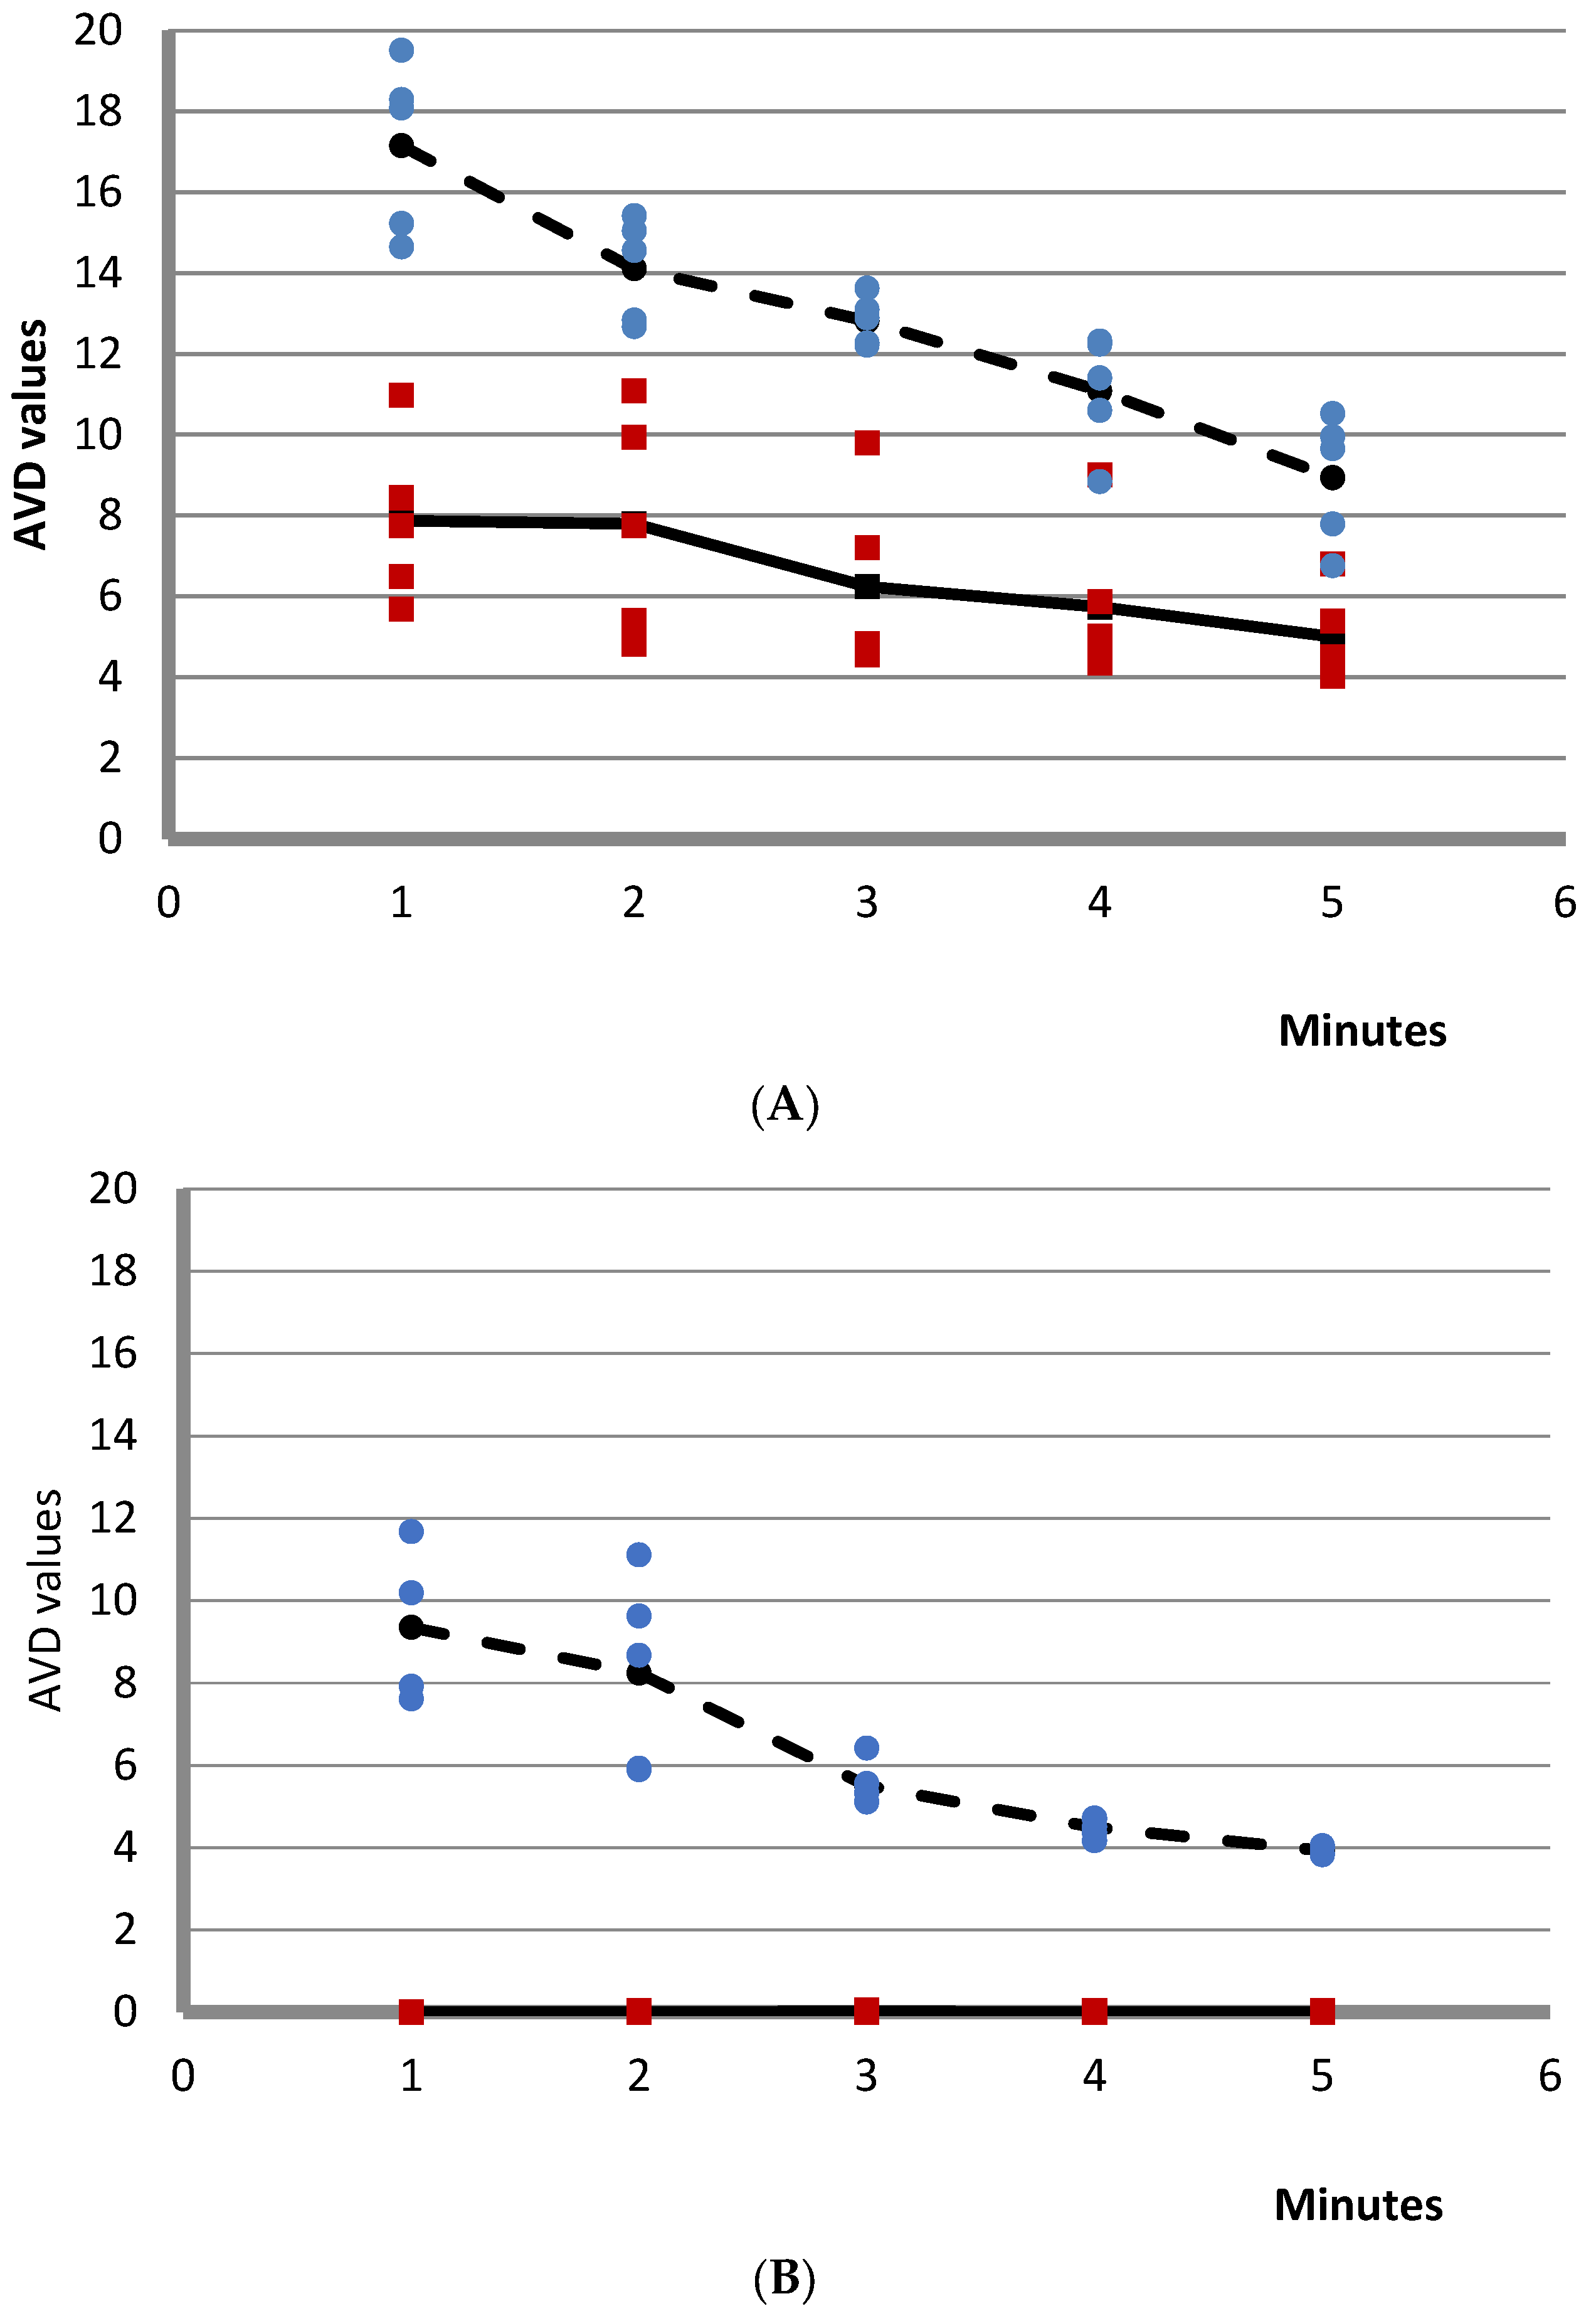
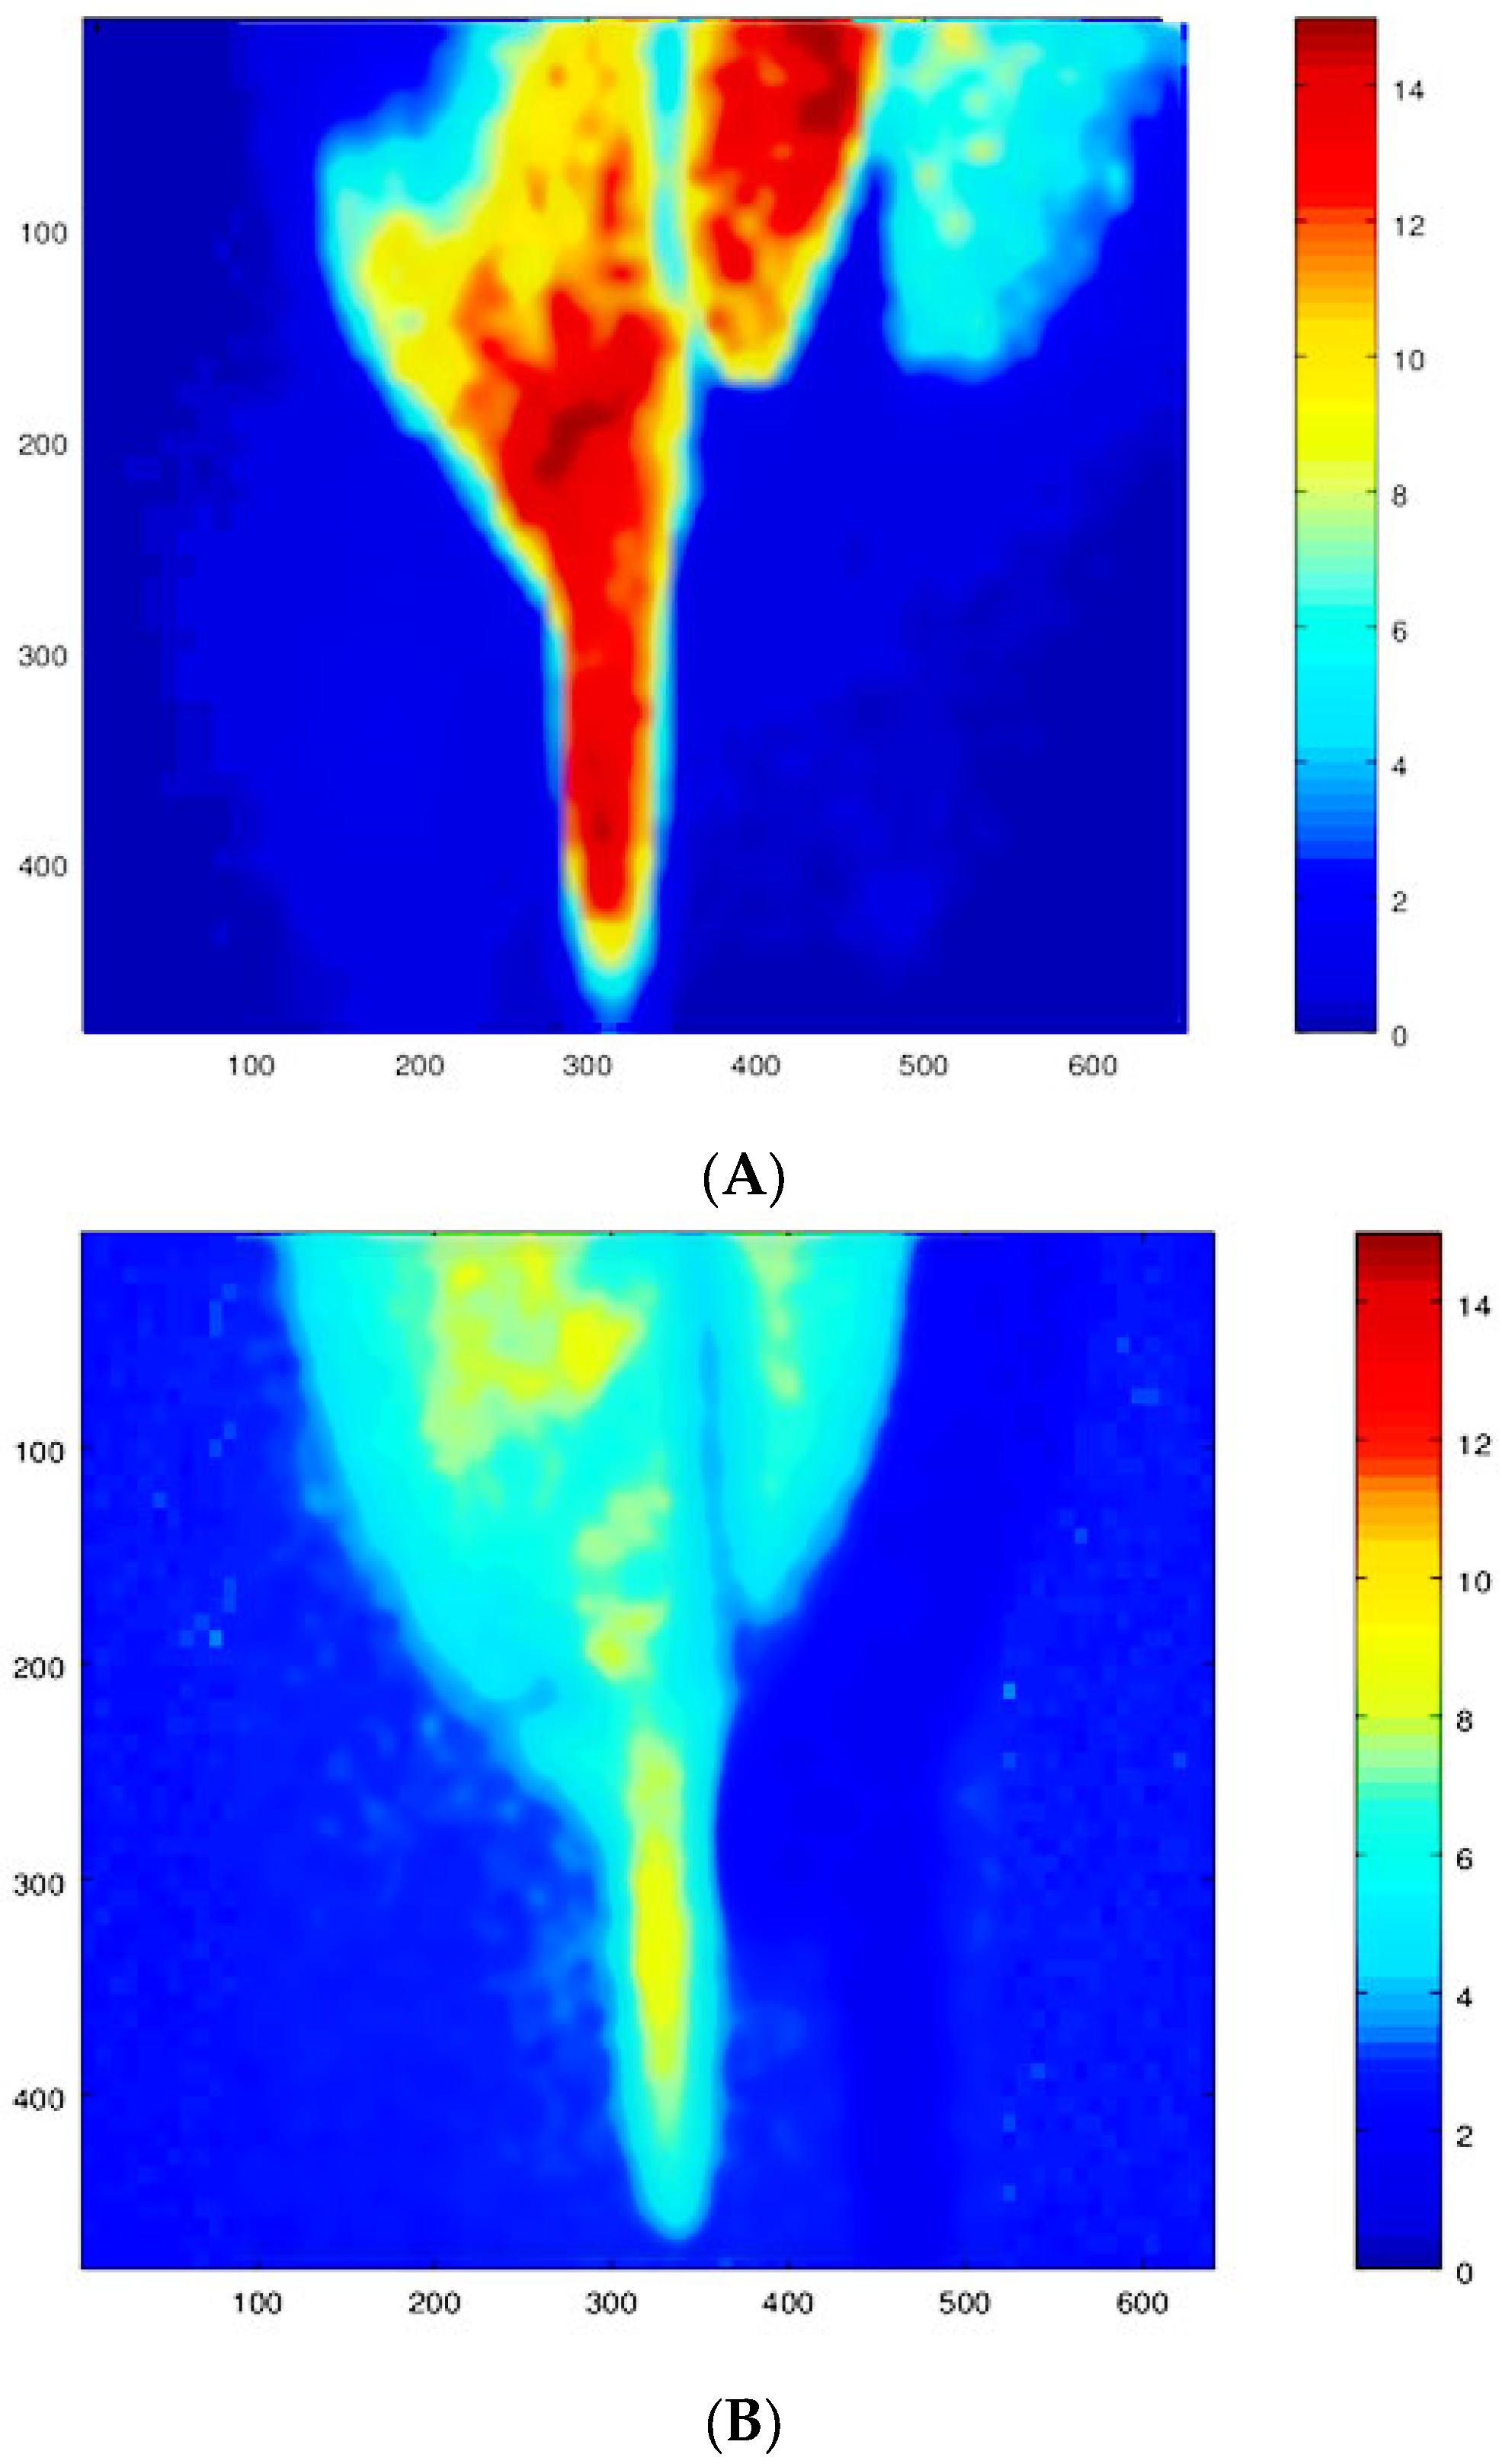
3.2. Direct Illumination of a Maize Seed Using Red and IR Lasers
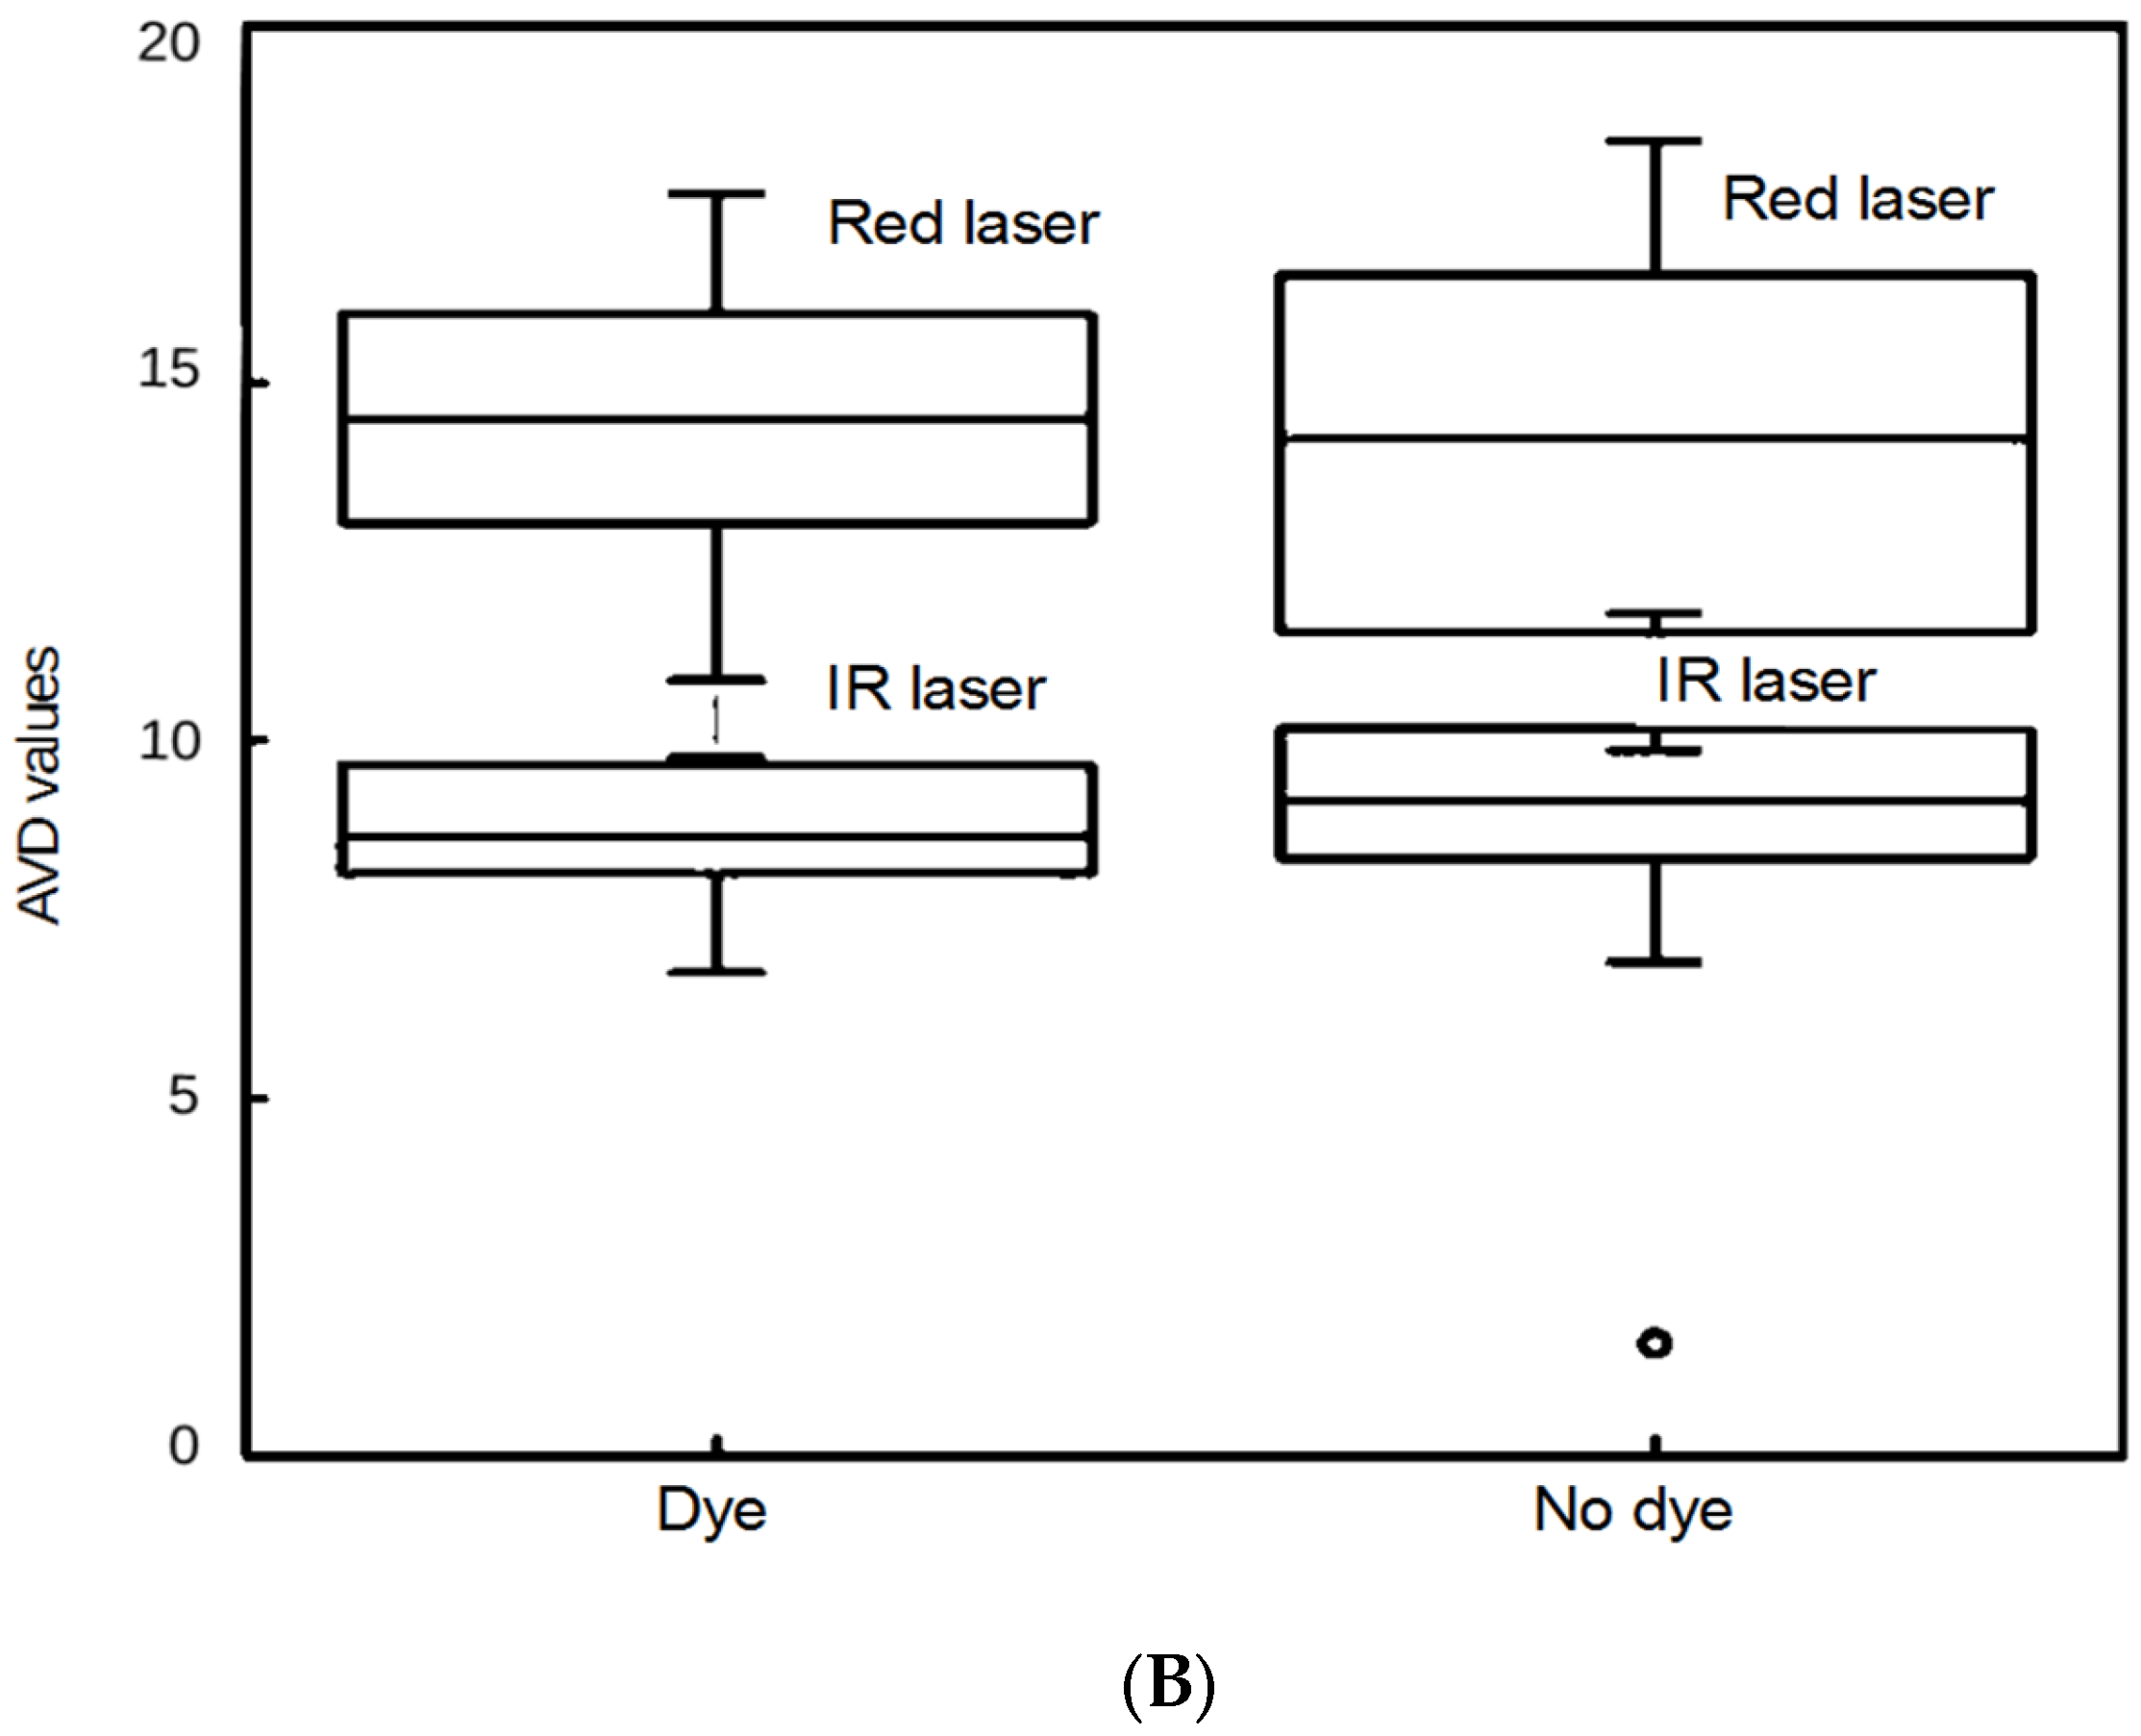
3.3. Use of IR Lasers Improves the Reliability of DLS Measurements in Turbid Medium
4. Conclusions
Author Contributions
Funding
Institutional Review Board Statement
Informed Consent Statement
Data Availability Statement
Acknowledgments
Conflicts of Interest
References
- Nadimi, M.; Sun, D.-W.; Paliwal, J. Recent applications of novel laser techniques for enhancing agricultural production. Laser Phys. 2021, 31, 053001. [Google Scholar] [CrossRef]
- Hernandez, A.C.; Dominguez, P.A.; Cruz, O.A.; Ivanov, R.; Carballo, C.A.; Zepeda, B.R. Laser in agriculture. Int. Agrophys. 2010, 24, 407–422. [Google Scholar]
- Gebbers, R.; Adamchuk, V.I. Precision agriculture and food security. Science 2010, 327, 828–831. [Google Scholar] [CrossRef] [PubMed]
- Fennimore, S.A.; Slaughter, D.C.; Siemens, M.C.; Leon, R.G.; Saber, M.N. Technology for Automation of Weed Control in Specialty Crops. Weed Technol. 2016, 30, 823–837. [Google Scholar] [CrossRef]
- Mohammed, G.H.; Colombo, R.; Middleton, E.M.; Rascher, U.; van der Tol, C.; Nedbal, L.; Goulas, Y.; Pérez-Priego, O.; Damm, A.; Meroni, M.; et al. Remote sensing of solar-induced chlorophyll fluorescence (SIF) in vegetation: 50 years of progress. Remote Sens. Environ. 2019, 231, 111177. [Google Scholar] [CrossRef]
- Eyre, R.; Lindsay, J.; Laamrani, A.; Berg, A. Within-Field Yield Prediction in Cereal Crops Using LiDAR-Derived Topographic Attributes with Geographically Weighted Regression Models. Remote Sens. 2021, 13, 4152. [Google Scholar] [CrossRef]
- Weiss, U.; Biber, P. Plant detection and mapping for agricultural robots using a 3D LIDAR sensor. Robot. Auton. Syst. 2011, 59, 265–273. [Google Scholar] [CrossRef]
- Cheng, Y.; Wang, G.Y. Mobile robot navigation based on lidar. In Proceedings of the 2018 Chinese Control and Decision Conference (CCDC), Shenyang, China, 9–11 June 2018; pp. 1243–1246. [Google Scholar]
- Mei, L.; Guan, Z.G.; Zhou, H.J.; Lv, J.; Zhu, Z.R.; Cheng, J.A.; Chen, F.J.; Löfstedt, C.; Svanberg, S.; Somesfalean, G. Agricultural pest monitoring using fluorescence lidar techniques. Appl. Phys. B Laser Opt. 2011, 106, 733–740. [Google Scholar] [CrossRef]
- Murphy, P.N.C.; Ogilvie, J.; Arp, P. Topographic modelling of soil moisture conditions: A comparison and verification of two models. Eur. J. Soil Sci. 2009, 60, 94–109. [Google Scholar] [CrossRef]
- Amalvy, J.I.; Lasquibar, C.A.; Arizaga, R.; Rabal, H.; Trivi, M. Application of dynamic speckle interferometry to the drying of coatings. Prog. Org. Coat. 2001, 42, 89–99. [Google Scholar] [CrossRef]
- Langevin, D.; Lozano, O.; Salvati, A.; Kestens, V.; Monopoli, M.; Raspaud, E.; Mariot, S.; Salonen, A.; Thomas, S.; Driessen, M.; et al. Inter-laboratory comparison of nanoparticle size measurements using dynamic light scattering and differential centrifugal sedimentation. Nanoimpact 2018, 10, 97–107. [Google Scholar] [CrossRef]
- Fujii, H.; Asakura, T.; Nohira, K.; Shintomi, Y.; Ohura, T. Blood flow observed by time-varying laser speckle. Opt. Lett. 1985, 10, 104–106. [Google Scholar] [CrossRef]
- Dunn, A.K.; Devor, A.; Bolay, H.; Andermann, M.L.; Moskowitz, M.A.; Dale, A.M.; Boas, D.A. Simultaneous imaging of total cerebral hemoglobin concentration, oxygenation, and blood flow during functional activation. Opt. Lett. 2003, 28, 28–30. [Google Scholar] [CrossRef]
- Xu, Z.; Joenathan, C.; Khorana, B.M. Temporal and spatial properties of the time-varying speckles of botanical specimens. Opt. Eng. 1995, 34, 1487–1502. [Google Scholar] [CrossRef]
- Zdunek, A.; Adamiak, A.; Pieczywek, P.M.; Kurenda, A. The biospeckle method for the investigation of agricultural crops: A review. Opt. Lasers Eng. 2014, 52, 276–285. [Google Scholar] [CrossRef]
- Braga, R.A.; Fabbro, I.M.D.; Borem, F.M.; Rabelo, G.; Arizaga, R.; Rabal, H.J.; Trivi, M. Assessment of Seed Viability by Laser Speckle Techniques. Biosyst. Eng. 2003, 86, 287–294. [Google Scholar] [CrossRef]
- Vivas, P.; Resende, L.; Braga, R.; Guimarães, R.; Azevedo, R.; da Silva, E.; Toorop, P. Biospeckle activity in coffee seeds is associated non-destructively with seedling quality. Ann. Appl. Biol. 2016, 170, 141–149. [Google Scholar] [CrossRef]
- Singh, P.; Chatterjee, A.; Rajput, L.S.; Rana, S.; Kumar, S.; Nataraj, V.; Bhatia, V.; Prakash, S. Development of an intelligent laser biospeckle system for early detection and classification of soybean seeds infected with seed-borne fungal pathogen (Colletotrichum truncatum). Biosyst. Eng. 2021, 212, 442–457. [Google Scholar] [CrossRef]
- Ribeiro, K.M.; Barreto, B.; Pasqual, M.; White, P.J.; Braga, R.A.; Dupuy, L.X. Continuous, high-resolution biospeckle imaging reveals a discrete zone of activity at the root apex that responds to contact with obstacles. Ann. Bot. 2013, 113, 555–563. [Google Scholar] [CrossRef]
- Kurenda, A.; Adamiak, A.; Zdunek, A. Temperature effect on apple biospeckle activity evaluated with different indices. Postharvest Biol. Technol. 2012, 67, 118–123. [Google Scholar] [CrossRef]
- Rezende, R.A.L.S.; Soares, J.D.R.; Dos Santos, H.O.; Pasqual, M.; Junior, R.A.B.; Reis, R.O.; Rodrigues, F.A. Effects of silicon on antioxidant enzymes, CO2, proline and biological activity of in vitro-grown cape gooseberry under salinity stress. Aust. J. Crop Sci. 2017, 11, 438–446. [Google Scholar] [CrossRef]
- Pajuelo, M.; Baldwin, G.E.; Rabal, H.; Cap, N.; Arizaga, R.; Trivi, M. Bio-speckle assessment of bruising in fruits. Opt. Lasers Eng. 2003, 40, 13–24. [Google Scholar] [CrossRef]
- Amaral, I.C.; Braga, R.A.; Ramos, E.M.; Ramos, A.L.S.; Roxael, E.A.R. Application of biospeckle laser technique for determining biological phenomena related to beef aging. J. Food Eng. 2013, 119, 135–139. [Google Scholar] [CrossRef]
- Pomarico, J.A.; DiRocco, H.O. Compact device for assessment of microorganism motility. Rev. Sci. Instrum. 2004, 75, 4727–4731. [Google Scholar] [CrossRef]
- Tuchin, V.V. Tissue Optics and Photonics: Biological Tissue Structures. J. Biomed. Photon Eng. 2015, 1, 3–21. [Google Scholar] [CrossRef]
- Tuchin, V.V. Tissue Optics and Photonics: Light-Tissue Interaction. J. Biomed. Photon Eng. 2015, 1, 98–134. [Google Scholar] [CrossRef]
- Carvalho, P.H.; Barreto, J.B.; Braga, R.A.; Rabelo, G.F. Motility parameters assessment of bovine frozen semen by biospeckle laser (BSL) system. Biosyst. Eng. 2009, 102, 31–35. [Google Scholar] [CrossRef]
- Reis, R.O.; Rabal, H.J.; Braga, R.A. Light intensity independence during dynamic laser speckle analysis. Opt. Commun. 2016, 366, 185–193. [Google Scholar] [CrossRef]
- Cardoso, R.R.; Costa, A.G.; Nobre, C.M.B.; Braga, R.A. Frequency signature of water activity by biospeckle laser. Opt. Commun. 2011, 284, 2131–2136. [Google Scholar] [CrossRef]
- Lammertyn, J.; Peirs, A.; De Baerdemaeker, J.; Nicolaï, B. Light penetration properties of NIR radiation in fruit with respect to non-destructive quality assessment. Postharvest Biol. Technol. 2000, 18, 121–132. [Google Scholar] [CrossRef]
- Alves, J.A.; Braga, R.A.; Boas, E.V.D.B.V. Identification of respiration rate and water activity change in fresh-cut carrots using biospeckle laser and frequency approach. Postharvest Biol. Technol. 2013, 86, 381–386. [Google Scholar] [CrossRef]
- Cover, T.M.; Thomas, J.A. Elements of Information Theory; John Wiley and Sons: Hoboken, NJ, USA, 2005. [Google Scholar]
- Brunel, L.; Brun, A.; Snabre, P. Microstructure movements study by dynamic speckle analysis. Speckle06 Speckles Grains Flowers 2006, 6341, 475–480. [Google Scholar] [CrossRef]
- Pérez, A.J.; González-Peña, R.J.; Braga, R., Jr.; Perles, Á.; Pérez–Marín, E.; García-Diego, F.J. A Portable Dynamic Laser Speckle System for Sensing Long-Term Changes Caused by Treatments in Painting Conservation. Sensors 2018, 18, 190. [Google Scholar] [CrossRef]
- Nader, C.A.; Tualle, J.-M.; Tinet, E.; Ettori, D. A New Insight into Biospeckle Activity in Apple Tissues. Sensors 2019, 19, 497. [Google Scholar] [CrossRef]
- Arefi, A.; Moghaddam, P.A.; Motlagh, A.M.; Hassanpour, A. Towards real-time speckle image processing for mealiness assessment in apple fruit. Int. J. Food Prop. 2017, 20, S3135–S3148. [Google Scholar] [CrossRef]
- Pieczywek, P.M.; Nowacka, M.; Dadan, M.; Wiktor, A.; Rybak, K.; Witrowa-Rajchert, D.; Zdunek, A. Postharvest Monitoring of Tomato Ripening Using the Dynamic Laser Speckle. Sensors 2018, 18, 1093. [Google Scholar] [CrossRef]
- Godinho, R.; Silva, M.; Nozela, J.; Braga, R. Online biospeckle assessment without loss of definition and resolution by motion history image. Opt. Lasers Eng. 2012, 50, 366–372. [Google Scholar] [CrossRef]
- Ansari, M.Z.; Ramírez-Miquet, E.E.; Otero, I.; Rodríguez, D.; Darias, J.G. Real time and online dynamic speckle assessment of growing bacteria using the method of motion history image. J. Biomed. Opt. 2016, 21, 66006. [Google Scholar] [CrossRef]
- Rivera, F.P.; Braga, R.A. Bio-Speckle Laser Tool Library. Available online: https://www.nongnu.org/bsltl/ (accessed on 22 February 2023).
- Blotta, E.; Ballarín, V.; Brun, M.; Rabal, H. Evaluation of speckle-interferometry descriptors to measuring drying-of-coatings. Signal Process. 2011, 91, 2395–2403. [Google Scholar] [CrossRef]
- Braga Júnior, R.A.; Rivera, F.P.; Moreira, J. A Practical Guide to Biospeckle Laser Analysis: Theory and Software; UFLA: Lavras, Brazil, 2016. [Google Scholar]
- Braga, R.; Nobre, C.; Costa, A.; Sáfadi, T.; da Costa, F. Evaluation of activity through dynamic laser speckle using the absolute value of the differences. Opt. Commun. 2011, 284, 646–650. [Google Scholar] [CrossRef]
- Cios, A.; Ciepielak, M.; Szymański, Ł.; Lewicka, A.; Cierniak, S.; Stankiewicz, W.; Mendrycka, M.; Lewicki, S. Effect of Different Wavelengths of Laser Irradiation on the Skin Cells. Int. J. Mol. Sci. 2021, 22, 2437. [Google Scholar] [CrossRef] [PubMed]
- Gordon, I.E.; Rothman, L.S.; Gamache, R.R.; Jacquemart, D.; Boone, C.; Bernath, P.F.; Shephard, M.W.; Delamere, J.S.; Clough, S.A. Current updates of the water-vapor line list in HITRAN: A new “Diet” for air-broadened half-widths. J. Quant. Spectrosc. Radiat. Transf. 2007, 108, 389–402. [Google Scholar] [CrossRef]
- Braga, R.A.; Rabelo, G.F.; Barreto Filho, J.B.; Borem, F.M.; Pereira, J.; Muramatsu, M.; Dal Frabbro, I.M. Chapter 8. Applications in Biological Samples. In Dynamic Laser Speckle and Applications; Rabal, H., Braga, R.A., Eds.; CRC Press: Boca Raton, FL, USA, 2008; pp. 194–195. [Google Scholar]
- Ryckewaert, M.; Héran, D.; Faur, E.; George, P.; Grèzes-Besset, B.; Chazallet, F.; Abautret, Y.; Zerrad, M.; Amra, C.; Bendoula, R. A New Optical Sensor Based on Laser Speckle and Chemometrics for Precision Agriculture: Application to Sunflower Plant-Breeding. Sensors 2020, 20, 4652. [Google Scholar] [CrossRef] [PubMed]
- Burbach, C.; Markus, K.; Zhang, Y.; Schlicht, M.; Baluška, F. Photophobic behavior of maize roots. Plant Signal. Behav. 2012, 7, 874–878. [Google Scholar] [CrossRef] [PubMed]


Disclaimer/Publisher’s Note: The statements, opinions and data contained in all publications are solely those of the individual author(s) and contributor(s) and not of MDPI and/or the editor(s). MDPI and/or the editor(s) disclaim responsibility for any injury to people or property resulting from any ideas, methods, instructions or products referred to in the content. |
© 2023 by the authors. Licensee MDPI, Basel, Switzerland. This article is an open access article distributed under the terms and conditions of the Creative Commons Attribution (CC BY) license (https://creativecommons.org/licenses/by/4.0/).
Share and Cite
Contado, E.W.N.; Pasqual, M.; Dória, J.; Gonzalez-Peña, R.J.; Dupuy, L.X.; Braga, R.A., Jr. Assessment of the Use of Infrared Laser for Dynamic Laser Speckle (DLS) Technique. Agriculture 2023, 13, 546. https://doi.org/10.3390/agriculture13030546
Contado EWN, Pasqual M, Dória J, Gonzalez-Peña RJ, Dupuy LX, Braga RA Jr. Assessment of the Use of Infrared Laser for Dynamic Laser Speckle (DLS) Technique. Agriculture. 2023; 13(3):546. https://doi.org/10.3390/agriculture13030546
Chicago/Turabian StyleContado, Ellem W. N., Moacir Pasqual, Joyce Dória, Rolando J. Gonzalez-Peña, Lionel X. Dupuy, and Roberto A. Braga, Jr. 2023. "Assessment of the Use of Infrared Laser for Dynamic Laser Speckle (DLS) Technique" Agriculture 13, no. 3: 546. https://doi.org/10.3390/agriculture13030546