
Use of Geostatistics as a Tool to Study Spatial-Temporal Dynamics of Leucoptera coffeella in Coffee Crops
 , , , , ,
Abstract
:1. Introduction
2. Materials and Methods
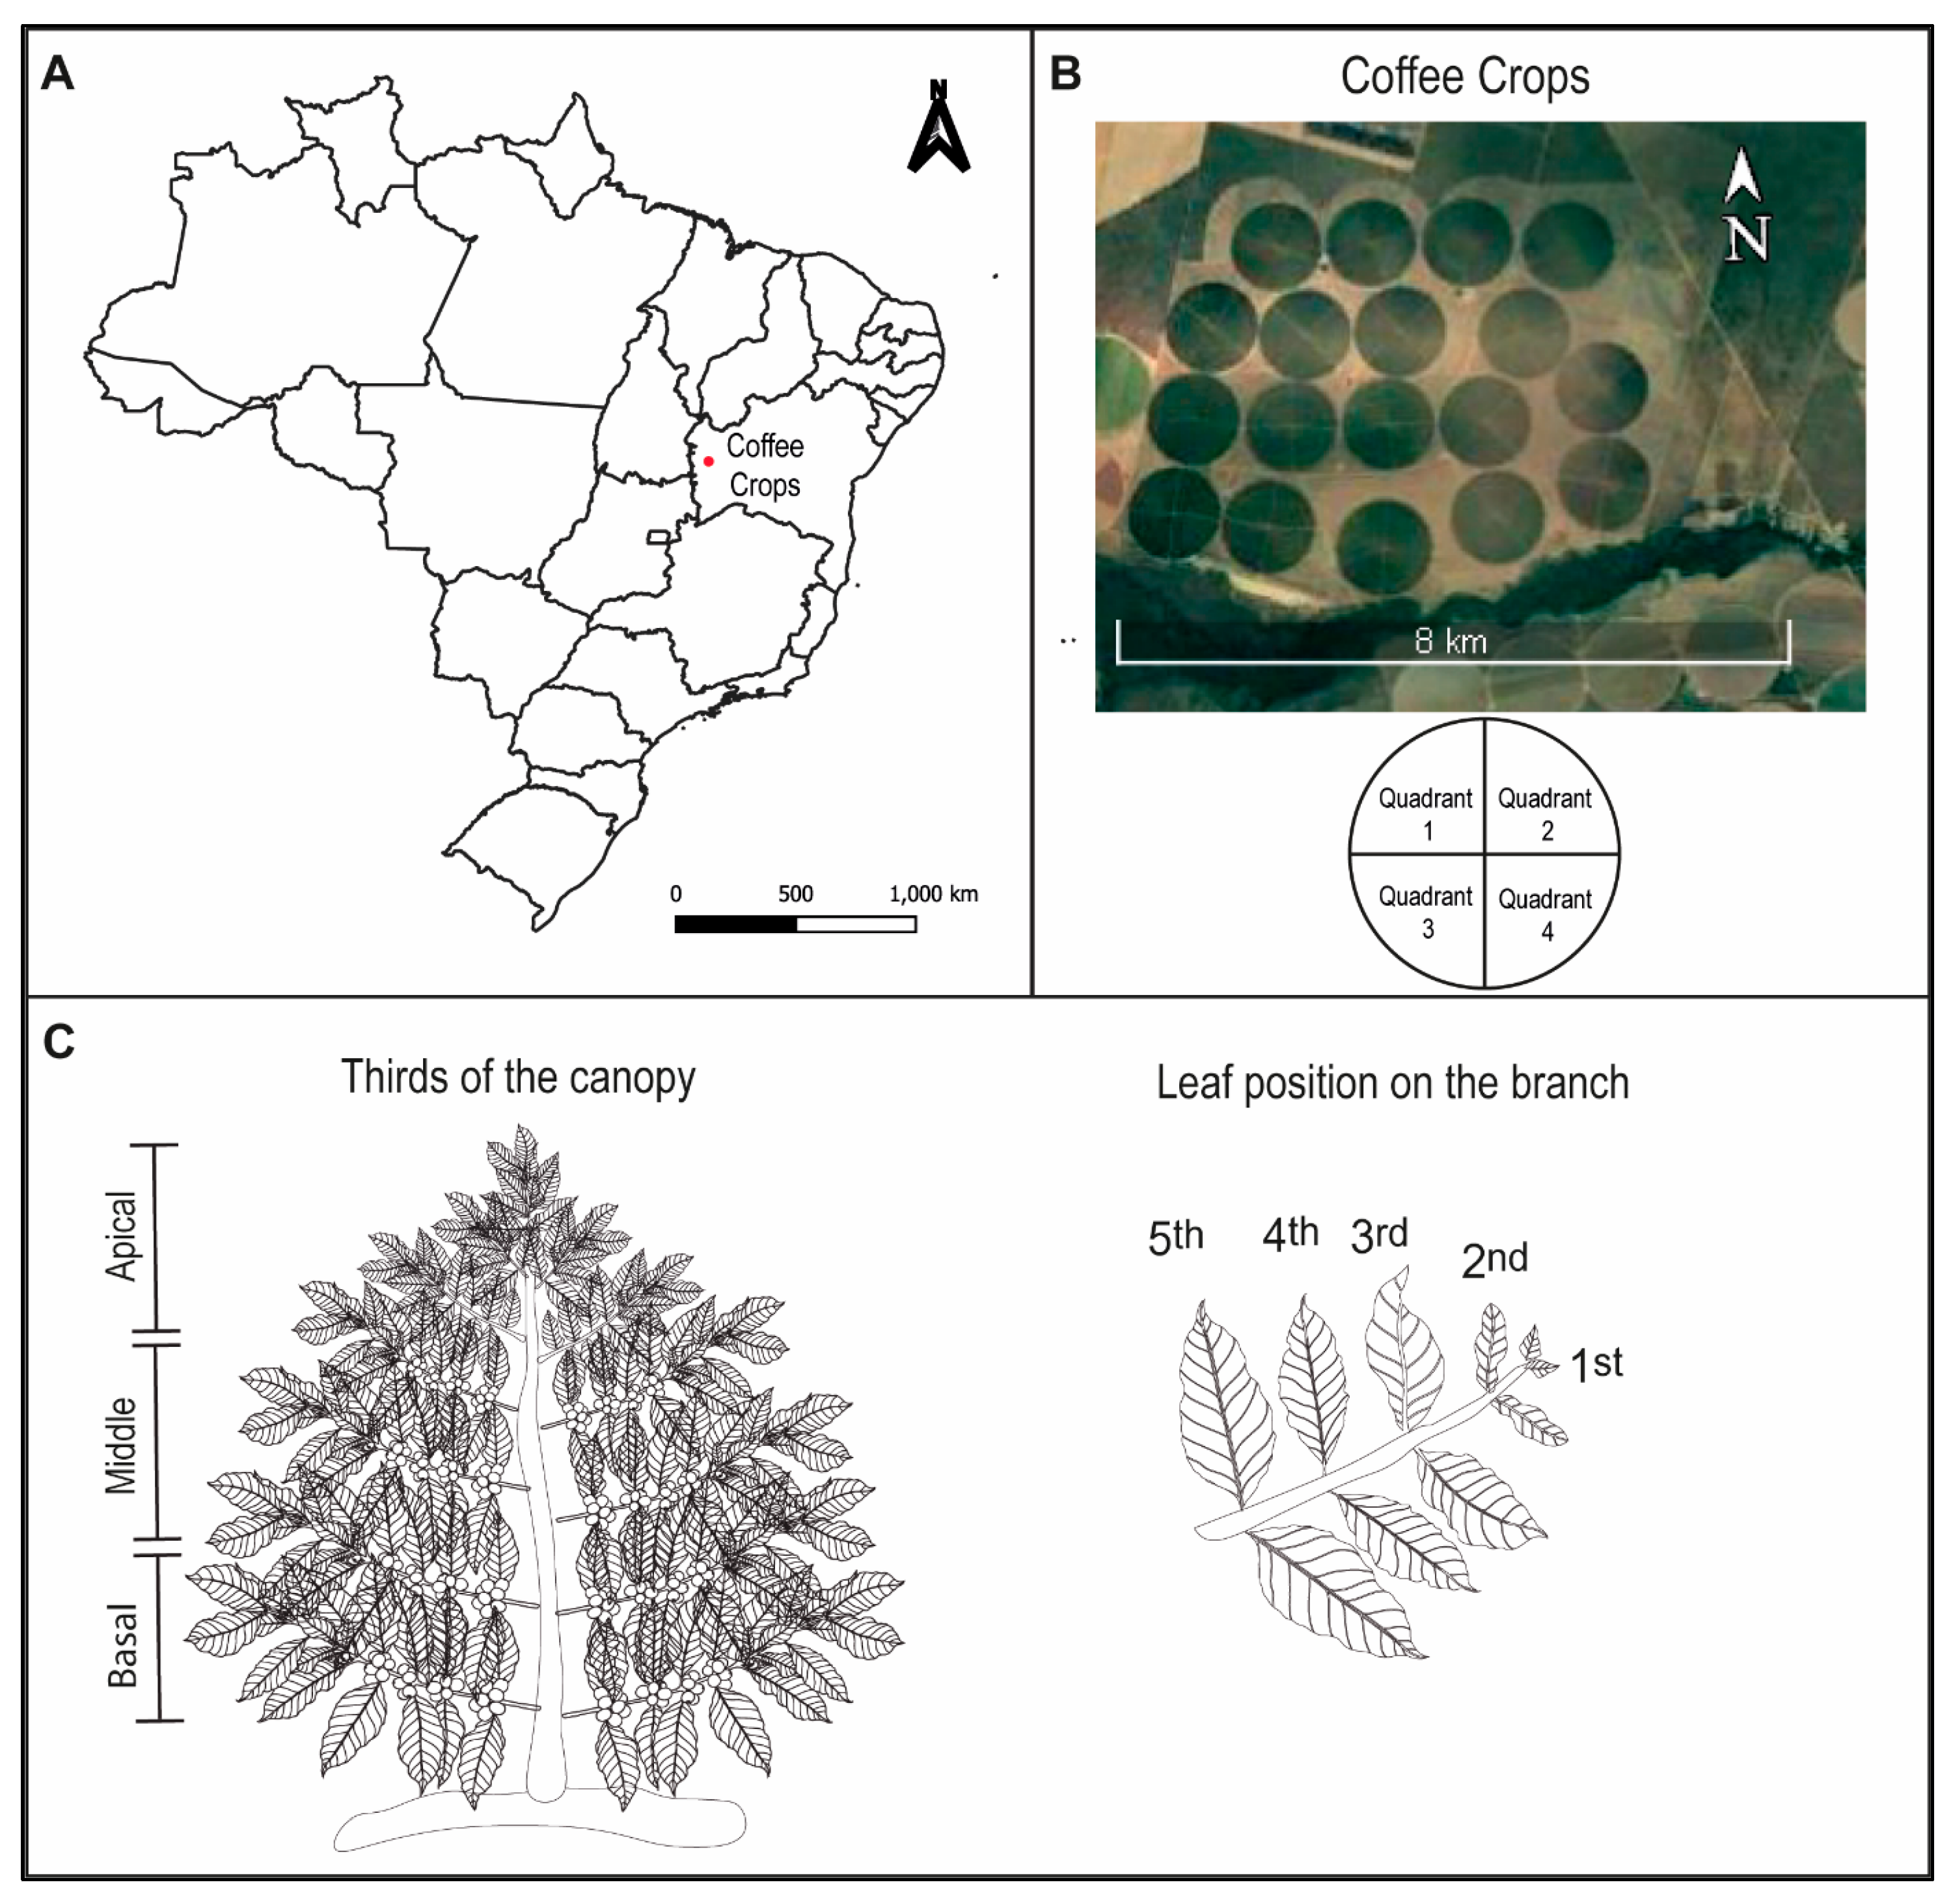
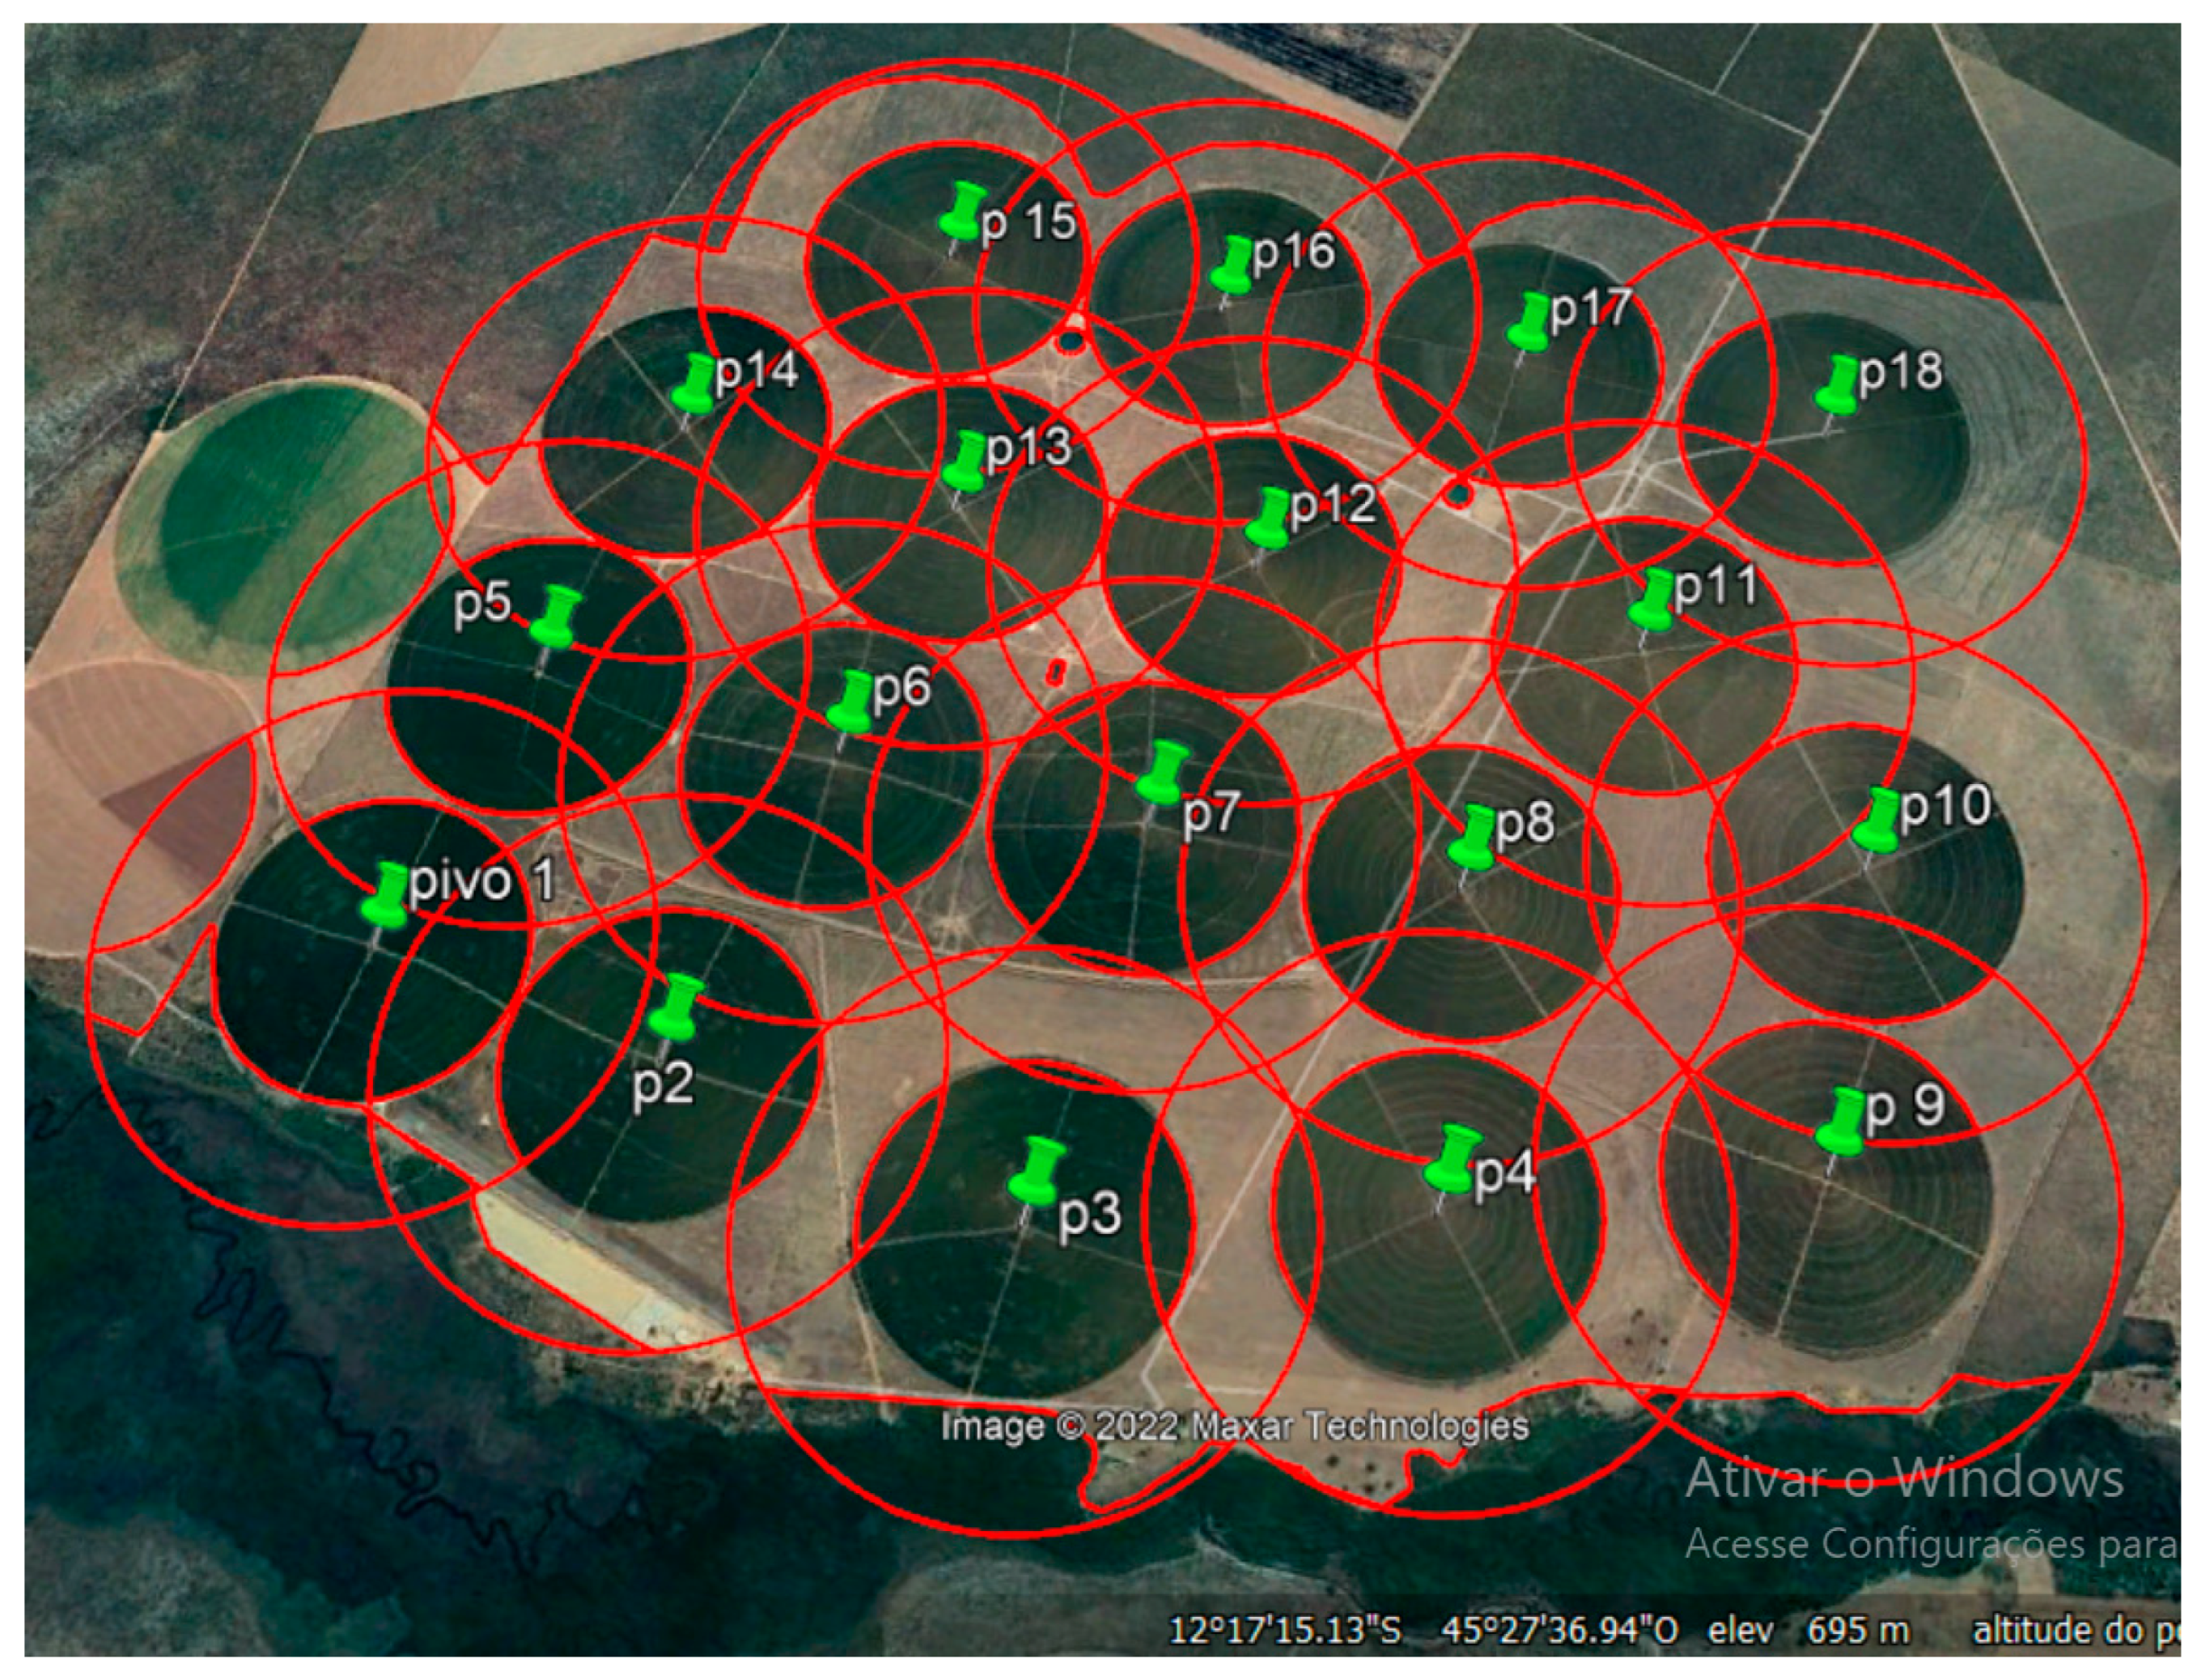
2.1. Study Area
2.2. Data Collection
2.3. Statistical Analysis
2.3.1. Correlation Analysis
2.3.2. Spatial Analysis
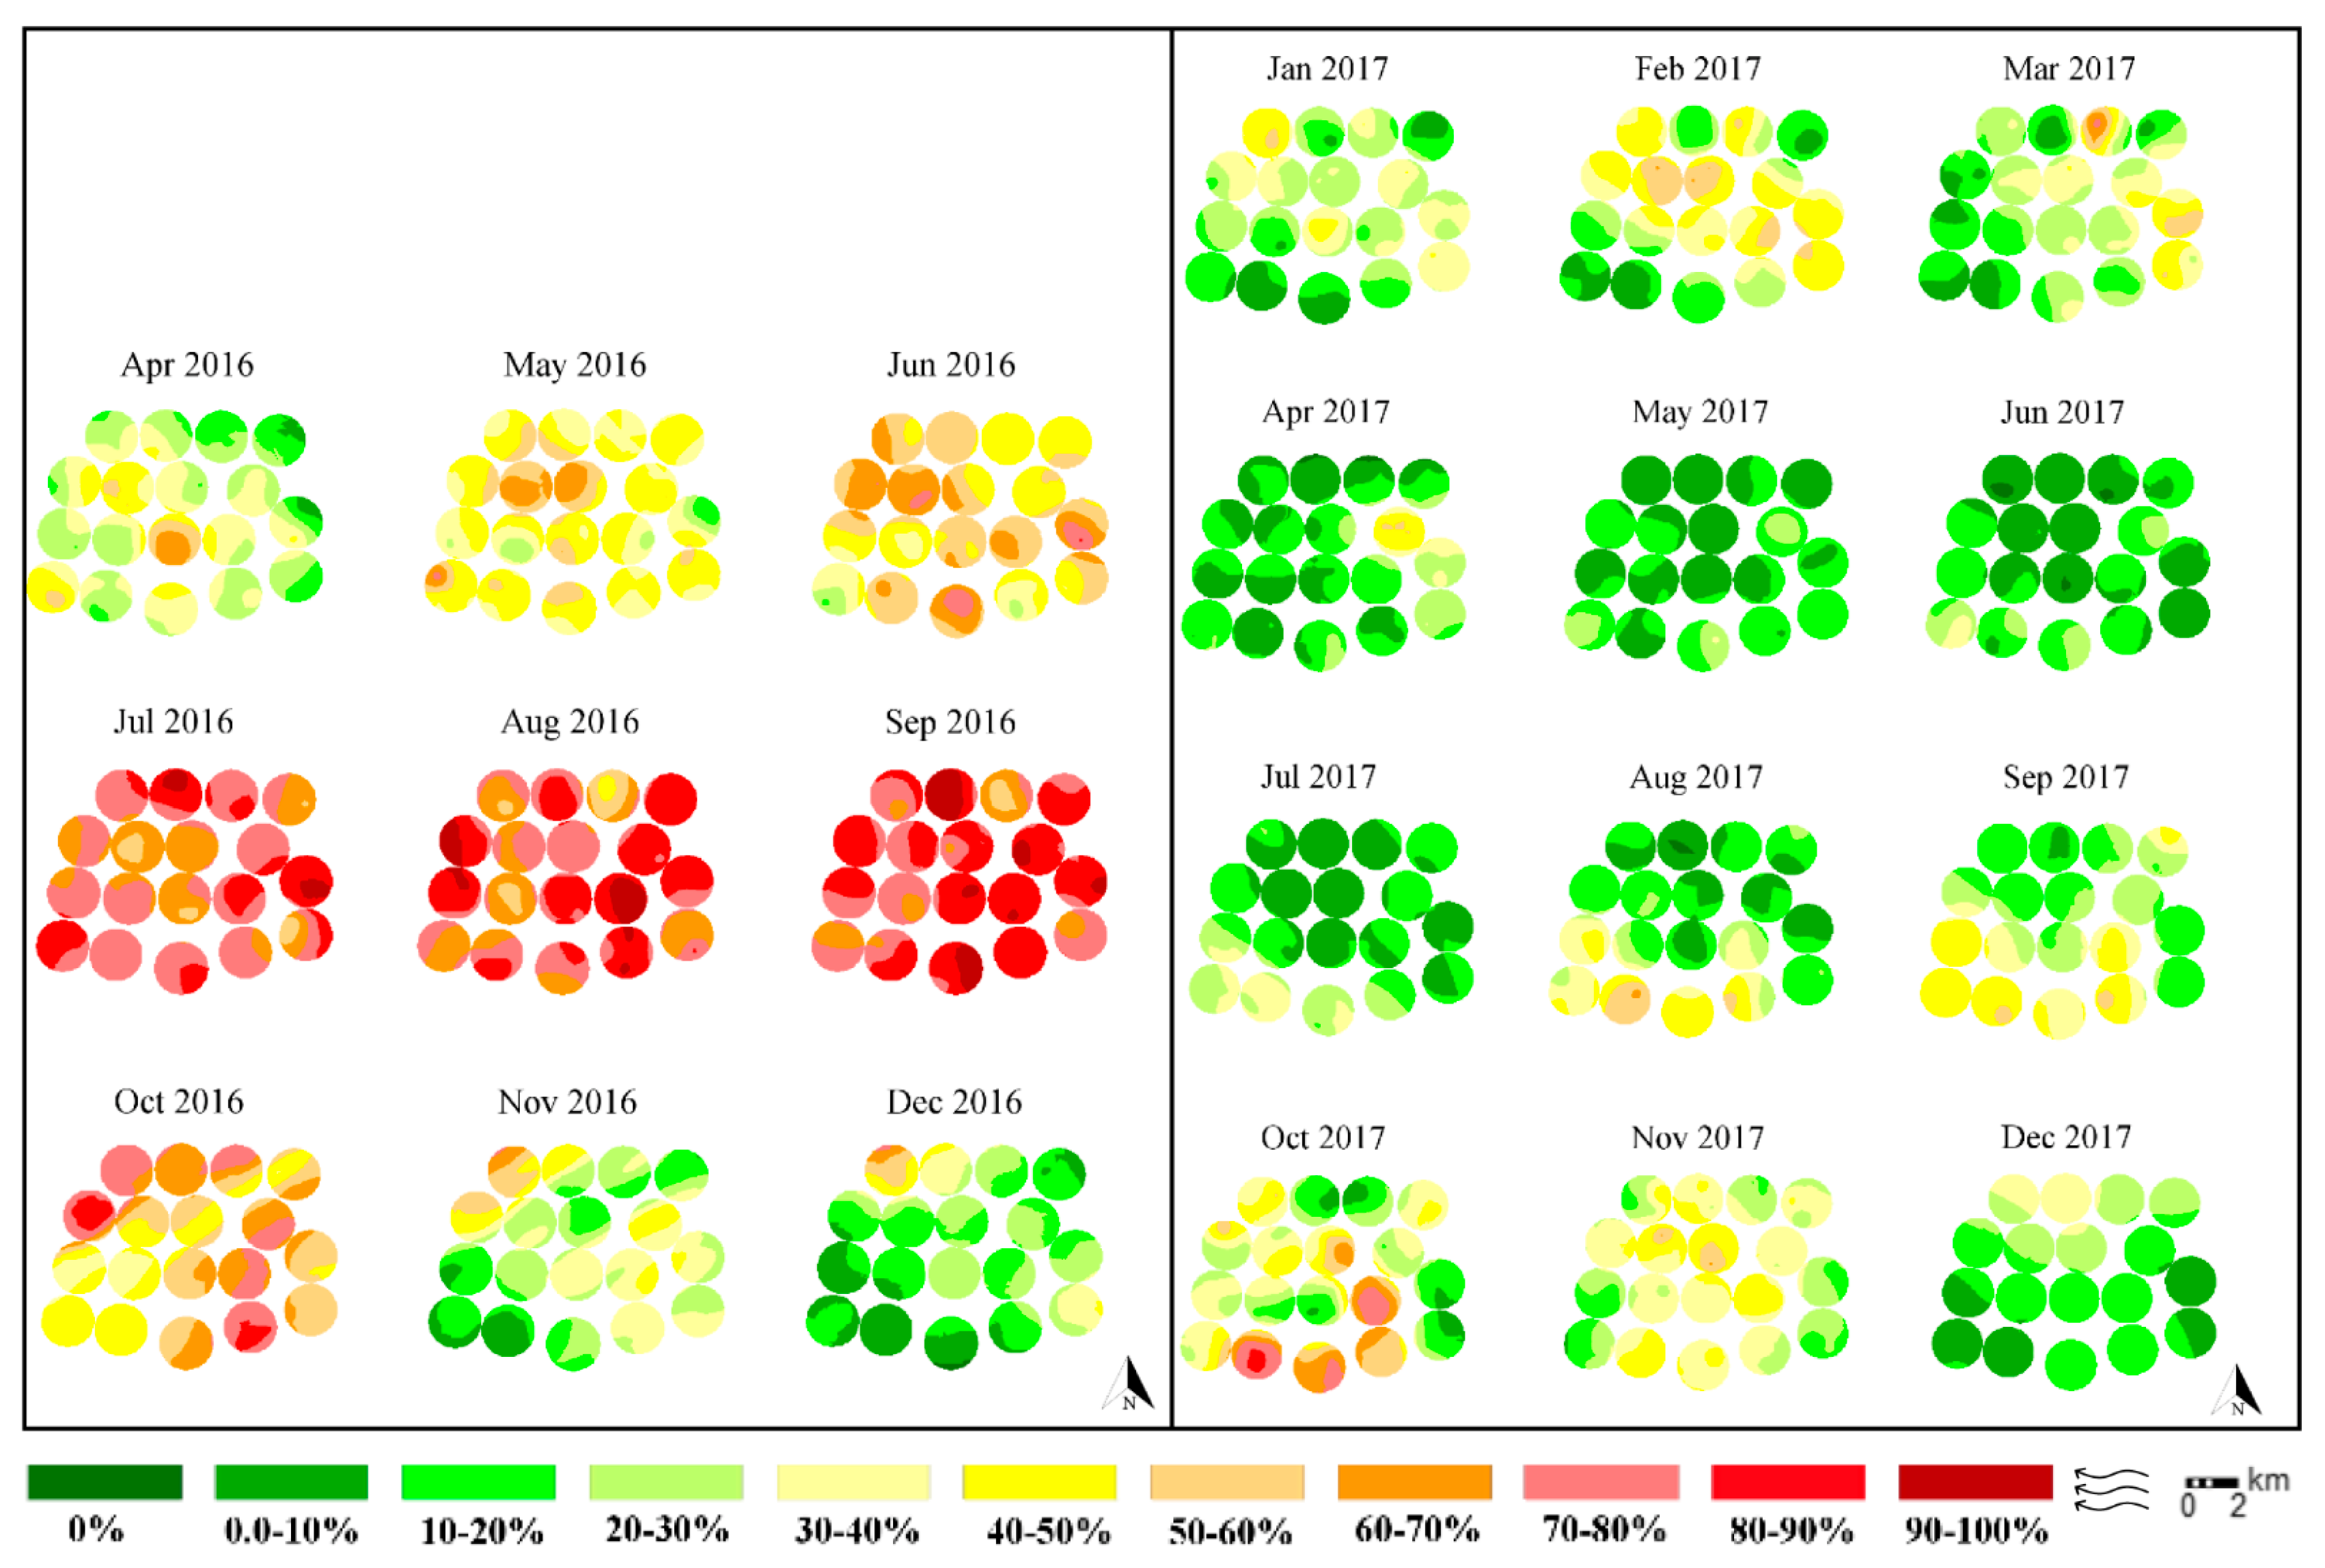
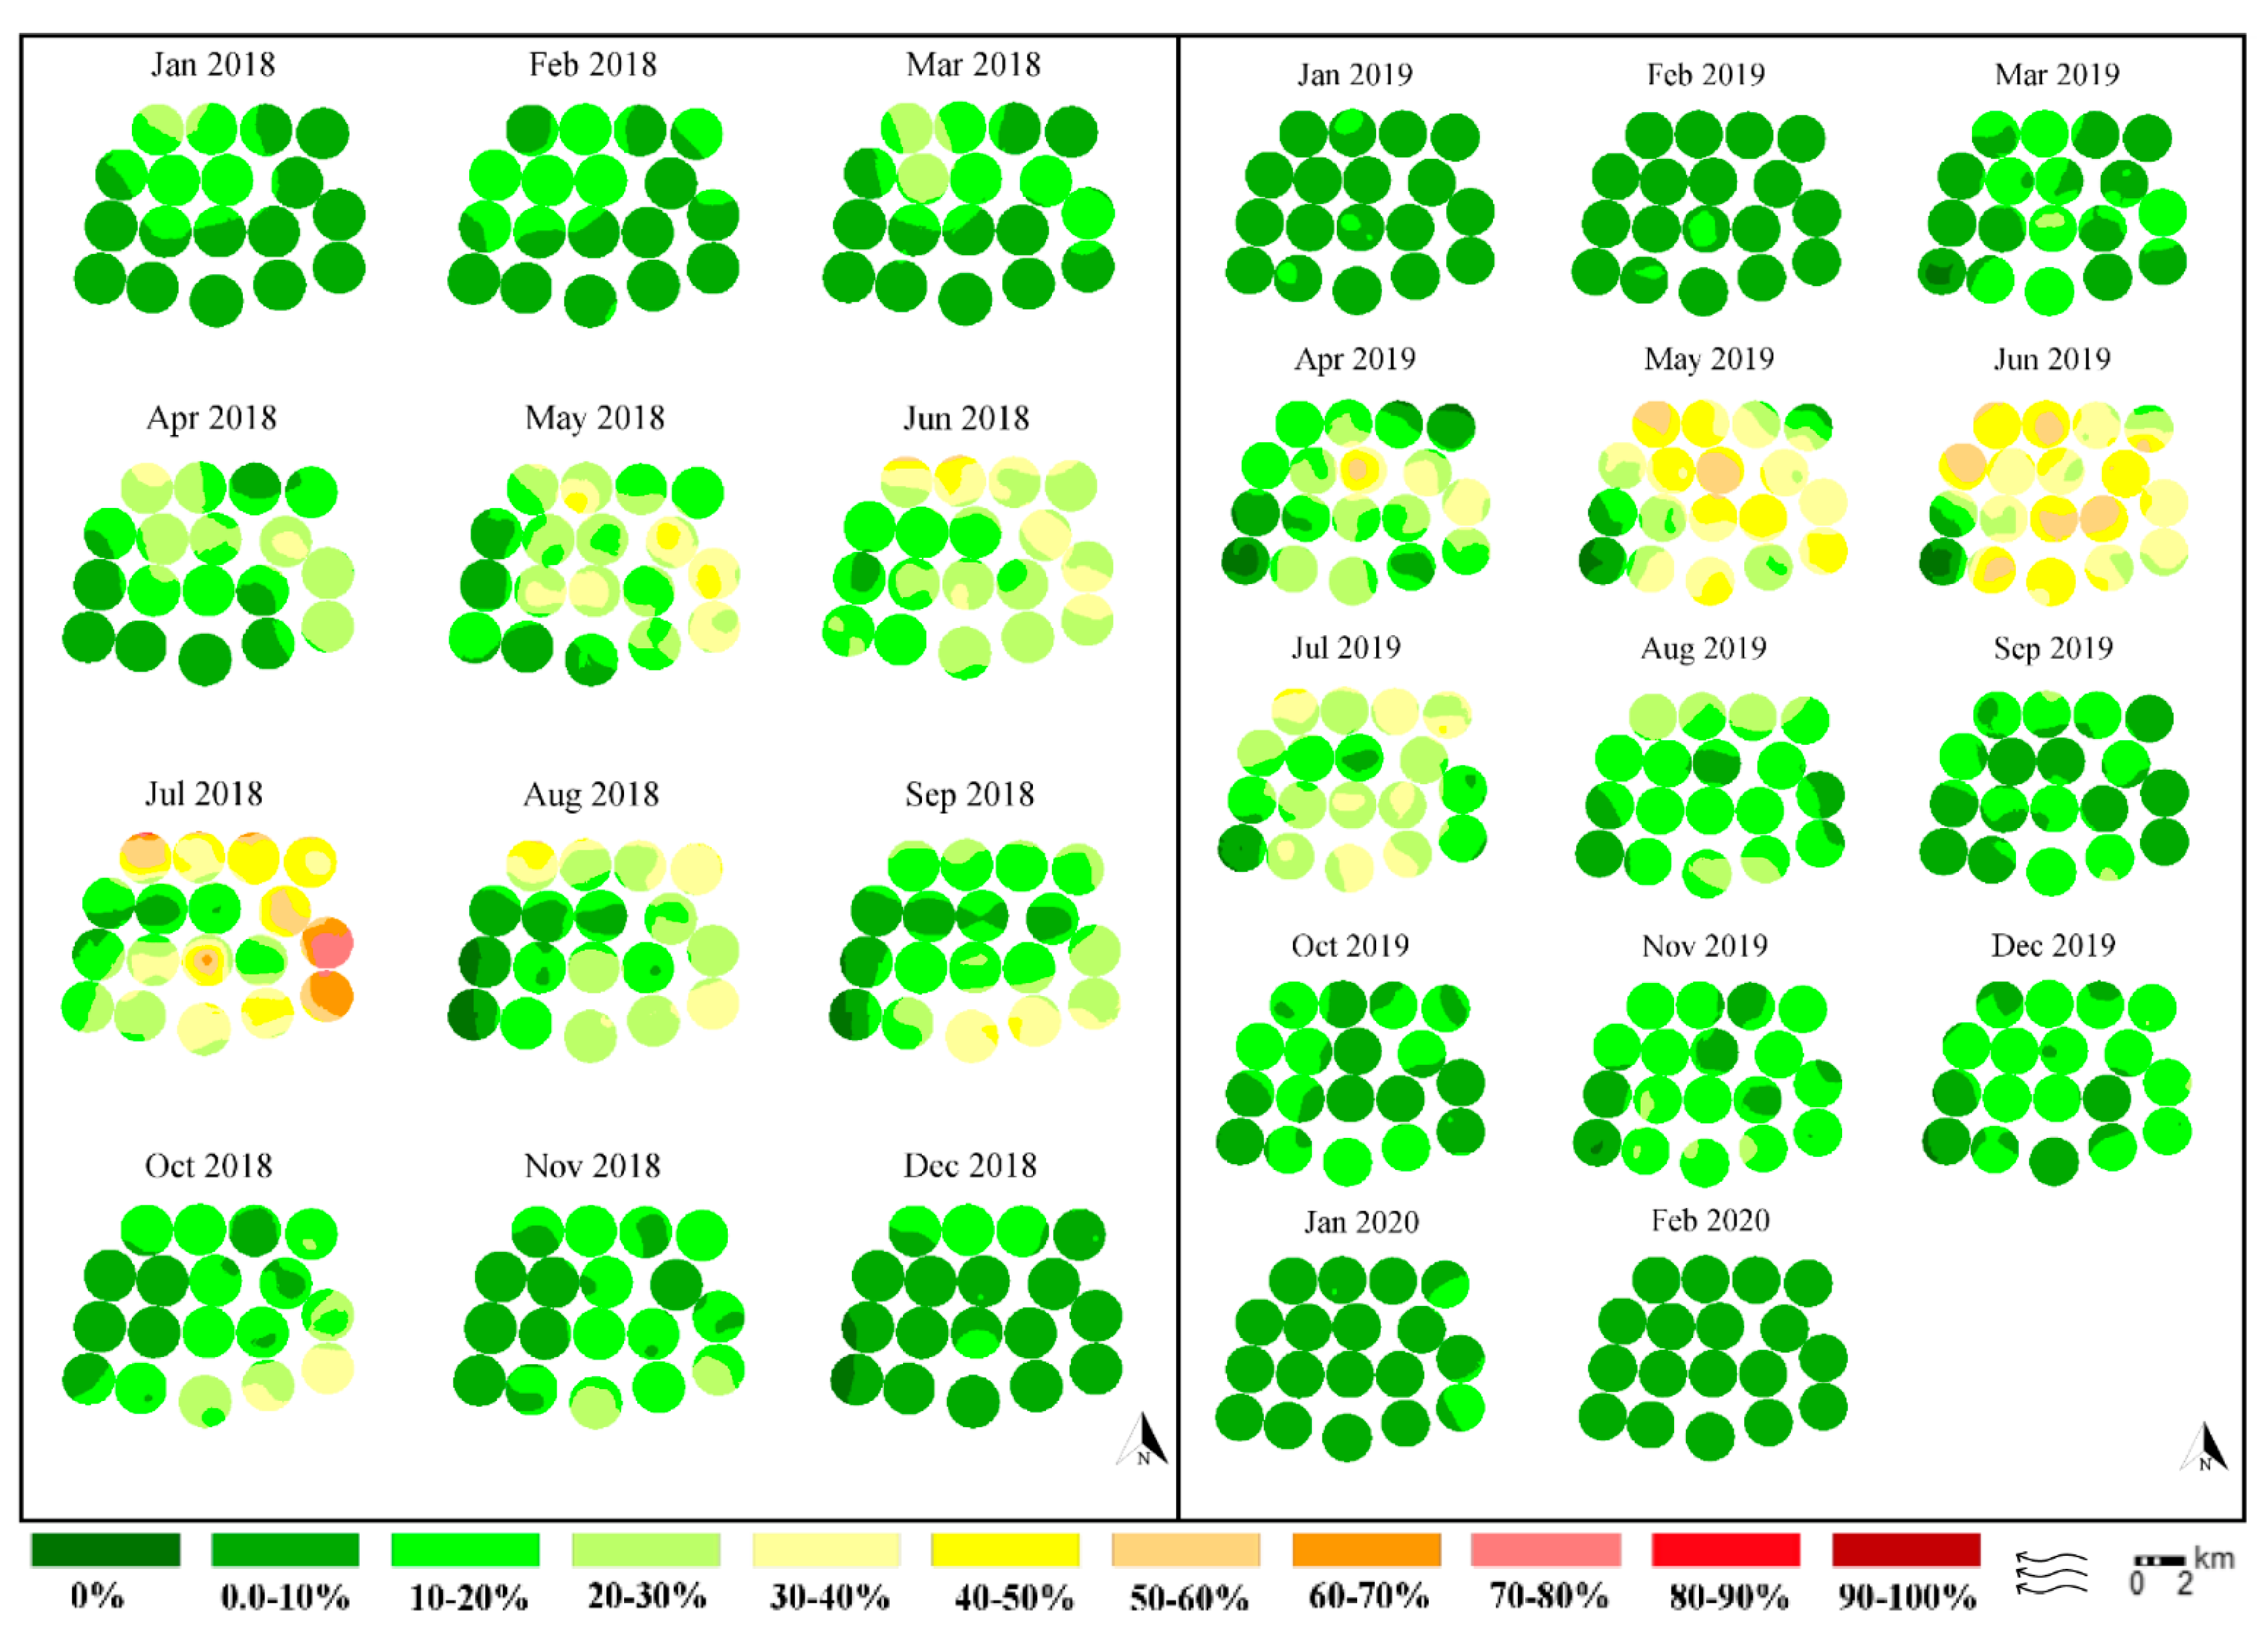
3. Results
4. Discussion
Author Contributions
Funding
Institutional Review Board Statement
Data Availability Statement
Acknowledgments
Conflicts of Interest
References
- Alves, F.D.; Lindner, M. Agronegócio do café no Sul de Minas Gerais: Territorialização, mundialização e contradições. J. OKARA Geogr. Debate 2020, 14, 433–451. [Google Scholar] [CrossRef]
- Avelino, J.; Allinne, C.; Cerda, R.; Willocquet, L.; Savary, S. Multiple-Disease System in Coffee: From Crop Loss Assessment to Sustainable Management. Annu. Rev. Phytopathol. 2018, 56, 611–635. [Google Scholar] [CrossRef] [PubMed]
- Lomelí-Flores, J.R.; Barrera, J.F.; Bernal, J.S. Impacts of weather, shade cover and elevation on coffee leafminer Leucoptera coffeella (Lepidoptera: Lyonetiidae) population dynamics and natural enemies. Crop Prot. 2010, 29, 1039–1048. [Google Scholar] [CrossRef]
- Vegro, C.L.R.; Almeida, L.F. Chapter 1—Global coffee market: Socio-economic and cultural dynamics. In Coffee Consumption and Industry Strategies in Brazil; de Almeida, L.F., Spers, E.E., Eds.; Woodhead Publishing: Sawston, UK, 2020; pp. 3–19. [Google Scholar] [CrossRef]
- Umair, M.; Cheema, M.A.; Cheema, O.; Li, H.; Lu, H. Impact of COVID-19 on IoT adoption in healthcare, smart homes, smart buildings, smart cities, transportation and industrial IoT. Sensors 2021, 21, 3838. [Google Scholar] [CrossRef] [PubMed]
- Leite, S.A.; Santos, M.P.; Costa, D.R.; Moreira, A.A.; Guedes, R.N.C.; Castellani, M.A. Time-concentration interplay in insecticide resistance among populations of the Neotropical coffee leaf miner, Leucoptera coffeella. Agric. For. Entomol. 2021, 23, 232–241. [Google Scholar] [CrossRef]
- Rosado, M.d.C.; Araújo, G.J.d.; Pallini, A.; Venzon, M. Cover crop intercropping increases biological control in coffee crops. Biol. Control 2021, 160, 104675. [Google Scholar] [CrossRef]
- Dantas, J.; Motta, I.O.; Vidal, L.A.; Nascimento, E.F.; Bilio, J.; Pupe, J.M.; Veiga, A.; Carvalho, C.; Lopes, R.B.; Rocha, T.L. A comprehensive review of the coffee leaf miner Leucoptera coffeella (Lepidoptera: Lyonetiidae)—A major pest for the coffee crop in Brazil and others Neotropical countries. Insects 2021, 12, 1130. [Google Scholar] [CrossRef]
- Leite, S.A.; Guedes, R.N.C.; Santos, M.P.; Costa, D.R.; Moreira, A.A.; Matsumoto, S.N.; Lemos, O.L.; Castellani, M.A. Profile of Coffee Crops and Management of the Neotropical Coffee Leaf Miner, Leucoptera coffeella. Sustainability 2020, 12, 8011. [Google Scholar] [CrossRef]
- Pantoja-Gomez, L.M.; Corrêa, A.S.; Oliveira, L.O.; Guedes, R.N.C. Common Origin of Brazilian and Colombian Populations of the Neotropical Coffee Leaf Miner, Leucoptera coffeella (Lepidoptera: Lyonetiidae). J. Econ. Entomol. 2019, 112, 924–931. [Google Scholar] [CrossRef]
- Tuelher, E.d.S.; Oliveira, E.E.; Guedes, R.N.C.; Magalhães, L.C. Ocorrência de bicho-mineiro do cafeeiro (Leucoptera coffeella) influenciada pelo período estacional e pela altitude. Acta Sci. Agron. 2003, 25, 119–124. [Google Scholar] [CrossRef]
- Souza, J.C.; Reis, P.R.; Rigitano, R.L.d.O. Bicho Mineiro do Cafeeiro—Biologia, Dano e Manejo Integrado; EPAMIG: Belo Horizonte, Brazil, 1998; 48p. [Google Scholar]
- Motta, I.O.; Dantas, J.; Vidal, L.; Bílio, J.; Pujol-Luz, J.R.; Albuquerque, É.V. The coffee leaf miner, Leucoptera coffeella (Lepidoptera: Lyonetiidae): Identification of the larval instars and description of male and female genitalia. Rev. Bras. Entomol. 2021, 65, e20200122. [Google Scholar] [CrossRef]
- Ramiro, D.A.; Guerreiro-Filho, O.; Queiroz-Voltan, R.B.; Matthiesen, S.C. Caracterização anatômica de folhas de cafeeiros resistentes e suscetíveis ao bicho-mineiro. J. Bragantia 2004, 63, 363–372. [Google Scholar] [CrossRef]
- Alves, M.C.; Silva, F.M.; Moraes, J.C.; Pozza, E.A.; Oliveira, M.S.; Souza, J.C.S.; Alves, L.S. Geostatistical analysis of the spatial variation of the berry borer and leaf miner in a coffee agroecosystem. Precis. Agric. 2011, 12, 18–31. [Google Scholar] [CrossRef]
- Oliver, M.A. Geostatistical Applications for Precision Agriculture; Springer Science & Business Media: Berlin/Heidelberg, Germany, 2010. [Google Scholar]
- Scalon, J.D.; Avelar, M.B.L.; Alves, G.D.F.; Zacarias, M.S. Spatial and temporal dynamics of coffee-leaf-miner and predatory wasps in organic coffee field in formation. Ciência Rural. 2011, 41, 646–652. [Google Scholar] [CrossRef]
- Barrigossi, J.A.F.; Young, L.J.; Crawford, C.A.G.; Hein, G.L.; Higley, L.G. Spatial and Probability Distribution of Mexican Bean Beetle (Coleoptera: Coccinellidae) Egg Mass Populations in Dry Bean. J. Environ. Entomol. 2001, 244–253, 210. [Google Scholar] [CrossRef]
- Martins, J.C.; Picanco, M.C.; Silva, R.S.; Gonring, A.H.; Galdino, T.V.; Guedes, R.N. Assessing the spatial distribution of Tuta absoluta (Lepidoptera: Gelechiidae) eggs in open-field tomato cultivation through geostatistical analysis. Pest Manag. Sci. 2018, 74, 30–36. [Google Scholar] [CrossRef]
- Rosado, J.F.; Picanço, M.C.; Sarmento, R.A.; Pereira, R.M.; Pedro-Neto, M.; Galdino, T.V.S.; de Sousa Saraiva, A.; Erasmo, E.A.L. Geostatistics as a tool to study mite dispersion in physic nut plantations. Bull. Entomol. Res. 2015, 105, 381–389. [Google Scholar] [CrossRef]
- Veran, S.; Simpson, S.J.; Sword, G.A.; Deveson, E.; Piry, S.; Hines, J.E.; Berthier, K. Modeling spatiotemporal dynamics of outbreaking species: Influence of environment and migration in a locust. Ecology 2015, 96, 737–748. [Google Scholar] [CrossRef]
- Leite, S.A.; Dos Santos, M.P.; Resende-Silva, G.A.; da Costa, D.R.; Moreira, A.A.; Lemos, O.L.; Guedes, R.N.C.; Castellani, M.A. Area-Wide Survey of Chlorantraniliprole Resistance and Control Failure Likelihood of the Neotropical Coffee Leaf Miner Leucoptera coffeella (Lepidoptera: Lyonetiidae). J. Econ. Entomol. 2020, 113, 1399–1410. [Google Scholar] [CrossRef]
- Reis, P.; Souza, J.d. Manejo integrado do bicho-mineiro, Perileucoptera coffeella (Guérin-Meneville)(Lepidoptera: Lyonetiidae), e seu reflexo na producao de café. An. Soc. Entomológica Bras. 1996, 25, 77–82. [Google Scholar] [CrossRef]
- Google Earth Pro; v 7.3.6.9345; Google Inc.: Mountain View, CA, USA, 2021.
- SAS/STAT®; SAS Institute: Cary, NC, USA, 2013.
- ESRI. ArcGIS Professional GIS for the Desktop [Computer Program]; Environmental Systems Research Institute: Redlands, CA, USA, 2016. [Google Scholar]
- Li, J.; Heap, A.D. A review of comparative studies of spatial interpolation methods in environmental sciences: Performance and impact factors. Ecol. Inform. 2011, 6, 228–241. [Google Scholar] [CrossRef]
- Park, J.-J.; Shin, K.-I.; Lee, J.-H.; Lee, S.E.; Lee, W.-K.; Cho, K. Detecting and cleaning outliers for robust estimation of variogram models in insect count data. Ecol. Res. 2012, 27, 1–13. [Google Scholar] [CrossRef]
- Isaaks, E.H.; Srivastava, R. An Introduction to Applied Geostatistics; Oxford University Press: New York, NY, USA, 1989. [Google Scholar]
- Ramos, Y.J.; Costa, T.L.; Santos, A.A.; Silva, R.S.; Galdino, T.V.d.S.; Picanço, M.C. Geostatistical analysis as essential information for efficient decision making in Anastrepha fraterculus (Diptera: Tephritidae) control in apple orchards. Crop Prot. 2019, 120, 50–57. [Google Scholar] [CrossRef]
- Gumprecht, D.; Müller, W.G.; Rodríguez-Díaz, J.M. Designs for Detecting Spatial Dependence. Geogr. Anal. 2009, 41, 127–143. [Google Scholar] [CrossRef]
- Sciarretta, A.; Trematerra, P. Geostatistical characterization of the spatial distribution of Grapholita molesta and Anarsia lineatella males in an agricultural landscape. J. Appl. Entomol. 2006, 130, 73–83. [Google Scholar] [CrossRef]
- Taylor, L. Assessing and interpreting the spatial distributions of insect populations. J Annu. Rev. Entomol. 1984, 29, 321–357. [Google Scholar] [CrossRef]
- Liebhold, A.M.; Rossi, R.E.; Kemp, W.P. Geostatistics and Geographic Information Systems in Applied Insect Ecology. Annu. Rev. Entomol. 1993, 38, 303–327. [Google Scholar] [CrossRef]
- Bacca, T.; Lima, E.R.; Picanço, M.C.; Guedes, R.N.C.; Viana, J.H.M. Optimum spacing of pheromone traps for monitoring the coffee leaf miner Leucoptera coffeella. Entomol. Exp. Appl. 2006, 119, 39–45. [Google Scholar] [CrossRef]
- Lima, C.H.O.; Sarmento, R.A.; Galdino, T.V.S.; Pereira, P.S.; Silva, J.; Souza, D.J.; Santos, G.R.; Costa, T.L.; Picanço, M.C. Spatiotemporal dynamics of whitefly Bemisia tabaci (hemiptera: Aleyrodidae) in commercial watermelon crops. J. Econ. Entomol. 2018, 111, 1895–1903. [Google Scholar] [CrossRef]
- Ifoulis, A.; Savopoulou-Soultani, M. Use of geostatistical analysis to characterize the spatial distribution of Lobesia botrana (Lepidoptera: Tortricidae) larvae in northern Greece. Environ. Entomol. 2006, 35, 497–506. [Google Scholar] [CrossRef]
- Carvalho, S.C.; Santana Junior, P.A.; Pereira, P.S.; Sarmento, R.A.; Farias, E.S.; Lima, C.H.O.; Santos, G.R.; Picanço, M.C. Spatial distribution of Frankliniella schultzei (Thysanoptera: Thripidae) in open-field yellow melon, with emphasis on the role of surrounding vegetation as a source of initial infestation. J. Econ. Entomol. 2020, 113, 2997–3003. [Google Scholar] [CrossRef]
- Kirwan, N.; Oliver, M.; Moffat, A.; Morgan, G. Sampling the soil in long-term forest plots: The implications of spatial variation. Environ. Monit. Assess. 2005, 111, 149–172. [Google Scholar] [CrossRef]
- Pedigo, L.P.; Rice, M.E.; Krell, R.K. Entomology and Pest Management; Waveland Press: Long Grove, IL, USA, 2021. [Google Scholar]
- Pereira, P.S.; Sarmento, R.A.; Lima, C.H.O.; Pinto, C.B.; Silva, G.A.; Santos, G.R.; Picanço, M.C. Geostatistical Assessment of Frankliniella schultzei (Thysanoptera: Thripidae) Spatial Distribution in Commercial Watermelon Crops. J. Econ. Entomol. 2019, 113, 489–495. [Google Scholar] [CrossRef]
- Ludwig, M.; Schlinkert, H.; Meyhöfer, R. Wind-modulated landscape effects on colonization of Brussels sprouts by insect pests and their syrphid antagonists. Agrofor. Syst. 2018, 20, 141–149. [Google Scholar] [CrossRef]
- Pereira, E.J.G.; Picanço, M.C.; Bacci, L.; Della Lucia, T.M.C.; Silva, É.M.; Fernandes, F.L. Natural mortality factors of Leucoptera coffeella (Lepidoptera: Lyonetiidae) on Coffea arabica. Biocontrol Sci. Technol. 2007, 17, 441–455. [Google Scholar] [CrossRef]
- Righi, C.A.; Campoe, O.C.; Bernardes, M.S.; Lunz, A.M.P.; Piedade, S.M.S.; Pereira, C.R. Influence of rubber trees on leaf-miner damage to coffee plants in an agroforestry system. Agrofor. Syst. 2013, 87, 1351–1362. [Google Scholar] [CrossRef]
- Giffard, B.; Jactel, H.; Corcket, E.; Barbaro, L. Influence of surrounding vegetation on insect herbivory: A matter of spatial scale and herbivore specialisation. Basic Appl. Ecol. 2012, 13, 458–465. [Google Scholar] [CrossRef]
- Nestel, D.; Dickschen, F.; Altieri, M.A. Seasonal and spatial population loads of a tropical insect: The case of the coffee leaf-miner in Mexico. Ecol. Entomol. 1994, 19, 159–167. [Google Scholar] [CrossRef]
- Sciarretta, A.; Trematerra, P. Geostatistical tools for the study of insect spatial distribution: Practical implications in the integrated management of orchard and vineyard pests. J. Plant Prot. Sci. 2014, 50, 97–110. [Google Scholar] [CrossRef] [Green Version]
- Sivakoff, F.S.; Rosenheim, J.A.; Dutilleul, P.; Carrière, Y. Influence of the surrounding landscape on crop colonization by a polyphagous insect pest. Entomol. Exp. Appl. 2013, 149, 11–21. [Google Scholar] [CrossRef]
- Bacca, T.; Lima, E.R.; Picanço, M.C.; Guedes, R.N.C.; Viana, J.H.M. Sampling plan for the coffee leaf miner Leucoptera coffeella with sex pheromone traps. J. Appl. Entomol. 2008, 132, 430–438. [Google Scholar] [CrossRef]
- Felicio, T.N.P.; Costa, T.L.; Sarmento, R.A.; Ramos, R.S.; Pereira, P.S.; da Silva, R.S.; Picanço, M.C. Surrounding Vegetation, Climatic Elements, and Predators Affect the Spatial Dynamics of Bemisia tabaci (Hemiptera: Aleyrodidae) in Commercial Melon Fields. J. Econ. Entomol. 2019, 112, 2774–2781. [Google Scholar] [CrossRef] [PubMed]
- Magalhães, S.T.V.; Guedes, R.N.C.; Demuner, A.J.; Lima, E.R. Effect of coffee alkaloids and phenolics on egg-laying by the coffee leaf miner Leucoptera coffeella. Bull. Entomol. Res. 2008, 98, 483–489. [Google Scholar] [CrossRef] [PubMed]
- Magalhães, S.T.V.; Guedes, R.N.C.; Lima, E.R.; Demuner, A.J. Coffee leaf volatiles and egg laying by the coffee leaf miner Leucoptera coffeella. Crop Prot. 2008, 27, 1038–1041. [Google Scholar] [CrossRef]
- Teodoro, A.; Klein, A.-M.; Tscharntke, T. Environmentally mediated coffee pest densities in relation to agroforestry management, using hierarchical partitioning analyses. Agric. Ecosyst. Environ. 2008, 125, 120–126. [Google Scholar] [CrossRef]
- Bongiovanni, R.; Lowenberg-Deboer, J. Precision Agriculture and Sustainability. Precis. Agric. 2004, 5, 359–387. [Google Scholar] [CrossRef]
- Meireles, D.F.; Carvalho, J.A.; Moraes, J.C. Avaliação da infestação do bicho-mineiro e do crescimento do cafeeiro submetido a diferentes níveis de déficit hídrico. J. Ciência Agrotecnologia 2001, 25, 371–374. [Google Scholar]
- Meireles, E.J.L.; Camargo, M.B.P.d.; Pezzopane, J.R.M.; Thomaziello, R.A.; Fahl, J.I.; Bardin, L.; Santos, J.C.F.; Japiassú, L.B.; Garcia, A.W.R.; Miguel, A.E. Fenologia do Cafeeiro: Condições Agrometeorológicas e Balanço Hídrico do Ano Agrícola 2004–2005; Embrapa Informação Tecnológica: Brasília, Brazil, 2009. [Google Scholar]


| Pivots | Latitude | Longitude | Altitude (m) | Surrounding Vegetation | Surrounding Vegetation (%) | |||
|---|---|---|---|---|---|---|---|---|
| North | East | South | West | |||||
| 1 | 12°17′58.57″ S | 45°31′07.58″ W | 700 | PPA | 0.00 | 0.00 | 26.59 | 0.00 |
| Pasture | 9.08 | 9.08 | 9.08 | 9.08 | ||||
| Coffee | 13.10 | 13.10 | 0.00 | 0.00 | ||||
| Maize | 0.00 | 0.00 | 0.00 | 10.86 | ||||
| 2 | 12°17′58.57″ S | 45°31′07.58″ W | 702 | PPA | 0.00 | 0.00 | 9.80 | 0.00 |
| Pasture | 15.99 | 15.99 | 15.99 | 15.99 | ||||
| Coffee | 8.74 | 8.74 | 0.00 | 8.74 | ||||
| 3 | 12°18′04.80″ S | 45°30′18.60″ W | 696 | PPA | 0.00 | 0.00 | 16.91 | 0.00 |
| Pasture | 25.37 | 25.37 | 0.00 | 25.37 | ||||
| Coffee | 0.00 | 3.49 | 0.00 | 3.49 | ||||
| 4 | 12°18′00.75″ S | 45°28′59.25″ W | 696 | PPA | 0.00 | 11.00 | 0.00 | 0.00 |
| Pasture | 16.69 | 16.69 | 16.69 | 16.69 | ||||
| Coffee | 7.41 | 7.41 | 0.00 | 7.41 | ||||
| 5 | 12°16′55.60″ S | 45°31′05.79″ W | 725 | Cerrado | 0.71 | 0.00 | 0.00 | 0.00 |
| Pasture | 11.75 | 11.75 | 11.75 | 11.75 | ||||
| Coffee | 12.69 | 12.69 | 12.69 | 0.00 | ||||
| Maize | 0.00 | 0.00 | 0.00 | 14.20 | ||||
| 6 | 12°17′15.25″ S | 45°30′32.71″ W | 724 | Pasture | 16.15 | 16.15 | 16.15 | 16.15 |
| Coffee | 8.85 | 8.85 | 8.85 | 8.85 | ||||
| 7 | 12°16′58.77″ S | 45°29′57.72″ W | 726 | Pasture | 14.70 | 14.70 | 14.70 | 14.70 |
| Coffee | 10.30 | 10.30 | 10.30 | 10.30 | ||||
| 8 | 12°17′26.68″ S | 45°29′21.76″ W | 716 | Pasture | 15.09 | 15.09 | 15.09 | 15.09 |
| Coffee | 9.91 | 9.91 | 9.91 | 9.91 | ||||
| 9 | 12°17′29.59″ S | 45°28′37.66″ W | 696 | PPA | 0.00 | 0.00 | 12.89 | 0.00 |
| Pasture | 17.10 | 17.10 | 17.10 | 17.10 | ||||
| Coffee | 9.35 | 9.35 | 0.00 | 0.00 | ||||
| 10 | 12°16′58.13″ S | 45°28′34.46″ W | 719 | Pasture | 18.25 | 18.25 | 18.25 | 18.25 |
| Coffee | 6.75 | 0.00 | 13.50 | 6.75 | ||||
| 11 | 12°16′35.41″ S | 45°29′02.14″ W | 723 | Pasture | 14.26 | 14.26 | 14.26 | 14.26 |
| Coffee | 14.32 | 0.00 | 14.32 | 14.32 | ||||
| 12 | 12°16′15.61″ S | 45°29′43.01″ W | 738 | Pasture | 11.81 | 19.57 | 11.81 | 11.81 |
| Coffee | 14.25 | 2.25 | 14.25 | 14.25 | ||||
| 13 | 12°16′37.66″ S | 45°30′29.57″ W | 738 | Pasture | 10.18 | 10.18 | 10.18 | 10.18 |
| Coffee | 14.82 | 14.82 | 14.82 | 14.82 | ||||
| 14 | 12°16′36.74″ S | 45°30′43.78″ W | 733 | Cerrado | 0.00 | 21.74 | 0.00 | 0.00 |
| Pasture | 13.63 | 0.00 | 13.63 | 13.63 | ||||
| Coffee | 12.02 | 12.02 | 12.02 | 0.00 | ||||
| Maize | 0.00 | 0.00 | 1.31 | 0.00 | ||||
| 15 | 12°16′05.13″ S | 45°30′37.98″ W | 741 | Cerrado | 7.60 | 0.00 | 0.00 | 7.60 |
| Pasture | 12.29 | 12.29 | 12.29 | 12.29 | ||||
| Coffee | 0.00 | 17.82 | 17.82 | 0.00 | ||||
| 16 | 12°15′49.18″ S | 45°30′03.91″ W | 740 | Cerrado | 18.82 | 0.00 | 0.00 | 0.00 |
| Pasture | 9.84 | 9.84 | 9.84 | 9.84 | ||||
| Coffee | 0 | 13.94 | 13.94 | 13.94 | ||||
| 17 | 12°15′56.03″ S | 45°29′26.17″ W | 741 | Cerrado | 13.91 | 0.00 | 0.00 | 0.00 |
| Pasture | 13.46 | 13.46 | 13.46 | 13.46 | ||||
| Coffee | 0.00 | 10.75 | 10.75 | 10.75 | ||||
| 18 | 12°16′05.79″ S | 45°28′41.41″ W | 740 | Cerrado | 8.43 | 0.00 | 0.00 | 0.00 |
| Pasture | 15.11 | 15.11 | 15.11 | 25.50 | ||||
| Coffee | 0.00 | 0.00 | 10.36 | 10.36 | ||||
| Date | Model | Anisotropy | Major Range (A0) | Minor Range (A0) | Direction (Degrees) | C | Mean | RMSE | ME | RMSSE | ASE | RSD | |
|---|---|---|---|---|---|---|---|---|---|---|---|---|---|
| 1/4/2016 | Spherical | No | 1775.56 | - | - | 0.00081 | 0.0185 | 0.0027 | 0.0904 | 0.0186 | 0.9999 | 0.0917 | 0.0420 |
| 1/5/2016 | Spherical | No | 1086.17 | - | - | 0.00000 | 0.0136 | 0.0053 | 0.1016 | 0.0387 | 1.0043 | 0.0999 | 0.0000 |
| 1/6/2016 | Spherical | No | 1481.13 | - | - | 0.00000 | 0.0163 | 0.0023 | 0.0889 | 0.0190 | 0.9926 | 0.0903 | 0.0000 |
| 1/7/2016 | Spherical | No | 1449.60 | - | - | 0.00201 | 0.0125 | 0.0013 | 0.0903 | 0.0144 | 1.0097 | 0.0899 | 0.1390 |
| 1/8/2016 | Spherical | No | 1382.90 | - | - | 0.00000 | 0.0127 | 0.0020 | 0.0825 | 0.0182 | 0.9782 | 0.0830 | 0.0000 |
| 1/9/2016 | Spherical | No | 1246.14 | - | - | 0.00000 | 0.0098 | 0.0010 | 0.0768 | 0.0089 | 1.0032 | 0.0776 | 0.0000 |
| 1/10/2016 | Spherical | Yes | 4452.01 | 1701.36 | 56.43 | 0.00449 | 0.0302 | 0.0001 | 0.1097 | 0.0031 | 1.0010 | 0.1113 | 0.1295 |
| 1/11/2016 | Spherical | Yes | 2663.02 | 891.58 | 58.18 | 0.00032 | 0.0103 | 0.0001 | 0.0707 | 0.0008 | 0.9920 | 0.0709 | 0.0303 |
| 1/12/2016 | Spherical | No | 891.58 | - | - | 0.00281 | 0.0066 | 0.0003 | 0.0826 | 0.0055 | 1.0038 | 0.0831 | 0.2997 |
| 1/1/2017 | Exponential | No | 4222.48 | - | - | 0.00002 | 0.0207 | 0.0010 | 0.0798 | 0.0067 | 1.0011 | 0.0814 | 0.0007 |
| 1/2/2017 | Spherical | No | 2389.14 | - | - | 0.00203 | 0.0316 | 0.0013 | 0.1058 | 0.0099 | 1.0012 | 1.0012 | 0.0603 |
| 1/3/2017 | Spherical | No | 1254.05 | - | - | 0.00000 | 0.0169 | 0.0012 | 0.1016 | 0.0021 | 1.0031 | 1.0031 | 0.0000 |
| 1/4/2017 | Exponential | No | 1583.42 | - | - | 0.00000 | 0.0073 | 0.0016 | 0.0738 | 0.0186 | 1.0083 | 0.0727 | 0.0000 |
| 1/5/2017 | Spherical | No | 1414.89 | - | - | 0.00000 | 0.0034 | 0.0034 | 0.0430 | 0.0108 | 1.0004 | 0.0426 | 0.0000 |
| 1/6/2017 | Gaussian | Yes | 1152.18 | 891.58 | 18.98 | 0.00000 | 0.0033 | 0.0256 | 0.0410 | 0.0256 | 1.0041 | 0.0409 | 0.0010 |
| 1/7/2017 | Exponential | Yes | 2051.51 | 1035.43 | 136.76 | 0.00000 | 0.0038 | 0.0009 | 0.0558 | 0.0135 | 1.0258 | 0.0534 | 0.0000 |
| 1/8/2017 | Spherical | No | 4974.43 | - | - | 0.00000 | 0.0367 | 0.0006 | 0.0705 | 0.0042 | 0.9716 | 0.0721 | 0.0000 |
| 1/9/2017 | Spherical | No | 4554.92 | - | - | 0.00687 | 0.0366 | 0.0008 | 0.1204 | 0.0051 | 1.0395 | 0.1146 | 0.1582 |
| 1/10/2017 | Circular | No | 1565.12 | - | - | 0.00000 | 0.0436 | 0.0003 | 0.1193 | 0.0047 | 0.9477 | 0.1280 | 0.0000 |
| 1/11/2017 | Exponential | No | 935.10 | - | - | 0.00000 | 0.0092 | 0.0008 | 0.0936 | 0.0048 | 0.9973 | 0.0943 | 0.0000 |
| 1/12/2017 | Gaussian | No | 4012.69 | - | - | 0.00196 | 0.0145 | 0.0005 | 0.0523 | 0.0101 | 1.0199 | 0.0505 | 0.1189 |
| 1/1/2018 | Gaussian | No | 3882.12 | - | - | 0.00093 | 0.0048 | 0.0008 | 0.0346 | 0.0183 | 0.9994 | 0.0343 | 0.1621 |
| 1/2/2018 | Gaussian | No | 1482.70 | - | - | 0.00059 | 0.0013 | 0.0001 | 0.0302 | 0.0056 | 1.0005 | 0.0305 | 0.3054 |
| 1/3/2018 | Gaussian | No | 1796.67 | - | - | 0.00119 | 0.0053 | 0.0000 | 0.0450 | 0.0047 | 1.0177 | 0.0458 | 0.1837 |
| 1/4/2018 | Gaussian | No | 2266.36 | - | - | 0.00153 | 0.0109 | 0.0005 | 0.0489 | 0.0054 | 1.0062 | 0.0499 | 0.1232 |
| 1/5/2018 | Gaussian | No | 1090.22 | - | - | 0.00012 | 0.1200 | 0.0007 | 0.0485 | 0.0251 | 1.0100 | 0.0514 | 0.0010 |
| 1/6/2018 | Spherical | No | 1219.08 | - | - | 0.00000 | 0.0697 | 0.0020 | 0.0446 | 0.0150 | 1.0012 | 0.0539 | 0.0000 |
| 1/7/2018 | Gaussian | No | 1323.05 | - | - | 0.00023 | 0.2273 | 0.0085 | 0.0774 | 0.0062 | 1.0269 | 0.0932 | 0.0010 |
| 1/8/2018 | Gaussian | No | 1035.68 | - | - | 0.00000 | 0.0036 | 0.0010 | 0.0401 | 0.0164 | 1.0015 | 0.0406 | 0.0010 |
| 1/9/2018 | Spherical | No | 1043.13 | - | - | 0.00025 | 0.0021 | 0.0015 | 0.0416 | 0.0349 | 1.0043 | 0.0413 | 0.1086 |
| 1/10/2018 | Gaussian | No | 891.58 | - | - | 0.00004 | 0.0019 | 0.0003 | 0.0358 | 0.0119 | 1.0080 | 0.0354 | 0.0202 |
| 1/11/2018 | Spherical | No | 1348.62 | - | - | 0.00000 | 0.0011 | 0.0005 | 0.0245 | 0.0219 | 1.0007 | 0.0246 | 0.0000 |
| 1/12/2018 | Exponential | No | 1766.54 | - | - | 0.00000 | 0.0008 | 0.0003 | 0.0233 | 0.0109 | 0.9982 | 0.0235 | 0.0000 |
| 1/1/2019 | Exponential | No | 3291.74 | - | - | 0.00000 | 0.0010 | 0.0001 | 0.0201 | 0.0033 | 1.0003 | 0.0204 | 0.0000 |
| 1/2/2019 | Spherical | No | 2243.60 | - | - | 0.00000 | 0.0012 | 0.0000 | 0.0193 | 0.0007 | 1.0015 | 0.0193 | 0.0000 |
| 1/3/2019 | Spherical | No | 2248.93 | - | - | 0.00000 | 0.0032 | 0.0008 | 0.0317 | 0.0239 | 0.9981 | 0.0328 | 0.0000 |
| 1/4/2019 | Gaussian | No | 1094.75 | - | - | 0.00001 | 0.0057 | 0.0002 | 0.0433 | 0.0043 | 1.0015 | 0.0471 | 0.0010 |
| 1/5/2019 | Exponential | No | 1633.17 | - | - | 0.00000 | 0.0068 | 0.0022 | 0.0689 | 0.0270 | 1.0034 | 0.0689 | 0.0000 |
| 1/6/2019 | Spherical | No | 1280.81 | - | - | 0.00000 | 0.0105 | 0.0010 | 0.0785 | 0.0077 | 1.0042 | 0.0789 | 0.0000 |
| 1/7/2019 | Spherical | No | 996.88 | - | - | 0.00000 | 0.0045 | 0.0001 | 0.0595 | 0.0040 | 1.0011 | 0.0596 | 0.0000 |
| 1/8/2019 | Gaussian | No | 2146.96 | - | - | 0.00080 | 0.0045 | 0.0001 | 0.0353 | 0.0012 | 1.0000 | 0.0358 | 0.1517 |
| 1/9/2019 | Spherical | No | 1340.11 | - | - | 0.00000 | 0.0014 | 0.0001 | 0.0283 | 0.0032 | 0.9934 | 0.0288 | 0.0000 |
| 1/10/2019 | Spherical | No | 983.21 | - | - | 0.00000 | 0.0005 | 0.0004 | 0.0209 | 0.0199 | 1.0164 | 0.0206 | 0.0000 |
| 1/11/2019 | Gaussian | No | 1280.59 | - | - | 0.00000 | 0.0023 | 0.0008 | 0.0249 | 0.0297 | 1.0003 | 0.0246 | 0.0010 |
| 1/12/2019 | Spherical | No | 1300.13 | - | - | 0.00000 | 0.0013 | 0.0013 | 0.0285 | 0.0183 | 0.9986 | 0.0277 | 0.0000 |
| 1/1/2020 | Spherical | No | 1087.35 | - | - | 0.00000 | 0.0006 | 0.0004 | 0.0208 | 0.0147 | 0.9995 | 0.0208 | 0.0000 |
| 1/2/2020 | Spherical | No | 891.58 | - | - | 0.00003 | 0.0001 | 0.0004 | 0.0114 | 0.0303 | 0.9973 | 0.0114 | 0.1685 |
Disclaimer/Publisher’s Note: The statements, opinions and data contained in all publications are solely those of the individual author(s) and contributor(s) and not of MDPI and/or the editor(s). MDPI and/or the editor(s) disclaim responsibility for any injury to people or property resulting from any ideas, methods, instructions or products referred to in the content. |
© 2023 by the authors. Licensee MDPI, Basel, Switzerland. This article is an open access article distributed under the terms and conditions of the Creative Commons Attribution (CC BY) license (https://creativecommons.org/licenses/by/4.0/).
Share and Cite
Walerius, A.H.; Pallini, A.; Venzon, M.; Santana Júnior, P.A.; Costa, T.L.; Paes, J.d.S.; Pimentel, E.d.S.; Picanço, M.C. Use of Geostatistics as a Tool to Study Spatial-Temporal Dynamics of Leucoptera coffeella in Coffee Crops. Agriculture 2023, 13, 438. https://doi.org/10.3390/agriculture13020438
Walerius AH, Pallini A, Venzon M, Santana Júnior PA, Costa TL, Paes JdS, Pimentel EdS, Picanço MC. Use of Geostatistics as a Tool to Study Spatial-Temporal Dynamics of Leucoptera coffeella in Coffee Crops. Agriculture. 2023; 13(2):438. https://doi.org/10.3390/agriculture13020438
Chicago/Turabian StyleWalerius, Adriana H., Angelo Pallini, Madelaine Venzon, Paulo A. Santana Júnior, Thiago L. Costa, Jhersyka da S. Paes, Emílio de S. Pimentel, and Marcelo C. Picanço. 2023. "Use of Geostatistics as a Tool to Study Spatial-Temporal Dynamics of Leucoptera coffeella in Coffee Crops" Agriculture 13, no. 2: 438. https://doi.org/10.3390/agriculture13020438