
The Effect of Using Augmented Reality Technology in Takeaway Food Packaging to Improve Young Consumers’ Negative Evaluations

 ,
, 
 ,
,  ,
,  ,
,  , and
, and 
Abstract
:1. Introduction
1.1. Research Background
1.2. Research Purposes
2. Literature Review and Research Hypotheses
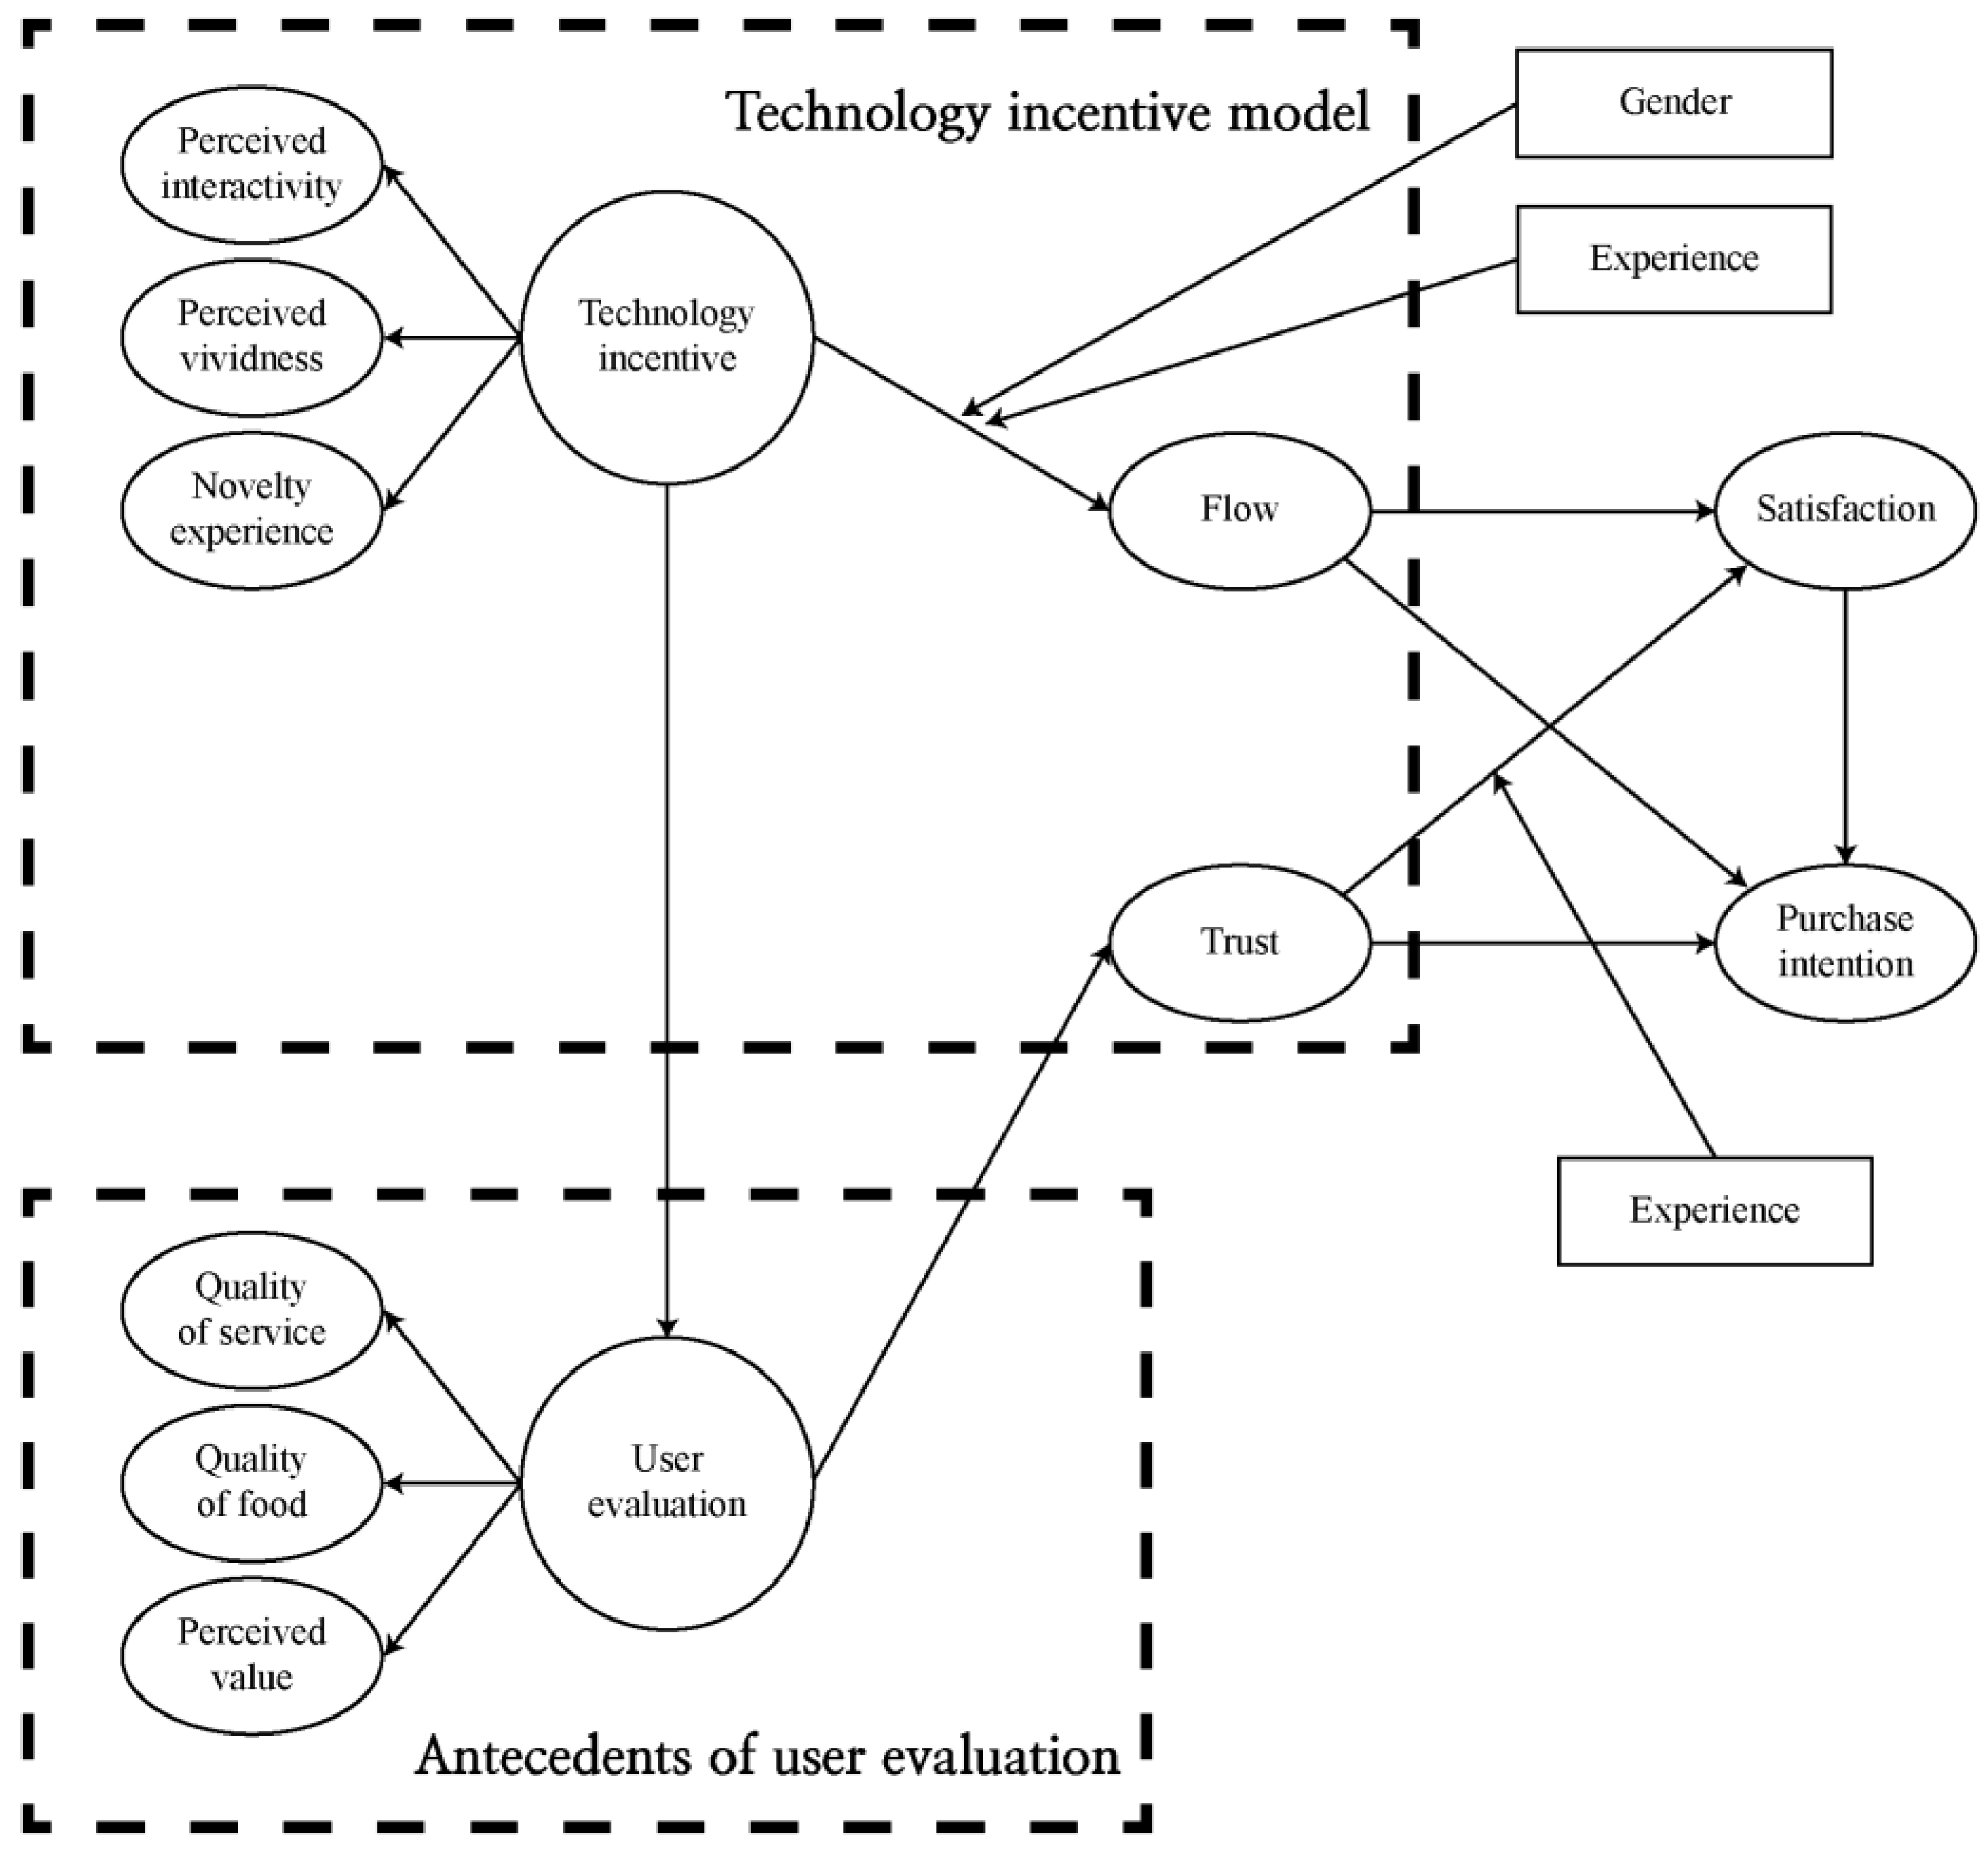
2.1. Technology Incentive Model
2.1.1. Perceived Interactivity (PI)
2.1.2. Perceived Vividness (PV)
2.1.3. Novelty Experience (NE)
2.1.4. Flow (FL)
2.1.5. Trust (TR)
2.2. Satisfaction (SA)
2.3. Purchase Intention (PuI)
2.4. Consumer Behavior and Packaging Design
3. Research Method
3.1. Finding Out What Drives Negative Consumer Evaluations of Takeout Food
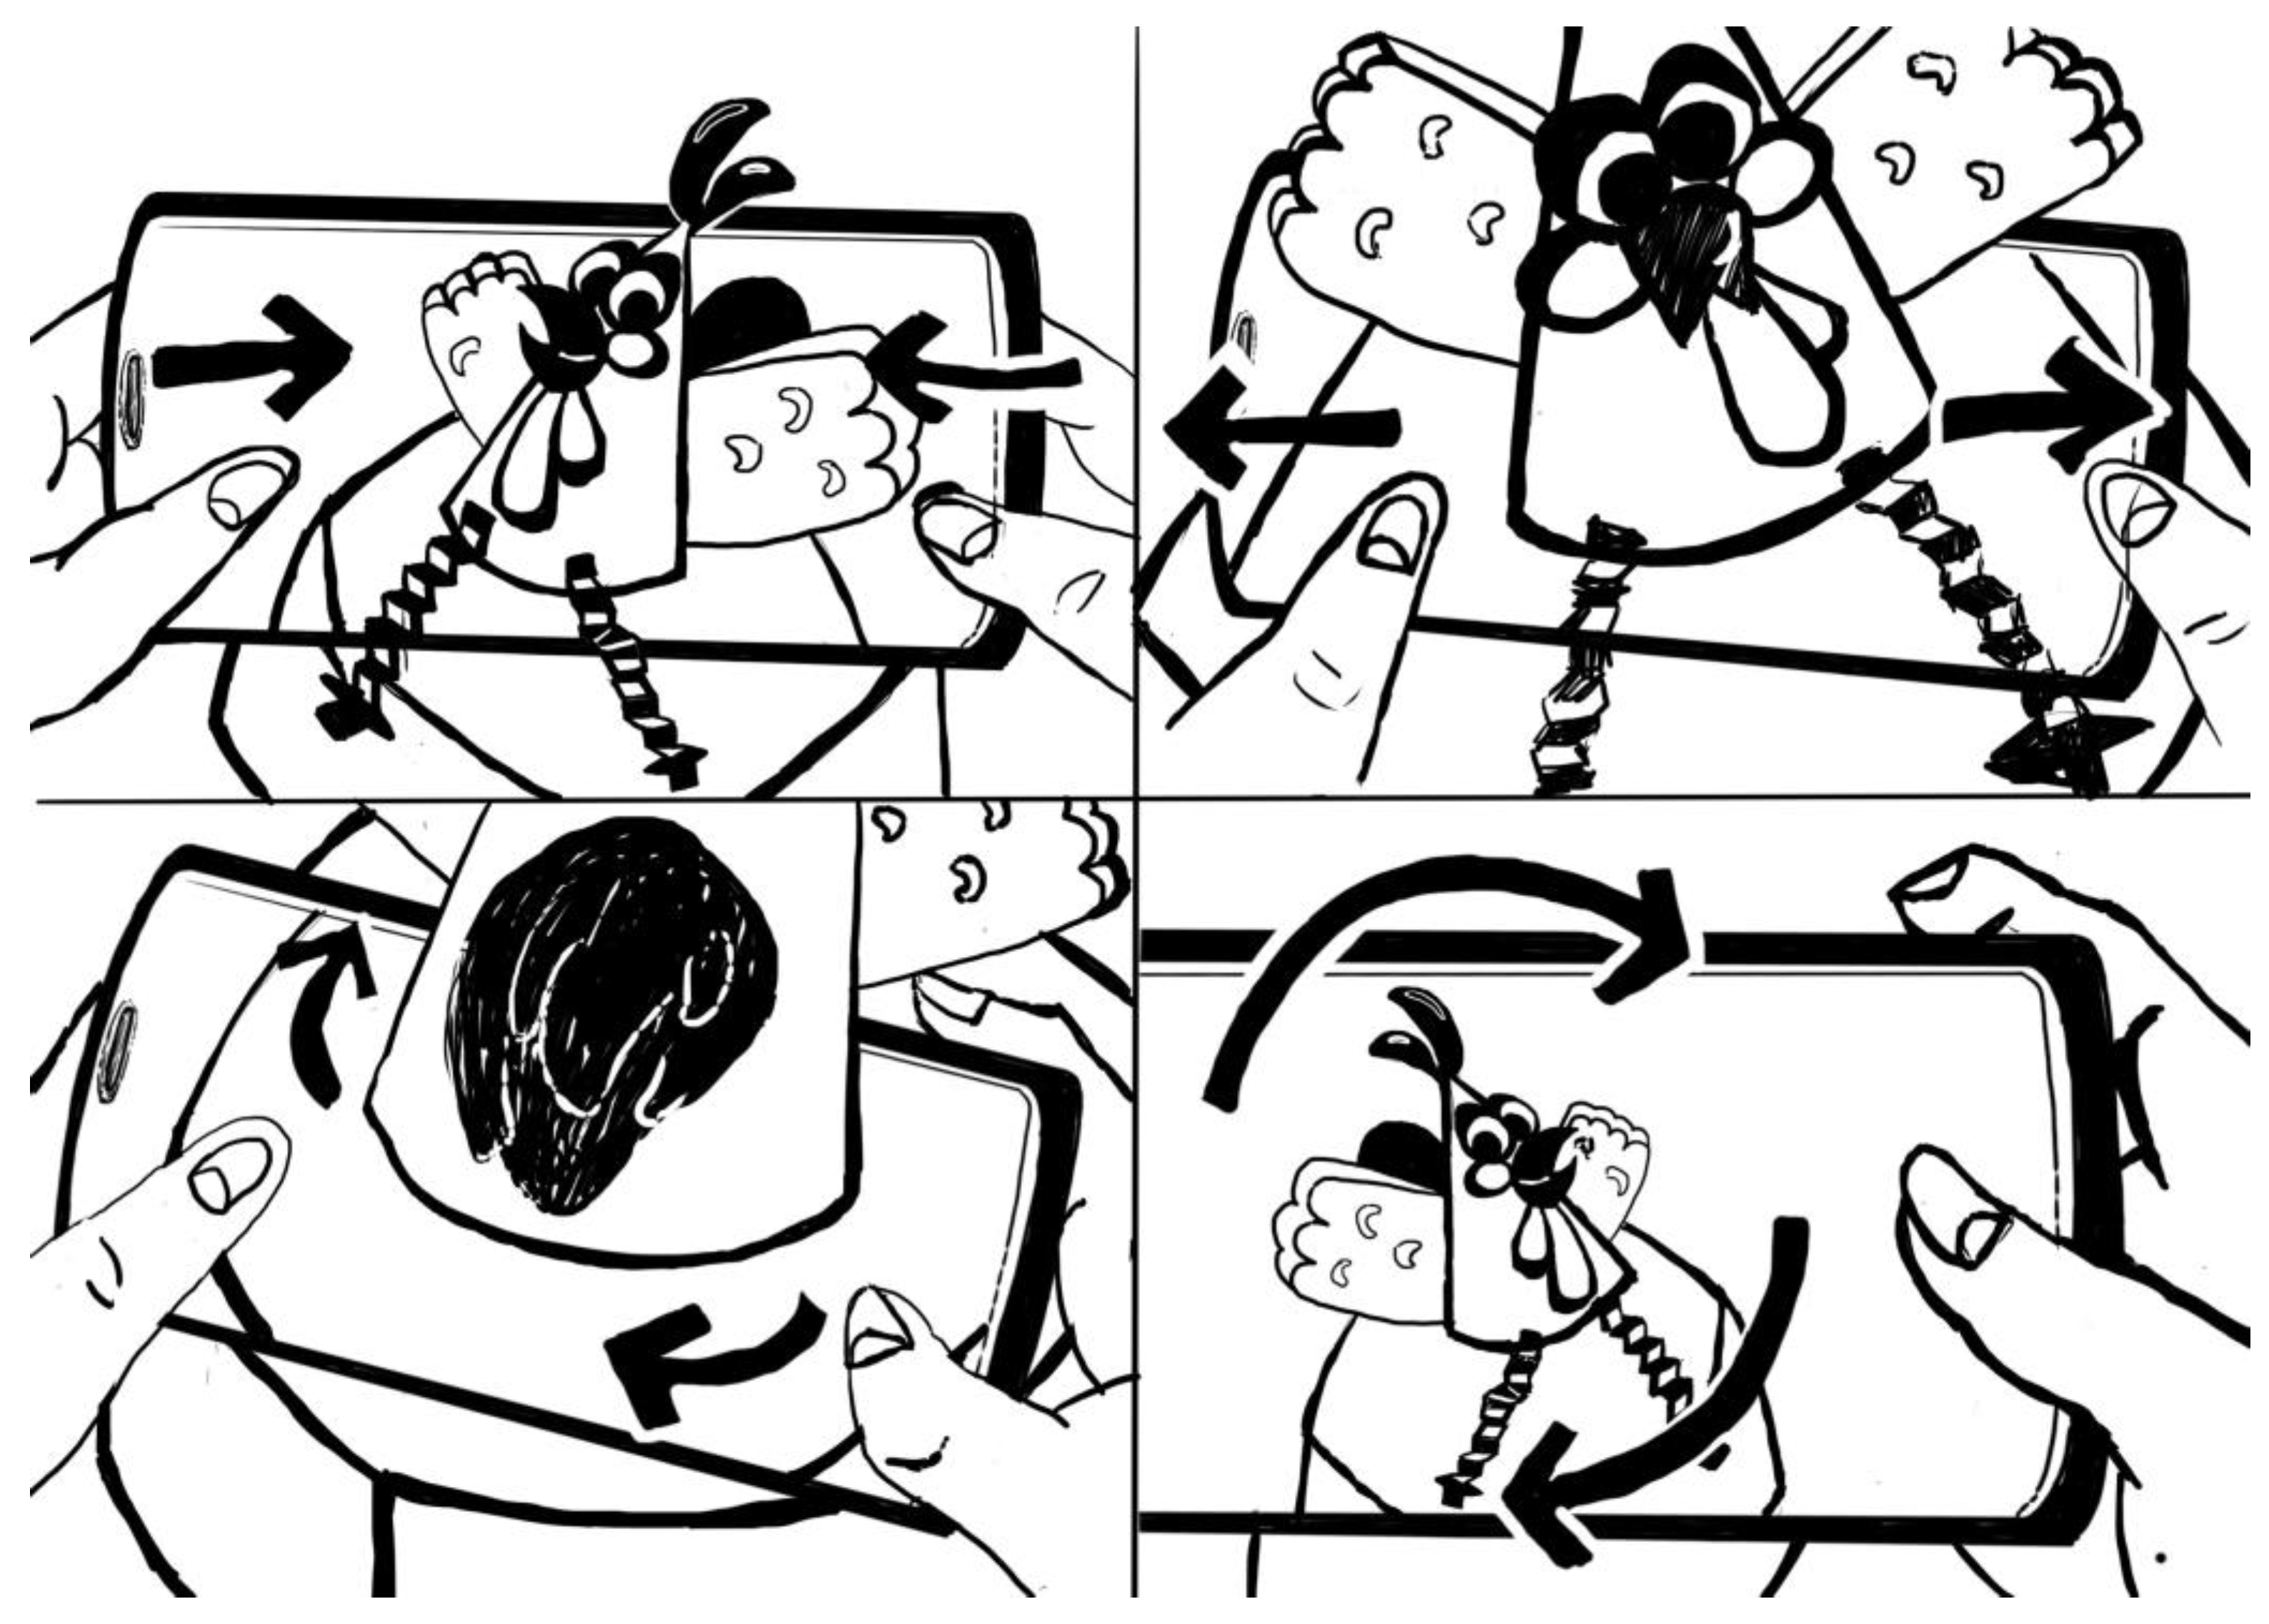
3.2. Design of Augmented Reality Packaging
3.3. Questionnaire Design
3.4. Collection of Data
4. Results
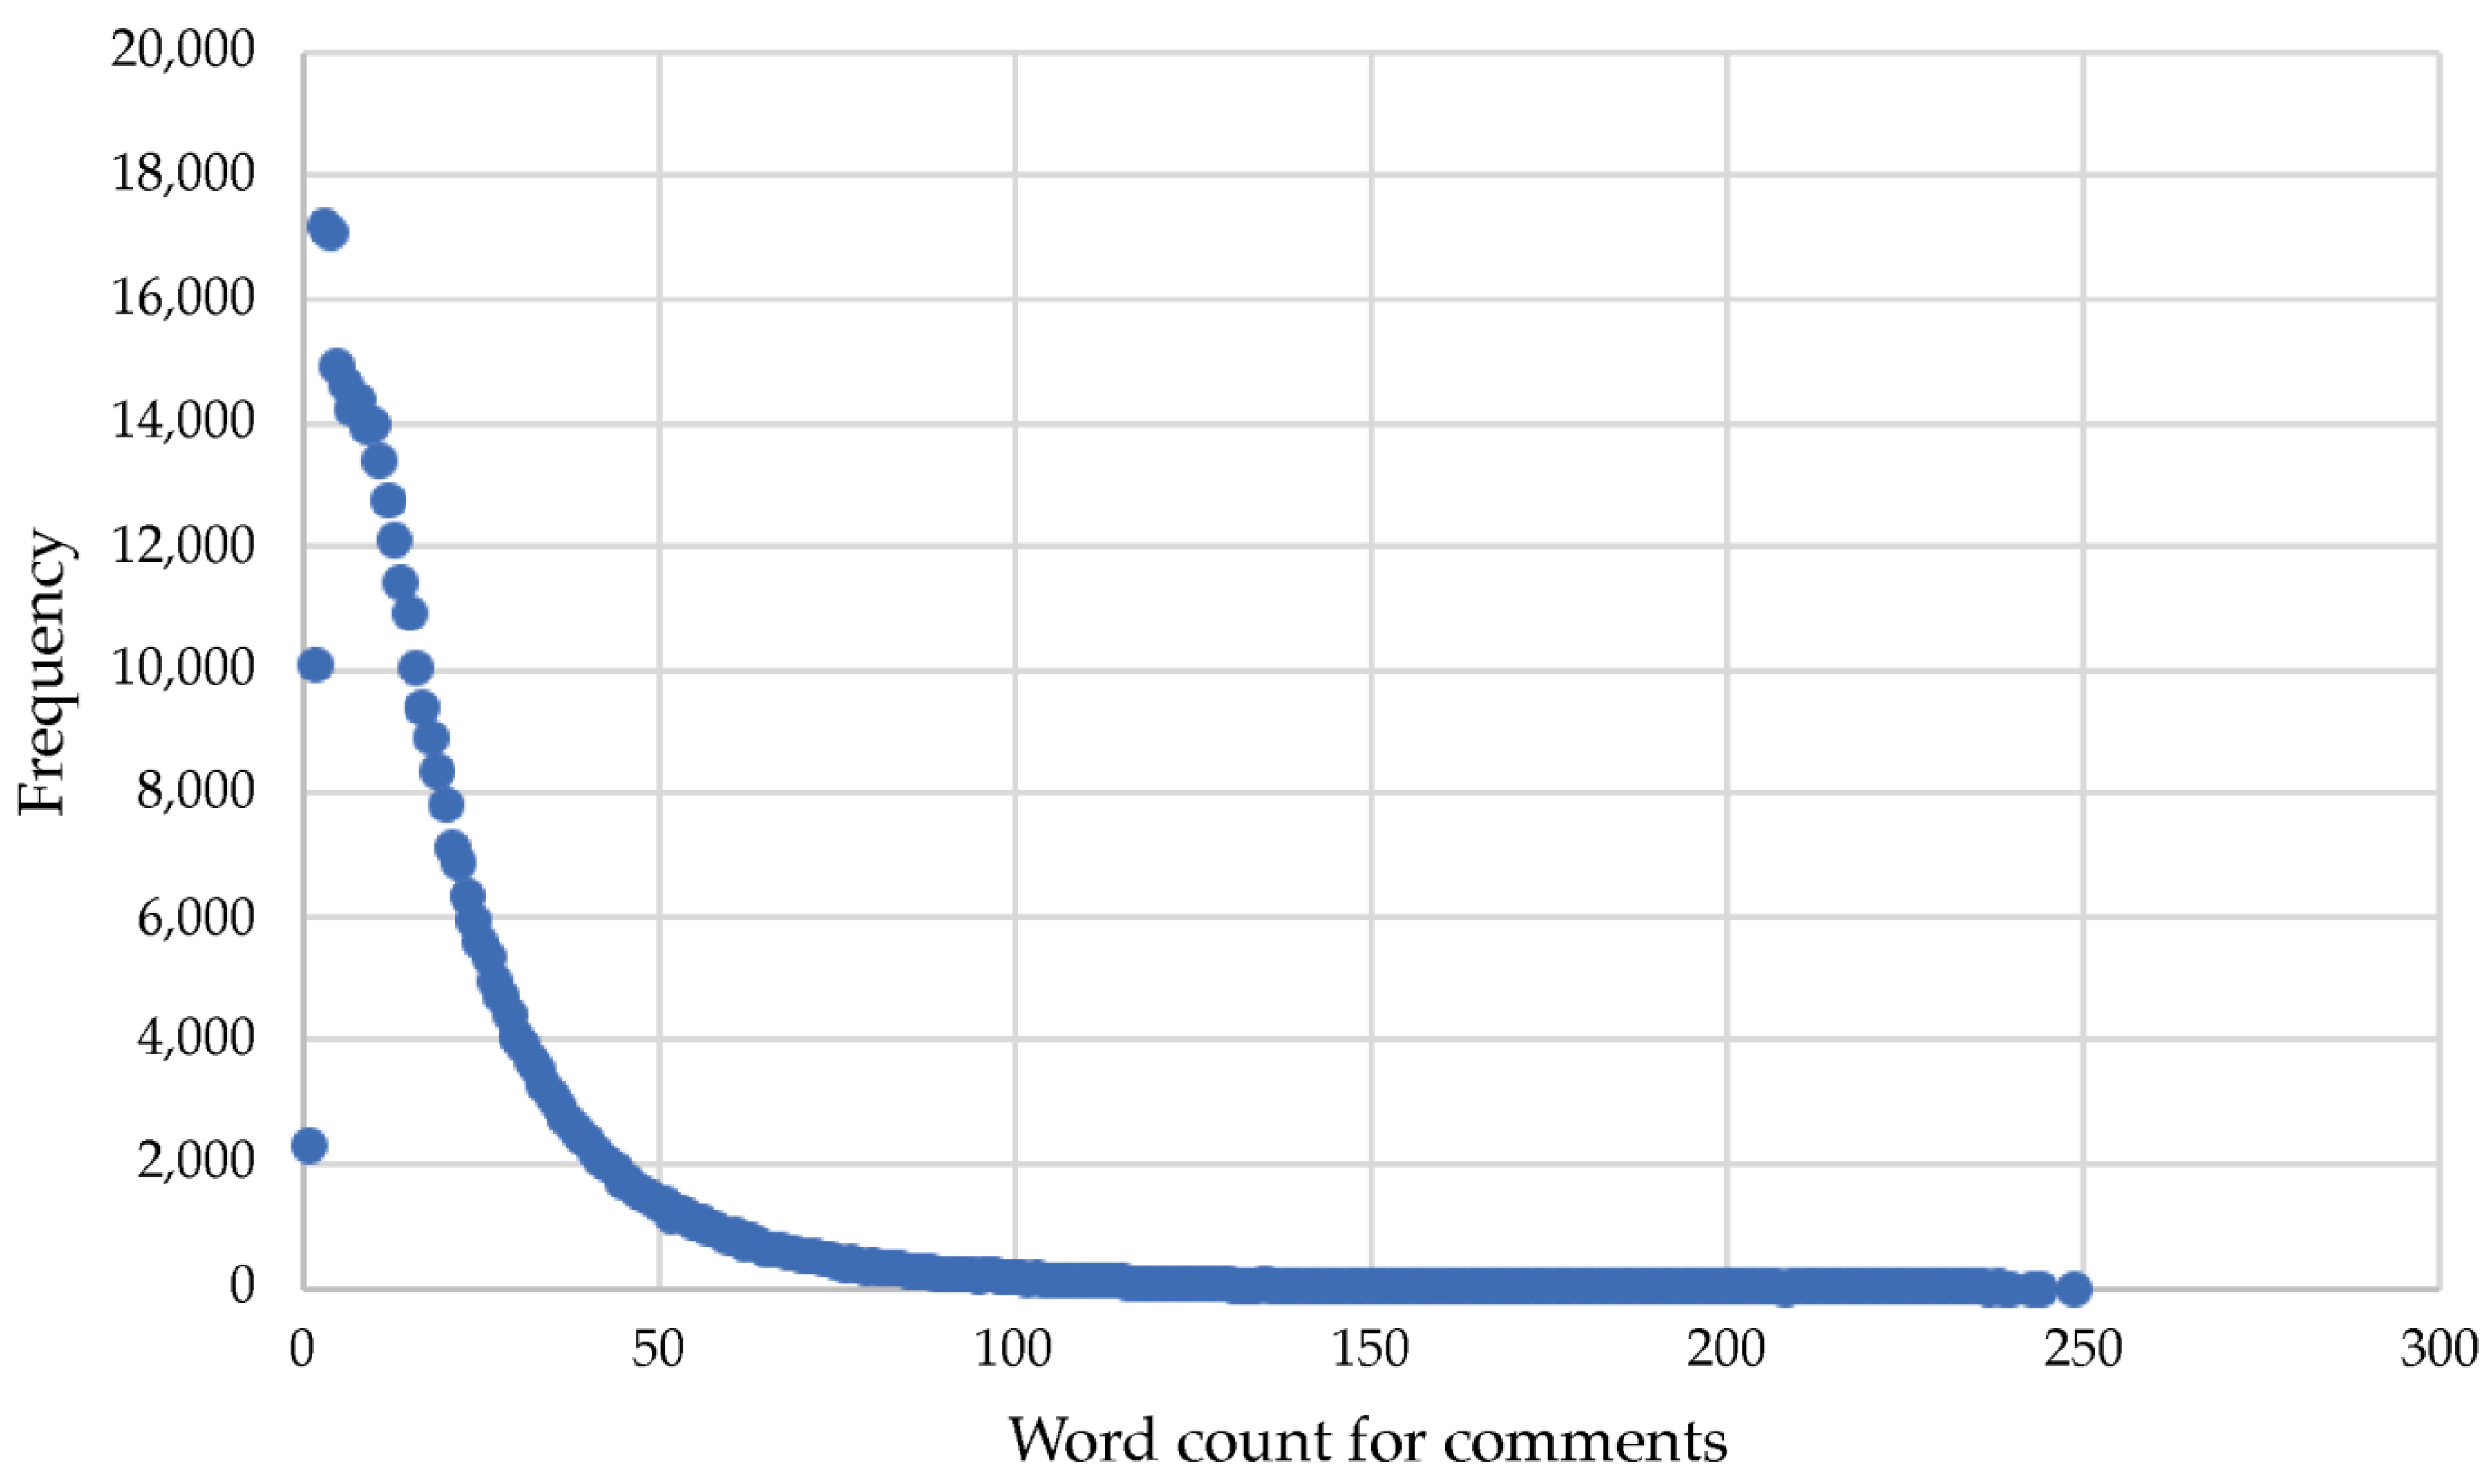
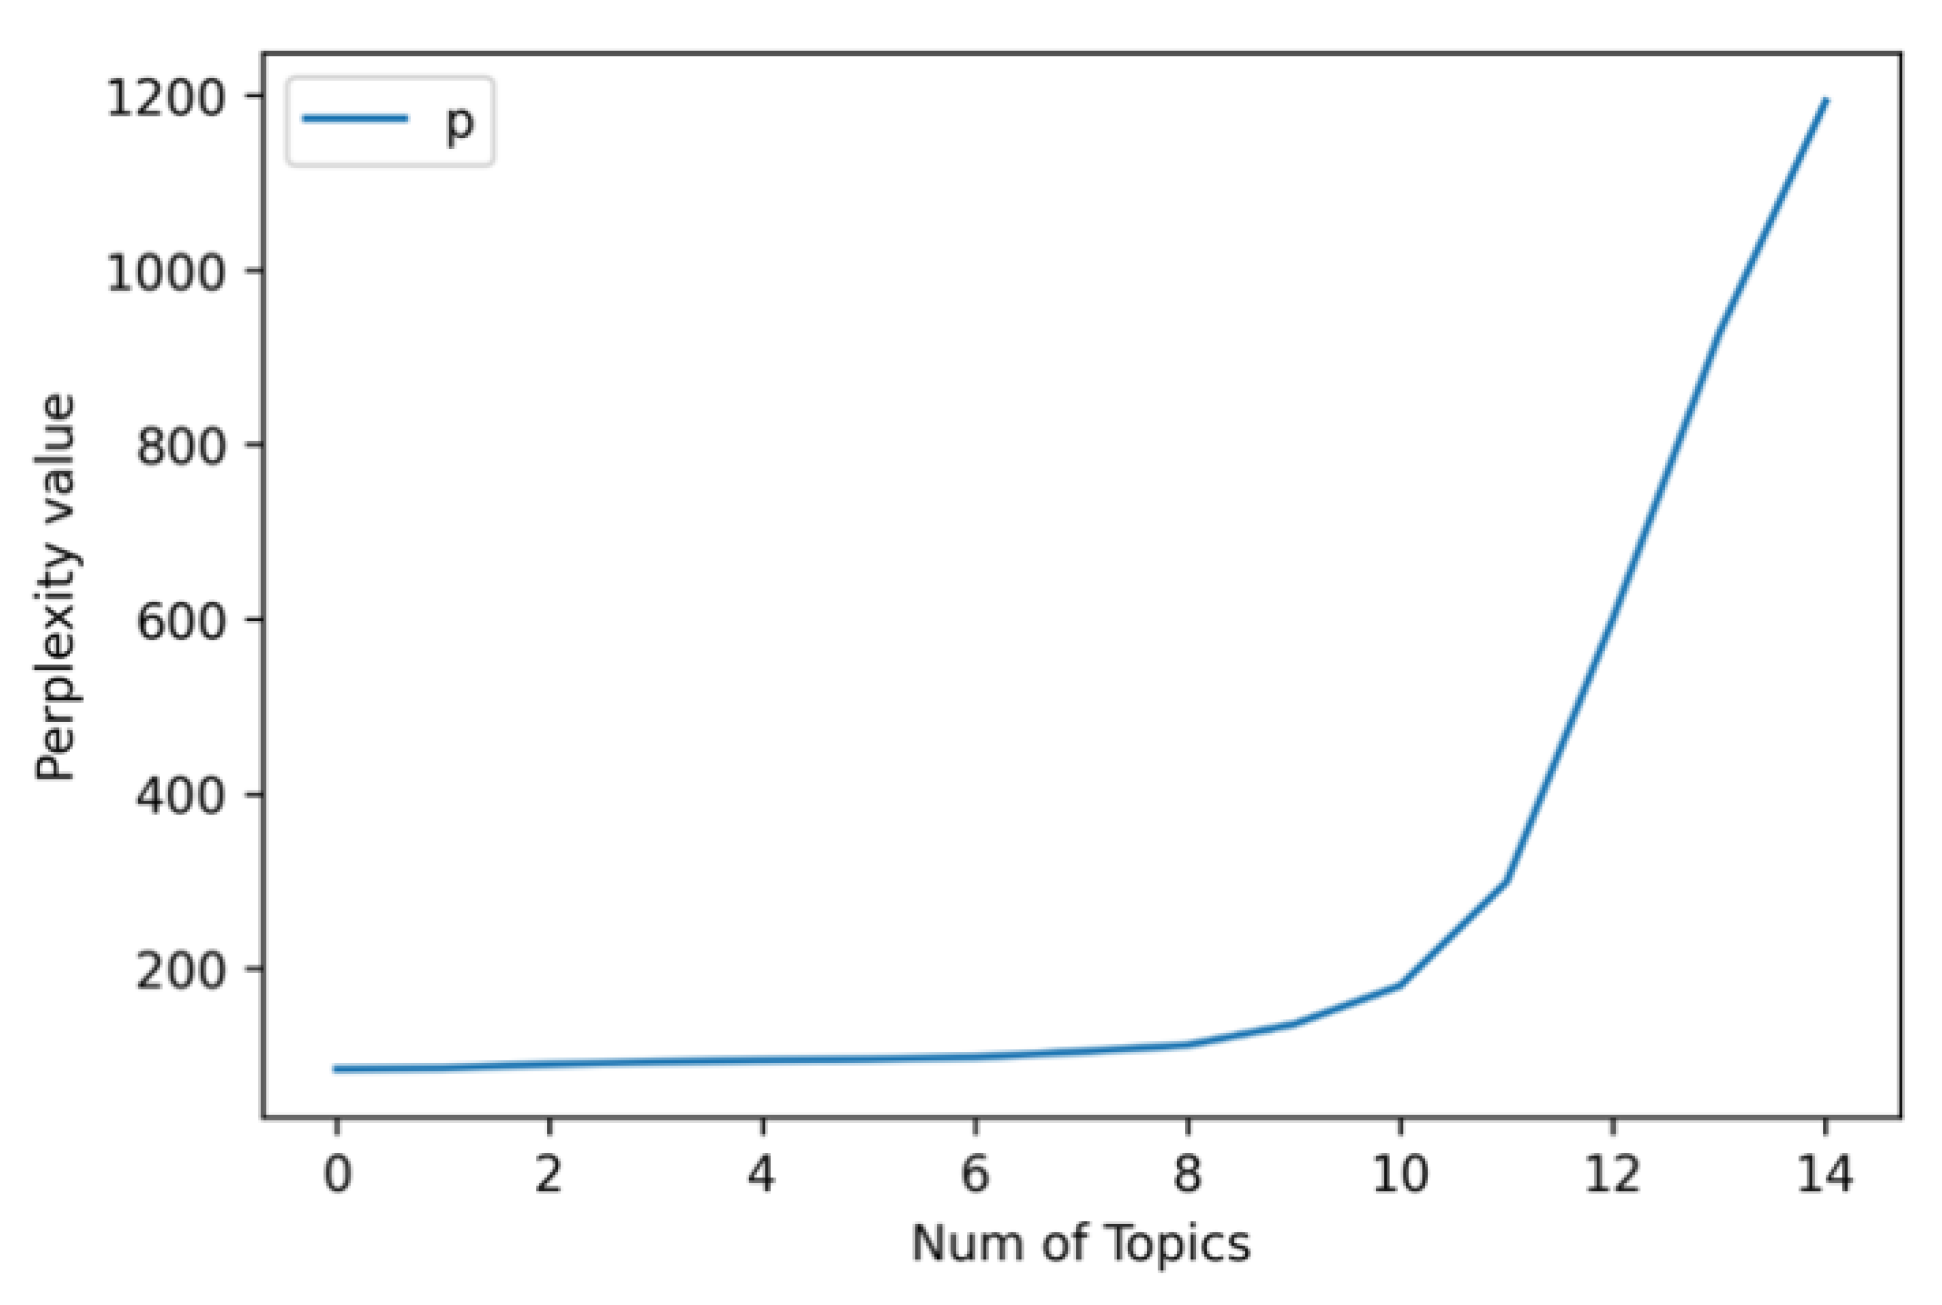
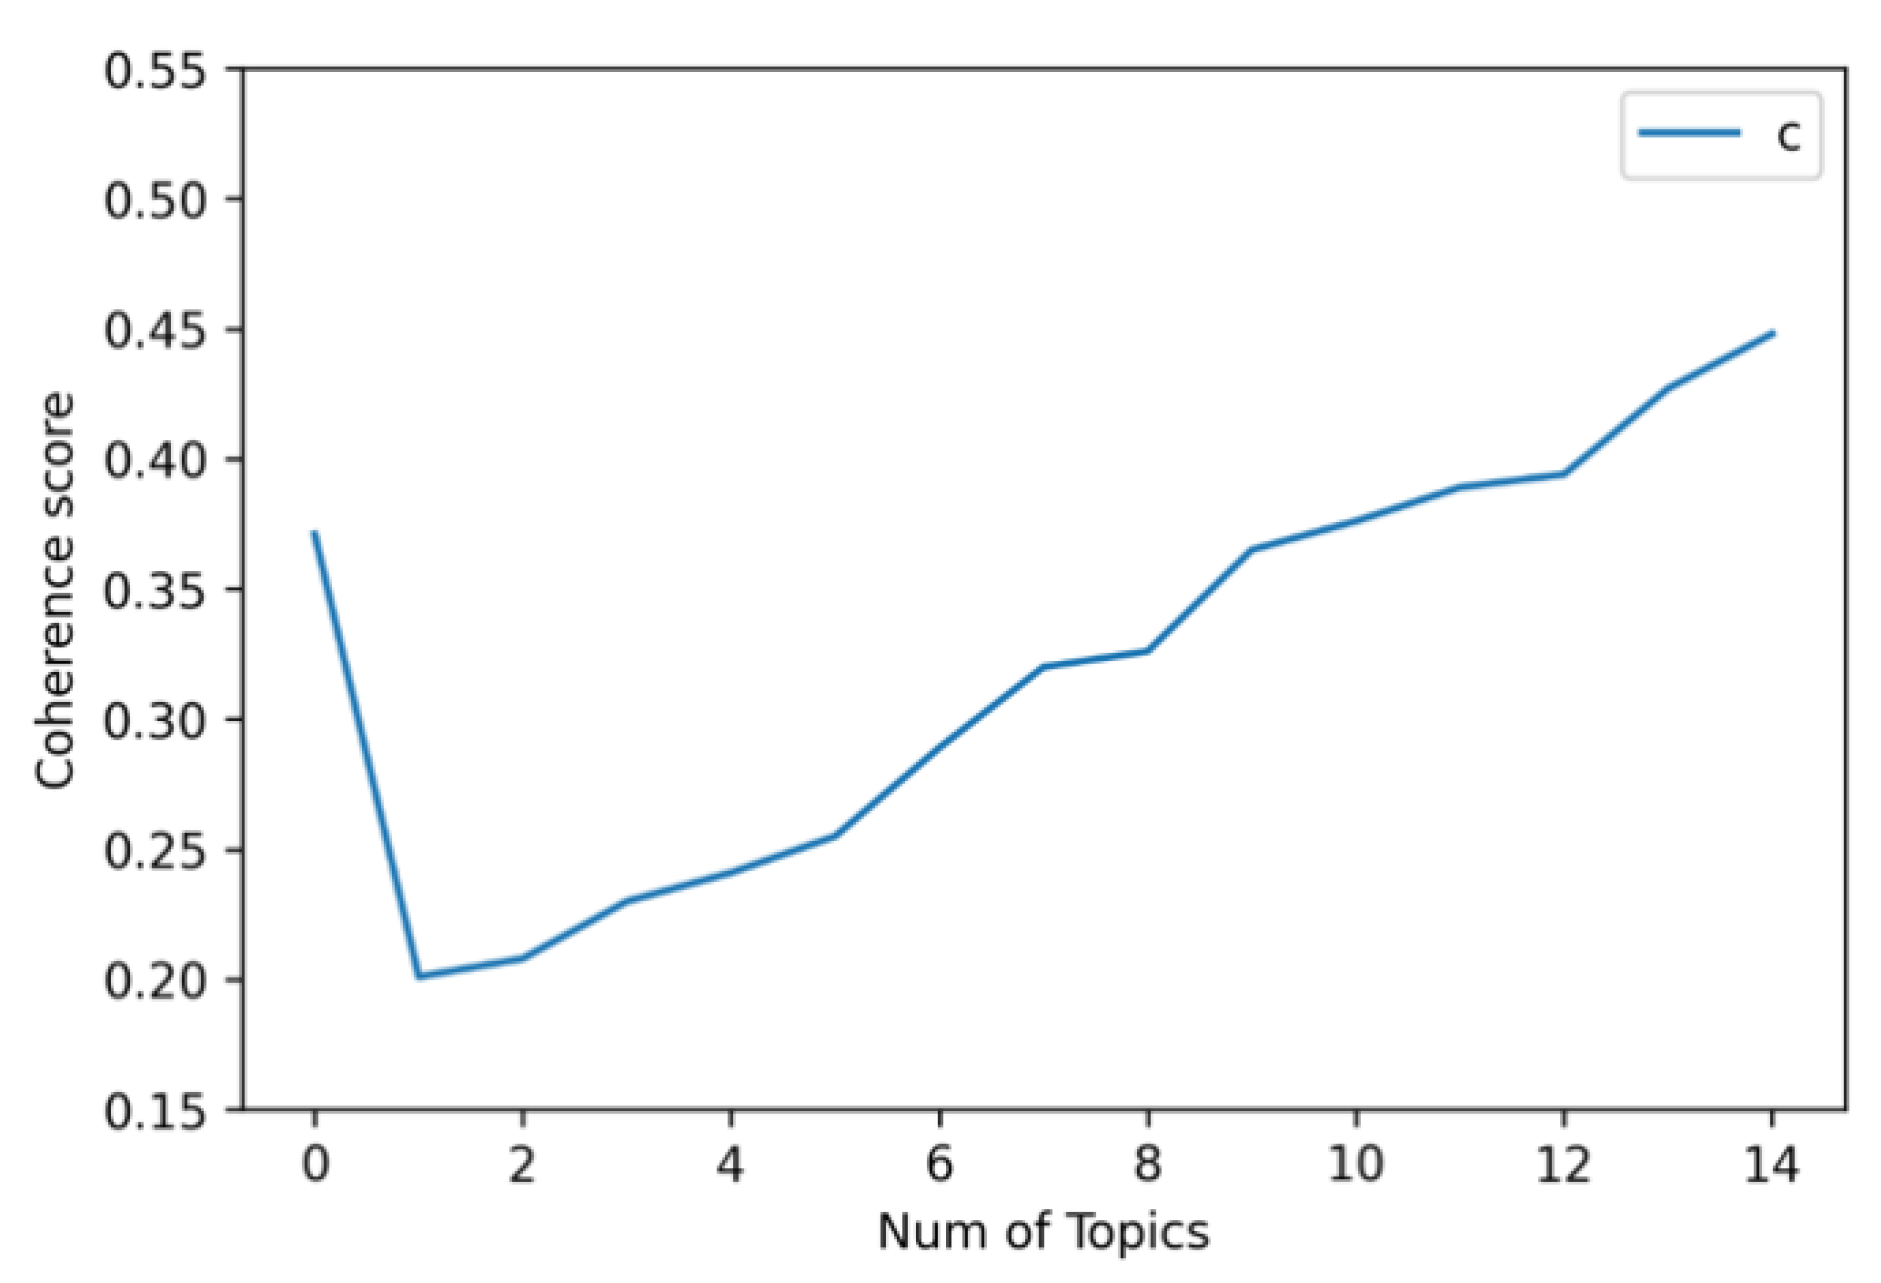
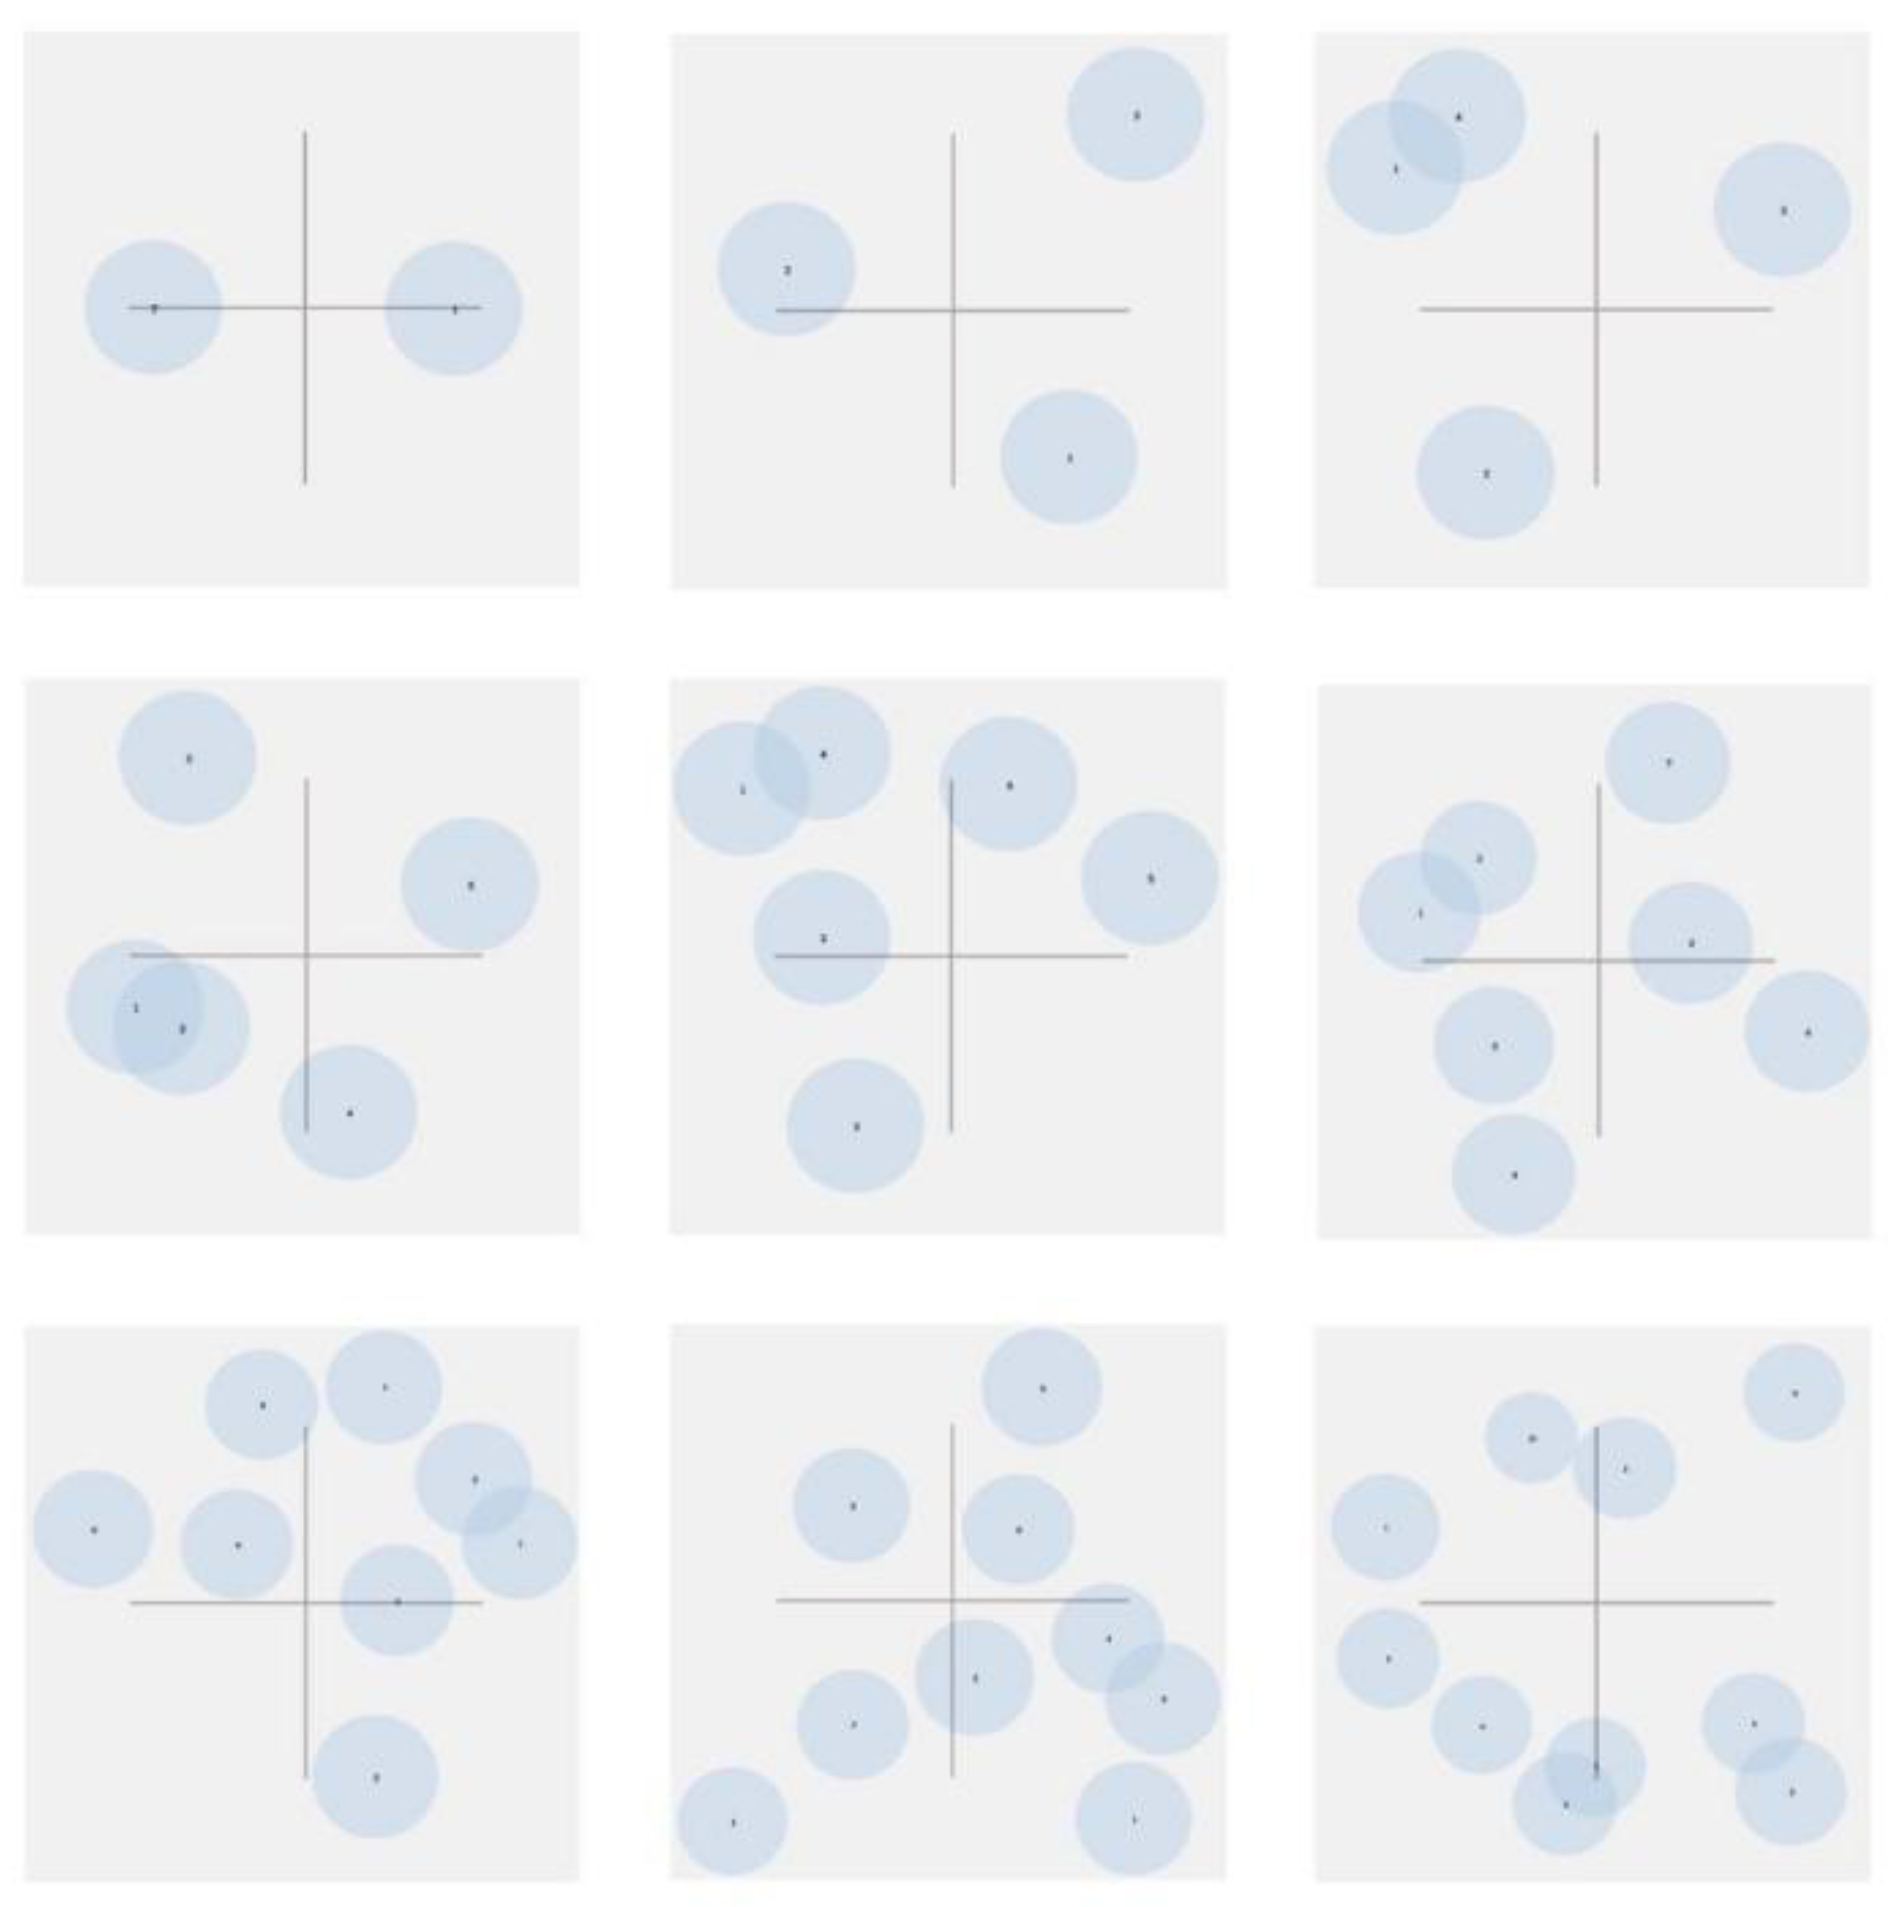
4.1. Study 1—Finding Out What Drives Negative Consumer Evaluations of Takeout Food
- Topic 1. Quality of service (QoS).
- Topic 2. Quality of food (QoF).
- Topic 3. Perceived value (PVL).
4.2. Study 2—The Differences between Traditional Packaging and AR Packaging
4.3. Study 3—The Effectiveness of AR Packaging in Improving Negative Evaluations
4.3.1. Reliability Analysis
4.3.2. Exploratory Factor Analysis
4.3.3. Confirmatory Factor Analysis
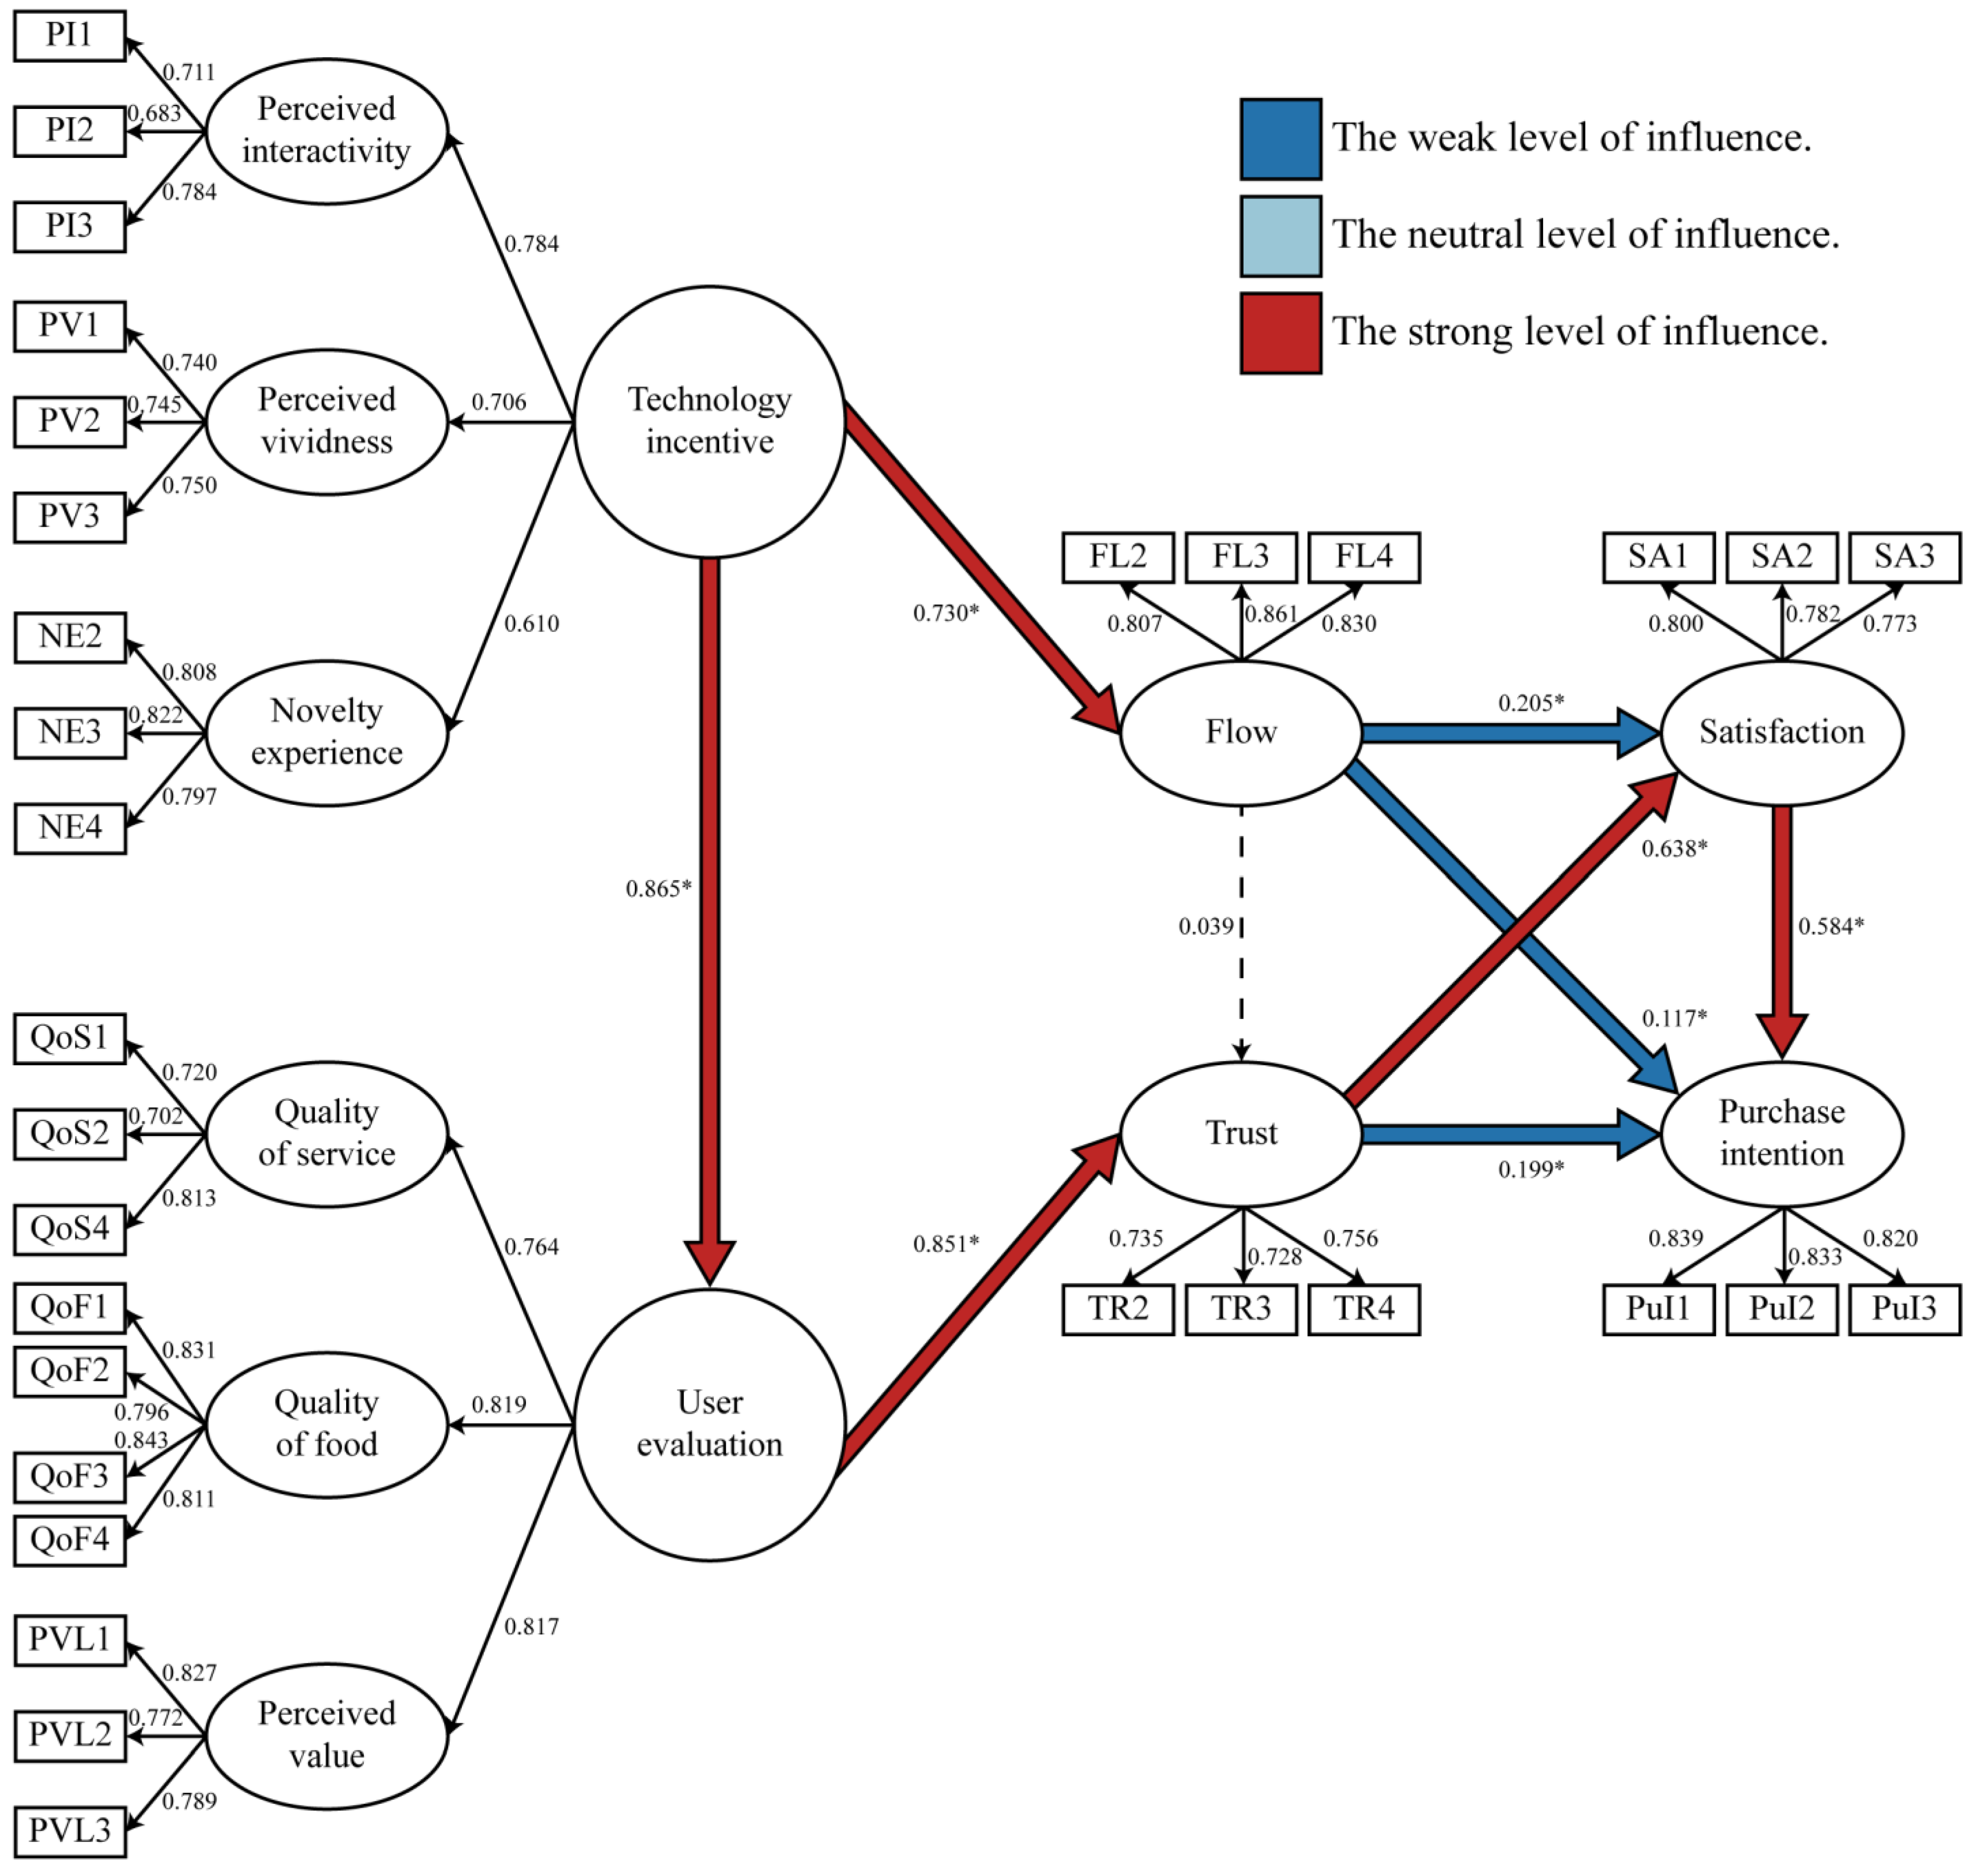
4.3.4. Structural Equation Model (SEM)
5. Discussion
6. Conclusions
6.1. Contribution
6.2. Limitions and Future Studies
Author Contributions
Funding
Institutional Review Board Statement
Informed Consent Statement
Data Availability Statement
Acknowledgments
Conflicts of Interest
Appendix A

| Constructs | Items | Source |
|---|---|---|
| Perceived interactivity | PI1: Overall, using AR takeaway packaging is highly interactive. | [143] |
| PI2: The interaction in takeaway packaging using AR technology is efficient and clear. | ||
| PI3: Takeaway packaging using AR technology fits well with my needs. | ||
| Perceived vividness | PV1: Using AR takeaway packaging makes me feel dynamic. | [144] |
| PV2: Using AR takeaway packaging provides me with a lot of vividness. | ||
| PV3: I enjoy using AR takeaway packaging. | ||
| Novel experience | NE1: Many aspects of takeaway packaging using AR technology were novel to me. (Deleted) | [16] |
| NE2: Using AR takeaway packaging provided a unique experience for me. | ||
| NE3: Using AR takeaway packaging has been an adventurous experience. | ||
| NE4: I felt I was in a different world during using AR takeaway packaging. | ||
| Flow | FL1: When using AR takeaway packaging, I am not distracted. (Deleted) | [145] |
| FL2: It feels like time flies while I am using AR takeaway packaging. | ||
| FL3: When using AR takeaway packaging, I have a feeling of concentration. | ||
| FL4: When using AR takeaway packaging, I don’t get distracted from other things. | ||
| Quality of service | QoS1: I think using AR takeaway packaging makes me feel concern and help. | [104] |
| QoS2: I think the AR takeaway packaging got me a quick response. | ||
| QoS3: I think the AR takeaway packaging offers various services. (Deleted) | ||
| QoS4: I think using AR takeaway packaging is respectful for customers. | ||
| Quality of food | QoF1: I think the AR takeaway packaging helps the food to have a good presentation. | [99] |
| QoF2: I think the AR takeaway packaging helps make the food look more various. | ||
| QoF3: I think the AR takeaway packaging helps make the food look and taste better. | ||
| QoF4: I think the AR takeaway packaging helps make the food look healthier. | ||
| Perceived value | PVL1: I think takeaways that use AR packaging are great value for the price. | [102] |
| PVL2: The overall value of eating takeaways that use AR packaging is high. | ||
| PVL3: Using AR takeaway packaging was worth the money. | ||
| Trust | TR1: I can count on this company/companies that use AR takeaway packaging to consider how their actions will affect customers like me. (Deleted) | [146] |
| TR2: If I were to have any problems, this company/companies that use AR takeaway packaging will be ready and willing to offer me assistance and support. | ||
| TR3: When making decisions about its policies, this company/companies that use AR takeaway packaging is concerned about customers like me. | ||
| TR4: I can count on this company/companies that use AR takeaway packaging to be sincere in its communication. | ||
| TR5: Even if this company/companies that use AR takeaway packaging were to provide an unlikely explanation, I would be confident that the explanation was correct. (Deleted) | ||
| Satisfaction | SA1: I am satisfied with takeaways of this company/companies that use AR takeaway packaging. | [147] |
| SA2: Considering all my experience with food, my choice of takeaway of this company/companies that use AR takeaway packaging was wise. | ||
| SA3: Overall, I am pleased with takeaway of this company/companies that use AR takeaway packaging based on my experience. | ||
| Purchase intention | PuI1: I regard this company/companies that use AR takeaway packaging as my first choice for takeaway purchases. | [146] |
| PuI2: I plan to order more takeaways from of this company/companies that use AR takeaway packaging in the next few years. | ||
| PuI3: I will continue to buy takeaways at of this company/companies that use AR takeaway packaging in the next few years. |
References
- Jia, L.; Zhang, Y.; Qiao, G. Consumer-Related Antecedents of Waste Behavior in Online Food Ordering: A Study among Young Adults in China. Foods 2022, 11, 3098. [Google Scholar] [CrossRef] [PubMed]
- Zhao, X.; Lin, W.; Cen, S.; Zhu, H.; Duan, M.; Li, W.; Zhu, S. The online-to-offline (O2O) food delivery industry and its recent development in China. Eur. J. Clin. Nutr. 2021, 75, 232–237. [Google Scholar] [CrossRef] [PubMed]
- Zhao, Y.; Bacao, F. What factors determining customer continuingly using food delivery apps during 2019 novel coronavirus pandemic period? Int. J. Hosp. Manag. 2020, 91, 102683. [Google Scholar] [CrossRef] [PubMed]
- Shi, Y.; Tao, T.; Cao, X.; Pei, X. The association between spatial attributes and neighborhood characteristics based on Meituan take-out data: Evidence from shanghai business circles. J. Retail. Consum. Serv. 2021, 58, 102302. [Google Scholar] [CrossRef]
- Zhang, P.; Ju, S.; Huang, H. Can a Restaurant Benefit from Joining an Online Take-Out Platform? Mathematics 2022, 10, 1392. [Google Scholar] [CrossRef]
- Suh, B.; Kang, S.; Moon, H. Estimating the Impact of COVID-19 Pandemic on Customers’ Dining-Out Activities in South Korea. Sustainability 2022, 14, 9408. [Google Scholar] [CrossRef]
- Liu, C.; Chen, J. Consuming takeaway food: Convenience, waste and Chinese young people’s urban lifestyle. J. Consum. Cult. 2021, 21, 848–866. [Google Scholar] [CrossRef]
- Li, C.; Mirosa, M.; Bremer, P. Review of online food delivery platforms and their impacts on sustainability. Sustainability 2020, 12, 5528. [Google Scholar] [CrossRef]
- Kochańska, E.; Łukasik, R.M.; Dzikuć, M. New circular challenges in the development of take-away food packaging in the COVID-19 period. Energies 2021, 14, 4705. [Google Scholar] [CrossRef]
- Gu, C.; Chen, J.; Wei, W.; Sun, J.; Yang, C.; Jiang, L.; Hu, J.; Lv, B.; Lin, S.; Jiang, Q. The impact of reusable tableware packaging combined with environmental propaganda on consumer behaviour in online retail. PloS ONE 2022, 17, e0264562. [Google Scholar] [CrossRef]
- Kitz, R.; Walker, T.; Charlebois, S.; Music, J. Food packaging during the COVID-19 pandemic: Consumer perceptions. Int. J. Consum. Stud. 2022, 46, 434–448. [Google Scholar] [CrossRef] [PubMed]
- Spence, C.; Velasco, C. On the multiple effects of packaging colour on consumer behaviour and product experience in the ‘food and beverage’and ‘home and personal care’categories. Food Qual. Prefer. 2018, 68, 226–237. [Google Scholar] [CrossRef]
- Simmonds, G.; Woods, A.T.; Spence, C. ‘Show me the goods’: Assessing the effectiveness of transparent packaging vs. product imagery on product evaluation. Food Qual. Prefer. 2018, 63, 18–27. [Google Scholar] [CrossRef]
- Jiang, Q.; Sun, J.; Yang, C.; Gu, C. The Impact of Perceived Interactivity and Intrinsic Value on Users’ Continuance Intention in Using Mobile Augmented Reality Virtual Shoe-Try-On Function. Systems 2021, 10, 3. [Google Scholar] [CrossRef]
- Whang, J.B.; Song, J.H.; Choi, B.; Lee, J.-H. The effect of Augmented Reality on purchase intention of beauty products: The roles of consumers’ control. J. Bus. Res. 2021, 133, 275–284. [Google Scholar] [CrossRef]
- Gu, C.; Sun, J.; Chen, T.; Miao, W.; Yang, Y.; Lin, S.; Chen, J. Examining the Influence of Using First-Person View Drones as Auxiliary Devices in Matte Painting Courses on College Students’ Continuous Learning Intention. J. Intell. 2022, 10, 40. [Google Scholar] [CrossRef]
- Liu, Y.; Guo, B.; Chen, C.; Du, H.; Yu, Z.; Zhang, D.; Ma, H. FooDNet: Toward an optimized food delivery network based on spatial crowdsourcing. IEEE Trans. Mob. Comput. 2018, 18, 1288–1301. [Google Scholar] [CrossRef]
- Yang, J.; Long, R.; Chen, H.; Cheng, X. Willingness to participate in take-out packaging waste recycling: Relationship among effort level, advertising effect, subsidy and penalty. Waste Manag. 2021, 121, 141–152. [Google Scholar] [CrossRef]
- Du, F.; Cai, H.; Zhang, Q.; Chen, Q.; Shi, H. Microplastics in take-out food containers. J. Hazard. Mater. 2020, 399, 122969. [Google Scholar] [CrossRef]
- Han, Y.; Cheng, J.; An, D.; He, Y.; Tang, Z. Occurrence, potential release and health risks of heavy metals in popular take-out food containers from China. Environ. Res. 2022, 206, 112265. [Google Scholar] [CrossRef]
- Rauschnabel, P.A.; Babin, B.J.; tom Dieck, M.C.; Krey, N.; Jung, T. What is augmented reality marketing? Its definition, complexity, and future. J. Bus. Res. 2022, 142, 1140–1150. [Google Scholar] [CrossRef]
- Tamilmani, K.; Rana, N.P.; Wamba, S.F.; Dwivedi, R. The extended Unified Theory of Acceptance and Use of Technology (UTAUT2): A systematic literature review and theory evaluation. Int. J. Inf. Manag. 2021, 57, 102269. [Google Scholar] [CrossRef]
- Tamilmani, K.; Rana, N.P.; Dwivedi, Y.K. A systematic review of citations of UTAUT2 article and its usage trends. In Proceedings of the Conference on e-Business, e-Services and e-Society, Delhi, India, 21–23 November 2017; pp. 38–49. [Google Scholar]
- Wu, W.-L.; Hsu, Y.; Yang, Q.-F.; Chen, J.-J.; Jong, M.S.-Y. Effects of the self-regulated strategy within the context of spherical video-based virtual reality on students’ learning performances in an art history class. Interact. Learn. Environ. 2021, 1–24. [Google Scholar] [CrossRef]
- Luque-Vega, L.F.; Lopez-Neri, E.; Arellano-Muro, C.A.; González-Jiménez, L.E.; Ghommam, J.; Saad, M.; Carrasco-Navarro, R.; Ruíz-Cruz, R.; Guerrero-Osuna, H.A. UAV-based smart educational mechatronics system using a MoCap laboratory and hardware-in-the-loop. Sensors 2022, 22, 5707. [Google Scholar] [CrossRef] [PubMed]
- Hidalgo, M.; Reinerman-Jones, L.; Barber, D. Spatial Ability in Military Human-Robot Interaction: A State-of-the-Art Assessment. In Proceedings of the International Conference on Human-Computer Interaction, Donostia-San Sebastián, Spain, 25–28 June 2019; pp. 363–380. [Google Scholar]
- Li, W.; Huang, X. The Interactive Design and User Experience of Virtual Museums: Case Study of the Virtual Palace Museum. In Proceedings of the International Conference on Human-Computer Interaction, Virtual, 26 June–1 July 2022; pp. 400–409. [Google Scholar]
- Labanauskaitė, D.; Fiore, M.; Stašys, R. Use of E-marketing tools as communication management in the tourism industry. Tour. Manag. Perspect. 2020, 34, 100652. [Google Scholar] [CrossRef]
- Passavanti, R.; Pantano, E.; Priporas, C.V.; Verteramo, S. The use of new technologies for corporate marketing communication in luxury retailing: Preliminary findings. Qual. Mark. Res. Int. J. 2020, 23, 503–521. [Google Scholar] [CrossRef]
- Hoyer, W.D.; Kroschke, M.; Schmitt, B.; Kraume, K.; Shankar, V. Transforming the customer experience through new technologies. J. Interact. Mark. 2020, 51, 57–71. [Google Scholar] [CrossRef]
- Kim, S.; Choi, M.J.; Choi, J.S. Empirical study on the factors affecting individuals’ switching intention to augmented/virtual reality content services based on push-pull-mooring theory. Information 2019, 11, 25. [Google Scholar] [CrossRef] [Green Version]
- Lu, D.; Lai, I.K.W.; Liu, Y. The consumer acceptance of smart product-service systems in sharing economy: The effects of perceived interactivity and particularity. Sustainability 2019, 11, 928. [Google Scholar] [CrossRef] [Green Version]
- Yang, S.; Jiang, H.; Yao, J.; Chen, Y.; Wei, J. Perceived values on mobile GMS continuance: A perspective from perceived integration and interactivity. Comput. Hum. Behav. 2018, 89, 16–26. [Google Scholar] [CrossRef]
- Toufaily, E.; Pons, F. Impact of customers’ assessment of website attributes on e-relationship in the securities brokerage industry: A multichannel perspective. J. Retail. Consum. Serv. 2017, 34, 58–69. [Google Scholar] [CrossRef]
- Jevremović, M.; Gheorghiță, C.; Cerić, V.; Blăjină, O.; Jelić, Z.; Ilić, M.P.; Bucea-Manea-Țoniș, R. An Empirical Study on Website Interactivity Impact among a Student Group, Beneficent for Companies, and Other Users. Sustainability 2022, 14, 4507. [Google Scholar] [CrossRef]
- Vazquez, E.E. Effects of enduring involvement and perceived content vividness on digital engagement. J. Res. Interact. Mark. 2020, 14, 1–16. [Google Scholar] [CrossRef]
- Shin, D. How do users experience the interaction with an immersive screen? Comput. Hum. Behav. 2019, 98, 302–310. [Google Scholar] [CrossRef]
- Bae, S.; Jung, T.H.; Moorhouse, N.; Suh, M.; Kwon, O. The influence of mixed reality on satisfaction and brand loyalty in cultural heritage attractions: A brand equity perspective. Sustainability 2020, 12, 2956. [Google Scholar] [CrossRef] [Green Version]
- Lin, X.; Featherman, M.; Brooks, S.L.; Hajli, N. Exploring gender differences in online consumer purchase decision making: An online product presentation perspective. Inf. Syst. Front. 2019, 21, 1187–1201. [Google Scholar] [CrossRef]
- Mandler, T.; Johnen, M.; Gräve, J.-F. Can’t help falling in love? How brand luxury generates positive consumer affect in social media. J. Bus. Res. 2020, 120, 330–342. [Google Scholar] [CrossRef]
- Gunden, N.; Morosan, C.; DeFranco, A. Consumers’ intentions to use online food delivery systems in the USA. Int. J. Contemp. Hosp. Manag. 2020, 32, 1325–1345. [Google Scholar] [CrossRef]
- Mitas, O.; Bastiaansen, M. Novelty: A mechanism of tourists’ enjoyment. Ann. Tour. Res. 2018, 72, 98–108. [Google Scholar] [CrossRef]
- Adapa, S.; Fazal-e-Hasan, S.M.; Makam, S.B.; Azeem, M.M.; Mortimer, G. Examining the antecedents and consequences of perceived shopping value through smart retail technology. J. Retail. Consum. Serv. 2020, 52, 101901. [Google Scholar] [CrossRef]
- Roy, S.K.; Balaji, M.; Quazi, A.; Quaddus, M. Predictors of customer acceptance of and resistance to smart technologies in the retail sector. J. Retail. Consum. Serv. 2018, 42, 147–160. [Google Scholar] [CrossRef] [Green Version]
- Luan, Y.; Kim, Y.J. An integrative model of new product evaluation: A systematic investigation of perceived novelty and product evaluation in the movie industry. PLoS ONE 2022, 17, e0265193. [Google Scholar] [CrossRef] [PubMed]
- McLean, G.; Wilson, A. Shopping in the digital world: Examining customer engagement through augmented reality mobile applications. Comput. Hum. Behav. 2019, 101, 210–224. [Google Scholar] [CrossRef]
- Kim, D.; Ko, Y.J. The impact of virtual reality (VR) technology on sport spectators’ flow experience and satisfaction. Comput. Hum. Behav. 2019, 93, 346–356. [Google Scholar] [CrossRef]
- Michailidis, L.; Balaguer-Ballester, E.; He, X. Flow and immersion in video games: The aftermath of a conceptual challenge. Front. Psychol. 2018, 9, 1682. [Google Scholar] [CrossRef] [Green Version]
- Frochot, I.; Elliot, S.; Kreziak, D. Digging deep into the experience–flow and immersion patterns in a mountain holiday. Int. J. Cult. Tour. Hosp. Res. 2017, 11, 81–91. [Google Scholar] [CrossRef]
- Silva, R.; Rodrigues, R.; Leal, C. Play it again: How game-based learning improves flow in Accounting and Marketing education. Account. Educ. 2019, 28, 484–507. [Google Scholar] [CrossRef]
- Kim, M.; Thapa, B. Perceived value and flow experience: Application in a nature-based tourism context. J. Destin. Mark. Manag. 2018, 8, 373–384. [Google Scholar] [CrossRef]
- Gu, C.; Chen, J.; Lin, J.; Lin, S.; Wu, W.; Jiang, Q.; Yang, C.; Wei, W. The impact of eye-tracking games as a training case on students’ learning interest and continuous learning intention in game design courses: Taking Flappy Bird as an example. Learn. Motiv. 2022, 78, 101808. [Google Scholar] [CrossRef]
- Konuk, F.A. The role of store image, perceived quality, trust and perceived value in predicting consumers’ purchase intentions towards organic private label food. J. Retail. Consum. Serv. 2018, 43, 304–310. [Google Scholar] [CrossRef]
- Music, J.; Charlebois, S. Consumer perceptions about food retail and services during the first wave of COVID-19 in Canada: An exploratory study. Cogent Soc. Sci. 2022, 8, 2072556. [Google Scholar] [CrossRef]
- Hakim, M.P.; Libera, V.M.D.; Zanetta, L.D.A.; Nascimento, L.G.P.; da Cunha, D.T. What is a dark kitchen? A study of consumer’s perceptions of deliver-only restaurants using food delivery apps in Brazil. Food Res. Int. 2022, 161, 111768. [Google Scholar] [CrossRef] [PubMed]
- Konuk, F.A. Consumers’ willingness to buy and willingness to pay for fair trade food: The influence of consciousness for fair consumption, environmental concern, trust and innovativeness. Food Res. Int. 2019, 120, 141–147. [Google Scholar] [CrossRef]
- Jadil, Y.; Rana, N.P.; Dwivedi, Y.K. Understanding the drivers of online trust and intention to buy on a website: An emerging market perspective. Int. J. Inf. Manag. Data Insights 2022, 2, 100065. [Google Scholar] [CrossRef]
- Nakayama, M.; Wan, Y. Is culture of origin associated with more expressions? An analysis of Yelp reviews on Japanese restaurants. Tour. Manag. 2018, 66, 329–338. [Google Scholar] [CrossRef]
- Carvalho, A.; Fernandes, T. Understanding customer brand engagement with virtual social communities: A comprehensive model of drivers, outcomes and moderators. J. Mark. Theory Pract. 2018, 26, 23–37. [Google Scholar] [CrossRef]
- Yang, C.; Chen, X.; Sun, J.; Gu, C. The Impact of Alternative Foods on Consumers’ Continuance Intention from an Innovation Perspective. Foods 2022, 11, 1167. [Google Scholar] [CrossRef]
- Alaimo, L.S.; Fiore, M.; Galati, A. Measuring consumers’ level of satisfaction for online food shopping during COVID-19 in Italy using POSETs. Socio-Econ. Plan. Sci. 2022, 82, 101064. [Google Scholar] [CrossRef]
- Chua, B.-L.; Lee, S.; Han, H. Consequences of cruise line involvement: A comparison of first-time and repeat passengers. Int. J. Contemp. Hosp. Manag. 2017, 29, 1658–1683. [Google Scholar] [CrossRef]
- Gu, C.; Chen, J.; Yang, C.; Wei, W.; Jiang, Q.; Jiang, L.; Wu, Q.; Lin, S.-Y.; Yang, Y. Effects of AR Picture Books on German Teaching in Universities. J. Intell. 2022, 10, 13. [Google Scholar] [CrossRef]
- Kang, J.-W.; Lee, H.; Namkung, Y. The impact of restaurant patrons’ flow experience on SNS satisfaction and offline purchase intentions. Int. J. Contemp. Hosp. Manag. 2018, 30, 797–816. [Google Scholar] [CrossRef]
- Al-Ansi, A.; Olya, H.G.; Han, H. Effect of general risk on trust, satisfaction, and recommendation intention for halal food. Int. J. Hosp. Manag. 2019, 83, 210–219. [Google Scholar] [CrossRef]
- Koay, K.Y.; Cheah, C.W.; Chang, Y.X. A model of online food delivery service quality, customer satisfaction and customer loyalty: A combination of PLS-SEM and NCA approaches. Br. Food J. 2022, 124, 4516–4532. [Google Scholar] [CrossRef]
- Yang, C.; Chen, X.; Sun, J.; Wei, W.; Miao, W.; Gu, C. Could Surplus Food in Blind Box Form Increase Consumers’ Purchase Intention? Agriculture 2022, 12, 864. [Google Scholar] [CrossRef]
- Castro, I.A.; Majmundar, A.; Williams, C.B.; Baquero, B. Customer purchase intentions and choice in food retail environments: A scoping review. Int. J. Environ. Res. Public Health 2018, 15, 2493. [Google Scholar] [CrossRef] [PubMed] [Green Version]
- Chen, Y.-M.; Hsu, T.-H.; Lu, Y.-J. Impact of flow on mobile shopping intention. J. Retail. Consum. Serv. 2018, 41, 281–287. [Google Scholar] [CrossRef]
- Pop, R.-A.; Săplăcan, Z.; Dabija, D.-C.; Alt, M.-A. The impact of social media influencers on travel decisions: The role of trust in consumer decision journey. Curr. Issues Tour. 2022, 25, 823–843. [Google Scholar] [CrossRef]
- Hanaysha, J.R. Impact of social media marketing features on consumer’s purchase decision in the fast-food industry: Brand trust as a mediator. Int. J. Inf. Manag. Data Insights 2022, 2, 100102. [Google Scholar] [CrossRef]
- Ebrahim, R.S. The role of trust in understanding the impact of social media marketing on brand equity and brand loyalty. J. Relatsh. Mark. 2020, 19, 287–308. [Google Scholar] [CrossRef]
- Konuk, F.A. Price fairness, satisfaction, and trust as antecedents of purchase intentions towards organic food. J. Consum. Behav. 2018, 17, 141–148. [Google Scholar] [CrossRef]
- Hu, N.; Zhang, T.; Gao, B.; Bose, I. What do hotel customers complain about? Text analysis using structural topic model. Tour. Manag. 2019, 72, 417–426. [Google Scholar] [CrossRef]
- Zhao, K.; Stylianou, A.C.; Zheng, Y. Sources and impacts of social influence from online anonymous user reviews. Inf. Manag. 2018, 55, 16–30. [Google Scholar] [CrossRef]
- Li, X.; Wu, C.; Mai, F. The effect of online reviews on product sales: A joint sentiment-topic analysis. Inf. Manag. 2019, 56, 172–184. [Google Scholar] [CrossRef]
- Ismagilova, E.; Slade, E.; Rana, N.P.; Dwivedi, Y.K. The effect of characteristics of source credibility on consumer behaviour: A meta-analysis. J. Retail. Consum. Serv. 2020, 53, 101736. [Google Scholar] [CrossRef] [Green Version]
- Tanveer, M.; Ahmad, A.-R.; Mahmood, H.; Haq, I.U. Role of ethical marketing in driving consumer brand relationships and brand loyalty: A sustainable marketing approach. Sustainability 2021, 13, 6839. [Google Scholar] [CrossRef]
- Zhao, Y.; Xu, X.; Wang, M. Predicting overall customer satisfaction: Big data evidence from hotel online textual reviews. Int. J. Hosp. Manag. 2019, 76, 111–121. [Google Scholar] [CrossRef]
- Alantari, H.J.; Currim, I.S.; Deng, Y.; Singh, S. An empirical comparison of machine learning methods for text-based sentiment analysis of online consumer reviews. Int. J. Res. Mark. 2022, 39, 1–19. [Google Scholar] [CrossRef]
- Lee, C.K.H. How guest-host interactions affect consumer experiences in the sharing economy: New evidence from a configurational analysis based on consumer reviews. Decis. Support Syst. 2022, 152, 113634. [Google Scholar] [CrossRef]
- Lindh, H.; Williams, H.; Olsson, A.; Wikström, F. Elucidating the indirect contributions of packaging to sustainable development: A terminology of packaging functions and features. Packag. Technol. Sci. 2016, 29, 225–246. [Google Scholar] [CrossRef]
- Ketelsen, M.; Janssen, M.; Hamm, U. Consumers’ response to environmentally-friendly food packaging-A systematic review. J. Clean. Prod. 2020, 254, 120123. [Google Scholar] [CrossRef]
- Togawa, T.; Park, J.; Ishii, H.; Deng, X. A packaging visual-gustatory correspondence effect: Using visual packaging design to influence flavor perception and healthy eating decisions. J. Retail. 2019, 95, 204–218. [Google Scholar] [CrossRef]
- Wang, Q.J.; Spence, C. Sonic packaging: How packaging sounds influence multisensory product evaluation. In Multisensory Packaging; Springer: Berlin/Heidelberg, Germany, 2019; pp. 103–125. [Google Scholar]
- Favier, M.; Celhay, F.; Pantin-Sohier, G. Is less more or a bore? Package design simplicity and brand perception: An application to Champagne. J. Retail. Consum. Serv. 2019, 46, 11–20. [Google Scholar] [CrossRef]
- Tanveer, M.; Kaur, H.; Thomas, G.; Mahmood, H.; Paruthi, M.; Yu, Z. Mobile Phone Buying Decisions among Young Adults: An Empirical Study of Influencing Factors. Sustainability 2021, 13, 10705. [Google Scholar] [CrossRef]
- Gil-Pérez, I.; Rebollar, R.; Lidón, I. Without words: The effects of packaging imagery on consumer perception and response. Curr. Opin. Food Sci. 2020, 33, 69–77. [Google Scholar] [CrossRef]
- Dong, Y.; Sharma, C.; Mehta, A.; Torrico, D.D. Application of augmented reality in the sensory evaluation of yogurts. Fermentation 2021, 7, 147. [Google Scholar] [CrossRef]
- Li, H.; Si, Z. Application of augmented reality in product package with quick response code. In Advances in Graphic Communication, Printing and Packaging; Springer: Berlin/Heidelberg, Germany, 2019; pp. 335–342. [Google Scholar]
- Todorović, V.; Milić, N.; Lazarević, M. Augmented Reality in Food production traceability–use case. In Proceedings of the IEEE EUROCON 2019-18th International Conference on Smart Technologies, Novi Sad, Serbia, 1–4 July 2019; pp. 1–5. [Google Scholar]
- Sonderegger, A.; Ribes, D.; Henchoz, N.; Groves, E. Food talks: Visual and interaction principles for representing environmental and nutritional food information in augmented reality. In Proceedings of the 2019 IEEE International Symposium on Mixed and Augmented Reality Adjunct (ISMAR-Adjunct), Beijing, China, 10–18 October 2019; pp. 98–103. [Google Scholar]
- Blei, D.M.; Ng, A.Y.; Jordan, M.I. Latent dirichlet allocation. J. Mach. Learn. Res. 2003, 3, 993–1022. [Google Scholar]
- Bouma, G. Normalized (pointwise) mutual information in collocation extraction. Proc. GSCL 2009, 30, 31–40. [Google Scholar]
- Santoso, M.; Gook, L.B. ARkanoid: Development of 3D game and handheld augmented reality. Int. J. Comput. Eng. Res. 2012, 2, 1053–1059. [Google Scholar]
- Cho, M.; Bonn, M.A.; Li, J.J. Differences in perceptions about food delivery apps between single-person and multi-person households. Int. J. Hosp. Manag. 2019, 77, 108–116. [Google Scholar] [CrossRef]
- Cheng, M.; Jin, X. What do Airbnb users care about? An analysis of online review comments. Int. J. Hosp. Manag. 2019, 76, 58–70. [Google Scholar] [CrossRef]
- George, R.V.; Harsh, H.O.; Ray, P.; Babu, A.K. Food quality traceability prototype for restaurants using blockchain and food quality data index. J. Clean. Prod. 2019, 240, 118021. [Google Scholar] [CrossRef]
- Suhartanto, D.; Helmi Ali, M.; Tan, K.H.; Sjahroeddin, F.; Kusdibyo, L. Loyalty toward online food delivery service: The role of e-service quality and food quality. J. Foodserv. Bus. Res. 2019, 22, 81–97. [Google Scholar] [CrossRef]
- Wang, J.; Tao, J.; Chu, M. Behind the label: Chinese consumers’ trust in food certification and the effect of perceived quality on purchase intention. Food Control 2020, 108, 106825. [Google Scholar] [CrossRef]
- Xiao, A.; Yang, S.; Iqbal, Q. Factors affecting purchase intentions in generation Y: An empirical evidence from fast food industry in Malaysia. Adm. Sci. 2018, 9, 4. [Google Scholar] [CrossRef] [Green Version]
- Konuk, F.A. The influence of perceived food quality, price fairness, perceived value and satisfaction on customers’ revisit and word-of-mouth intentions towards organic food restaurants. J. Retail. Consum. Serv. 2019, 50, 103–110. [Google Scholar] [CrossRef]
- Zhong, Y.; Moon, H.C. What drives customer satisfaction, loyalty, and happiness in fast-food restaurants in China? Perceived price, service quality, food quality, physical environment quality, and the moderating role of gender. Foods 2020, 9, 460. [Google Scholar] [CrossRef] [Green Version]
- Zhang, T.; Chen, J.; Hu, B. Authenticity, quality, and loyalty: Local food and sustainable tourism experience. Sustainability 2019, 11, 3437. [Google Scholar] [CrossRef] [Green Version]
- Wu, J.-Y.; Hsiao, H.-I. Food quality and safety risk diagnosis in the food cold chain through failure mode and effect analysis. Food Control 2021, 120, 107501. [Google Scholar] [CrossRef]
- Ahn, J.; Lee, C.-K.; Back, K.-J.; Schmitt, A. Brand experiential value for creating integrated resort customers’ co-creation behavior. Int. J. Hosp. Manag. 2019, 81, 104–112. [Google Scholar] [CrossRef]
- El-Adly, M.I. Modelling the relationship between hotel perceived value, customer satisfaction, and customer loyalty. J. Retail. Consum. Serv. 2019, 50, 322–332. [Google Scholar] [CrossRef]
- El-Adly, M.I.; Eid, R. Dimensions of the perceived value of malls: Muslim shoppers’ perspective. Int. J. Retail Distrib. Manag. 2017, 45, 40–56. [Google Scholar] [CrossRef]
- Keng, C.J.; Huang, T.L.; Zheng, L.J.; Hsu, M.K. Modeling service encounters and customer experiential value in retailing: An empirical investigation of shopping mall customers in Taiwan. Int. J. Serv. Ind. Manag. 2007, 18, 349–367. [Google Scholar] [CrossRef]
- Hwang, J.; Han, H. Examining strategies for maximizing and utilizing brand prestige in the luxury cruise industry. Tour. Manag. 2014, 40, 244–259. [Google Scholar] [CrossRef]
- El-Adly, M.I.; Eid, R. An empirical study of the relationship between shopping environment, customer perceived value, satisfaction, and loyalty in the UAE malls context. J. Retail. Consum. Serv. 2016, 31, 217–227. [Google Scholar] [CrossRef]
- Ashraf, R.U.; Hou, F.; Ahmad, W. Understanding continuance intention to use social media in China: The roles of personality drivers, hedonic value, and utilitarian value. Int. J. Hum. –Comput. Interact. 2019, 35, 1216–1228. [Google Scholar] [CrossRef]
- Kim, M.J.; Hall, C.M.; Kim, D.-K. Predicting environmentally friendly eating out behavior by value-attitude-behavior theory: Does being vegetarian reduce food waste? J. Sustain. Tour. 2020, 28, 797–815. [Google Scholar] [CrossRef]
- Jansen, M.; Doornebosch, A.J.; de Waal, M.W.; Wattel, E.M.; Visser, D.; Spek, B.; Smit, E.B. Psychometrics of the observational scales of the Utrecht Scale for Evaluation of Rehabilitation (USER): Content and structural validity, internal consistency and reliability. Arch. Gerontol. Geriatr. 2021, 97, 104509. [Google Scholar] [CrossRef] [PubMed]
- Carroll, R.J.; Schneider, H. A note on Levene’s tests for equality of variances. Stat. Probab. Lett. 1985, 3, 191–194. [Google Scholar] [CrossRef]
- Smith, K.N.; Lamb, K.N.; Henson, R.K. Making meaning out of MANOVA: The need for multivariate post hoc testing in gifted education research. Gift. Child Q. 2020, 64, 41–55. [Google Scholar] [CrossRef]
- Richardson, J.T. Eta squared and partial eta squared as measures of effect size in educational research. Educ. Res. Rev. 2011, 6, 135–147. [Google Scholar] [CrossRef]
- Zijlmans, E.A.; Tijmstra, J.; Van der Ark, L.A.; Sijtsma, K. Item-score reliability as a selection tool in test construction. Front. Psychol. 2019, 9, 2298. [Google Scholar] [CrossRef] [PubMed] [Green Version]
- Abdullah, M.; Dias, C.; Muley, D.; Shahin, M. Exploring the impacts of COVID-19 on travel behavior and mode preferences. Transp. Res. Interdiscip. Perspect. 2020, 8, 100255. [Google Scholar] [CrossRef]
- Kohli, A.K.; Shervani, T.A.; Challagalla, G.N. Learning and performance orientation of salespeople: The role of supervisors. J. Mark. Res. 1998, 35, 263–274. [Google Scholar] [CrossRef]
- Hair, J.F.; Black, W.C.; Babin, B.J.; Anderson, R.E.; Tatham, R. Multivariate Data Analysis; Prentice Hall: Uppersaddle River, NY, USA, 2006. [Google Scholar]
- Rajesh, R. Flexible business strategies to enhance resilience in manufacturing supply chains: An empirical study. J. Manuf. Syst. 2021, 60, 903–919. [Google Scholar] [CrossRef]
- Adaileh, M.J.; Alrawashdeh, M.; Elrehail, H.; Aladayleh, K.J. Assessing the nexus between knowledge management and firm performance: A data article. Data Brief 2020, 32, 106283. [Google Scholar] [CrossRef]
- Chung, M.; Ko, E.; Joung, H.; Kim, S.J. Chatbot e-service and customer satisfaction regarding luxury brands. J. Bus. Res. 2020, 117, 587–595. [Google Scholar] [CrossRef]
- Fornell, C.; Larcker, D.F. Structural equation models with unobservable variables and measurement error: Algebra and statistics. J. Mark. Res. 1981, 18, 382–388. [Google Scholar] [CrossRef]
- Owusu, E.K.; Chan, A.P.; Hosseini, M.R. Impacts of anti-corruption barriers on the efficacy of anti-corruption measures in infrastructure projects: Implications for sustainable development. J. Clean. Prod. 2020, 246, 119078. [Google Scholar] [CrossRef]
- Zhu, L.; Li, H.; Wang, F.-K.; He, W.; Tian, Z. How online reviews affect purchase intention: A new model based on the stimulus-organism-response (SOR) framework. Aslib J. Inf. Manag. 2020, 72, 463–488. [Google Scholar] [CrossRef]
- Kühn, S.; Petzer, D.J. Fostering purchase intentions toward online retailer websites in an emerging market: An SOR perspective. J. Internet Commer. 2018, 17, 255–282. [Google Scholar] [CrossRef]
- Rizou, M.; Galanakis, I.M.; Aldawoud, T.M.; Galanakis, C.M. Safety of foods, food supply chain and environment within the COVID-19 pandemic. Trends Food Sci. Technol. 2020, 102, 293–299. [Google Scholar] [CrossRef]
- Davitt, E.D.; Heer, M.M.; Winham, D.M.; Knoblauch, S.T.; Shelley, M.C. Effects of COVID-19 on university student food security. Nutrients 2021, 13, 1932. [Google Scholar] [CrossRef]
- Xiang, Z.; Du, Q.; Ma, Y.; Fan, W. A comparative analysis of major online review platforms: Implications for social media analytics in hospitality and tourism. Tour. Manag. 2017, 58, 51–65. [Google Scholar] [CrossRef]
- Kostromitina, M.; Keller, D.; Cavusoglu, M.; Beloin, K. “His lack of a mask ruined everything.” Restaurant customer satisfaction during the COVID-19 outbreak: An analysis of Yelp review texts and star-ratings. Int. J. Hosp. Manag. 2021, 98, 103048. [Google Scholar] [CrossRef]
- Nikhashemi, S.; Knight, H.H.; Nusair, K.; Liat, C.B. Augmented reality in smart retailing: A (n)(A) Symmetric Approach to continuous intention to use retail brands’ mobile AR apps. J. Retail. Consum. Serv. 2021, 60, 102464. [Google Scholar] [CrossRef]
- Fan, X.; Chai, Z.; Deng, N.; Dong, X. Adoption of augmented reality in online retailing and consumers’ product attitude: A cognitive perspective. J. Retail. Consum. Serv. 2020, 53, 101986. [Google Scholar] [CrossRef]
- Tian, J. Analysis on the safety design of food delivery packaging in the post-epidemic era. In Proceedings of the 2021 International Conference on Computer Technology and Media Convergence Design (CTMCD), Sanya, China, 23–25 April 2021; pp. 259–262. [Google Scholar]
- Tang, K.-T.; Chang, C.-H. CHAID algorithm to analyze characteristics of take-out industry. In Proceedings of the 2021 IEEE International Conference on Consumer Electronics and Computer Engineering (ICCECE), Guangzhou, China, 15–17 January 2021; pp. 357–361. [Google Scholar]
- Moslehpour, M.; Pham, V.K.; Wong, W.-K.; Bilgiçli, İ. E-purchase intention of Taiwanese consumers: Sustainable mediation of perceived usefulness and perceived ease of use. Sustainability 2018, 10, 234. [Google Scholar] [CrossRef] [Green Version]
- Llerena-Izquierdo, J.; Cedeño-Gonzabay, L. Photogrammetry and augmented reality to promote the religious cultural heritage of San Pedro Cathedral in Guayaquil, Ecuador. In Proceedings of the Applied Technologies: First International Conference, ICAT 2019, Quito, Ecuador, 3–5 December 2019; pp. 593–606. [Google Scholar]
- Kriechling, P.; Roner, S.; Liebmann, F.; Casari, F.; Fürnstahl, P.; Wieser, K. Augmented reality for base plate component placement in reverse total shoulder arthroplasty: A feasibility study. Arch. Orthop. Trauma Surg. 2021, 141, 1447–1453. [Google Scholar] [CrossRef] [PubMed]
- Meherishi, L.; Narayana, S.A.; Ranjani, K. Sustainable packaging for supply chain management in the circular economy: A review. J. Clean. Prod. 2019, 237, 117582. [Google Scholar] [CrossRef]
- Choi, K.; Wang, Y.; Sparks, B. Travel app users’ continued use intentions: It’s a matter of value and trust. J. Travel Tour. Mark. 2019, 36, 131–143. [Google Scholar] [CrossRef]
- Ji, C.; Pan, R.; Chang, L.-P.; Shi, L.; Zhu, Z.; Liang, Y.; Kuo, T.-W.; Xue, C.J. Inspection and characterization of app file usage in mobile devices. ACM Trans. Storage (TOS) 2020, 16, 1–25. [Google Scholar] [CrossRef]
- Jang, Y.; Park, E. An adoption model for virtual reality games: The roles of presence and enjoyment. Telemat. Inform. 2019, 42, 101239. [Google Scholar] [CrossRef]
- Lin, C.-P.; Joe, S.-W. To share or not to share: Assessing knowledge sharing, interemployee helping, and their antecedents among online knowledge workers. J. Bus. Ethics 2012, 108, 439–449. [Google Scholar] [CrossRef]
- Lee, Y.; Choi, J. A structural equation model of predictors of online learning retention. Internet High. Educ. 2013, 16, 36–42. [Google Scholar] [CrossRef]
- Yu, W.; Han, X.; Ding, L.; He, M. Organic food corporate image and customer co-developing behavior: The mediating role of consumer trust and purchase intention. J. Retail. Consum. Serv. 2021, 59, 102377. [Google Scholar] [CrossRef]
- Lee, S.-M.; Jin, N.; Kim, H.-S. The effect of healthy food knowledge on perceived healthy foods’ value, degree of satisfaction, and behavioral intention: The moderating effect of gender. J. Qual. Assur. Hosp. Tour. 2018, 19, 151–171. [Google Scholar] [CrossRef]


| Sample | Category | Number | Percentage (%) | Number | Percentage (%) |
|---|---|---|---|---|---|
| Study 2 | Study 3 | ||||
| Gender | Male | 50 | 48.077% | 453 | 45.255% |
| Female | 54 | 51.923% | 548 | 54.745% | |
| Age | 20–29 | 57 | 54.808% | 577 | 57.642% |
| 30–39 | 47 | 45.192% | 424 | 42.358% | |
| Marriage status | Married | 62 | 59.615% | 651 | 65.035% |
| Unmarried | 42 | 40.385% | 350 | 34.965% | |
| Monthly Income | Below 4000 | 20 | 19.231% | 179 | 17.882% |
| 4001–6000 | 22 | 21.154% | 200 | 19.980% | |
| 6001–12,000 | 42 | 40.385% | 425 | 42.458% | |
| 12,001–18,000 | 16 | 15.385% | 139 | 13.886% | |
| Above 18,001 | 4 | 3.846% | 58 | 5.794% | |
| Education | Junior high school or below | 1 | 0.962% | 12 | 1.199% |
| High school or secondary school | 3 | 2.885% | 33 | 3.297% | |
| Undergraduate or college | 88 | 84.615% | 864 | 86.314% | |
| Postgraduate or higher | 12 | 11.538% | 92 | 9.191% | |
| Occupation | Civil servant | 6 | 5.769% | 85 | 8.492% |
| Clerk | 37 | 35.577% | 462 | 46.154% | |
| Worker | 18 | 17.308% | 123 | 12.288% | |
| Public service agency | 14 | 13.462% | 94 | 9.391% | |
| Student | 12 | 11.538% | 135 | 13.487% | |
| Self-employed | 17 | 16.346% | 102 | 10.190% | |
| Topic 1 | Topic 2 | Topic 3 | |||||||||
|---|---|---|---|---|---|---|---|---|---|---|---|
| Word | Probability Value | Total Frequency | Topic Frequency | Word | Probability Value | Total Frequency | Topic Frequency | Word | Probability Value | Total Frequency | Topic Frequency |
| Chopsticks | 0.045 | 9177 | 6579.293 | Poor taste | 0.189 | 35,986 | 32,764.826 | Taste | 0.182 | 39,443 | 28,153.926 |
| Taste | 0.042 | 39,443 | 6072.040 | Flavor | 0.048 | 9255 | 8245.094 | Picture | 0.021 | 5953 | 3205.806 |
| Hair | 0.030 | 7532 | 4424.390 | Taste | 0.033 | 39,443 | 5722.826 | Diarrhea | 0.020 | 3745 | 3061.259 |
| Hygiene | 0.020 | 3642 | 2972.366 | Disgusting | 0.033 | 7145 | 5631.778 | Good value | 0.019 | 4055 | 2975.297 |
| Dinnerware | 0.020 | 3246 | 2891.386 | Attitude | 0.019 | 5563 | 3340.640 | Phone | 0.017 | 3385 | 2671.293 |
| Hour | 0.019 | 4437 | 2775.168 | Size | 0.017 | 5367 | 2883.718 | Cola | 0.017 | 4207 | 1975.477 |
| Set | 0.019 | 3912 | 1831.228 | Texture | 0.016 | 3537 | 2706.742 | Hair | 0.013 | 7532 | 1812.370 |
| Price | 0.015 | 3027 | 1786.107 | Driver | 0.015 | 4255 | 1696.774 | Box | 0.012 | 2631 | 1467.896 |
| Time | 0.013 | 3029 | 1565.857 | Bugs | 0.010 | 1906 | 1599.052 | Attitude | 0.012 | 5563 | 1234.145 |
| Experience | 0.013 | 2220 | 1320.659 | Clean | 0.009 | 1974 | 1523.079 | Poor taste | 0.010 | 35,986 | 1012.850 |
| Sum of topic frequency *: topic 1 = 146,161.200; topic 2 = 172,760.676; topic 3 = 154,657.150 | |||||||||||
| Construct | (I) Group | (I) Mean | (J) Group | (J) Mean | Mean Difference (I-J) | F | Sig. | Partial Eta Squared |
|---|---|---|---|---|---|---|---|---|
| TR | 1 | 3.011 | 2 | 3.302 | 0.291 | 4.862 | 0.030 * | 0.045 |
| SA | 1 | 2.849 | 2 | 3.235 | 0.386 | 4.891 | 0.029 * | 0.046 |
| PuI | 1 | 2.522 | 2 | 3.072 | 0.550 | 8.910 | 0.004 * | 0.080 |
| Common Indices | χ2/df | RMSEA | GFI | AGFI | NFI | CFI | SRMR |
|---|---|---|---|---|---|---|---|
| Judgment criteria | <5 | <0.08 | >0.9 | >0.9 | >0.9 | >0.9 | <0.08 |
| CFA Value | 1.996 | 0.032 | 0.950 | 0.936 | 0.956 | 0.977 | 0.027 |
| CCLFM Value | 1.952 | 0.031 | 0.952 | 0.939 | 0.957 | 0.978 | 0.031 |
| Construct | Coding | Factor Loading | t Value | SE | p Value | SMC | AVE | CR |
|---|---|---|---|---|---|---|---|---|
| PI | PI1 | 0.718 | 23.911 | 0.089 | 0.001 * | 0.516 | 0.530 | 0.771 |
| PI2 | 0.679 | 22.251 | 0.106 | 0.001 * | 0.460 | |||
| PI3 | 0.782 | 26.633 | 0.098 | 0.001 * | 0.611 | |||
| PV | PV1 | 0.732 | 24.415 | 0.095 | 0.001 * | 0.535 | 0.554 | 0.789 |
| PV2 | 0.742 | 24.849 | 0.094 | 0.001 * | 0.550 | |||
| PV3 | 0.759 | 25.596 | 0.100 | 0.001 * | 0.576 | |||
| NE | NE2 | 0.806 | 28.730 | 0.093 | 0.001 * | 0.649 | 0.654 | 0.850 |
| NE3 | 0.821 | 29.494 | 0.100 | 0.001 * | 0.675 | |||
| NE4 | 0.799 | 28.392 | 0.103 | 0.001 * | 0.638 | |||
| FL | FL2 | 0.811 | 29.721 | 0.104 | 0.001 * | 0.657 | 0.696 | 0.873 |
| FL3 | 0.863 | 32.574 | 0.098 | 0.001 * | 0.745 | |||
| FL4 | 0.828 | 30.615 | 0.104 | 0.001 * | 0.685 | |||
| QoS | QoS1 | 0.720 | 24.135 | 0.091 | 0.001 * | 0.519 | 0.575 | 0.801 |
| QoS2 | 0.705 | 23.479 | 0.101 | 0.001 * | 0.497 | |||
| QoS4 | 0.843 | 28.090 | 0.093 | 0.001 * | 0.657 | |||
| QoF | QoF1 | 0.830 | 31.265 | 0.093 | 0.001 * | 0.690 | 0.673 | 0.892 |
| QoF2 | 0.795 | 29.301 | 0.094 | 0.001 * | 0.633 | |||
| QoF3 | 0.843 | 32.019 | 0.093 | 0.001 * | 0.711 | |||
| QoF4 | 0.812 | 28.090 | 0.099 | 0.001 * | 0.659 | |||
| PVL | PVL1 | 0.823 | 29.952 | 0.097 | 0.001 * | 0.677 | 0.634 | 0.839 |
| PVL2 | 0.772 | 27.398 | 0.095 | 0.001 * | 0.597 | |||
| PVL3 | 0.793 | 28.429 | 0.100 | 0.001 * | 0.629 | |||
| TR | TR2 | 0.780 | 27.330 | 0.094 | 0.001 * | 0.608 | 0.588 | 0.811 |
| TR3 | 0.746 | 25.716 | 0.098 | 0.001 * | 0.556 | |||
| TR4 | 0.774 | 27.030 | 0.094 | 0.001 * | 0.598 | |||
| SA | SA1 | 0.804 | 29.186 | 0.094 | 0.001 * | 0.647 | 0.617 | 0.829 |
| SA2 | 0.773 | 27.609 | 0.092 | 0.001 * | 0.598 | |||
| SA3 | 0.780 | 27.932 | 0.091 | 0.001 * | 0.608 | |||
| PuI | PuI1 | 0.836 | 31.293 | 0.099 | 0.001 * | 0.699 | 0.690 | 0.870 |
| PuI2 | 0.833 | 31.115 | 0.102 | 0.001 * | 0.694 | |||
| PuI3 | 0.823 | 30.560 | 0.102 | 0.001 * | 0.678 |
| PI | PV | NE | FL | QoS | QoF | PVL | TR | SA | PuI | |
|---|---|---|---|---|---|---|---|---|---|---|
| PI | 0.738 | |||||||||
| PV | 0.545 * | 0.744 | ||||||||
| NE | 0.366 * | 0.286 * | 0.809 | |||||||
| FL | 0.399 * | 0.364 * | 0.470 * | 0.834 | ||||||
| QoS | 0.454 * | 0.380 * | 0.365 * | 0.444 * | 0.758 | |||||
| QoF | 0.421 * | 0.415 * | 0.381 * | 0.462 * | 0.517 * | 0.820 | ||||
| PVL | 0.457 * | 0.433 * | 0.346 * | 0.453 * | 0.470 * | 0.593 * | 0.796 | |||
| TR | 0.408 * | 0.312 * | 0.352 * | 0.487 * | 0.520 * | 0.574 * | 0.530 * | 0.767 | ||
| SA | 0.512 * | 0.476 * | 0.328 * | 0.479 * | 0.496 * | 0.545 * | 0.596 * | 0.549 * | 0.785 | |
| PuI | 0.506 * | 0.439 * | 0.357 * | 0.484 * | 0.456 * | 0.530 * | 0.540 * | 0.533 * | 0.682 * | 0.831 |
| Common Indices | χ2/df | RMSEA | GFI | AGFI | NFI | CFI | SRMR |
|---|---|---|---|---|---|---|---|
| Judgment criteria | <5 | <0.08 | >0.9 | >0.9 | >0.9 | >0.9 | <0.08 |
| Value | 2.701 | 0.041 | 0.928 | 0.914 | 0.936 | 0.958 | 0.047 |
| Hypothesis | Path | Direct Effect | Indirect Effect | Total Effect | Results | |||
|---|---|---|---|---|---|---|---|---|
| β | B-C Sig. | β | B-C Sig. | β | B-C Sig. | |||
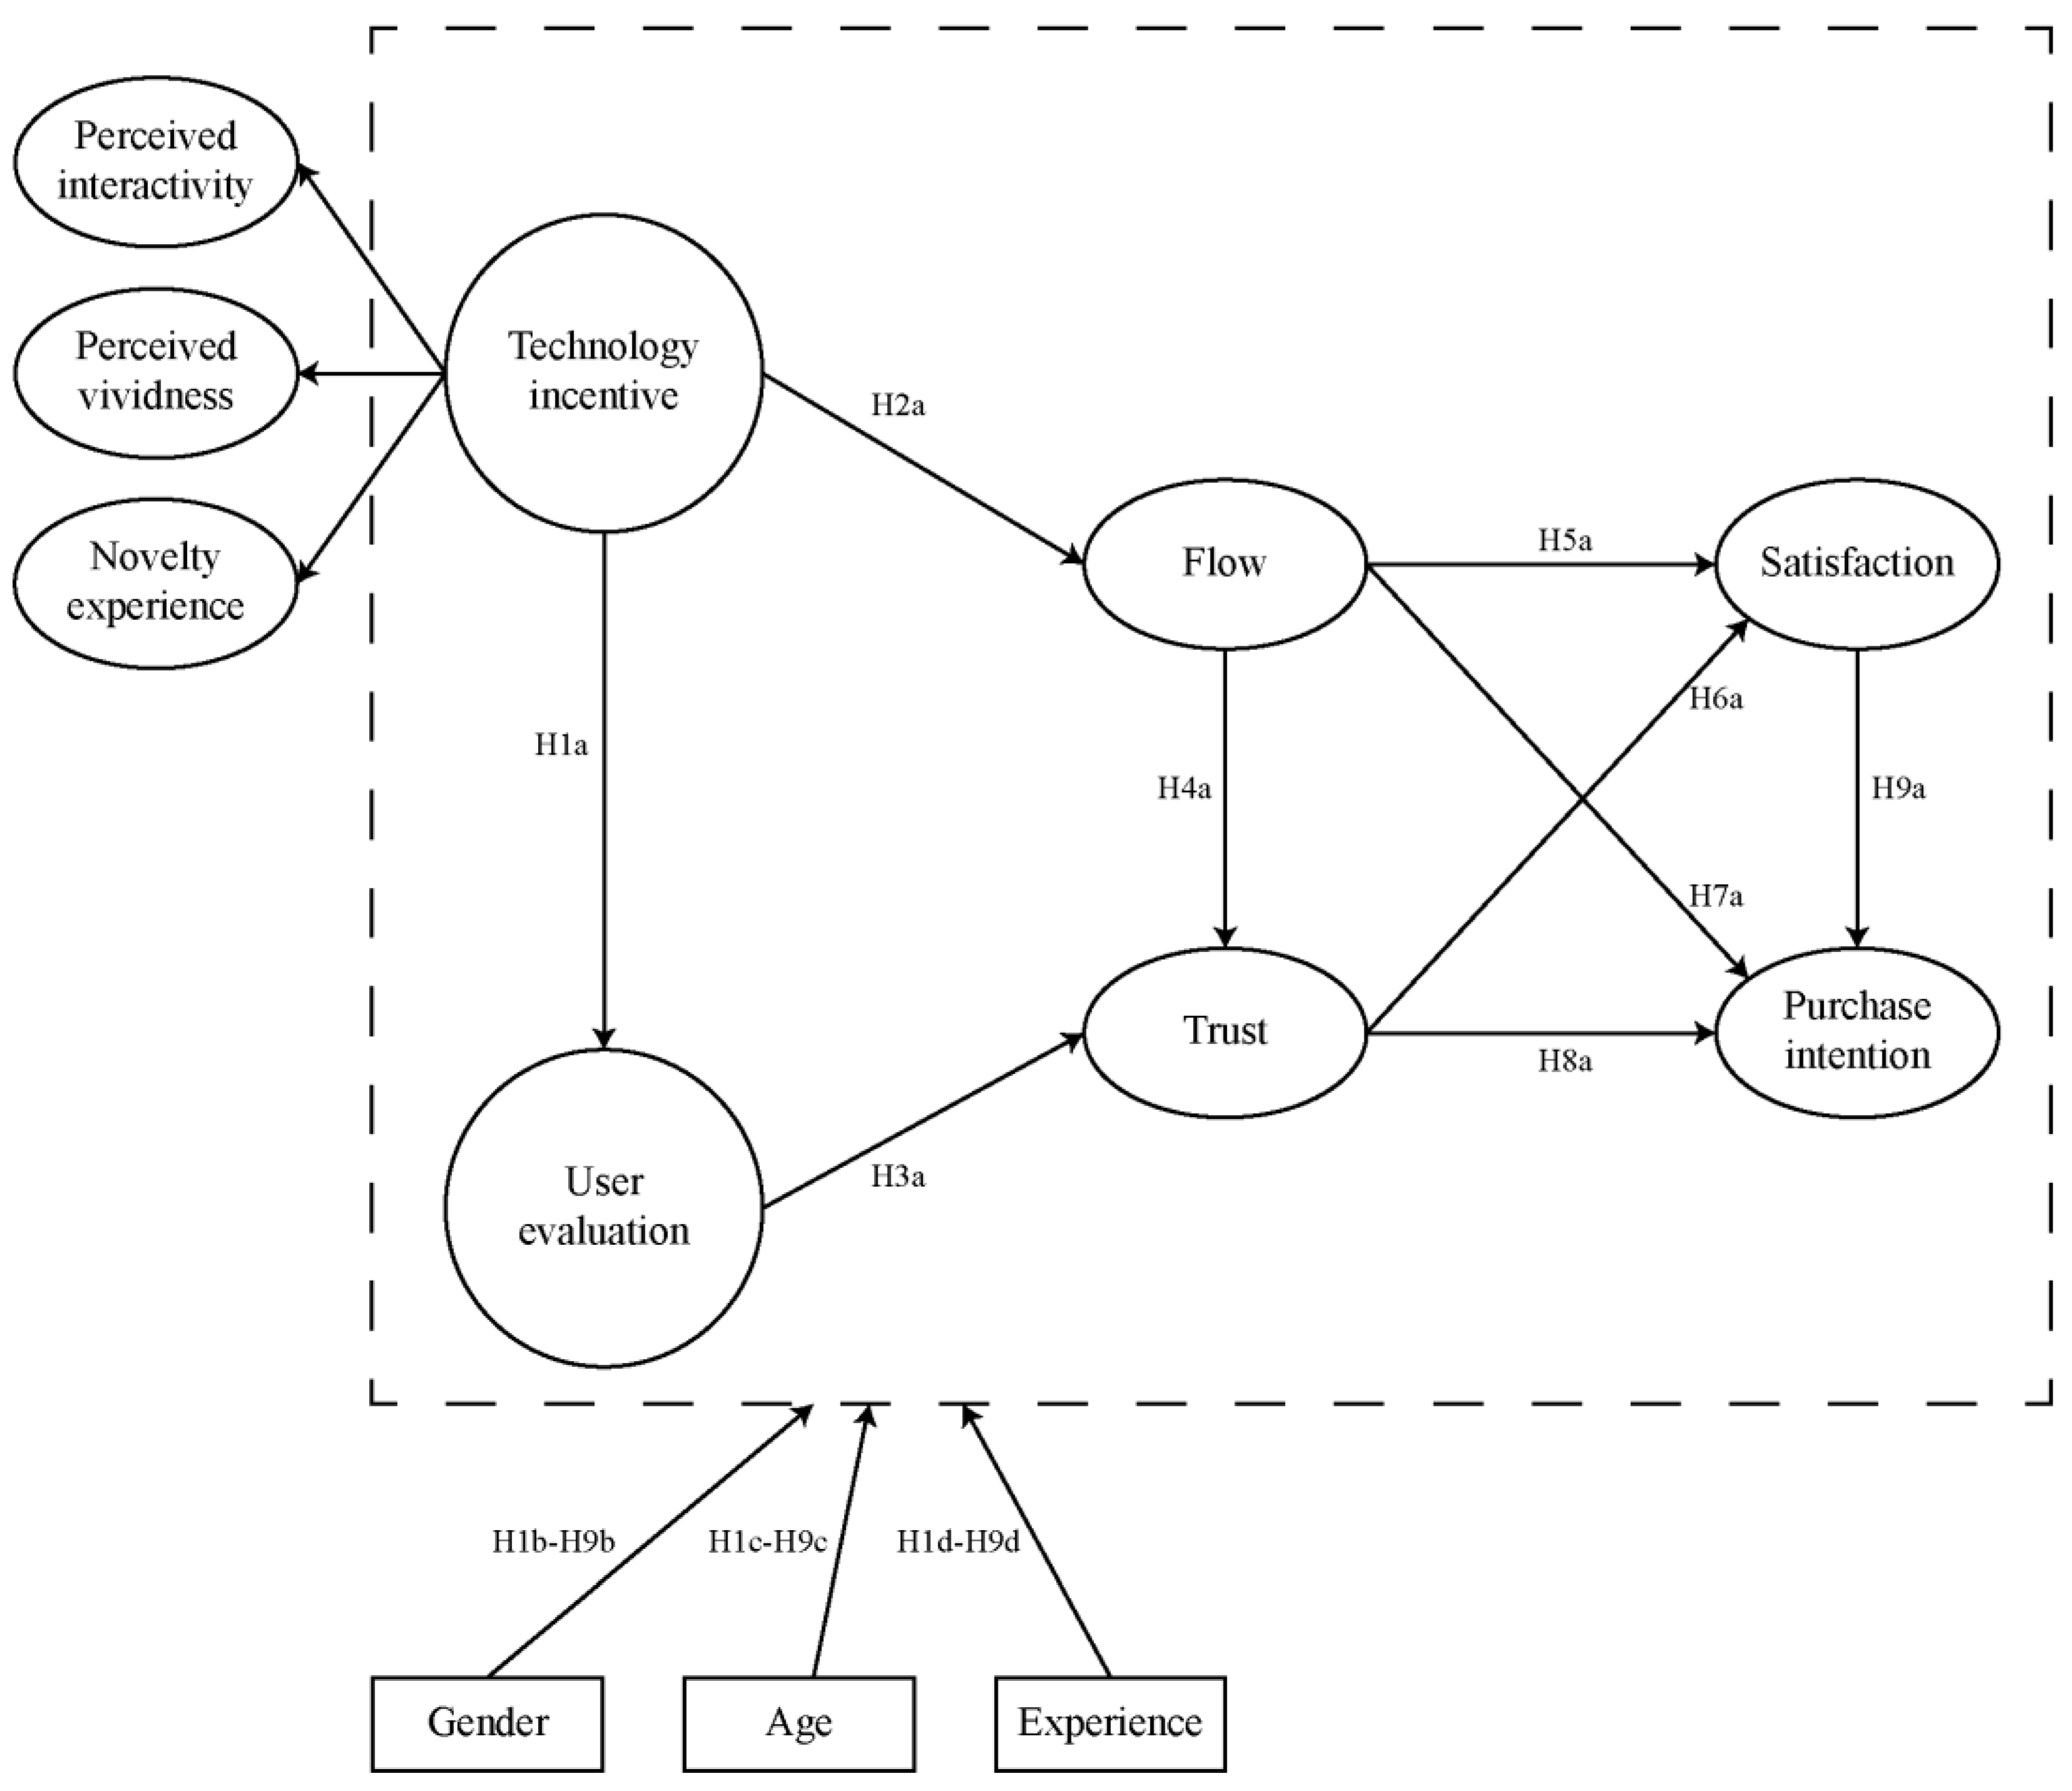
| H1a | TI→UE | 0.865 | 0.001 * | / | / | 0.865 | 0.001 * | Support |
| H2a | TI→FL | 0.730 | 0.001 * | / | / | 0.730 | 0.001 * | Support |
| TI→TR | / | / | 0.764 | 0.001 * | 0.764 | 0.001 * | ||
| TI→SA | / | / | 0.637 | 0.002 * | 0.637 | 0.002 * | ||
| TI→PuI | / | / | 0.610 | 0.001 * | 0.610 | 0.001 * | ||
| H3a | UE→TR | 0.851 | 0.001 * | / | / | 0.851 | 0.001 * | Support |
| UE→SA | / | / | 0.542 | 0.001 * | 0.542 | 0.001 * | ||
| UE→PuI | / | / | 0.487 | 0.001 * | 0.487 | 0.001 * | ||
| H4a | FL→TR | 0.039 | 0.484 | / | / | 0.039 | 0.484 | Not support |
| H5a | FL→SA | 0.205 | 0.005 * | 0.025 | 0.484 | 0.230 | 0.001 * | Support |
| H6a | TR→SA | 0.638 | 0.001 * | / | / | 0.638 | 0.001 * | Support |
| H7a | FL→PuI | 0.117 | 0.001 * | 0.142 | 0.001 * | 0.258 | 0.001 * | Support |
| H8a | TR→PuI | 0.199 | 0.004 * | 0.373 | 0.001 * | 0.572 | 0.001 * | Support |
| H9a | SA→PuI | 0.584 | 0.001 * | / | / | 0.584 | 0.001 * | Support |
| Path | Gender | Age | Experience | |||
|---|---|---|---|---|---|---|
| CMIN | p | CMIN | p | CMIN | p | |
| TI→UE | 2.295 | 0.130 | 0.163 | 0.687 | 0.776 | 0.378 |
| TI→FL | 7.435 | 0.006 * | 0.246 | 0.620 | 8.523 | 0.004 * |
| UE→TR | 1.286 | 0.257 | 1.001 | 0.317 | 0.574 | 0.449 |
| FL→TR | 0.259 | 0.611 | 0.269 | 0.604 | 0.520 | 0.471 |
| FL→SA | 0.003 | 0.957 | 0.219 | 0.640 | 2.822 | 0.093 |
| FL→PuI | 0.005 | 0.942 | 1.343 | 0.247 | 0.184 | 0.668 |
| TR→SA | 3.080 | 0.079 | 0.940 | 0.332 | 10.781 | 0.001 * |
| TR→PuI | 1.635 | 0.201 | 1.410 | 0.235 | 1.797 | 0.180 |
| SA→PuI | 3.403 | 0.065 | 1.939 | 0.164 | 0.025 | 0.874 |
| Moderating Variable | Path | β | p | |
|---|---|---|---|---|
| gender | male | TI→FL | 0.709 | 0.001 * |
| female | 0.757 | 0.001 * | ||
| experience | yes | TI→FL | 0.749 | 0.001 * |
| no | 0.550 | 0.001 * | ||
| yes | TR→SA | 0.714 | 0.001 * | |
| no | 0.442 | 0.003 * | ||
| Studies | Content | Constructs | Results |
|---|---|---|---|
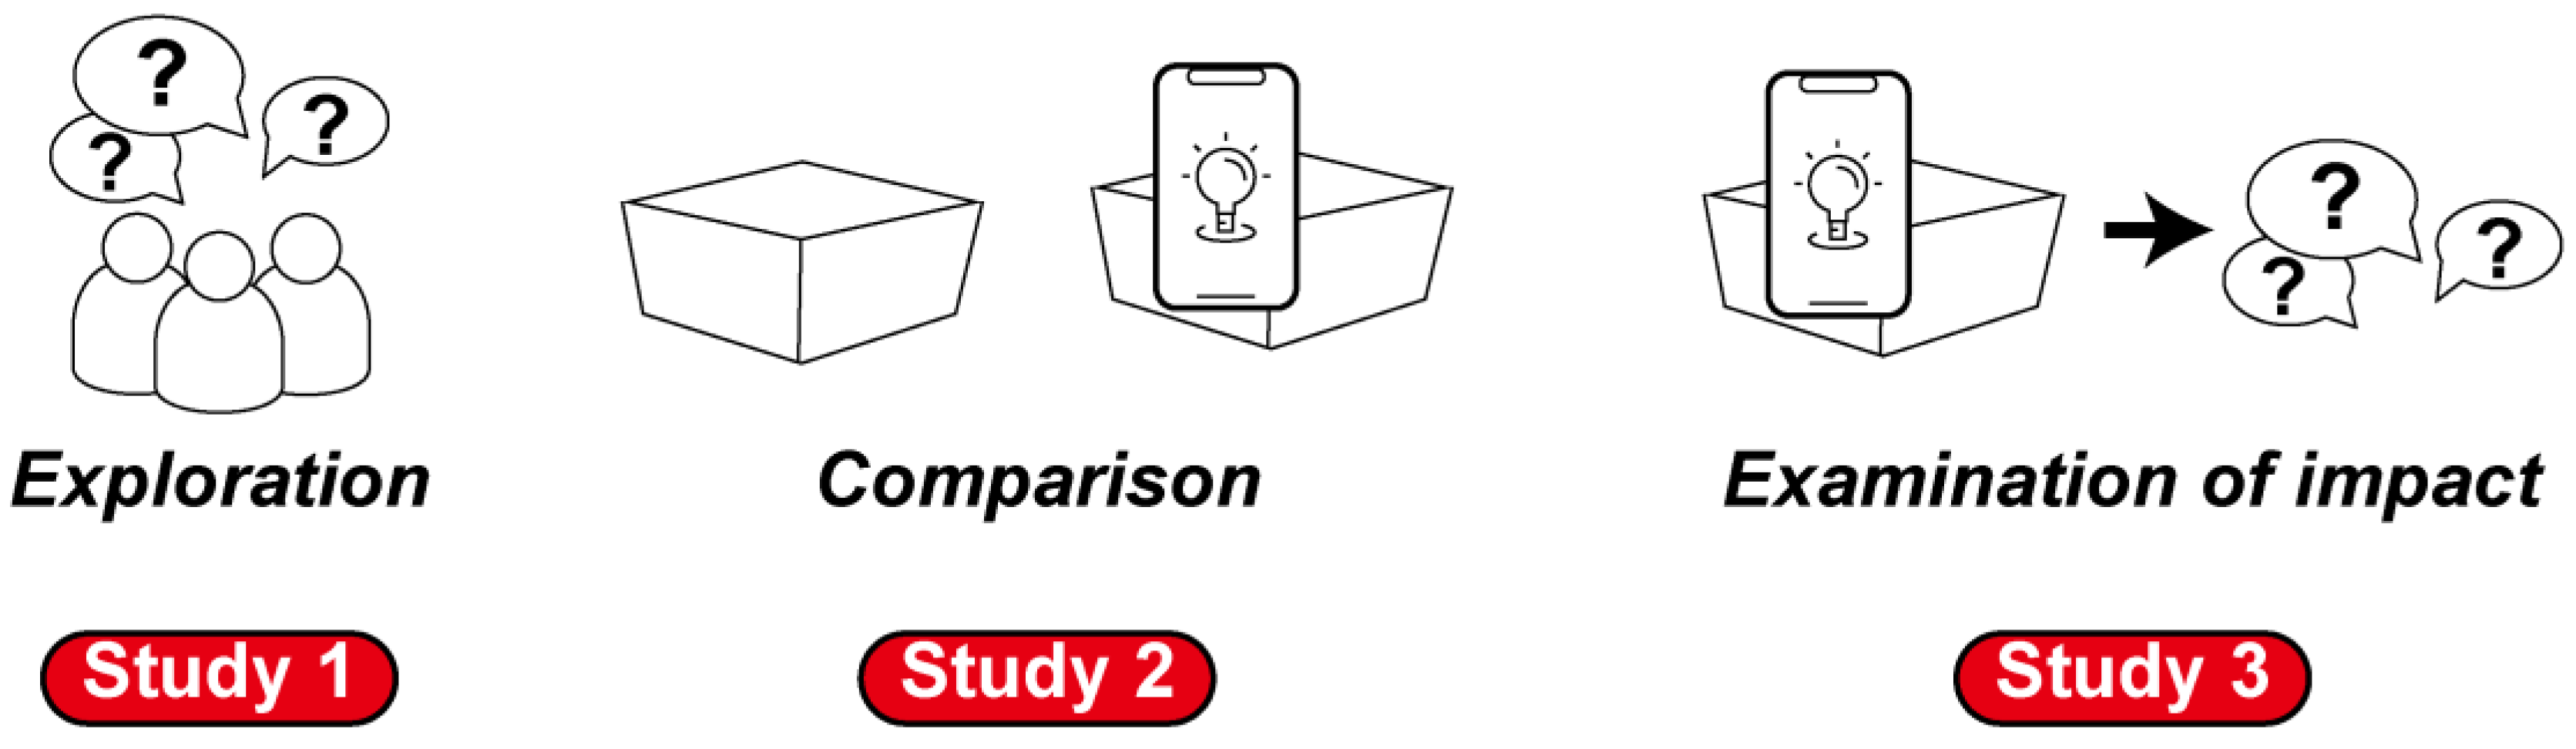
| Study 1 | The purpose of this study is to collect negative evaluations from food delivery platforms for using Latent Dirichlet Allocation topic modeling to identify the factors that affect the evaluation of users. | QoS, QoF, PVL | Based on the text analysis model, low levels of QoS, QoF, and PVL are most likely to result in negative consumer evaluations. |
| Study 2 | Comparing augmented reality packaging with traditional takeaway packaging in the design of takeaway packaging. | TR, SA, PuI | Users’ evaluation of the TR, SA, and PuI of takeaway packaged in augmented reality is significantly higher than that of takeaway packaged in traditional packaging. |
| Study 3 | A structural equation model was developed to analyze the mechanism of augmented reality technology in takeout packaging in order to improve consumer negative evaluations. | PI, PV, NE, TI, FL, QoS, QoF, PVL, UE, TR, SA, PuI | The second-order construct TI composed of PI, PI, and NE may enhance the second-order construct UE consisting of QoS, QoF, and PVL. Finally, increasing the PuI of consumers through FL, TR, SA intermediaries. |
Disclaimer/Publisher’s Note: The statements, opinions and data contained in all publications are solely those of the individual author(s) and contributor(s) and not of MDPI and/or the editor(s). MDPI and/or the editor(s) disclaim responsibility for any injury to people or property resulting from any ideas, methods, instructions or products referred to in the content. |
© 2023 by the authors. Licensee MDPI, Basel, Switzerland. This article is an open access article distributed under the terms and conditions of the Creative Commons Attribution (CC BY) license (https://creativecommons.org/licenses/by/4.0/).
Share and Cite
Gu, C.; Huang, T.; Wei, W.; Yang, C.; Chen, J.; Miao, W.; Lin, S.; Sun, H.; Sun, J. The Effect of Using Augmented Reality Technology in Takeaway Food Packaging to Improve Young Consumers’ Negative Evaluations. Agriculture 2023, 13, 335. https://doi.org/10.3390/agriculture13020335
Gu C, Huang T, Wei W, Yang C, Chen J, Miao W, Lin S, Sun H, Sun J. The Effect of Using Augmented Reality Technology in Takeaway Food Packaging to Improve Young Consumers’ Negative Evaluations. Agriculture. 2023; 13(2):335. https://doi.org/10.3390/agriculture13020335
Chicago/Turabian StyleGu, Chao, Tingting Huang, Wei Wei, Chun Yang, Jiangjie Chen, Wei Miao, Shuyuan Lin, Hanchu Sun, and Jie Sun. 2023. "The Effect of Using Augmented Reality Technology in Takeaway Food Packaging to Improve Young Consumers’ Negative Evaluations" Agriculture 13, no. 2: 335. https://doi.org/10.3390/agriculture13020335