Article

Is Grazing Good for Wet Meadows? Vegetation Changes Caused by White-Backed Cattle

1
Department of Grassland and Landscape Forming, University of Life Sciences in Lublin, Akademicka 15, 20-950 Lublin, Poland
2
Department of Applied Mathematics and Computer Science, University of Life Sciences in Lublin, Głęboka 28, 20-950 Lublin, Poland
3
Institute of Animal Breeding and Biodiversity Conservation, Department of Cattle Breeding and Genetic Resources Conservation, University of Life Sciences in Lublin, Akademicka 13, 20-950 Lublin, Poland
4
Department of Botany, Mycology and Ecology, Institute of Biological Sciences, Maria Curie-Skłodowska University, Akademicka 19, 20-033 Lublin, Poland
*
Author to whom correspondence should be addressed.
Agriculture 2023, 13(2), 261; https://doi.org/10.3390/agriculture13020261
Submission received: 27 November 2022 / Revised: 13 January 2023 / Accepted: 18 January 2023 / Published: 20 January 2023

Abstract

:
Wetland ecosystems are highly productive and valued for numerous reasons including wildlife habitat, biodiversity, water quantity and quality, and human uses. Grazing livestock on wet grasslands can sometimes be controversial due the humidity of the habitat, but on the other hand, it plays an important role in grassland preservation. Therefore, we evaluated the impact of Polish white-backed cattle grazing on changes in the vegetation (13 phytosociological relevés taken in years 2016–2019) of wet meadows as well as forage quality based on the species composition. Biodiversity was estimated based on species richness, Shannon–Wiener diversity and evenness indices, and Rényi diversity profiles. The peatland featured mostly high-sedge and wet meadows communities of the Magnocaricion and the Calthion alliances. The species and biodiversity indices demonstrated significant rising trends. Extensive grazing resulted in the decreased cover of the dominant species of rush meadows, e.g., the common reed, acute, and tufted sedge. The gaps that had emerged thanks to the reduced cover of the dominant species were filled by meadow plants, which led to increased biodiversity. During the four years of grazing, the cattle obtained satisfactory weight gains, particularly in 2019, which indicates that wet meadows are suitable for grazing and can provide sufficient feed for cattle.

1. Introduction

Wetland ecosystems are highly productive and valued for numerous reasons including wildlife habitat, biodiversity, water quantity and quality, and human uses [1,2]. Mowing is the most common form of wet meadow management [2]. Wet meadows provide numerous ecosystem services, including the production of high-quality forage for livestock [3]. Another type of wet meadows use is grazing livestock, but due to the humidity of the habitat, it can sometimes be controversial. Grazing plays an important role in the preservation of many grasslands [4,5,6,7,8,9]. However, unmanaged, excessive grazing can degrade ecosystems and the associated goods and services [3,10,11].
Since livestock are thought to damage the physical, chemical, and biological integrity of these systems, they are subject to government regulations ranging from seasonal use requirements to complete livestock removal [1].
Cattle grazing, especially when it is intensive, has a great influence on water quality. Summer grazing of cattle on high-altitude pastures causes a significant growth of pathogenic bacteria in the water, regardless of the changing climatic conditions [12].
The removal of livestock grazing resulted in increased levels of nitrate in wetland waters and thus higher levels of nitrate pollution compared with spring grazing [1].
In wet habitats, flood control and grazing are proposed as the best practices that favor vegetation diversity and prevent plant community degradation [5].
The examination of management practices (e.g., prescribed grazing) on a larger, watershed scale, contributes to the development of more effective strategies to strengthen the resilience of these valuable ecosystems [13].
Different wetlands are grazed by all kinds of wildlife as well as by livestock. Grazing has evolved along with these ecosystems and constitutes their integral part. The plants, wildlife, and domestic grazers have adapted and continue to adapt to each other [1].
The effects of grazing in wetlands are manifested, among others, by changes in species diversity and cover [4,9], channel morphology [1], fauna diversity [14], greenhouse gases as well as water quality [12]. Grazing primarily ensures the welfare of animals, affecting their health and condition [7]. Many studies show a different (from positive to negative) effect of grazing animals on wetlands depending on many factors such as the intensity of grazing, stocking, groundwater level, and climatic conditions. This demonstrates the need for long-term studies in different habitats to find trade-offs for different management scenarios and different measured environmental factors [4,7,8,9,12,13].
The aim of this paper was to evaluate the impact of white-backed cattle grazing on changes in the vegetation of wet meadows. We can ask the following questions: Are wet meadows suitable for grazing? Can they provide sufficient feed for the animals?

2. Materials and Methods

2.1. Study Area

The “Kazicha” peatland complex is located in the Skierbieszów Landscape Park (eastern Poland), in the valley of the Wolica river, near of the town Iłowiec. It covers an area of about 70 ha. The study site is covered primarily by marsh, peat-mud, and mud soils. The climate is characterized by significant annual precipitation totals (550–600 mm), while the average temperature of the year is 7.03 °C. The growing season lasts 214 days, and the snow cover lasts 86 days [15]. The research was conducted in 2016–2019. The basic weather conditions during the study period are presented in Table 1.
Based on meteorological data, the following indicators were estimated: Selyaninov hydrothermal index (K) according to Skowera and Puła [16]. The Selyaninov hydrothermal index is now widely used as the main quantitative indicator of the ratio of heat and moisture [17]. The values of the coefficient are determined by the following formula:
K = P/0.1∑t
where P—monthly sum of precipitation (mm); ∑t—monthly sum of temperature >0 °C. The coefficient has 10 classes of values [16]: exd—extremely dry k ≤ 0.4; vd—very dry 0.4 < k ≤ 0.7; d—dry 0.7 < k ≤ 1.0; qd—quite dry 1.0 < k ≤ 1.3; o—optimal 1.3 < k ≤ 1.6; qw—quite wet 1.6 < k ≤ 2.0; w—wet 2.0 < k ≤ 2.5; vw—very wet 2.5 < k ≤ 3.0; exw—extremely wet k > 3.0. The values of the K index during the study period are presented in Table 2.
Polish white-backed, black-white, and red-white cattle were grazing on wet meadows covering 48.19 ha (50°50′10″ N, 23°23′56″ E) and featuring mainly high sedge and proper rushes with the common reed. In the 20th century, the area was regularly grazed, mainly by cattle belonging to local farmers. In the 1990s, grazing and any use were discontinued. After Poland’s accession to the EU in 2004, mowing was carried out for several years. Grazing was restored in 2016.

2.2. Animal Management

All Polish white-backed cattle introduced into the study were purchased. The animals were outdoors all year round; they grazed and received a supplement of conserved grass and maize silage during winter. Animal stocking rates varied from year to year (they were included in the experiment successively and were slaughtered at about 24 months of age); the rates are shown in Table 3. For this paper, the number of animals was determined at the end of each year of the study and in 2019 at the end of the experiment. Conversion of livestock unit (LSU) factors were applied according to Eurostat methodology [18].

2.3. Field Study

Vegetation research was conducted in the growing season from May to August (before grazing and during the grazing period). The selection of plots for the study was made during the initial field visit in 2016. From 2016 to 2019, 13 phytosociological relevés, each covering 25 m2, were performed in homogeneous patches representing the dominant plant communities (areas most intensively used by animals were excluded from the research, i.e., within 40 m from the shelter). The relevés taken using the Braun-Blanquet [19] method were mapped with a GPS receiver MobileMapper 10 and its geographical coordinates were recorded. The relevés could be repeated in the same places in the following years. The names of vascular species are used according to Mirek et al. [20]. The phytosociological taxonomy of the plant communities is based on Matuszkiewicz and Mucina et al. [21,22]. Plants were identified directly in the field, no plant samples were collected.

2.4. Statistical Analyses

Changes in the plant cover and forage quality as a result of animal grazing were subjected to statistical analysis. To assess forage quality, the evaluation of grassland quality index (EGQ) proposed by Novák [23] was used, with forage value (FV) assigned to the individual species. One-way ANOVA with repeated measurements was used to demonstrate differences in EGQ values in the consecutive years. For the evaluation of the grassland quality the following formula was used:
E G Q = ( D × F V ) 8 ,   where :
EGQ—evaluation of grassland quality, D (%)—percentage of species, FV—fodder value of species.
To compare the number of plant species (S) occurring in the particular years, the GLM model with Poisson distribution for count data was used. To demonstrate the differences between each pair of years, multiple comparison tests with Tukey’s amendment were used. This amendment was aimed at controlling type 1 error for comparisons of many groups [24]. In the analysis, the significance level of α = 0.05 was adopted. Plant diversity within communities was estimated and compared based on species richness (S)—number of species in the community, Shannon–Wiener diversity index (H), and evenness index (J). Besides the analysis of the number of species, Rényi diversity profiles (Hα) were constructed [25,26,27] to compare the effects of grazing on plant diversity. Diversity profiles play an important role in diversity comparisons and use parametric families of diversity indices instead of a diversity index with a numerical value. In the case of Rényi diversity profiles, a series is constructed and expressed with the following formula:
H α = 1 α 1   ln i = 1 S p i α ,   where :
S—number of species, p i —Shannon–Wiener diversity index, α—index order, α = 0, the value is equal to number of species (S), for order α close to 1 go to Shannon–Wiener index. The indices of lower orders refer to species richness (they are sensitive to more rarely occurring species), while those of higher orders refer to species evenness (they are sensitive to the dominant species). A given community is regarded as more diverse than another community if, for all α orders, the index values are higher than in the other community.
In addition, a multidimensional principal component analysis (PCA) was carried out to present the changes in plant communities as well as the climatic and edaphic conditions [28]. The analysis considered species characteristic of the Phragmitetea (ChAll. Magnocaricion, ChAll. Phragmition) and Molinio-Arrhanatheretea class (O. Molinietalia, All. Calthion palustris). The assessment of climate and edaphic conditions was conducted based on ecological indicator values (L—light, T—temperature, K—continentality, F—moisture, R—water/soil pH, N—nitrogen content). The indicator values described the most typical habitat conditions of the species in which it most often grows in Poland and based on the results of field studies [29]. For each study patch in each year, the weighted average (Wa) of the aforementioned ecological indicators was calculated with a formula proposed by Czarnecka and Chabudziński (2014) [30]: WA = Ʃni = 1 (A2 × I)/Ʃni = 1 A2i, where WA—the weighted average; Ai—abundance of cover of the i-th species in a given niche; Ii—ecological indicator value for the i-th species, and n—number of species in the study patch.
The PCA method enabled the identification of the main patterns describing the differences among data in the set. Additionally, it enabled the visualization of the changes that occurred in the study years as a result of livestock grazing. R v. 3.5 software was used for analysis [31], particularly the vegan package [32] to analyze the diversity of communities and construct the Rényi diversity profiles.

3. Results

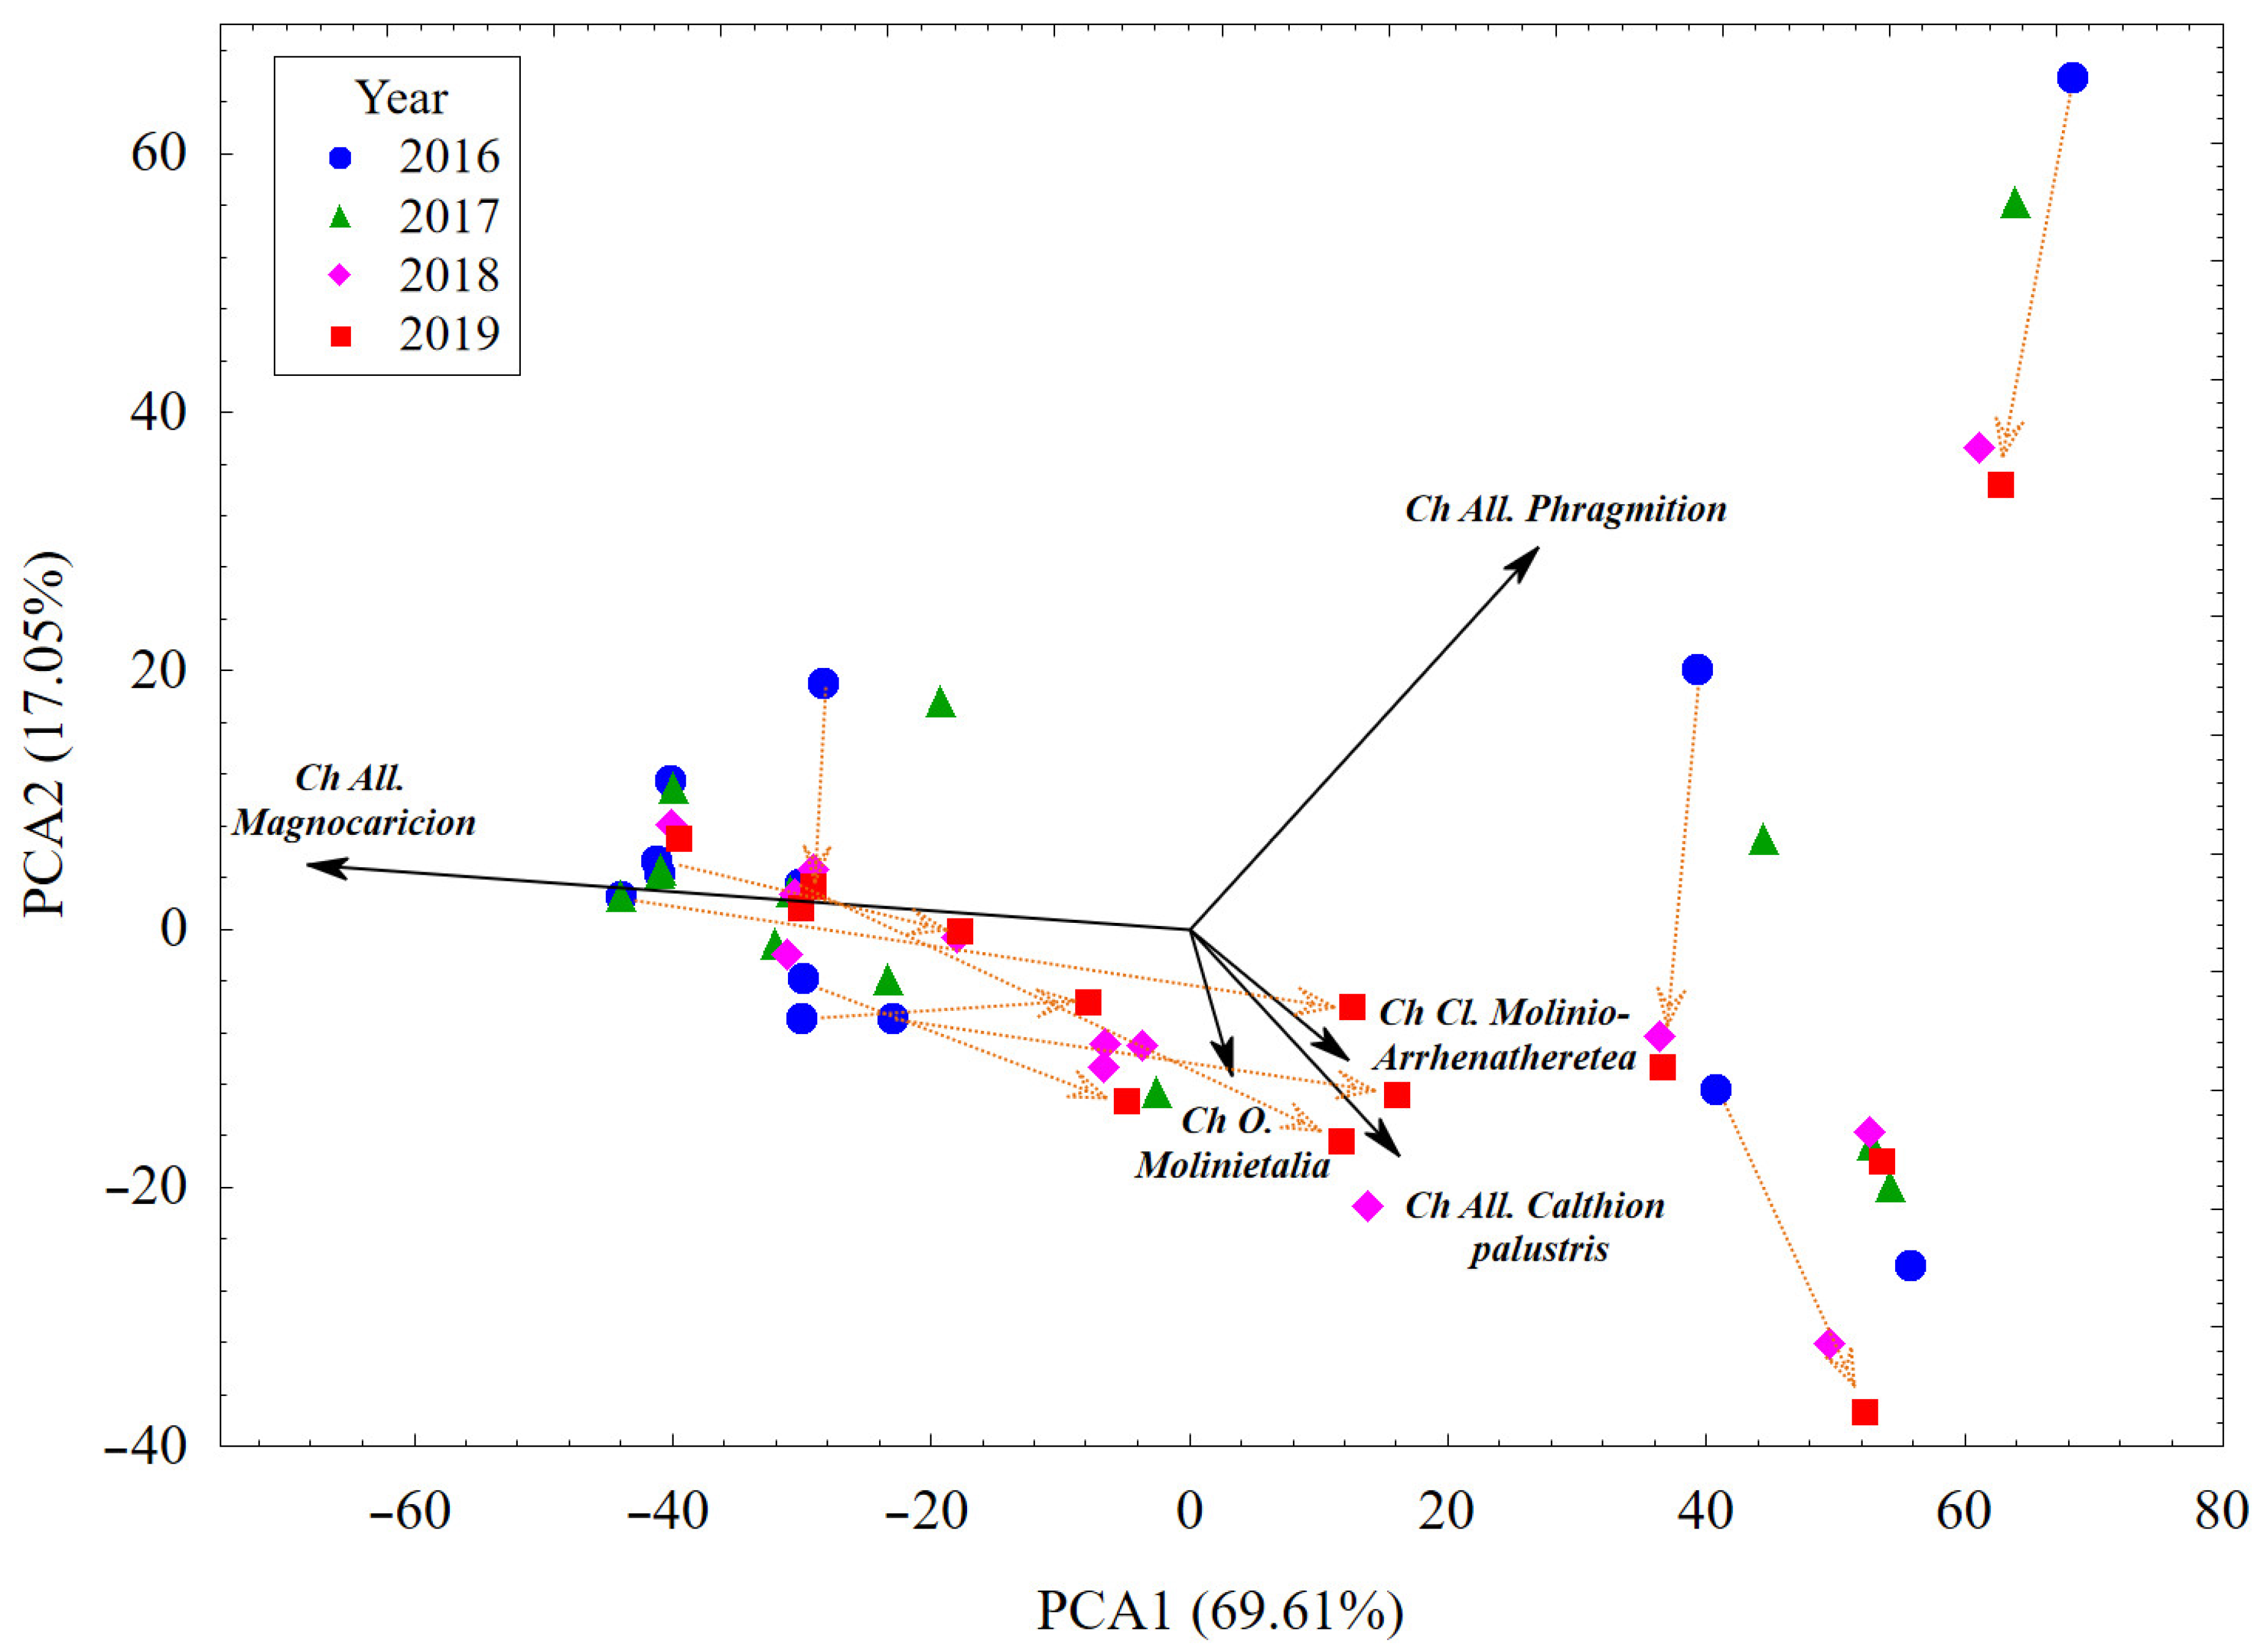
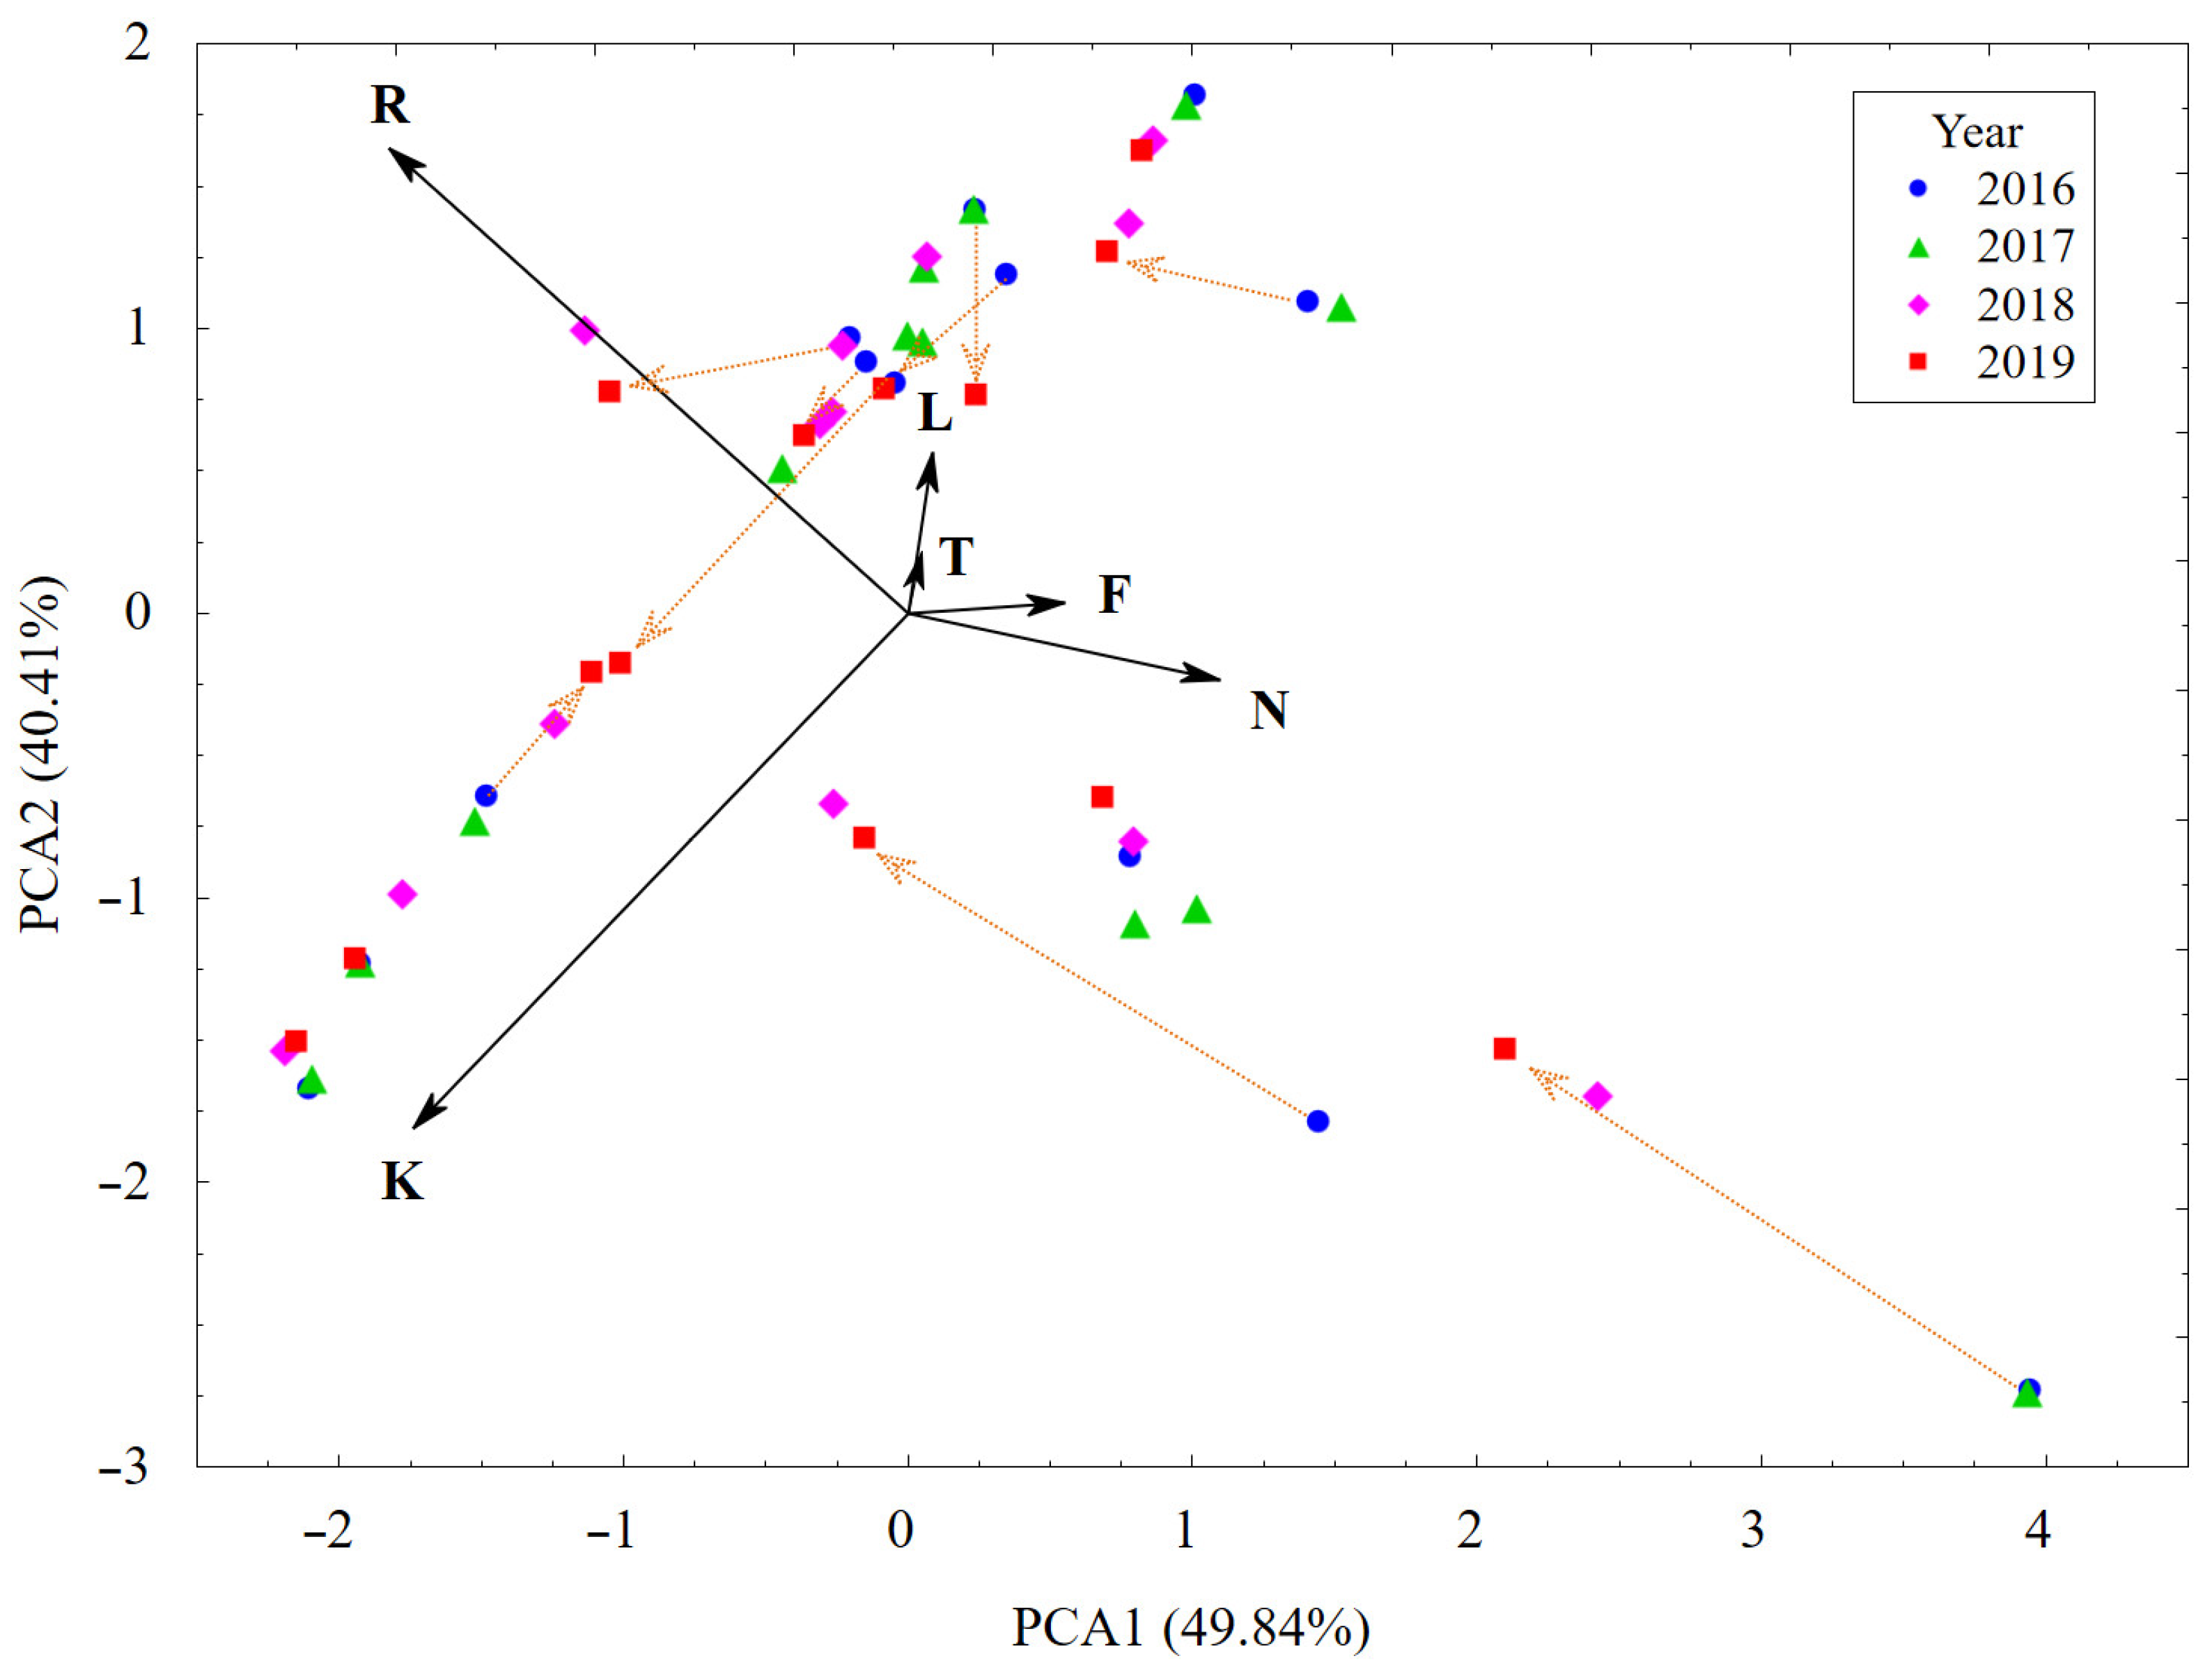
3.1. Plant Cover and Their Changes vs. Habitat Conditions

The peatland featured mostly high-sedge communities of the Magnocaricion Koch 1926 alliance (Caricetum gracilis (Graebn. et Hueck 1931) R.Tx. 1937, Caricetum elatae Koch 1926, Caricetum distichae (Nowiński 1928) Jonas 1933) and reed rushes (Phragmitetum australis (Gams 1927) Schmale 1939). There were also some patches of wet meadows of the Calthion alliance, but with a high share of sedge and rush species. Sedge species such as Carex gracilis, Carex elata or Carex disticha and Phragmites australis predominated in the area.
The number of species is one of the basic elements of biodiversity (floristic diversity in the case of the flora itself). When analyzing the number of species in the individual patches in the study ears, significant differences were found (GLM model). Multiple comparison tests demonstrated a significant rising trend in the number of the occurring plant species. In comparison with 2016 (z = −4.95; df = 48; p < 0.001) and 2017 (z = −3.73; df = 48; p = 0.001), the number of species was significantly the highest in 2019. A significant difference was also found between 2016 and 2018 (z = −2.96; df = 48; p = 0.016). In the remaining cases, significant differences were not observed (z = −2.037, df = 48, p = 0.174 for 2018 and 2019; z = −1.715, df = 48, p = 0.316 for 2017 and 2018; z = −1.259, df = 48, p = 0.599 for 2016 and 2017). The box plot (Figure 1, Table S1) confirms the growing trend in the number of species in the consecutive years of the study. The grazing of white-backed cattle led to an increase in the number of vascular plant species in the communities analyzed.
The principal component analysis (PCA) carried out to assess cover-abundance changes of the individual species of plant communities in the Phragmitetea and Molinio-Arrhenatheretea class, made it possible to create two variables, PCA1 and PCA2, that jointly account for 86.66% of the variability in the dataset—PCA1 accounts for 69.61% while PCA2 for 17.05% (Figure 2; Table S2 and Table S3). When analyzing the factor loadings of the individual plant communities, it was found that the greatest impact on the PCA1 variable was exerted by species characteristic of All. Magnocaricion (negative) as well as All. Phragmition and All. Calthion palustris (positive). The PCA2 variable, on the other hand, allows differentiating the communities based on species characteristic of All. Phragmition (positive influence) and All. Calthion palustris (negative influence). The distribution of phytosociological relevés was shown in an arrangement defined by two principal components, PCA1 and PCA2, determined according to the cover-abundance of individual plant species in the analyzed patches (Figure 2). In addition, scaled vectors (black solid line) were added to the chart to show the contribution of the individual species in the values of the principal components as well as vectors (orange dotted line) representing the trend of changes for the particular phytosociological relevés in 2016–2019. An analysis of the ordination diagram makes it possible to distinguish two groups according to the cover-abundance of the individual species (positive and negative values of the first principal component PCA2). In the study years, a trend of changes in the cover-abundance of the particular species is visible in the vegetation patches analyzed. In most patches, one can observe an increasing cover-abundance for species characteristic of the Molinio-Arrhenatheretea class, including the Molinietalia order and Calthion palustris alliance (Figure 2).
The principal component analysis (PCA) carried out to assess the climatic and edaphic conditions (Figure 3; Table S3 and Table S4) made it possible to create two variables that jointly account for 90.25% of the variability in the dataset (PCA1 accounts for 49.84% while PCA2 for 40.41%). When analyzing the factor loadings of the individual phytosociological relevés, the greatest contribution to the PCA1 variable was found for the following indices: acidity R and continentalism K (negative) as well as humidity F, and nitrogen content N (positive). The greatest contribution to the PCA2 variable was found for the following indices: acidity R and light L (positive) as well as continentalism K (negative). The distribution of phytosociological relevés in a system defined by two principal components, PCA1 and PCA2, determined by Ellenberg indices is shown in Figure 3. In addition, scaled vectors (black solid line) were added to the chart to show the contribution of the individual indices in the values of the principal components as well as vectors (orange dotted line) representing the trend of changes in 2016–2019. What can be observed most frequently in the chart is the rising trend of the values of R and K indices (Figure 3).

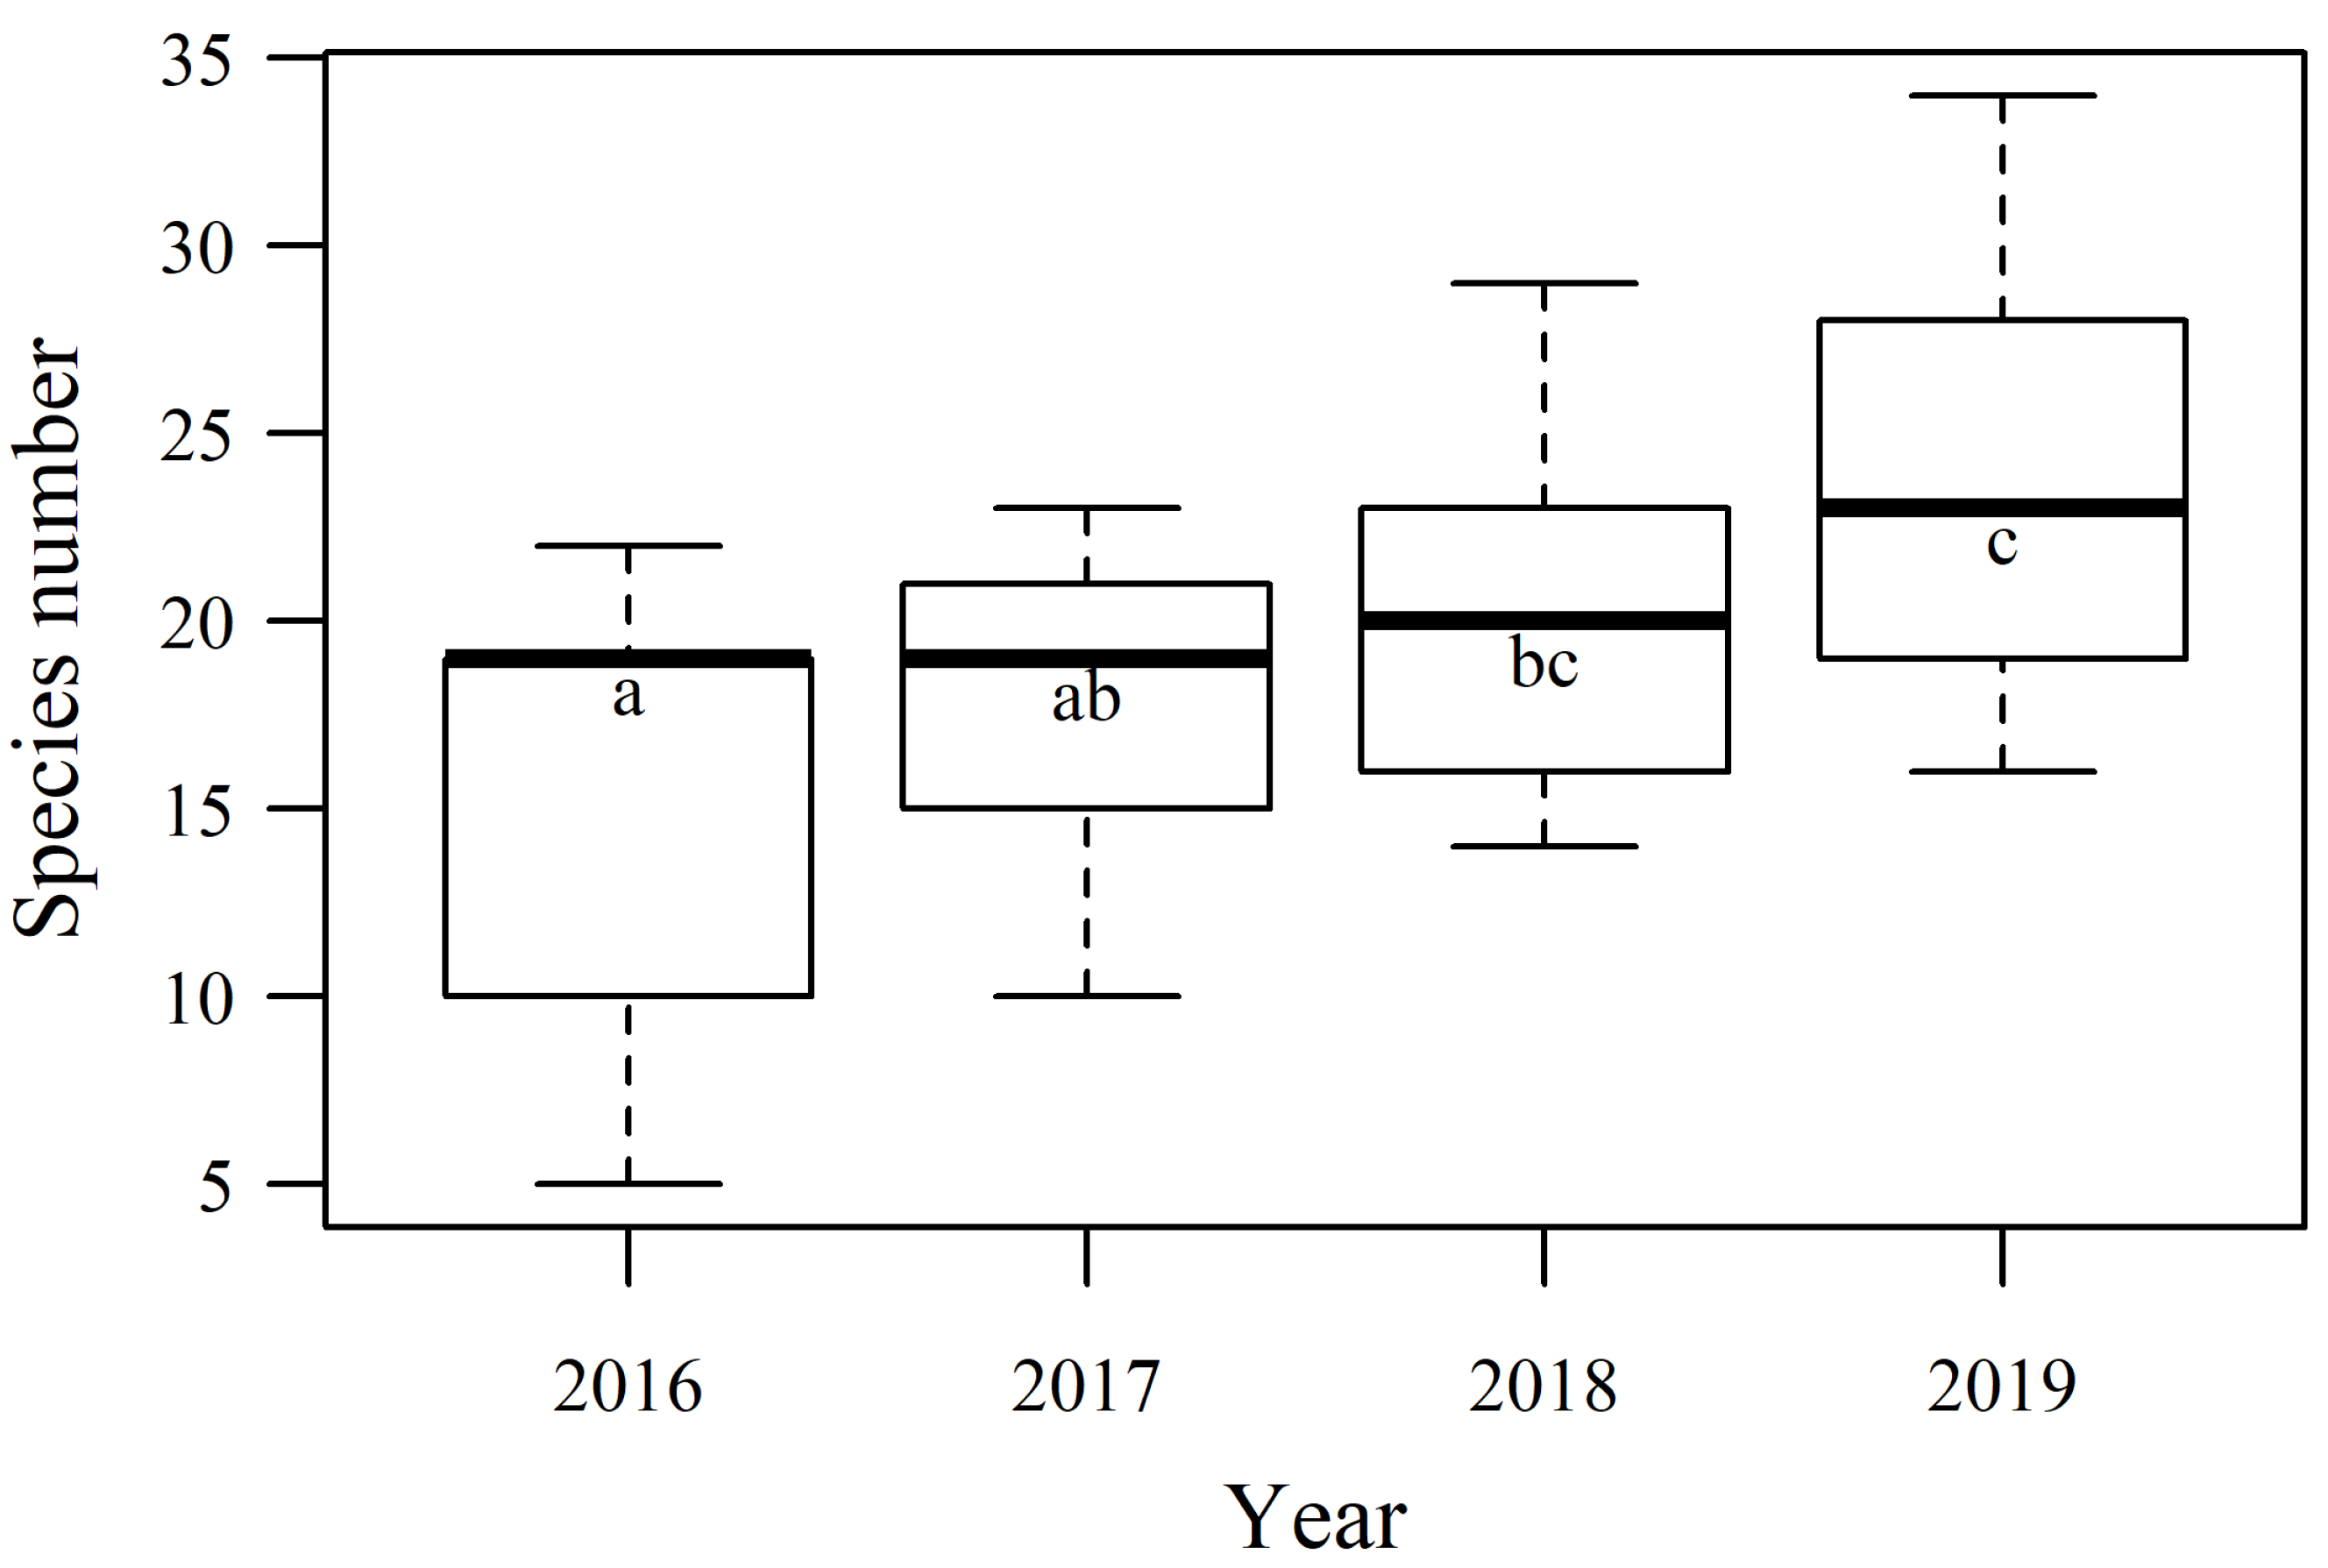
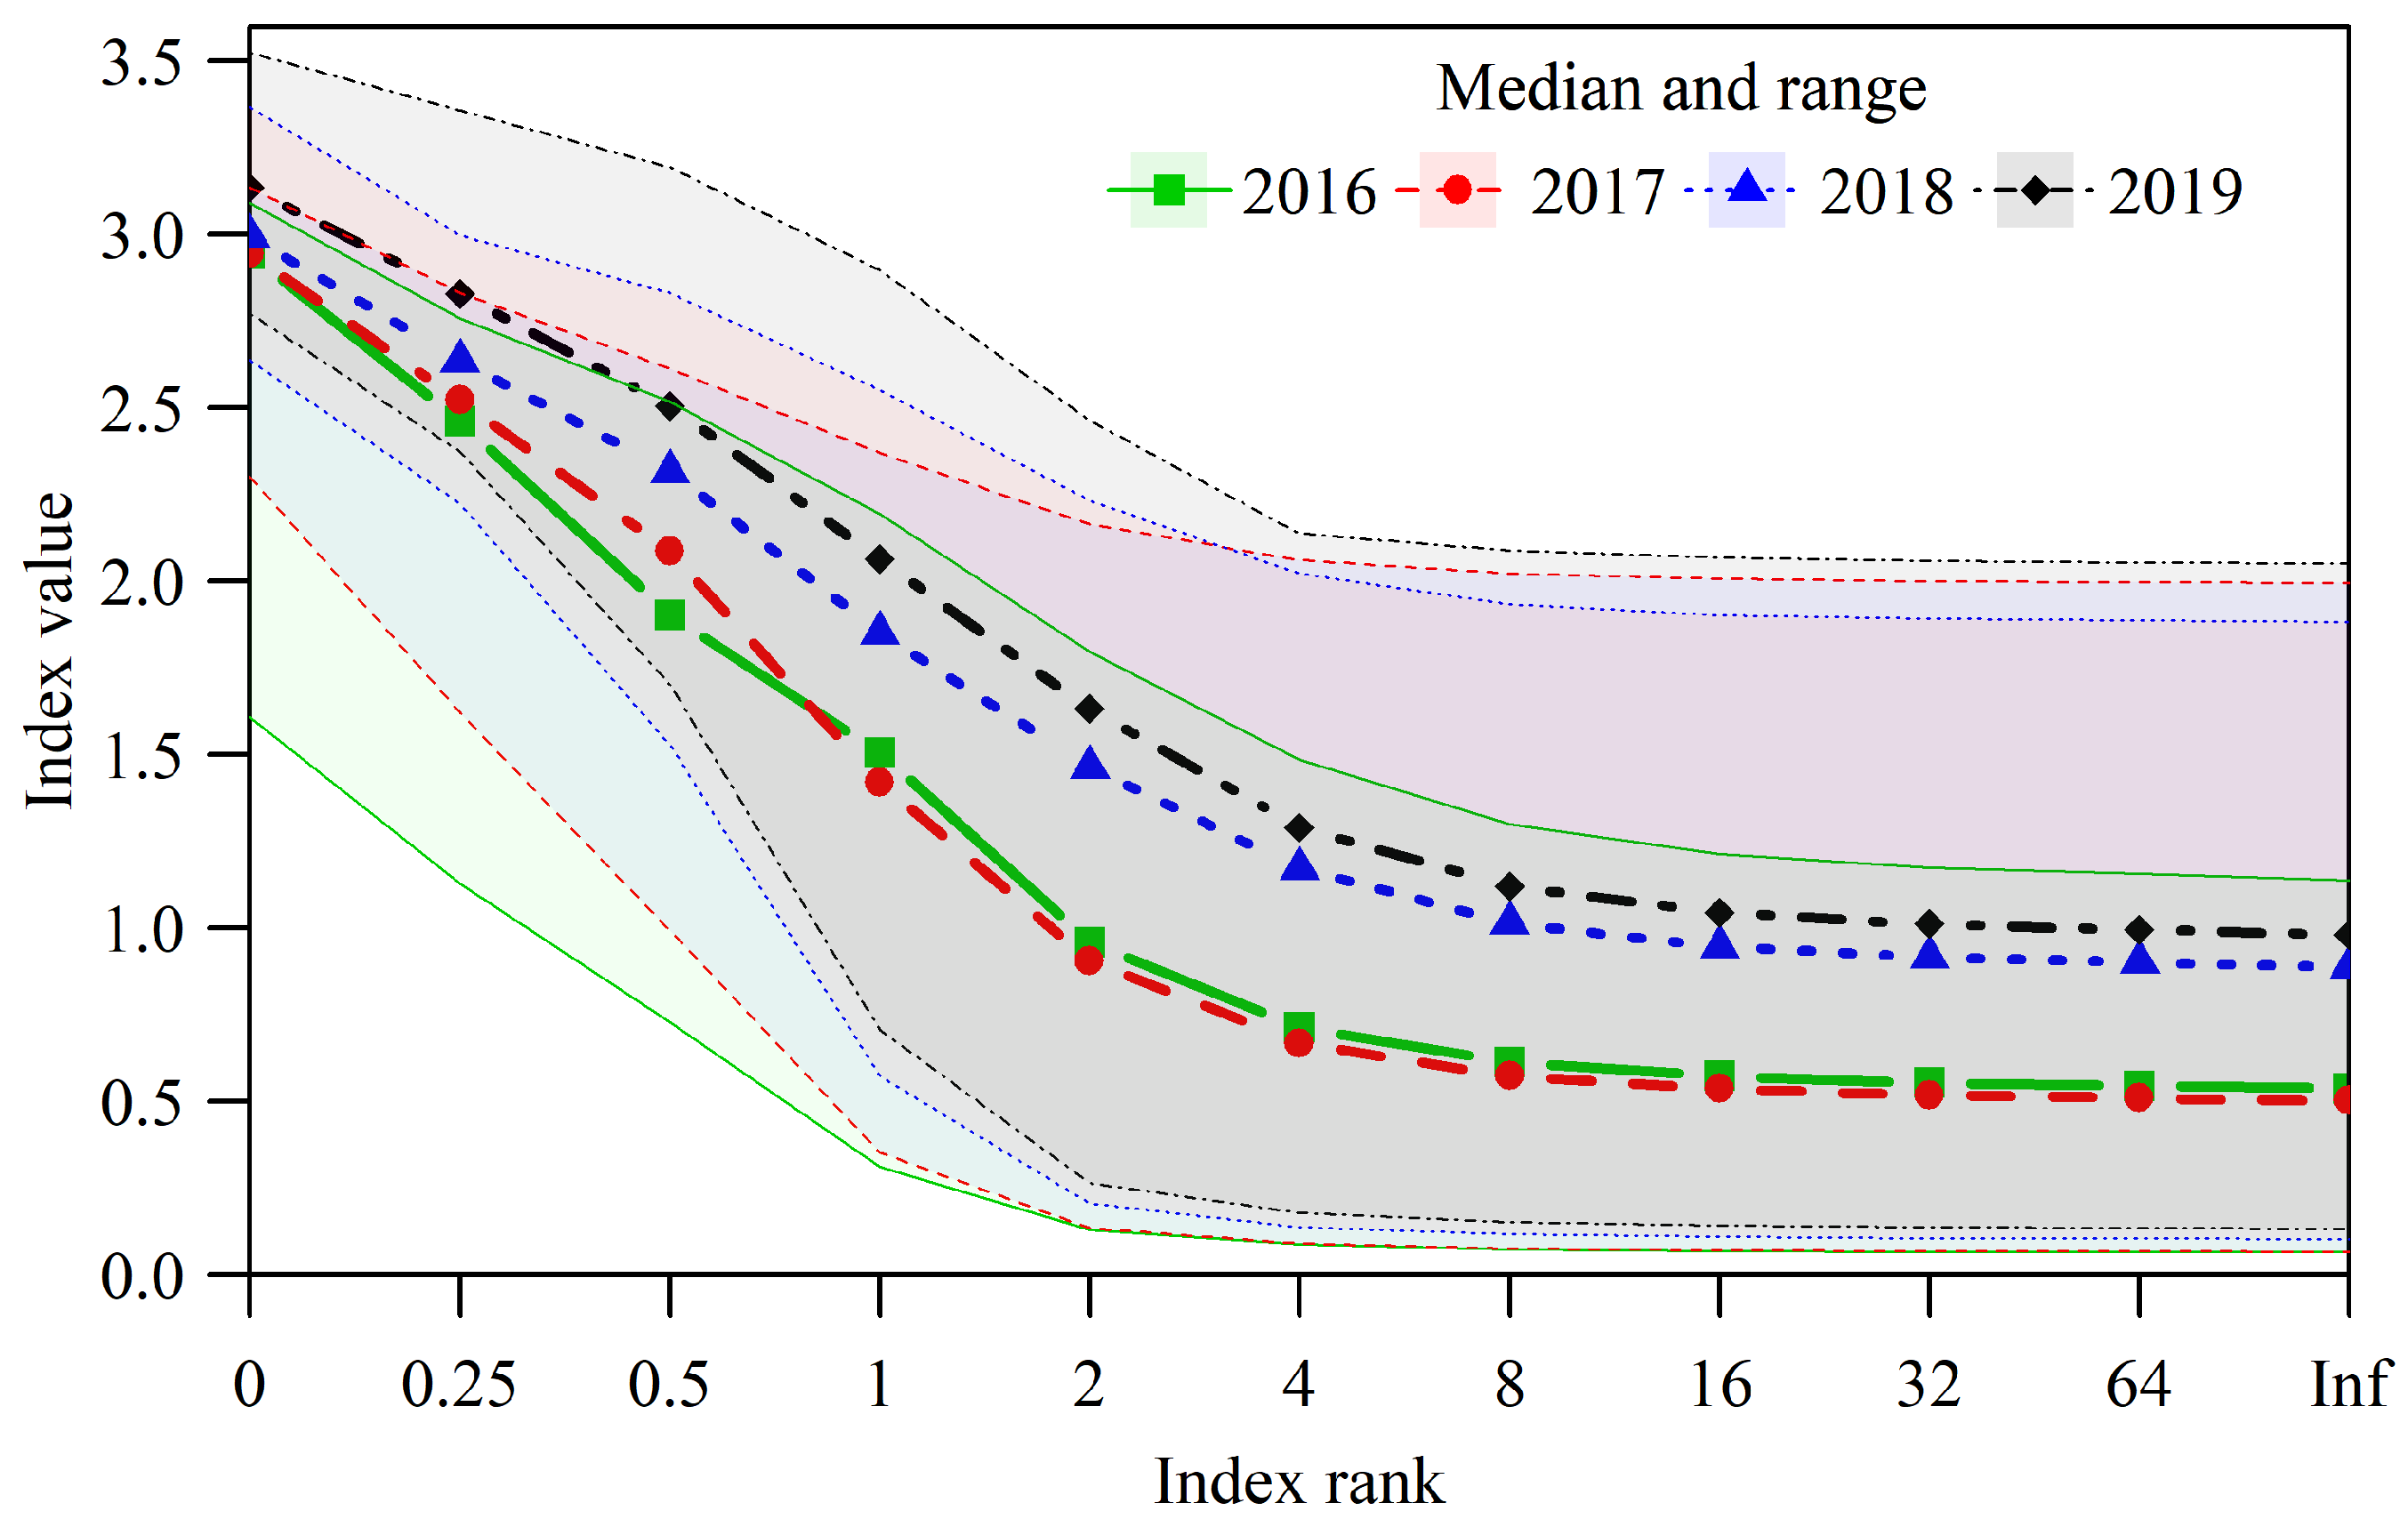
3.2. Biodiversity Dynamics

The Rényi diversity profiles (Hα) also confirm the changes occurring in the communities (Figure 4). Values of Hα range from about 0.6. to 3.5. The figure shows the median values from all relevés as well as the ranges of the obtained Rényi index (H) values in the individual years. In the course of the conducted observations, the value of the Shannon diversity index (Hα = 1) increased significantly. Its value was 1.5 in the years 2016–2017, 2.0 in 2018, while in 2019 it increased above 2.0. The greatest floristic diversity occurred in the last year of the study (2019) when the median values of the indices for all the orders α were the highest. A slightly lower diversity was observed in the preceding year (2018). The values of the indices for the years 2016–2017 show a similar diversity in all orders and are lower than in the two subsequent years. In 2019, the number of species was the highest (order α = 0) in comparison with the other years. The lower boundary of the range shows that the number of species in some phytosociological relevés was significantly smaller in the first year (2016) than in the other years. The values of indices of higher orders are greater for the last two years of the study (2018 and 2019) than for 2016 and 2017, which evidences the decreasing domination of the species with the greatest cover abundance because indices of higher orders indicate the occurrence of dominant species. For the H index of order, we received information about the dominance of a species with the greatest cover abundance in the individual relevés. The dominant species in the patches were mainly Carex gracilis, Carex elata and Phragmites australis. The greatest cover abundance of the dominant species was observed in the first study year (2016). The upper limit of the obtained values of indices of higher orders was considerably lower than in the subsequent years (Figure 4). In 2017, although the median value of the indices approximated the value from 2016, relevés already appeared where the observed values approximated those occurring in subsequent years (maximum values).

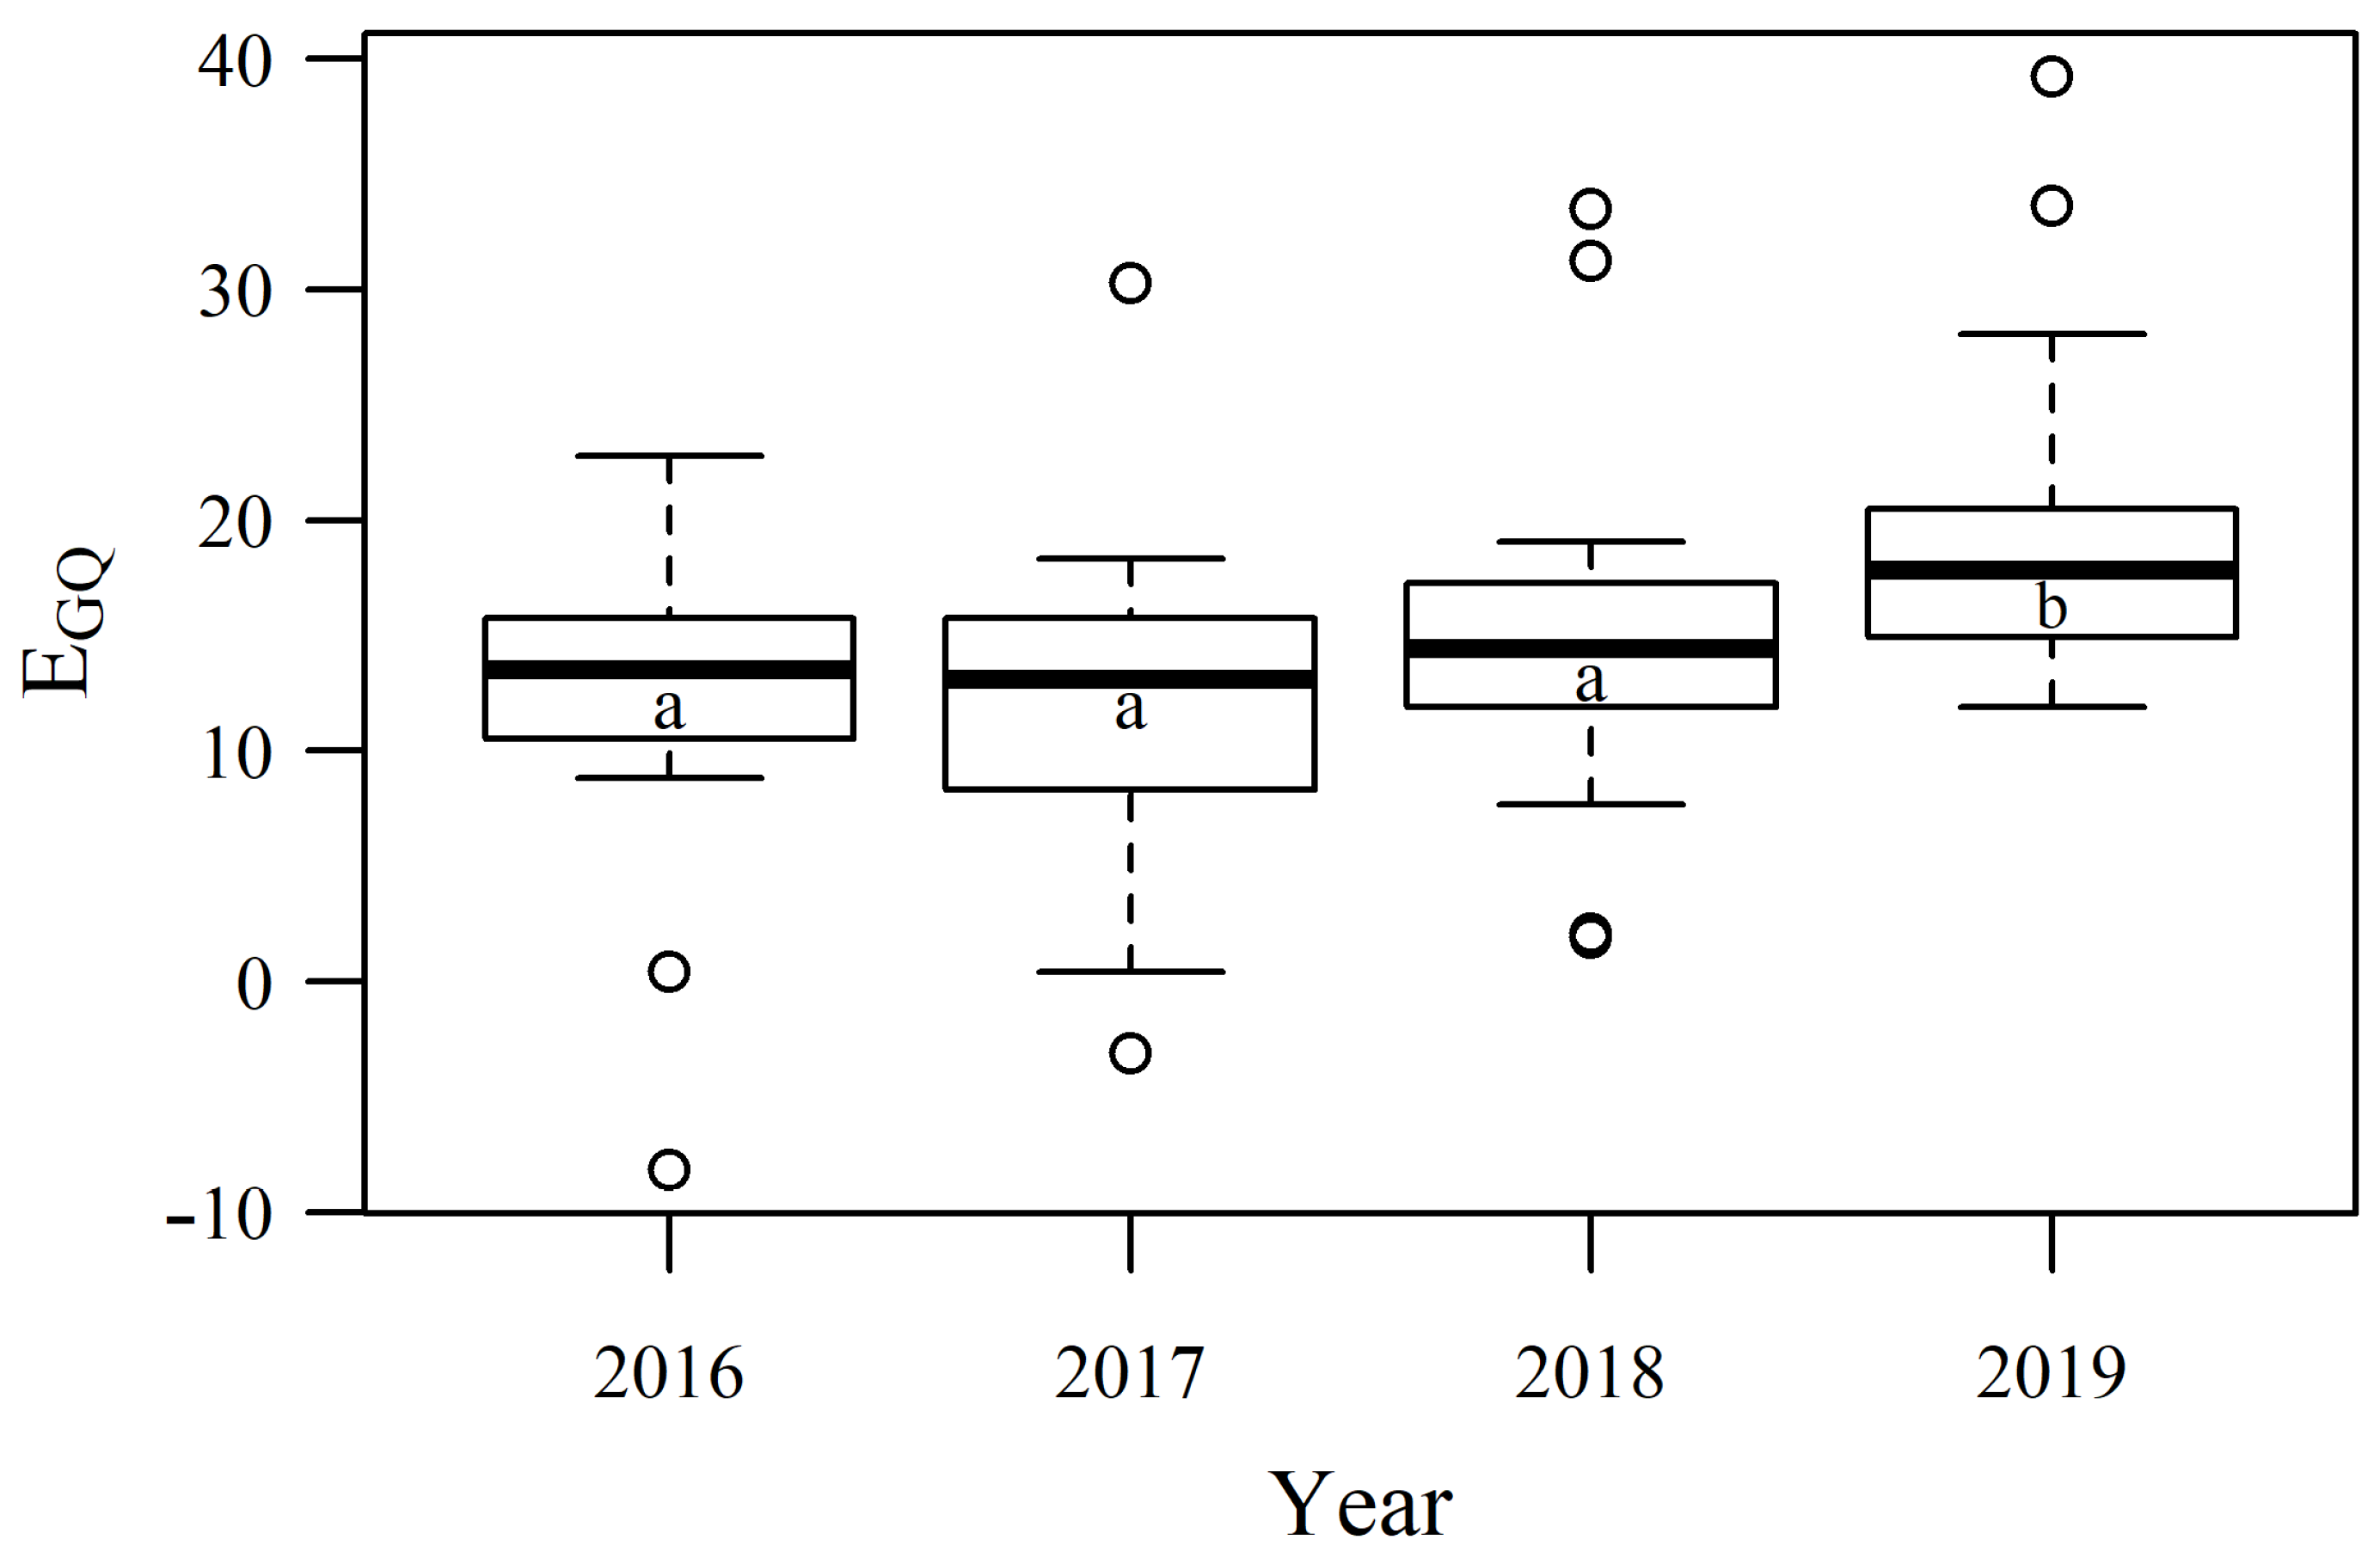
3.3. Dynamics of Pastures Forage Quality

The communities of the wet meadows analyzed do not yield forage of sufficient quality for livestock. Therefore, an evaluation of grassland quality was conducted according to Novák [23]. In the successive years of the study, a rising trend in the value of forage, expressed with EGQ, was observed. The results of a one-way analysis of variance (ANOVA) with repeated measurements showed significant differences in the values of the EGQ index in the successive years (F = 9.08, df = 3, p < 0.001). Multiple comparison tests demonstrated that EGQ values in 2019 were the highest in comparison with the previous years (Tukey qs = 6.372, p < 0.001 when compared with 2016; qs = 6.41, p < 0.001 compared with 2017 and qs = 4.02, p = 0.035 compared with 2018; in all cases df = 36 and qcrit = 3.457). Statistically significant differences were not found between the values of the index for the earlier years (qs = 2.35, p = 0.359 between 2018 and 2016; qs = 2.38, p = 0.347 between 2018 and 2017; qs = 0.03, p = 0.999 between 2016 and 2017; in all cases df = 36 and qcrit = 3.457) (Figure 5).

4. Discussion

Riparian meadows provide a suite of ecosystem benefits around the world. These diverse ecosystems deliver clean water, flood attenuation, nutrient sequestration, and wildlife habitat [33,34,35,36]. There is clear evidence that livestock should be managed to conserve and enhance ecosystem services in grazed landscapes [3,37,38], especially in the context of adequate stocking density according to the type of meadow. The proper management of wet meadows involves controlling the timing, duration, and intensity of grazing and varying periods of use and recovery of plant species composition [39].
Species richness, i.e., the number of species existing within a habitat, is often used as a measure of plant diversity. It was one of the most frequently measured variables in the grazing studies reviewed [40]. Almost as many studies reported increased species richness as those that reported its decline. The four-year analysis of species richness, biodiversity and species cover in the analyzed pastures confirms the results obtained in the studies above only partially. The change in species richness shows a positive correlation with time. It increases monotonically in time, very much as expected. Species richness remained stable in the first two years of grazing in Iłowiec, increased slightly in the third year of the study, and reached its highest values in the last year of grazing on wet meadows. Our results are confirmed by numerous studies of this type of plant community [41]. Although the number is not a completely reliable criterion for the association, comparing the observed divergence between the two metrics shows a complementary and reliable increase [42,43,44,45].
Usually, an increase in species richness occurred when grazing reduced the dominant species that had been excluding less competitive species [46,47]. In the pastures studied, there was no decline in cover among the typical species that usually dominate wet meadows. This seems to confirm the tendency of riparian plants to adapt and recover from natural stresses and changes in the riparian conditions and valley landforms. The adaptive characteristics of riparian plants enable them to recover from short-term grazing events and the accumulated stresses resulting from problematic grazing management. The restoration of plant health can be rapid (within a few months of the growing season), even if the plants have been weakened, provided that the physical environment has not changed the plants’ access to water [48]. Where the vegetation composition has changed, systems will recover, but a few years may be required [49]. The common reed Phragmites australis, acute sedge Carex gracilis, and tufted sedge C. elata are the dominant species in the described communities, with a high cover in the surveyed pastures. They represent a number of characteristics thanks to which they adapt well to the occupied habitats. These include the CS life strategy that is an intermediate type of strategy between competitors and stress-tolerators [50,51]. A large proportion of species exhibiting a CS strategy and generalist species, understood as being able to thrive in a variety of environmental conditions and able to utilize a wide range of resources [52], were shown, similarly to our study, in studies comparing extensively grazed and uncultivated Hungarian steppe-wetland pastures [53]. The CS strategy manifests itself in intensive vegetative growth (formation of rhizomes and/or stolons) that allows rapid regeneration after gnawing, and production of a large number of small seeds that form a sustainable seed bank. At the same time, the above-mentioned plant species are characterized by a high sensitivity to typical pasture use, i.e., grazing and mowing, as well as trampling by animals (trampling) [54,55]. Their high proportion in the sward of the studied pastures, after four years of use, indicates that extensive grazing with low stocking rates is the key factor for preserving the species structure of wet meadows. During the study, stocking rates ranged from 0.12 to 1.12 LSU ha−1. A well-chosen stocking density of grazing animals is especially important in environmentally valuable areas where moderate use allows for the protection and conservation of various types of meadow habitats [7,9,56].
The Rényi diversity profiles showed increased tendencies in Iłowiec wet meadows, thus confirming that grazing exhibits similar effects in wet grasslands all around the world [40]. These values were higher in the case of drier areas, which confirms that, due to intensive grazing, low management pressure led to an increase in diversity, which is consistent with literature data [57,58,59].
The analysis of the Ellenberg indices [29] shows another dimension of the effect of grazing on the qualitative characteristics of wet meadow vegetation (Figure 3). In the third and fourth year of grazing, the number of nitrophilous (N) species increased, which may be a result of the eutrophication of the habitat. Eutrophication can be prevented by means of extensive or rotational grazing. In the absence of grazing, plant litter is returned to the soil, and organic matter from the decomposing plant tissue accumulates in soil with a spatially homogeneous distribution. A major effect of grazing at the ecosystem level is the decoupling of carbon (C) and nitrogen (N) in plant organic matter, with C respired to the atmosphere as CO2 and CH4, and N returned to the soil via urine in patches of high concentration [60,61]. At the same time, a high proportion of heliophytes (L) and moist-habitat plants (F) was recorded in the sward of the studied meadows, which indicates the absence of adverse changes in moisture conditions in the studied patches and the absence of tree and shrub succession.
Grazing carried out in the studied wet meadow patches should provide adequate forage for the animals and their welfare. Average daily weight gains of the animals were a measure of the efficiency of the grazing conducted. In the first year of the study, when the purchased calves were introduced, despite the lowest stocking rate, the daily gains obtained by animals in the spring-autumn period ranged between 0.33 and 0.85 kg, while in 2017: between 0.6 and 1.18 kg of gain per day. The calves that were introduced in the first year of the study already gained 0.630–0.830 kg/day. On the other hand, in spring-autumn 2018, at the highest stocking rate of 1.12 LSU/ha, the daily gains varied from 0.4 to 0.9 kg. Considering the method of maintenance (pasture feeding from spring to early autumn) and the species composition of the pasture, the daily gains obtained should be considered satisfactory. A study by Bedoin and Kristensen [62], where animals were also kept outdoors all year round and the animals’ energy needs were met with roughage derived mainly from semi-natural grassland, the daily gains were 0.2–0.4 kg/day. Tate et al. [63] found that moist meadow communities are characterized by a high yield of forage. Dry meadow communities produce less forage (80% less than moist and 73% less than wet meadow communities). According to these authors, the weight gains of cattle grazing on wet meadows varied during the season between 0.57 and 0.83 kg, 0.72 and 0.84 kg on wet meadows and 0.43 and 0.79 kg on dry meadows. Other studies also confirm higher yields from wet meadows [6]. On the other hand, dry meadows are characterized by a large diversity of plant species [56]. Pasture productivity is undoubtedly affected by weather conditions. Among the most important are the amount of precipitation and temperature [64,65]. Analyzing the moisture and thermal conditions during the present study, it was determined that they were not favorable for the forage productivity of the wet meadows under study (Table 1 and Table 2). Considering the temperature, the seasons of 2016 and 2017 were defined as very dry and 2018 and 2019 as dry. The hydrothermal index (K), calculated for the growing season (April–October), showed that the period under study was extremely dry. The driest year was 2018, with an average value of K = 0.96, and the months of June and August, when the average value was K = 0.79 (Table 2). This negatively affected the coverage of the dominant forage species and the biodiversity of the grasslands (Figure 1). At the same time, it negated the negative impact of trampling during grazing. Trampling is one of the negative effects of grazing on wet meadows [66].

5. Conclusions

The summer grazing of white-backed cattle on wet meadows led to some changes in the species composition. Extensive grazing (0.12–1.12 LSU ha−1) resulted in the decreased cover of typical dominant species of rush meadows such as the common reed, the acute sedge (Carex acuta), or the tufted sedge (Carex elata). The percentage share did not change significantly, but some gaps emerged thanks to the reduced cover of the species that predominated in terms of cover and size. These gaps were filled by other plant species, particularly meadow plants, which led to increased plant diversity. During the four years of grazing, the cattle obtained satisfactory weight gains, particularly in the last year of the study, which indicates that wet meadows are suitable for grazing and can provide sufficient feed for cattle.

Supplementary Materials

The following supporting information can be downloaded at: https://www.mdpi.com/article/10.3390/agriculture13020261/s1, Table S1: Factor loadings of PCA based on analysis according to species cover; Table S2: Summary statistics (mean and standard deviation) of plant species cover by year; Table S3: Summary statistics (mean and standard deviation) of phytosociological relevés characteristics by year; Table S4: Factor loadings of PCA based on analysis according to Ellenberg ecological indices.

Author Contributions

Conceptualization, M.K. and W.C.; methodology, M.K.; software, A.B.; Validation, M.K., A.B., P.Ż. and A.R.; formal analysis, A.B. and M.K.; investigation, M.K., P.Ż. and A.R.; resources, W.C., M.K., A.B., P.Ż. and A.R.; data curation, M.K. and A.B.; writing—original draft preparation, M.K., A.R. and P.Ż.; writing—review & editing, A.R. and M.K.; visualization, A.R., A.B. and M.K.; supervision, M.K.; project administration, M.K. and W.C.; funding acquisition, M.K. and W.C. All authors have read and agreed to the published version of the manuscript.

Funding

This research was supported by the “Uses and conservation of farm animal genetic resources under sustainable development” project co-financed by the National Centre for Research and Development in Poland within the framework of the strategic R&D program “Environment, agriculture and forestry” BIOSTRATEG, contract number: BIOSTRATEG2/297267/14/NCBR/2016. Publication co-financed by the Ministry of Science and Higher Education under the agreement No. DKN/SP/546699/2022.

Institutional Review Board Statement

Not applicable.

Informed Consent Statement

Not applicable.

Data Availability Statement

The data presented in this study are available on request from the corresponding author.

Conflicts of Interest

The authors declare no conflict of interest.

References

  1. Allen-Diaz, B.; Jackson, R.D.; Bartolome, J.W.; Tate, K.W.; Oates, L.G. Long-term grazing study in spring-fed wetlands reveals management tradeoffs. Calif. Agric. 2004, 583, 144–148. [Google Scholar]
  2. Kulik, M.; Bochniak, A.; Baryła, R.; Warda, M.; Wyłupek, T. Changes of the Phragmitetea Class Vegetation in the Bystra Valley, Eastern Poland. Rocz. Ochr. Sr. 2018, 20, 1049–1065. [Google Scholar]
  3. Oles, K.M.; Weixelman, D.A.; Lile, D.F.; Tate, K.W.; Snell, L.K.; Roche, L.M. Riparian Meadow Response to Modern Conservation Grazing Management. Environ. Manag. 2017, 60, 383–395. [Google Scholar] [CrossRef] [PubMed] [Green Version]
  4. Marty, J.T. Effects of cattle grazing on diversity in ephemeral wetlands. Conserv. Biol. 2005, 195, 1626–1632. [Google Scholar]
  5. Vera, P.; Belda, E.J.; Kvist, L.; Encabo, S.I.; Monros, J.S. Habitat preference of endangered Eastern Iberian Reed Buntings Emberiza schoeniclus witherbyi. Bird Study 2011, 58, 238–247. [Google Scholar] [CrossRef]
  6. Wyłupek, T.; Klikocka, H.; Kulik, M.; Lipińska, H.; Gawryluk, A. Floristic diversity and use value of phytocoenoses in a section of the Wieprz river valley in Roztocze National Park for feeding the konik polski horse. Agron. Sci. 2018, 744, 123–134. [Google Scholar] [CrossRef]
  7. Chabuz, W.; Kulik, M.; Sawicka-Zugaj, W.; Żółkiewski, P.; Warda, M.; Pluta, M.; Lipiec, A.; Bochniak, A.; Zdulski, J. Impact of the type of use of permanent grasslands areas in mountainous regions on the floristic diversity of habitats and animal welfare. Glob. Ecol. Conserv. 2019, 19, e00629. [Google Scholar] [CrossRef]
  8. Kulik, M.; Warda, M.; Gawryluk, A.; Bochniak, A.; Patkowski, K.; Lipiec, A.; Gruszecki, T.M.; Pluta, M.; Bielińska, E.; Futa, B. Grazing of native livestock breeds as a method of grassland protection in Roztocze National Park, Eastern Poland. J. Ecol. Eng. 2020, 213, 61–69. [Google Scholar]
  9. Rysiak, A.; Chabuz, W.; Sawicka-Zugaj, W.; Zdulski, J.; Grzywaczewski, G.; Kulik, M. Comparative impacts of grazing and mowing on the floristics of grasslands in the buffer zone of Polesie National Park; eastern Poland. Glob. Ecol. Conserv. 2021, 27, e01612. [Google Scholar] [CrossRef]
  10. Belsky, A.J.; Matzke, A.; Uselman, S. Survey of livestock influences on stream and riparian ecosystems in the western United States. J. Soil Water Conserv. 1999, 54, 419–431. [Google Scholar]
  11. Kulik, M. Changes of biodiversity and species composition of Molinia meadow depending on use method. Pol. J. Environ. Stud. 2014, 233, 773–782. [Google Scholar]
  12. Myers, L.; Kane, J. The impact of summer cattle grazing on surface water quality in high elevation mountain meadows. Water Qual. Expo. Health 2011, 31, 51–62. [Google Scholar] [CrossRef]
  13. Long, J.W.; Pope, K. Wet meadows. In Science Synthesis to Support Socioecological Resilience in the Sierra Nevada and Southern Cascade Range; Long, J.W., Quinn-Davidson, L., Skinner, C.N., Eds.; USDA Forest Service, U.S. Department of Agriculture, Pacific Southwest Research Station: Albany, CA, USA, 2014; Chapter 6.3; pp. 341–372. [Google Scholar]
  14. Burton, E.C.; Gray, M.J.; Schmutzer, A.C.; Miller, D.L. Differential responses of postmetamorphic amphibians to cattle grazing in wetlands. J. Wildl. Manag. 2009, 732, 269–277. [Google Scholar] [CrossRef]
  15. Kaszewski, B.M. Climatic Conditions in Lublin Region; Wydawnictwo UMCS: Lublin, Poland, 2008; p. 76. [Google Scholar]
  16. Skowera, B.; Puła, J. Extreme pluviothermic conditions in the spring period in the area of Poland in 1971–2000. Acta Agrophys. 2004, 31, 171–177. [Google Scholar]
  17. Chmist-Sikorska, J.; Kępińska-Kasprzak, M.; Struzik, P. Agricultural drought assessment on the base of Hydro-thermal Coefficient of Selyaninov in Poland. Ital. J. Agrometeorol. 2022, 1, 3–12. [Google Scholar] [CrossRef]
  18. Eurostat. Glossary, Livestock Unit LSU. 2020. Available online: https://ec.europa.eu/eurostat/statistics-explained/index.php/Glossary,Livestock_unit_LSU (accessed on 15 June 2020).
  19. Braun-Blanquet, J. Plant Sociology. The Study of Plant Communities, 3rd ed.; Springer Publishing: New York, NY, USA, 1964; p. 631. [Google Scholar]
  20. Mirek, Z.; Piękoś-Mirkowa, H.; Zając, A.; Zając, M. Flowering Plants and Pteridophytes of Poland—A Checklist; W. Szafer Institute of Botany, Polish Academy of Sciences: Kraków, Poland, 2002; p. 442. [Google Scholar]
  21. Matuszkiewicz, W. Polish Plant Communities Guidebook; Polish Scientific Publishers: Warsaw, Poland, 2008; p. 536. [Google Scholar]
  22. Mucina, L.; Bültmann, H.; Dierßen, K.; Theurillat, J.P.; Raus, T.; Čarni, A.; Šumberová, K.; Willner, W.; Dengler, J.; García, R.G.; et al. Vegetation of Europe; hierarchical floristic classification system of vascular plant; bryophyte; lichen; and algal communities. App. Veg. Sci. 2016, 19 (Suppl. 1), 3–264. [Google Scholar] [CrossRef]
  23. Novák, J. Evaluation of grassland quality. Ekol. Bratisl. 2004, 232, 127–143. [Google Scholar]
  24. Zar, J.H. Biostatistical Analysis, 5th ed.; Pearson Prentice Hall: Upper Saddle River, NY, USA, 2010; p. 255. [Google Scholar]
  25. Kindt, R.; Van Damme, P.; Simons, A.J. Tree diversity in western Kenya, using profiles to characterise richness and evenness. Biodivers. Conserv. 2006, 154, 1253–1270. [Google Scholar] [CrossRef]
  26. Avila, M.R.; Nabinger, C.; Schneider-Canny, R.; Fedrigo, J.K. Botanical composition of a natural rangeland over seeded with annual ryegrass under N fertilization. Sci. Agropecu. 2019, 102, 303–305. [Google Scholar] [CrossRef] [Green Version]
  27. Samuel, D.; Derero, A.; Kebebew, Z.; Hadgu, K.M. Tree species diversity and spatial distribution patterns on agricultural landscapes in sub-humid Oromia; Ethiopia. Agrofor. Syst. 2019, 933, 1015–1029. [Google Scholar] [CrossRef]
  28. Jolliffe, I.T. Principal Component Analysis, 2nd ed.; Springer: New York, NY, USA, 2002; pp. 338–372. [Google Scholar]
  29. Ellenberg, H.; Düll, R.; Wirth, V.; Werner, W.; Paulißen, D. Zeigerwerte von Pflanzen in Mitteleuropa, 2nd ed.; Verlag Erich Goltze KG: Göttingen, Germany, 1991; p. 197. [Google Scholar]
  30. Czarnecka, B.; Chabudziński, Ł. Assessment of flora diversity in a minor river valley using ecological indicator values, Geographical Information Systems and Digital Elevation Models. Cent. Eur. J. Biol. 2014, 9, 220–231. [Google Scholar] [CrossRef] [Green Version]
  31. R Core Team. R, A Language and Environment for Statistical Computing; R Foundation for Statistical Computing: Vienna, Austria, 2019; Available online: https://www.R-project.org/ (accessed on 1 January 2022).
  32. Oksanen, J.; Blanchet, F.G.; Friendly, M.; Kindt, R.; Legendre, P.; McGlinn, D.; Minchin, P.R.; O’Hara, R.B.; Simpson, G.L.; Solymos, P.; et al. Package Vegan: Community Ecology Package. R Package Version 4.2.2. 2019. Available online: http://CRAN.Rproject.org/package=vegan (accessed on 1 January 2022).
  33. Acreman, M.; Holden, J. How wetlands affect floods. Wetlands 2013, 33, 773–786. [Google Scholar] [CrossRef] [Green Version]
  34. Hatfield, R.G.; LeBuhn, G. Patch and landscape factors shape community assemblage of bumble bees, Bombus spp. Hymenoptera, Apidae, in montane meadows. Biol. Conserv. 2007, 139, 150–158. [Google Scholar] [CrossRef]
  35. Norton, J.B.; Jungst, L.J.; Norton, U.; Olsen, H.R.; Tate, K.W.; Horwath, W.R. Soil carbon and nitrogen storage in upper montane riparian meadows. Ecosystems 2011, 14, 1217–1231. [Google Scholar] [CrossRef]
  36. Roche, L.M.; Latimer, A.M.; Eastburn, D.J.; Tate, K.W. Cattle grazing and conservation of a meadow-dependent amphibian species in the Sierra Nevada. PLoS ONE 2012, 7, e35734. [Google Scholar] [CrossRef] [PubMed] [Green Version]
  37. Davy, J.S.; Roche, L.M.; Robertson, A.V.; Nay, D.E.; Tate, K.W. Introducing cattle grazing to a noxious weed-dominated rangeland shifts plant communities. Calif. Agric. 2015, 69, 230–236. [Google Scholar] [CrossRef] [Green Version]
  38. Matejkova, I.; Van Diggelen, R.; Prach, K. An attempt to restore a central European species-rich mountain grassland through grazing. Appl. Veg. Sci. 2003, 6, 161–168. [Google Scholar] [CrossRef]
  39. Swanson, S.; Wyman, S.; Evans, C. Practical Grazing Management to Maintain or Restore Riparian Functions and Values on Rangelands. J. Rangel. Appl. 2015, 2, 1–28. [Google Scholar]
  40. Kiss, T.; Lévai, P.; Ferencz, Á.; Szentes, S.; Hufnagel, L.; Nagy, A.; Balogh, Á.; Pintér, O.; Saláta, D.; Házi, J.; et al. Change of composition and diversity of species and grassland management between different grazing intensity in pannonian dry and wet grasslands. App. Ecol. Environ. Res. 2011, 93, 197–230. [Google Scholar] [CrossRef]
  41. Kampmann, D.; Herzog, F.; Jeanneret, P.; Konold, W.; Peter, M.; Walter, T.; Wildi, O.; Lüscher, A. Mountain grassland bio diversity, Impact of site conditions versus management type. J. Nat. Conserv. 2007, 161, 12–25. [Google Scholar]
  42. Virágh, K.; Bartha, S. The effect of current dynamical state of a loess steppe community on its responses to disturbances. Tiscia 1996, 30, 3–13. [Google Scholar]
  43. Luoto, M.; Pykälä, J.; Kuussaari, M. Decline of landscape-scale habitat and species diversity after the end of cattle grazing. J. Nat. Conserv. 2003, 11, 171–178. [Google Scholar] [CrossRef]
  44. Pykälä, J. Plant species responses to cattle grazing in mesic semi-natural grassland. Agric. Ecosyst. Environ. 2005, 108, 109–117. [Google Scholar] [CrossRef]
  45. Házi, J.; Bartha, S.; Szentes, S.; Wichmann, B.; Penksza, K. Seminatural grassland management by mowing of Calamagrostis epigejos in Hungary. Plant Biosyst. 2011, 1453, 699–707. [Google Scholar] [CrossRef]
  46. Bullock, J.M.; Pakeman, R.J. Grazing of lowland heath in England, Management methods and their effects on healthland vegetation. Biol. Conserv. 1997, 79, 1–13. [Google Scholar] [CrossRef]
  47. Jutila, H. Effect of grazing on the vegetation of shore meadows along the Bothnian Sea, Finland. Plant Ecol. 1999, 140, 77–88. [Google Scholar] [CrossRef]
  48. Baker, B.W.; Peinetti, H.R.; Coughenour, M.B. Resilience of willow stems after release from intense elk browsing. Rangel. Ecol. Manag. 2005, 586, 575–581. [Google Scholar] [CrossRef]
  49. Stringham, T.K.; Krueger, W.C.; Thomas, D.R. Application of non-equilibrium ecology to rangeland riparian zones. J. Range Manag. 2001, 543, 210–217. [Google Scholar] [CrossRef]
  50. Grime, J.P. Evidence for the existence of three primary strategies in plants and its relevance to ecological and evolutionary theory. Am. Nat. 1977, 111, 1169–1194. [Google Scholar] [CrossRef]
  51. Grime, J.P. Plant Strategies, Vegetation Processes and Ecosystem Properties, 2nd ed.; Wiley: Chichester, UK, 2001; p. 417. [Google Scholar]
  52. Ali, J.G.; Agrawal, A.A. Specialist versus generalist insect herbivores and plant defense. Trends Plant Sci. 2012, 175, 293–302. [Google Scholar] [CrossRef]
  53. Tölgyesi, C.; Bátori, Z.; Erdős, L.; Gallé, R.; Körmöczi, L. Plant diversity patterns of a Hungarian steppe-wetland mosaic in relation to grazing regime and land use history. Tuexenia 2013, 35, 399–416. [Google Scholar]
  54. BiolFlor, Version 1.1. Search and information system on vascular plants in Germany. Available online: http://www.ufz.de/biolflor/ (accessed on 1 January 2022).
  55. Kleyer, M.; Bekker, R.M.; Knevel, I.C.; Bakker, J.P.; Thompson, K.; Sonnenschein, M.; Poschlod, P.; Van Groenendael, J.M.; Klimes, L.; Klimesová, J.; et al. The LEDA Traitbase, A database of life-history traits of Northwest European flora. J. Ecol. 2008, 96, 1266–1274. [Google Scholar] [CrossRef]
  56. Kulik, M.; Warda, M.; Bochniak, A.; Stamirowska-Krzaczek, E.; Turos, P.; Dąbrowska-Zielińska, K.; Bzowska-Bakalarz, M.; Bieganowski, A.; Trendak, M. The species diversity of grasslands in the Middle Wieprz Valley PLH060005 depending on meadow type and mowing frequency. Rocz. Ochr. Sr. 2019, 21, 543–555. [Google Scholar]
  57. Jastrzębska, M.; Jastrzębski, W.P.; Hołdyński, C.; Kostrzewska, M.K. Weed species diversity in organic and integrated farming systems. Acta Agrobot. 2013, 66, 113–124. [Google Scholar] [CrossRef] [Green Version]
  58. Bakker, J.P. Nature Management by Grazing and Cutting: On the Ecological Significance of Grazing and Cutting Regimes Applied to Restore Former Species-Rich Grassland Communities in the Netherlands; Kluwer Academic Publishers: Dordrecht, The Netherlands, 1989; p. 400. [Google Scholar]
  59. Nösberger, J.; Messerli, M.; Carlen, C. Biodiversity in grassland. Ann. Zootech. 1998, 47, 383–393. [Google Scholar] [CrossRef]
  60. Parsons, A.J.; Rowarth, J.; Thornley, J.; Newton, P. Primary production of grasslands, herbage accumulation and use, and impacts of climate change. In Grassland Productivity and Ecosystem Services; Lemaire, G., Hodgson, J., Chabbi, A., Eds.; CAB International: Wallingford, UK, 2011; pp. 3–18. [Google Scholar]
  61. Soussana, J.F.; Lemaire, G. Coupling carbon and nitrogen cycles for environmentally sustainable intensification of grasslands and crop-livestock systems. Agric. Ecosyst. Environ. 2014, 1901, 9–17. [Google Scholar] [CrossRef]
  62. Bedoin, F.; Kristensen, T. Sustainability of grassland-based beef production—Case studies of Danish suckler farms. Livest. Sci. 2013, 158, 189–198. [Google Scholar] [CrossRef]
  63. Tate, K.; Roche, L.; Lile, D.; George, H. Forage and Cattle Response to Sierra Meadow Restoration; University of California Cooperative Extensionl: Davis, CA, USA, 2011; Available online: https://s3.amazonaws.com/american-rivers-website/wp-content/uploads/2016/06/21173418/5-Forage-Model.pdf (accessed on 1 January 2022).
  64. Ludewig, K.; Donath, T.W.; Zelle, B.; Eckstein, R.L.; Mosner, E.; Otte, A.; Jensen, K. Effects of Reduced Summer Precipitation on Productivity and Forage Quality of Floodplain Meadows at the Elbe and the Rhine River. PLoS ONE 2015, 10, e0124140. [Google Scholar] [CrossRef]
  65. Yuan, Z.; Wang, Y.; Xu, J.; Wu, Z. Effects of climatic factors on the net primary productivity in the source region of Yangtze River, China. Sci. Rep. 2021, 11, 1376. [Google Scholar] [CrossRef]
  66. Teuber, L.M.; Hölzel, N.; Fraser, L.H. Livestock grazing in intermountain depressional wetlands—Effects on plant strategies, soil characteristics and biomass. Agric. Ecosyst. Environ. 2013, 175, 21–28. [Google Scholar] [CrossRef]
Figure 1. The results of a one-way analysis of variance (ANOVA) for the total number of species. Different letters indicate significant differences (p = 0.05).
Agriculture 13 00261 g001
Figure 2. The PCA analysis scaled scatter plot of phytosociological relevés according to cover abundance of the characteristic species. Black solid vectors show the contribution of the individual species in the values of the principal components, while the orange dotted line vectors represent the trend of changes in the species cover for the particular phytosociological relevés in 2016–2019.
Agriculture 13 00261 g002
Figure 3. The PCA analysis scaled scatter plot of phytosociological relevés by Ellenberg ecological indices where: L—light, T—temperature, K—continentality, F—moisture, R—water/soil pH, N—nitrogen content. Black solid vectors show the contribution of the individual indices in the values of the principal components, while the orange dotted line vectors represent the trend of changes in indices for the particular phytosociological relevés in 2016–2019.
Agriculture 13 00261 g003
Figure 4. Rényi diversity profiles (Hα) for patches in the successive years of the study.
Agriculture 13 00261 g004
Figure 5. The results of a one-way ANOVA for evaluation of grassland quality (EGQ) formula. Different letters indicate significant statistical differences (p = 0.05).
Agriculture 13 00261 g005
Table 1. Values of basic meteorological conditions (temperature and precipitation) for the months and years during the study period 2016–2019. Data are reported by weather station no. 125,950 (Zamość N 50°7′, E 23°25′, altitude: 213 m a.s.l.).
Average Air Temperature (°C)
Month
2016201720182019
Jan−3.9−5.7−0.2−3.5
Feb3.3−1.6−4.32.1
Mar3.55.8−15
Apr9.57.713.19.4
May14.113.516.412.7
June18.317.91820.9
July19.318.319.818.4
Aug18.219.720.119.6
Sept15.113.715.714.3
Oct6.89.29.710.8
Nov2.63.84.56.3
Dec−0.21.80.32.6
Year average8.98.89.59.9
Total rainfall and/or snowmelt (mm)
Month
2016201720182019
Jan27.174.8212.6922.86
Feb26.420.0525.9112.95
Mar40.6432.7624.1227.94
Apr79.7531.2535.5745.72
May84.5858.9949.79109.72
June46.9950.2951.5823.62
July85.8687.12111.9953.33
Aug45.7125.1531.2379.49
Sept13.71123.4519.0519.56
Oct92.4688.1428.9726.4
Nov53.5828.719.1351.56
Dec35.336.3339.1152.32
Sum632.15587.06439.14525.47
Table 2. Values and classes of the Selyaninov hydrothermal index (K) for the vegetative seasons during the study years. See above for explanations of the abbreviations.
K Index Values K Index Classes by [16]
Year Year
20162017201820192016201720182019
Month Month
Jan Jan
Feb Feb
Mar Mar
Apr2.81.350.911.62Aprvwodqw
May21.461.012.88Mayqwoqdvw
June0.860.940.960.38Junedddexd
July1.481.591.890.97Julyooqwd
Aug0.840.430.521.35Augdvdvdo
Sept0.330.40.46Septexdvwexdvd
Oct4.533.1910.81Octexwexwdd
Nov Nov
Dec Dec
Table 3. Animal stocking rate in each year of the study. LSU (livestock unit): cattle under one year old = 0.4 LSU; from 1 to less than 2 years old = 0.7 LSU; male cattle 2 years old and over = 1.0 LSU.
Year2016201720182019
Livestock (pcs.)15433828
LSU6.021.754.328.0
Stocking rate LSU ha−10.120.451.120.58
Disclaimer/Publisher’s Note: The statements, opinions and data contained in all publications are solely those of the individual author(s) and contributor(s) and not of MDPI and/or the editor(s). MDPI and/or the editor(s) disclaim responsibility for any injury to people or property resulting from any ideas, methods, instructions or products referred to in the content.

