Article

Long-Term Impact of Boron Addition at Various Dosages to a Groundnut-Cabbage System on Crop Yield and Boron Dynamics in Typic Haplustepts

1
Micronutrient Research Centre (ICAR), Anand Agricultural University, Anand 388 110, Gujarat, India
2
ICAR—Indian Institute of Soil Science, Bhopal 462 038, Madhya Pradesh, India
3
College of Agriculture, Vaso, Anand Agricultural University, Anand 388 110, Gujarat, India
*
Author to whom correspondence should be addressed.
Agriculture 2023, 13(2), 248; https://doi.org/10.3390/agriculture13020248
Submission received: 31 December 2022 / Revised: 14 January 2023 / Accepted: 18 January 2023 / Published: 19 January 2023
(This article belongs to the Special Issue Advances in Nutrient Management in Soil-Plant System)

Abstract

:
The addition of boron (B) fertilizers to soils with low B content is required for augmenting crop yield. Therefore, it is imperative to have knowledge about the impact of long-term B addition at various dosages on crop yield and soil-B dynamics. A field experiment of a 6-year duration was carried out at Anand Agricultural University, Gujarat, India to study the influence of long-term B fertilization in the groundnut (Arachis hypogaea L.)-cabbage (Brassica oleracea var. capitata) cropping system in different rates and frequencies on yield of crops and soil-B dynamics. The direct effect of B addition on groundnut yield and the residual effect on succeeding cabbage crop yield was eval-uated. The treatments of the experiment encompassed various combinations of three frequencies and four rates of B application including one control (no B application). The application of B at different rates and frequencies significantly increased groundnut and cabbage yield in comparison to yield attained under the control. The addition of 1.0 kg B ha−1 in alternate years was found op-timum for enhancing the yield of groundnut and cabbage crops grown on study soil. Boron appli-cation enhanced B content in groundnut pod, haulm, cabbage and available B in soil. Optimal available B content in soil was 1.25 mg kg−1 for both groundnut pod and cabbage-head yield. The application of B with different rates and frequencies significantly enhanced B fractions in soil. The content of different fractions improved with the increase in rates of B application. The percentage contribution of various B fractions towards total B content followed the order: readily soluble B (0.43 to 0.55%) < specifically adsorbed B (0.74 to 0.98%) < organically bound B (0.70 to 1.55%) < ox-ide bound B (1.26 to 3.11%) < residual boron B (93 to 96.8%). Path analysis revealed the highest contribution of total boron towards groundnut-pod yield with a coefficient value of 4.30. Whereas oxide-bound boron fraction contributed to the maximum extent with a coefficient value of 0.91 towards cabbage-head yield. This information will be useful for B management in the ground-nut-cabbage cropping system grown on studied soil.

1. Introduction

Crop plants need micronutrients, otherwise known as trace elements, in lesser quantities to grow and develop [1,2]. Boron (B) is a non-metal micronutrient required by plants for normal growth. It plays important roles in plant metabolic activities, such as phenol and indole acetic acid metabolism, respiration, cell wall synthesis, sugar transport, cell wall structure integrity, lignification and ribose nucleic acid (RNA) and carbohydrate metabolism [1,3]. Boron plays pivotal roles in flowering and fertilization processes. It also helps boost crop yield and the quality of crop produce. Boron is comparatively less mobile within the plant which warrants its availability at different plant growth stages.
Crop plants primarily take B up from soil through roots. The deficiency of B in soil and inadequate B supply to plants adversely impacts crop yield [4]. The deficiency of B was reported in soils and crops in various countries [5,6,7]. After zinc, B is the most important deficient micronutrient in agricultural soils in India. As per the latest estimation by Shukla et al. [8], B deficiency, on average, prevailed in 23.2% of soils in India. Boron deficiency exists in diverse levels in various states. States such as Kerala, Gujarat, Odisha and West Bengal had B deficiency in relatively higher percent soils. The higher levels of B deficiency exist in calcareous, leached sandy, limed acidic and lateritic soils [9]. The deficiency of B is normally managed by either soil or foliar or both soil and foliar addition of B fertilizer. The addition of 0.5 to 2.50 kg B ha−1 to soil every year or alternate years is suggested to manage B deficiency in different soil-crop situations in India [10]. There are reports of varied levels of responses by cereal, oil seed, pulse and vegetable crops to B application [11,12,13,14]. However, the extent of crop responses varies with crop types, crop varieties and soil types. Further, the addition of B at higher dosages leads to residual effects on two to four succeeding crops due to low-use efficiency and less leaching in fine textured soils. An extremely low range between deficiency and toxicity of B requires careful adjustment of B dosage for each application [15]. Therefore, it is imperative to standardize B application dosage for important crops/cropping systems of the world and to find out optimum soil-B availability for higher crop yields.
Boron in soil is present in five different fractions. The fractions of B are readily soluble (solution and non-specifically adsorbed) (RS-B), specifically adsorbed (SA-B), oxide bound (Ox-B), organically bound (Or-B) and residual or occluded B (Res-B) [16,17]. The relative contents of these fractions in soils vary with climatic conditions, nature of soil and soil-crop managements [18,19]. In soils from the Indo-Gangetic plains (IGP) of India, Res-B comprised ∼89% of the total B (TB), followed by Ox-B, Or-B, SA-B and RS-B [20]. These fractions may directly or indirectly contribute towards soil-B availability, crop yield and crop-B uptake. The applied B to soil is converted into different factions and the extent and type of conversions depend upon environmental conditions, soil types and crops [14,21]. Therefore, it is important to have information about the B fractions in soil under various soil-crop scenarios with B addition for a longer period in order to gain a clear insight about soil-B availability and crop-B uptake. From a 2-year field experiment, Bhupenchandra et al. [22] recorded that the addition of 2 kg B ha−1 significantly improved crop yield in a cauliflower-cowpea-okra system. They also recorded a maximum contribution of Ox-B towards cauliflower yield, Rs-B towards cowpea yield and Or-B towards okra yield. Das et al. [20] reported a higher mobilization of Res-B to available (readily soluble and specifically adsorbed B) and potentially available (oxide bound and organically-bound B) B fractions by rice-based cropping systems compared to that in non-rice-based systems in Indian IGP.
There is limited knowledge regarding the best dosages of B addition for various crops and cropping systems in India. This necessitates the requirement for generating this knowledge by conducting appropriate studies for creating awareness about the correct dosage of B addition among the farmers. Therefore, it was hypothesized that B addition at different dosages influence crop yield in each cropping system. Further, long-term B addition at various dosages influence soil-B fractions. Since groundnut (Arachis hypogaea L.) (an oil seed crop) and cabbage (Brassica oleracea var. capitata) (a vegetable crop) are the important crops of the country, the present investigation was undertaken (i) to find out the influence of different dosages of B on crop yield, and (ii) to assess the influence of B application at various rates and frequencies on available B and different B fractions in Typic Haplustepts soils under a groundnut-cabbage cropping system.

2. Materials and Methods

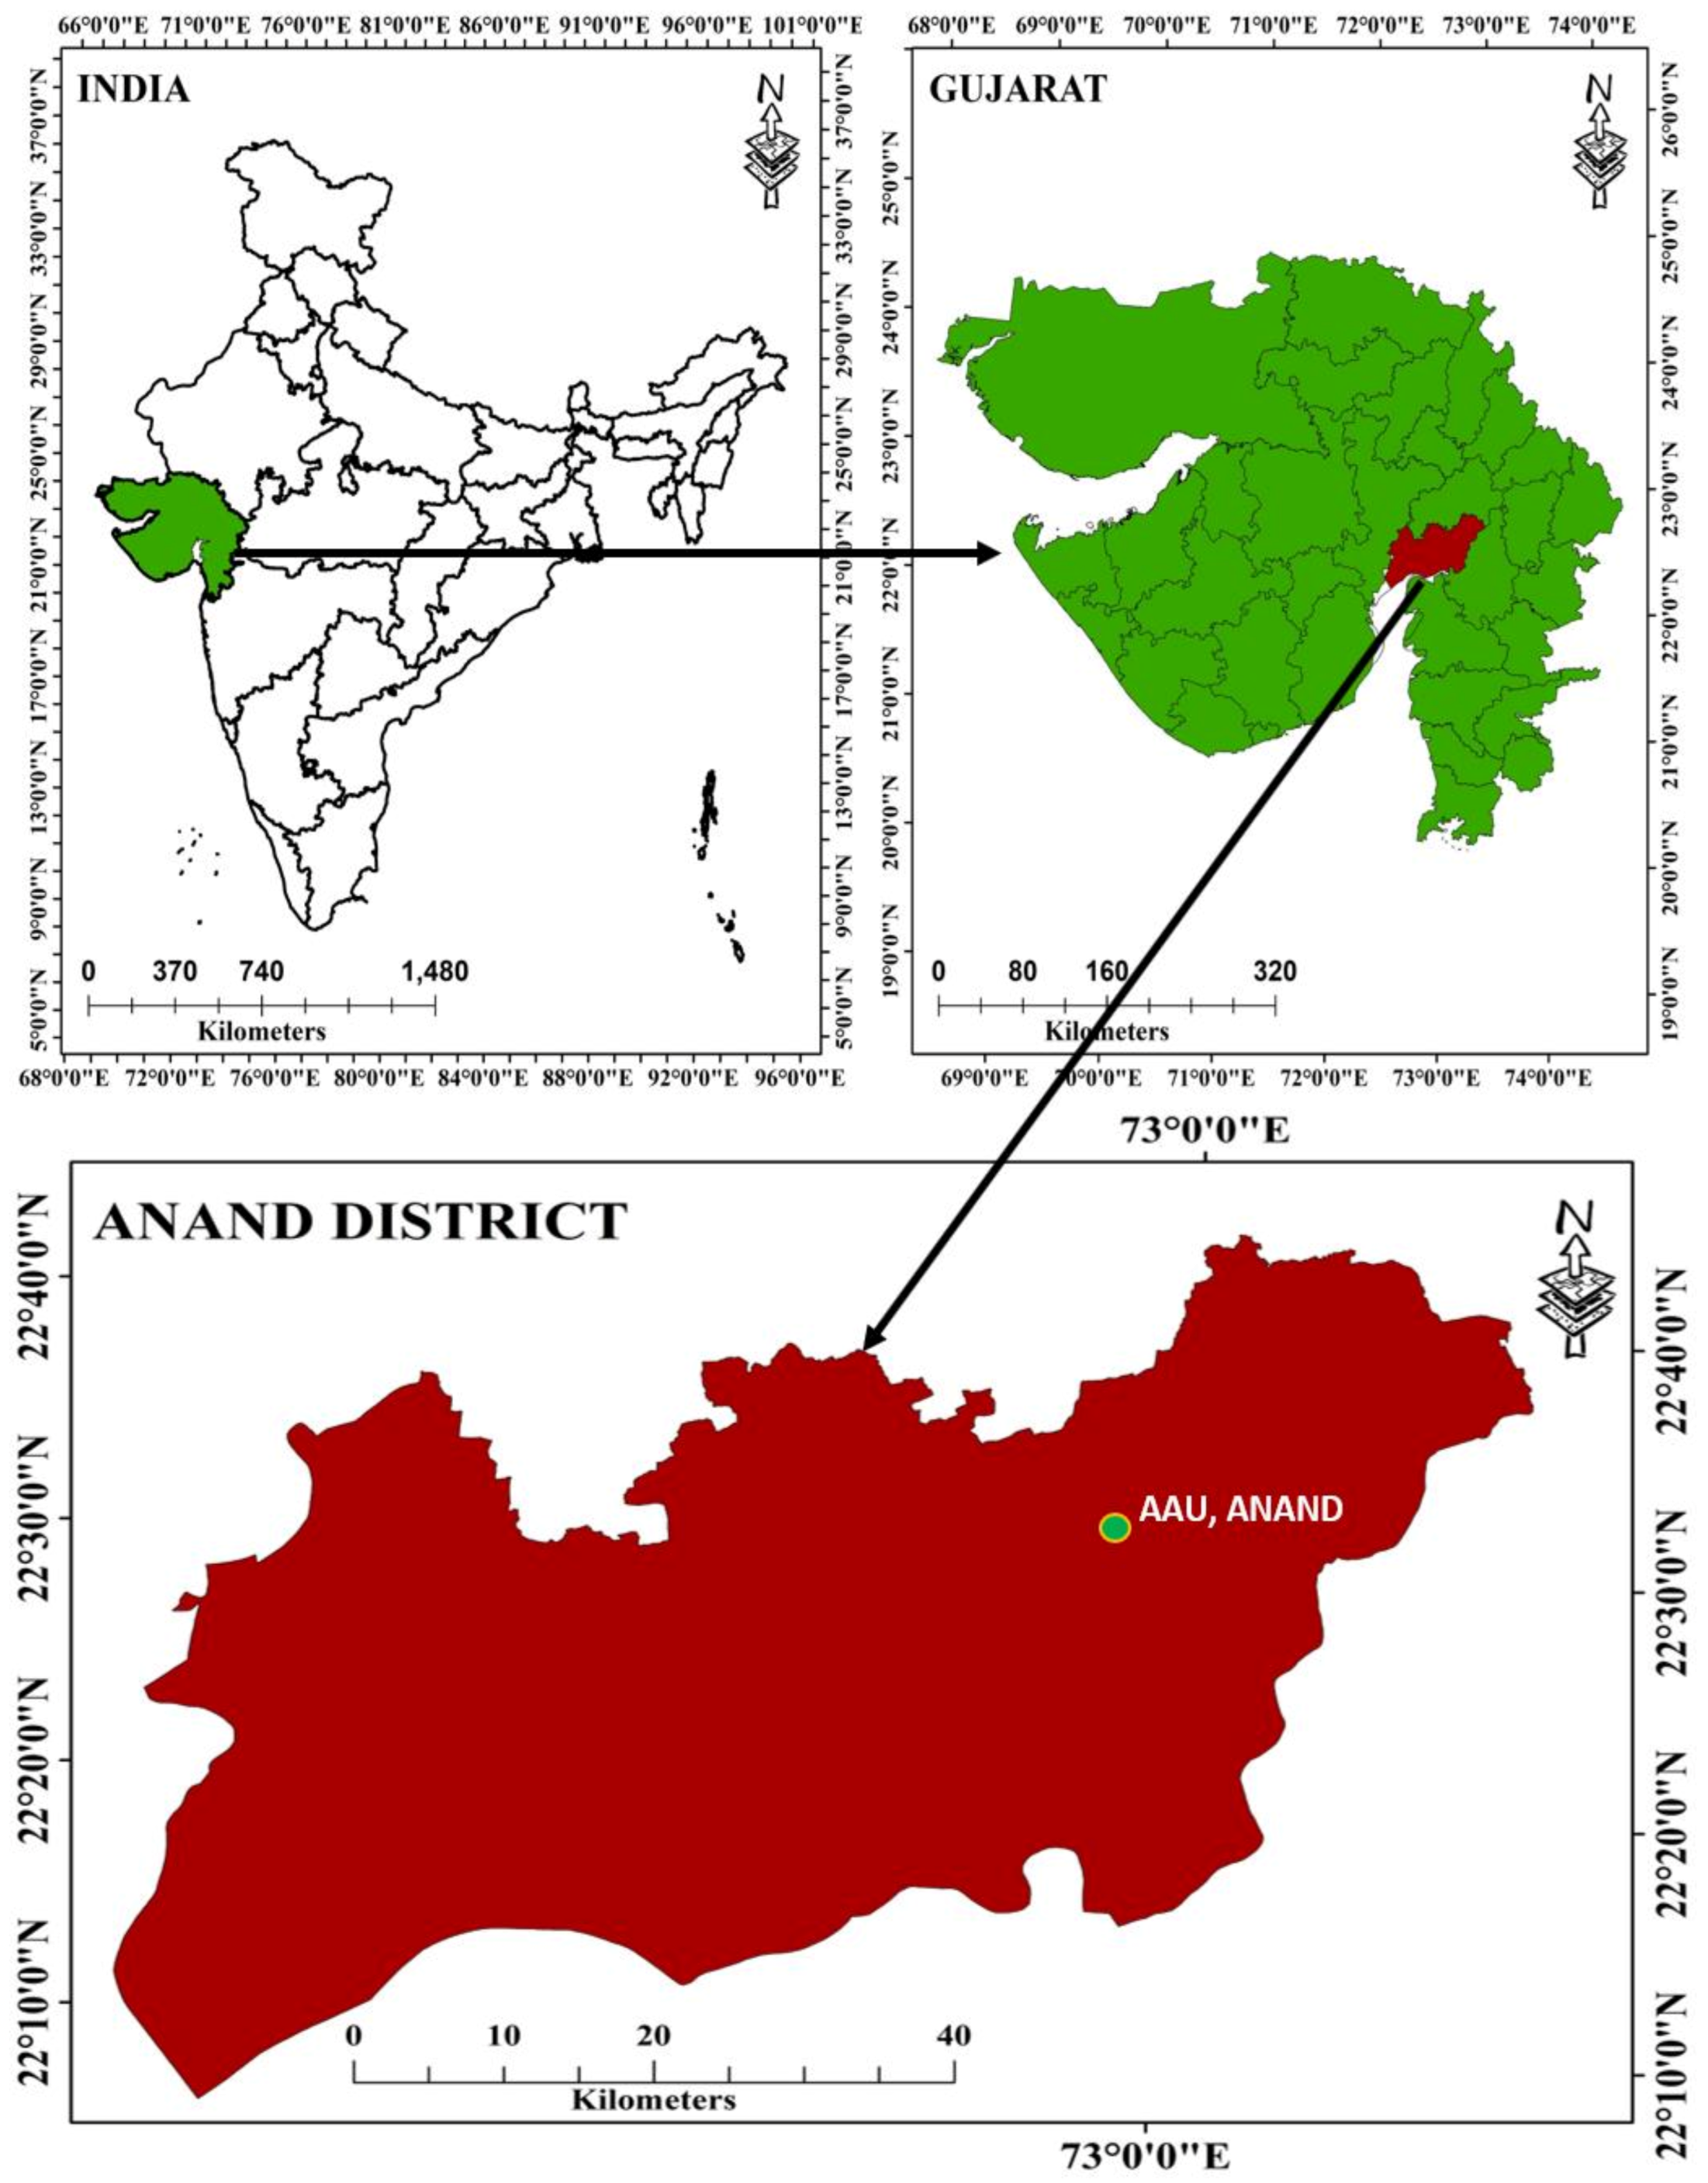
2.1. Deratils of Experimental Area

A 6-year-long field experiment was undertaken during 2014–2015 to 2019–2020 at experimental farm of Anand Agricultural University (AAU), Gujarat, India (Figure 1). The experimental area is located at 22°35′ N latitude, 72°55′ E longitude, and at an altitude of 45.1 m above mean sea level (amsl). The experimental area has semi-arid and sub-tropical climate. The mean minimum, maximum and average temperature of the area ranged from 19 to 21 °C, 33 to 34 °C and 26 to 28 °C, respectively, during study period (Figure 2). The area receives average rainfall of 590 to 1100 mm (predominantly during June to September) and experiences average relative humidity ranging from 60 to 68% (Figure 2). The soil at experimental site was very deep, well drained, and having gently slope and is classified as Typic Haplustepts [23]. Soil texture was sandy loam (78.2% sand, 14.2% silt, 6.9% clay) in nature. The experimental soil had soil pH 7.5 (1:2.5 w/v in water) [24], EC 0.14 dS m−1 [24] and 3.5 g kg−1 organic carbon content [25]. The contents of available P [26] and available K [27] were 51 and 380 kg ha−1, respectively. The contents of 0.15% CaCl2 extractable S [28], DTPA extractable Fe, Mn, Zn, and Cu [29] were 15.2, 10.3, 13.1, 0.83 and 1.17 mg kg−1 soil, respectively. The available B (hot water-soluble) [30] content in soil was 0.65 mg kg−1.

2.2. Details of Experiment

The study was carried out with a groundnut (cv. TG-37)-cabbage (cv. Golden acre) annual cropping system to investigate the direct and residual effect of B addition on groundnut and cabbage crop. The experiment was carried out in the same layout with each plot size of 5.0 × 3.6 m2, with randomized block design having 3 replications. The treatments were combinations of 3 different frequencies and 4 different rates of B addition. The three frequencies were first year only, every alternate year and every year of B addition. The four different rates were 0.5, 1.0, 1.5 and 2.0 kg B ha−1. There was one B control (no B addition) treatment. During the experimentation period (six years), B was added to groundnut crop only. The sowing of groundnut (cv. TG-37) was carried out with seed rate of 120 kg ha−1 in the month of July, whereas the transplanting of cabbage (four-week-old seedlings) plants (cv. Golden acre) was undertaken in the month of December.
Recommended dosages of nitrogen (N) (via urea containing 46% N), and phosphorus (P) (via di-ammonium phosphate containing 18% N, and 46% P) fertilizers (12.5–25-0 NPK kg ha−1 for groundnut and 200–75-0 NPK kg ha−1 for cabbage crop) were applied to all the plots over the six years of experimentation; whereas, boron applications were given to the groundnut crop only through borax fertilizer (11% B) as per the three frequencies and four rates. There were 6 irrigations for groundnut crop and 8 irrigations for cabbage crop. All the cultural package and practices viz. thinning, gap filling, weeding, hoeing and pesticide application; were performed as and when required as per recommendations. Groundnut and cabbage crops were harvested in November and March, respectively. Groundnut crop was separated into groundnut pod and haulm, and their weights for each plot were recorded and expressed in kg ha−1. Whereas cabbage crop heads were picked from every plot and the weight was recorded in kg ha−1.

2.3. Collection and Analysis of Plant and Soil Samples

Pod and haulm samples from harvested groundnut crop and head samples from cabbage crop were collected and processed. The content of B in crop samples was determined using the ashing method followed by dilute HCl extraction. The estimation B in extracts was undertaken using the method involving Azomethine-H [31]. The representative topsoil (0–15 cm depth) samples from each plot were collected after harvesting the cabbage crop at the end of 6 cycles of the groundnut-cabbage system in 2020. The collected soil samples were processed by air-drying followed by the removal of gravels and debris. Samples were then grounded and sieved using a sieve of 2.0 mm mesh for analysis.
Available B (hot water-soluble) content in soil samples was estimated using the method outlined by Gupta [30]. Various B fractions in soil samples were estimated [17,32]. Readily soluble boron was extracted by taking 10 g soil, adding 20 mL of 0.01 M CaCl2 into 50 mL polyethylene centrifuge tube and shaking for 16 h at 25 °C in an environment shaker. This was followed by centrifuging at 10,000 rpm for 30 min. The concentration of B in a supernatant solution was determined using Azomethine-H reagent. For estimation of SA-B, the residual soil after extraction of readily soluble boron, was extracted with 0.05 M KH2PO4 (20 mL) by shaking in an environment shaker at 25 °C for 1 h. Boron in supernatant was determined using reagent Azomethine-H, after centrifuging at 10,000 rpm for 30 min. Oxide bound boron was extracted by extracting the residual soil obtained after extraction of SA-B with 0.175 M (NH4) C2O4 (pH 3.25) (40 mL) by shaking in an environment shaker at 25 °C for 1 h at 10,000 rpm. For determination of Or-B, the residue obtained from the previous step was treated with 0.5 M NaOH (40 mL) by shaking for 24 h at 25 °C followed by filtration. For determination of Res-B, the residue obtained from the previous step was dried, grounded and digested using H2SO4, HF and HClO4 in a teflon beaker. All the above fractions were added to obtain T-B content. The content of B in soil extracts were measured using a UV-VIS spectrophotometer (Hitachi—U-2900) at a 420 nm wavelength.

2.4. Statistical Analysis

Two-way analysis of variance of data regarding the yield of groundnut and cabbage crop as well available B and B fractions was carried out using the F-test [33]. Duncan’s new multiple range test was used to compare the treatment means. Path coefficient analysis was performed to visualize the contribution of different B fractions towards groundnut and cabbage yield. Statistical analyses were performed using Microsoft Excel (Microsoft Corp., Pullman, WA, USA) and SPSS 16.0 (SPSS Inc., Chicago, IL, USA) softwares.

3. Results

3.1. Groundnut and Cabbage Yield

The 6-year average data pertaining yield of groundnut (pod and haulm) and cabbage-head yield as influenced by B fertilizer application are given in Table 1. Since trends are similar, the data were pooled over the years. The boron fertilizer addition at different dosages significantly increased groundnut pod and haulm yield and cabbage-head yield compared to the yields achieved under control plot (Table 1). Alternate application of 1.0 kg B ha−1 provided the highest groundnut-pod yield (2243 kg ha−1) followed by the addition of 1.5 kg B ha−1 (2230 kg ha−1). In the case of every-year application of B, the pod yield declined with increased B rates from 0.5 to 2.0 kg ha−1. The overall percentage response was recorded in the range of 4.7 to 17.0 for pod and 10.2 to 20.1 in haulm over control. While in case of cabbage, a significant effect on cabbage-head yield was observed due to residual effects of B added at different rates and frequencies to groundnut crop. However, slight improvements in yields were noticed when B was applied every year as compared to the first year and alternate years. The percentage response was recorded in the range of 4.7 to 11.2 in the first year, 8.1 to 12.9 in alternate years and 10.9 to 15.0 in every year application over control (Table 1). The Addition of 1.0 kg B ha−1 in alternate years was found optimum for enhancing the yield of groundnut and cabbage crops grown on study soil.

3.2. Boron Content in Groundnut and Cabbage Crops

The B content in groundnut pod, haulm and cabbage head ranged from 12.4 to 17.5 mg kg−1, 29.5 to 39.4 mg kg−1 and 24.4 to 31.3 mg kg−1, respectively (Table 2). The B content in pod and haulm of groundnut and in cabbage head under various B dosages were significantly higher than B content in crops under control (no-B application). The addition of 2.0 kg B ha−1 every year recorded the maximum B content in groundnut pod, haulm and cabbage crop.

3.3. Available Boron in Soil

The content of available B varied from 0.64 to 1.40 mg kg−1 under different treatments (Table 3). Every-year application of B in soil at a rate of 0.5, 1.0, 1.5 and 2.0 kg ha−1 recorded higher content of available B viz., 1.18, 1.19, 1.35, and 1.40 mg kg−1, respectively, compared to the available B content obtained under alternate years and first year only B application. Available B content was significantly higher with the increasing dose of B application every year than available B content under alternate years B application.

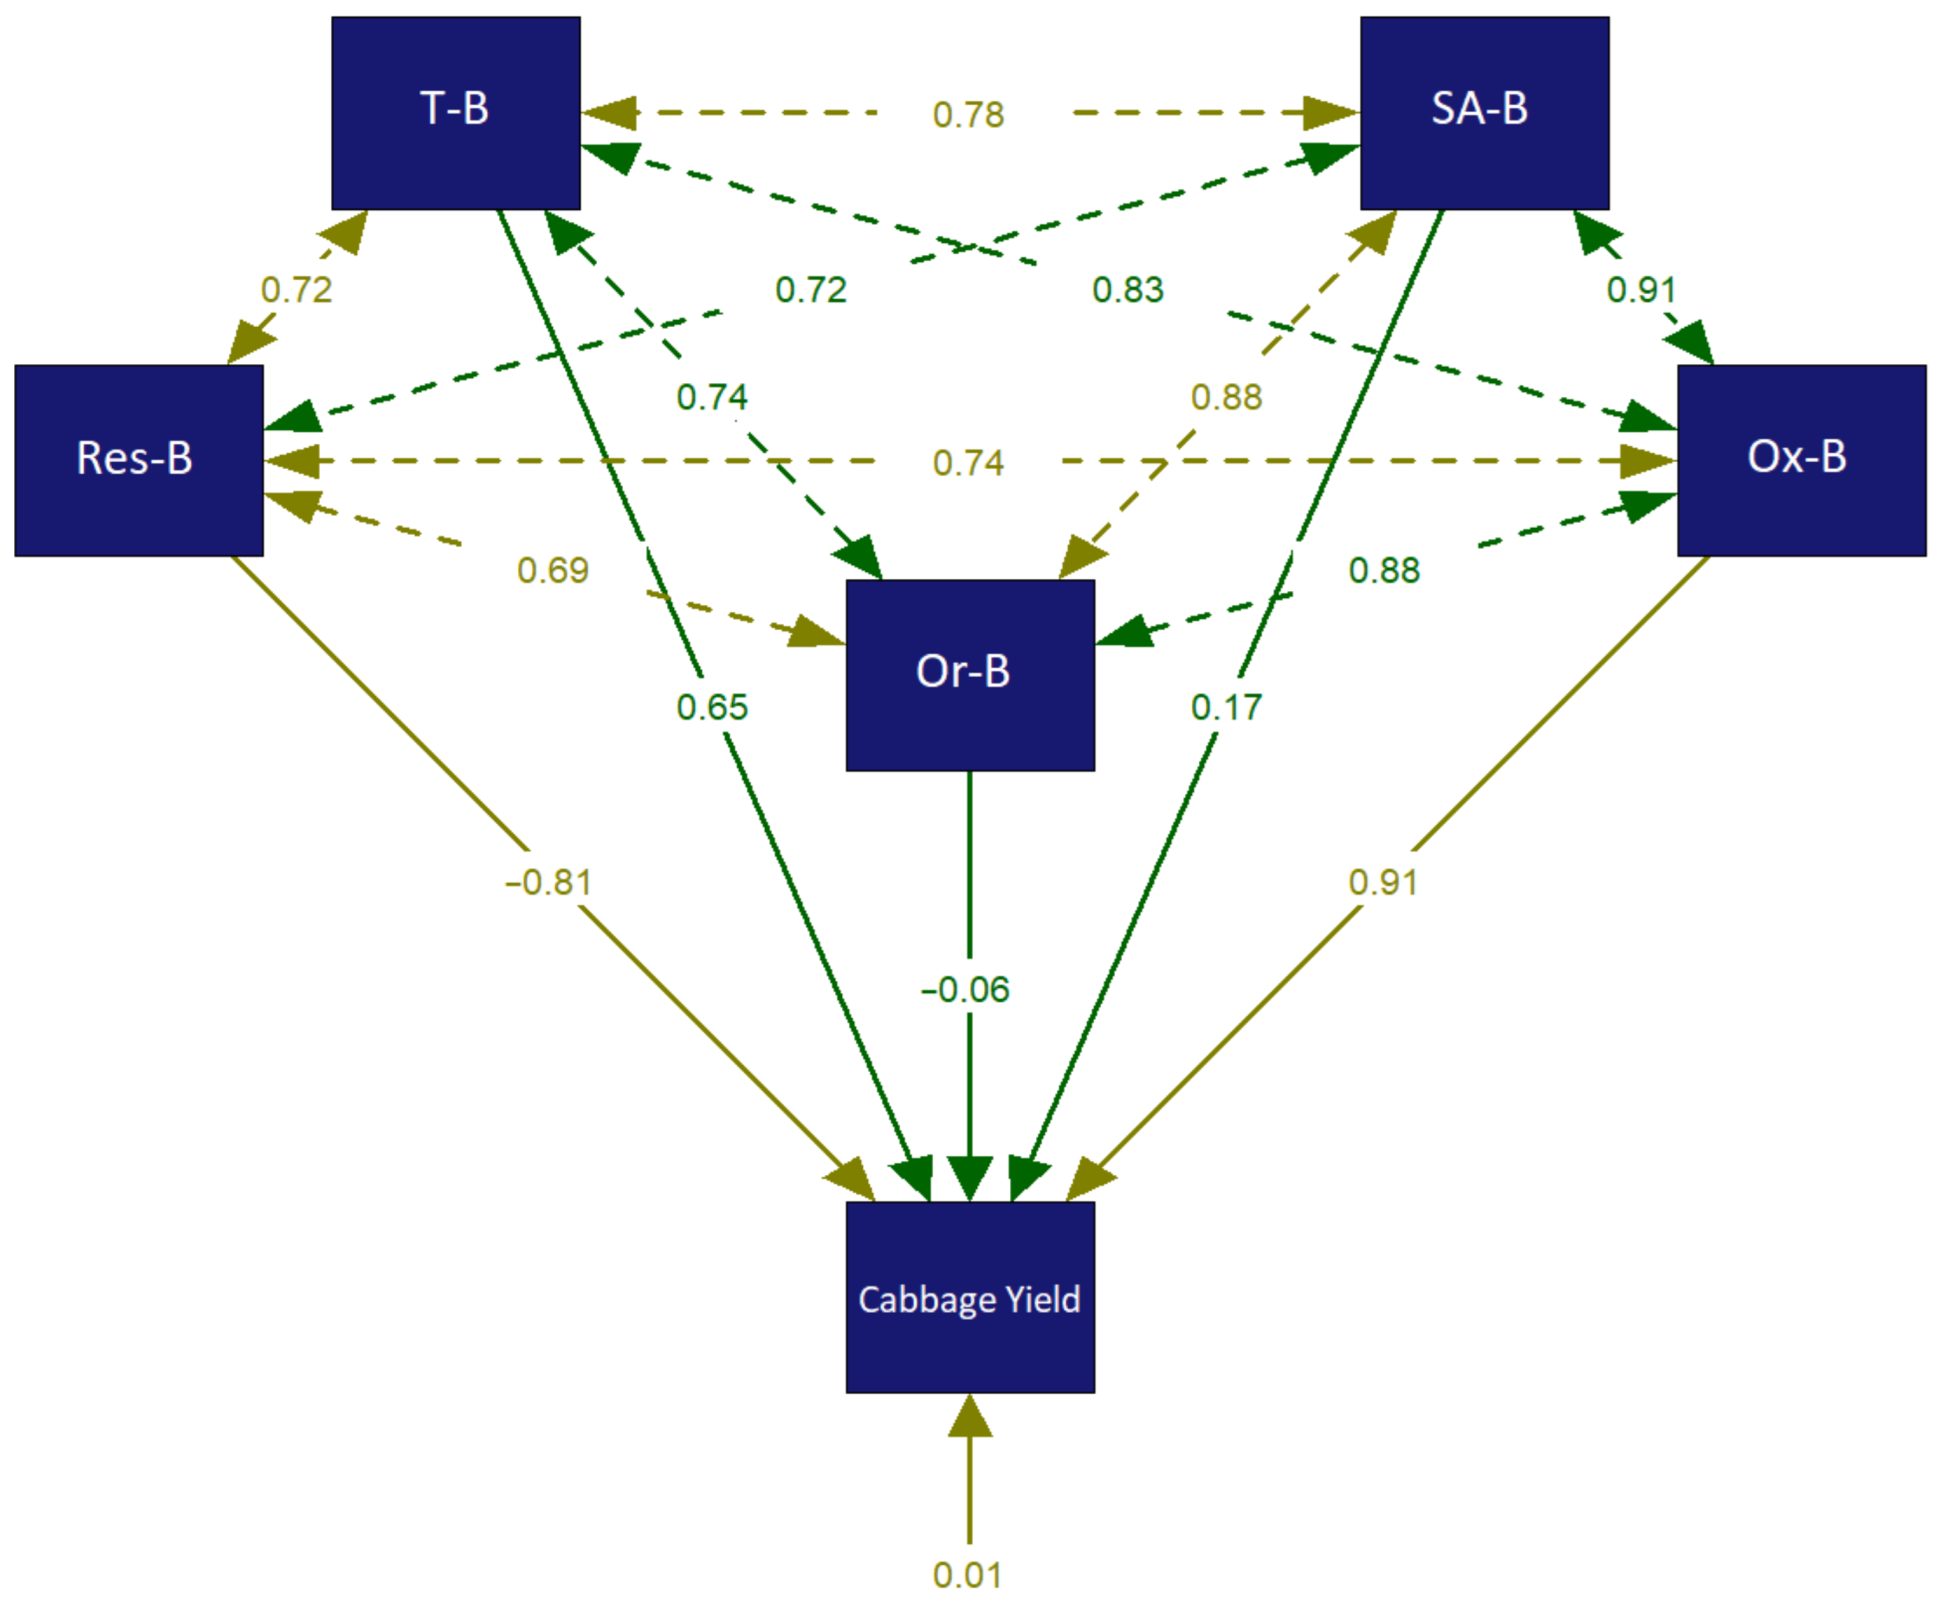
3.4. Boron Fractions in Soil

The addition of B fertilizer at different rates and frequencies to the groundnut-cabbage cropping system significantly influenced different B fractions in soil (Table 4). Readily soluble B was ranged from 0.59 to 0.93 mg kg−1 with a mean value of 0.76 mg kg−1, which was lowest among all the B fractions (Table 4). The content of SA-B varied from 1.21 to 1.40 mg kg−1 under different treatments. Whereas the content of Ox-B ranged from 2.67 to 5.81 mg kg−1 with a mean value of 4.28 mg kg−1 as a result of B application at various dosages. The contents of Or-B, Res-B and T-B varied from 1.60 to 2.59, 103 to 152 and 109 to 160 mg kg−1, respectively (Table 4). The differences between B fractions were significantly higher with higher dosages of B addition. RS-B, SA-B, Or-B, Ox-B, Res-B and Total-B fractions value were 0.59, 1.21, 2.67, 1.63, 103 and 109 mg kg−1; and the values were significantly increased by 30, 11, 65, 28, 31 and 32 per cent, respectively, with applied B fertilizer across the rates and frequencies (Table 4).

4. Discussion

The application of B enhanced the yield of groundnut and cabbage crop (Table 1). The enhancement in crop yields due to the addition of B fertilizer is ascribed to improve the B nutrition of crops as B plays pivotal role in plant metabolism leading to enhanced growth and development [1,34]. The findings of the present study are in conformity of the observations of Shukla and Behera [35] who recorded the enhancement in yield of various crops under different soil-crop situations in India. Crops may possibly suffer from deficiency or toxicity by minor variations in B fertilizer application to the soil. Therefore, B fertilizer optimization in soils with B deficiency is essential in order to get proper growth, crop yield and produce quality. Ansari et al. [36] reported that the soil application of 2.0 kg B ha−1 improved groundnut yield under rainfed sandy loam soils of the north-east hill regions of India. The pod yield of groundnut was gradually increased from 4.7 to 13.6% with an increased dose of B from 0.5 to 2.0 kg ha−1 in the first year only. The addition of B at various dosages influenced crops yield differently. Boron application had a direct effect on groundnut crop yield and a residual effect on cabbage-head yield. Shrestha et al. [37] reported residual effect of B fertilizer on succeeding maize crop grown on Acrisol and Fluvisol of Nepal. A fraction of applied B is utilized by crops under different production systems leading to a multi-year effect of applied B [6]. However, the extent of residual effects depends upon the amount and frequency of the initial B application, types of the crops cultivated and soil properties [38,39]. The application of B enhanced the B concentration in plant parts (Table 2). Several researchers also reported increased B content in plant tissues due to B fertilizer application [37,38,39]. The application of B at different rates and frequencies enhanced the available B content in soil. This is attributed to the application of B to the groundnut crop during the period of experimentation. Best-fit response curves between available B in soil and groundnut-pod yield, and between available B and cabbage-head yield were generated by quadratic regression models. The optimal available B content in soil was found to be 1.25 mg kg−1 for both groundnut pod and cabbage-head yield (Figure 3 and Figure 4). Similarly, optimal available zinc content in soils for obtaining the highest crop yield were also worked out by Liu et al. [40] and Butail et al. [41]. The optimal available nutrient content for obtaining the highest crop-yield changes under different soil-crop situations due to variations in soil properties and yield potential of the cultivated crops.
Understanding the status of B fractions in soil is very much crucial for a better comprehension of B dynamics in soil, plant accessibility and potential environmental effects [32]. In the present study, the content RS-B (varied from 0.59 to 0.93 mg kg−1) was the lowest (Table 4). Gurel et al. [42] also reported the content of RS-B in the range of 0.22 to 1.83 mg kg−1 in olive tree grown soils of Turkey. Boron application at different rates and frequencies resulted in SA-B in the range of 1.21 to 1.40 mg kg−1 and Ox-B in the range of 2.67 to 5.81 mg kg−1. The quantity of Ox-B mainly depends on the amount of Fe or Al oxides and hydroxides as well as organic matter. The higher levels of organic matter in soil leads to lower contents of Ox-B because of the adsorption of functional groups of organic matter on the exchange sites of oxides and hydroxide of Al and Fe. The contents of Or-B varied from 1.60 to 2.51 mg kg−1 under different treatments.
The significant increase in Or-B due to B addition is attributed to the slow and continued release of this fraction by organic matter decomposition [43]. The Res-B was the predominate pool of B, contributing to about 94% of T-B (Table 4). This is attributed to the fixation of applied B to primary and secondary minerals in soil. Several researchers also a recorded greater proportion of Res-B (>90%), regardless of soils and climates. Total B content in soils varied within the reported range (7 to 630 mg kg−1) of T-B for Indian soils [44]. On an average, Or-B, Ox-B, SA-B and RS-B fractions contributed 1.5, 3.0, 0.9 and 0.5%, respectively, of the T-B fraction, while Res-B fraction contributed to the highest proportion of 94.1% out of total soil B. On average, the trend of B fractions followed the order: every year > alternate years > first year only and 2.0 > 1.5 > 1.0 > 0.5 kg B ha−1 for various frequencies and rates of B addition, respectively. Overall, the distribution of B fractions in different treatments was in Res-B > Ox-B > Or-B > SA-B > RS-B order. Path analysis showed the contribution of various B fractions towards the yield of groundnut and cabbage crop. Total B contributed the highest with a coefficient value of 4.30 for groundnut-pod yield (Figure 5). Whereas Ox-B fraction contributed to the maximum extent with a coefficient value of 0.91 towards cabbage-head yield (Figure 6). Similarly, Bhupenchandra et al. [22] determined the contribution of different B fractions towards crop yield of a cauliflower-okra cropping system.

5. Conclusions

The present investigation revealed that the application of B at various rates and frequencies improved crop yield, crop-B content, available B and B fractions in the studied soil with the groundnut-cabbage cropping system. Boron application had both direct and residual effects on crop yields. Boron application enhanced B content in groundnut pod and haulm and cabbage and available B content in soil. The optimal available B content in soil was found to be 1.25 mg kg−1 for both groundnut pod and cabbage-head yield. The application of B with different rates and frequencies significantly enhanced B fractions in soil. The concertation of different fractions increased with increased rates in B application. Path analysis revealed the highest contribution of total boron towards groundnut-pod yield and of oxide-bound boron fraction towards cabbage-head yield. This finding could be used for B management in similar soil-crop contexts in other regions of India. There is a need to conduct studies that assess the impact of various dosages of B applications to different cropping systems under various soil-crop situations of the world for better understanding of the direct, as well as residual effect of B application on crop yield, B nutrition of crops, available B and soil-B fractions. This will help in the undertaking of efficient B-management practices in different cropping systems for higher crop yield, better crop nutrition and enhanced B-use efficiency.

Author Contributions

D.K.: Conceptualization, Funding acquisition, Methodology, Writing—original draft; K.C.P.: Investigation, Formal analysis; A.K.S.: Investigation, Methodology, Supervision, Validation, Writing—original draft; S.K.B.: Methodology, Investigation, Writing—original draft; V.P.R.: Software, Investigation; B.S.: Investigation, Methodology; R.A.P.: Formal analysis, Investigation, Methodology. All authors have read and agreed to the published version of the manuscript.

Funding

The authors are thankful to the Indian Council of Agricultural Research, New Delhi for extending financial support through the All India Coordinated Research Project on Micro and Secondary Nutrients and Pollutant Elements in Soils and Plants to carry out the present study.

Institutional Review Board Statement

Not applicable.

Data Availability Statement

The data presented in this study are available on request from the authors.

Conflicts of Interest

The authors declare no conflict of interest.

References

  1. Marschner, P. Marchner’s Mineral Nutrition of Higher Plants, 3rd ed.; Academic Press: San Diego, CA, USA, 2012. [Google Scholar]
  2. Tripathi, D.K.; Singh, S.; Singh, S.; Mishra, S.; Chauhan, D.K.; Dubey, N.K. Micronutrients and their diverse role in agricultural crops: Advances and future prospective. Acta Physiol. Plant. 2015, 37, 139. [Google Scholar] [CrossRef]
  3. Pereira, G.L.; Siqueira, J.A.; Batista-Silva, W.; Cardoso, F.B.; Nunes-Nesi, A.; Araújo, W.L. Boron: More than an essential element for land plants? Front. Plant Sci. 2021, 11, 610307. [Google Scholar] [CrossRef]
  4. Lordkaew, S.; Konsaeng, S.; Jongjaidee, J.; Dell, B.; Rerkasem, B.; Jamjod, S. Variation in responses to boron in rice. Plant Soil 2013, 363, 287–295. [Google Scholar] [CrossRef]
  5. Sillanpaa, M. Micronutrient Assessment at the Country Level: An International Study. FAO Soils Bulletin No. 63; FAO: Rome, Italy, 1990. [Google Scholar]
  6. Shorrocks, V.M. The occurrence and correction of boron deficiency. Plant Soil 1997, 193, 121–148. [Google Scholar] [CrossRef]
  7. Fageria, N.K.; Baligar, V.C.; Clark, R.B. Micronutrients in crop production. Adv. Agron. 2002, 77, 185–250. [Google Scholar]
  8. Shukla, A.K.; Behera, S.K.; Prakash, C.; Tripathi, A.; Patra, A.K.; Dwivedi, B.S.; Trivedi, V.; Rao, C.S.; Chaudhari, S.K.; Das, S.; et al. Deficiency of phyto-available sulphur, zinc, boron, iron, copper and manganese in soils of India. Sci. Rep. 2021, 11, 19760. [Google Scholar] [CrossRef]
  9. Shukla, A.K.; Behera, S.K.; Prakash, C.; Patra, A.K.; Rao, C.S.; Chaudhari, S.K.; Das, S.; Singh, A.K.; Green, A. Assessing multi-micronutrients deficiency in agricultural soils of India. Sustainability 2021, 13, 9136. [Google Scholar] [CrossRef]
  10. Shukla, A.K.; Behera, S.K. All India research project on micro-and secondary nutrients and pollutant elements in soils and plants: Research achievements and future thrusts. Indian J. Fert. 2019, 15, 522–543. [Google Scholar]
  11. Rego, T.J.; Sahrawat, K.L.; Wani, S.P.; Pardhasaradhi, G. Widespread deficiencies of sulfur, boron, and zinc in Indian semi-arid tropical soils: On-farm crop responses. J. Plant Nutri. 2007, 30, 1569–1583. [Google Scholar] [CrossRef] [Green Version]
  12. Sahrawat, K.L.; Rego, T.J.; Wani, S.P.; Pardhasaradhi, G. Sulfur, boron, and zinc fertilization effects on grain and straw quality of maize and sorghum grown in semi-arid tropical region of India. J. Plant Nutr. 2008, 31, 1578–1584. [Google Scholar] [CrossRef] [Green Version]
  13. Shahid, M.; Nayak, A.K.; Tripathi, R.; Katara, J.L.; Bihari, P.; Lal, B.; Gautam, P. Boron application improves yield of rice cultivars under high temperature stress during vegetative and reproductive stages. Int. J. Biometeorol 2018, 62, 1375–1387. [Google Scholar] [CrossRef]
  14. Javed, M.B.; Malik, Z.; Kamran, M.; Abbasi, G.H.; Majeed, A.; Riaz, M.; Bukhari, M.A.; Mustafa, A.; Ahmar, S.; Mora-Poblete, F.; et al. Assessing yield response and relationship of soil boron fractions with its accumulation in sorghum and cowpea under boron fertilization in different soil series. Sustainability 2021, 13, 4192. [Google Scholar] [CrossRef]
  15. Brdar-Jokanovi´c, M. Boron toxicity and deficiency in agricultural plants. Int. J. Mol. Sci. 2020, 21, 1424. [Google Scholar] [CrossRef] [Green Version]
  16. Jin, J.; Martens, D.C.; Zelazny, L.W. Distribution and plant availability of soil; boron fractions. Soil Sci. Soc. Am. J. 1987, 51, 1228–1231. [Google Scholar] [CrossRef]
  17. Hou, J.; Evans, L.J.; Spiers, G.A. Chemical fractionation of soil boron. I. Method development. Can. J. Soil Sci. 1966, 76, 485–491. [Google Scholar] [CrossRef]
  18. Xu, J.M.; Wang, K.; Bell, R.W.; Yang, Y.A.; Huang, L.B. Soil boron fractions and their relationship to soil properties. Soil Sci. Soc. Am. J. 2011, 65, 133–138. [Google Scholar] [CrossRef]
  19. Dey, A.; Dwivedi, B.S.; Meena, M.C.; Datta, S.P.; Polara, K.B.; Sobhana, H.K.; Singh, M. Boron fractions in a Vertic Ustochrept as influenced by thirteen years of fertilization and manuring. J. Indian Soc. Soil Sci. 2017, 65, 326–333. [Google Scholar] [CrossRef]
  20. Das, R.; Kumar, R.; Sarkar, D.; Das, S.; Pradhan, A.K.; Das, D.; Srivastava, M.; Sinha, A.K.; Sahoo, S.; Datta, S.P.; et al. Boron fractions and its availability in soils of the Indo-Gangetic plains. Catena 2023, 222, 106877. [Google Scholar] [CrossRef]
  21. Padbhushan, R.; Kumar, D. Fractions of soil boron: A review. J. Agri. Sci. 2017, 155, 1023–1032. [Google Scholar] [CrossRef]
  22. Bhupenchandra, I.; Basumatary, A.; Dutta, S.; Singh, L.K.; Datta, N. Impact of boron fertilization on boron fractions at different crop growth stages in cauliflower-cowpea-okra sequence in an Inceptisols of north east India. J. Plant Nutri. 2020, 43, 1175–1188. [Google Scholar] [CrossRef]
  23. USDA-Natural Resources Conservation Service Soil Survey Staff. Keys to Soil Taxonomy, 9th ed.; US Government Printing Office: Washington, DC, USA, 2003.
  24. Jackson, M.L. Soil Chemical Analysis: Advanced Course; UW-Madison Libraries Parallel Press: Madison, WI, USA, 2005. [Google Scholar]
  25. Walkley, A.J.; Black, I.A. An examination of the Degtjareff method for determining soil organic matter and a proposed modification of the chromic acid titration method. Soil Sci. 1934, 37, 29–38. [Google Scholar] [CrossRef]
  26. Olsen, S.R.; Cole, C.V.; Watanable, F.S.; Dean, L.A. Estimation of Available Phosphorous in Soils by Extraction with Sodium Bicarbonate No. 939; United States Department of Agriculture: Washington, DC, USA, 1954.
  27. Hanway, J.J.; Heidel, H. Soil analyses methods as used in Iowa State College Soil Testing Laboratory. Iowa Agri. 1952, 57, 1–31. [Google Scholar]
  28. Williams, C.H.; Steinbergs, A. Soil sulphur fractions as chemical indices of available sulphur in some Australian soils. Aust. J. Agric. Res. 1969, 10, 340–352. [Google Scholar] [CrossRef]
  29. Lindsay, W.L.; Norvell, W.A. Development of a DTPA soil test for zinc, iron, manganese, and copper. Soil Sci. Soc. Am. J. 1978, 42, 421–428. [Google Scholar] [CrossRef]
  30. Gupta, U.C. A simplified method for determining hot-water soluble boron in podzol soils. Soil Sci. 1967, 103, 424–428. [Google Scholar] [CrossRef]
  31. Gaines, T.P.; Mitchell, G.A. Boron determination in plant tissue by the azomethine-H method. Commun. Soil Sci. Plant Anal. 1979, 10, 1099–1108. [Google Scholar] [CrossRef]
  32. Datta, S.P.; Rattan, R.K.; Suribabu, K.; Datta, S.C. Fractionation and colorimetric determination of boron in soils. J. Plant Nutri. Soil Sci. 2002, 165, 179–184. [Google Scholar] [CrossRef]
  33. Gomez, K.A.; Gomez, A.A. Statistical Procedures for Agricultural Research, 2nd ed.; John Wiley and Sons: New York, NY, USA, 1984; p. 680. [Google Scholar]
  34. Gupta, U.C. Boron Nutrition of Crops. Adv. Agron. 1980, 31, 273–307. [Google Scholar]
  35. Shukla, A.K.; Behera, S.K. Micro and Secondary Nutrients and Pollutant Elements Research in India. Coordinator Report—AICRP Micro and Secondary Nutrients and Pollutant Elements in Soils and Plants; ICAR-Indian Institute Soil Science: Bhopal, India, 2020; pp. 1–210. [Google Scholar]
  36. Ansari, M.A.; Prakash, N.; Singh, I.M.; Sharma, P.K.; Punitha, P. Efficacy of boron sources on productivity, profitability and energy use efficiency of groundnut (Arachis hypogaea) under north east hill regions. Indian J. Agri. Sci. 2013, 83, 959–963. [Google Scholar]
  37. Shrestha, S.; Becker, M.; Lamers, J.P.A.; Wimmer, M.A. Residual effects of B and Zn fertilizers applied to dry season crops on the performance of the follow-up crop of maize in Nepal. J. Plant Nutri. Soil Sci. 2021, 184, 238–245. [Google Scholar] [CrossRef]
  38. Yang, X.; Yu, Y.G.; Yang, Y.; Bell, R.W.; Ye, Z.Q. Residual effectiveness of boron fertilizer for oilseed rape in intensively cropped rice-based rotations. Nutr. Cycl. Agroecosys. 2000, 57, 171–181. [Google Scholar] [CrossRef]
  39. Rehman, A.; Farooq, M.; Rashid, A.; Nadeem, F.; Stuerz, S.; Asch, F.; Bell, R.W.; Siddique, K.H.M. Boron nutrition of rice in different production systems. A review. Agron. Sustain. Dev. 2018, 38, 25. [Google Scholar]
  40. Liu, D.Y.; Zhang, W.; Pang, L.L.; Zhang, Y.Q.; Wang, X.Z.; Liu, Y.M.; Chen, X.P.; Zhang, F.S.; Zou, C.Q. Effects of zinc application rate and zinc distribution relative to root distribution on grain yield and grain Zn concentration in wheat. Plant Soil 2017, 411, 167–178. [Google Scholar] [CrossRef]
  41. Butail, N.P.; Kumar, P.; Shukla, A.K.; Behera, S.K.; Sharma, M.; Kumar, P.; Sharma, U.; Takkar, P.N.; Rao, C.S.; Trivedi, V.; et al. Zinc dynamics and yield sustainability in relation to Zn application under maize-wheat cropping on Typic Hapludalfs. Field Crops Res. 2022, 283, 108525. [Google Scholar] [CrossRef]
  42. Gürel, S.; Başar, H.; Keskin, E.; Dirim, M.S. The determination of soil boron fractions, their relationships to soil properties and the availability to olive (Olea europea L.) trees. Commun. Soil Sci. Plant Anal. 2019, 50, 1044–1062. [Google Scholar] [CrossRef]
  43. Parks, W.L.; White, J.L. Boron retention by clay and humus systems saturated with various cations. Soil Sci. Soc. Am. J. 1952, 16, 298–300. [Google Scholar] [CrossRef]
  44. Kanwar, J.S.; Randhawa, N.S. Micronutrient Research in Soils and Plant in India: A Review; Indian Council of Agricultural Research: New Delhi, India, 1974. [Google Scholar]
Figure 1. Location of the experimental area.
Agriculture 13 00248 g001
Figure 2. Temperature, rainfall and relative humidity of the experimental area during study period.
Agriculture 13 00248 g002
Figure 3. Response function and physical optimal available B for the highest groundnut-pod yield in relation to B fertilization to groundnut crop in groundnut-cabbage cropping system.
Agriculture 13 00248 g003
Figure 4. Response function and physical optimal available B for the highest cabbage-head yield in relation to B fertilization to groundnut crop in groundnut-cabbage cropping system.
Agriculture 13 00248 g004
Figure 5. Path diagram and coefficient of factors of different B fraction influencing pod yield of groundnut. Single head arrows and connector indicate direct effect and natural association, respectively.
Agriculture 13 00248 g005
Figure 6. Path diagram and coefficient of factors of different B fractions influencing yield of cabbage. Single head arrows and connector indicate direct effect and natural association, respectively.
Agriculture 13 00248 g006
Table 1. Groundnut and cabbage yield under various dosages of B application to groundnut and cabbage cropping system.
CropGroundnut-Pod Yield
(kg ha−1)
Groundnut-Haulm Yield
(kg ha−1)
Cabbage-Head Yield
(kg ha−1)
Rates
(kg B ha−1)
0.51.01.52.00.51.01.52.00.51.01.52.0
Frequencies
First year only2008 de2071 cd2120 abcd2177 abc4958 a4996 a5252 a5404 a35,700 bc36,800 ab37,200 ab37,900 ab
Alternate years2107 abcd2243 a2230 a2223 ab5187 a5277 a5262 a5265 a36,800 ab37,700 ab38,100 ab38,500 a
Every year2206 abc2203 abc2164 abc2079 bcd5309 a5366 a5180 a4973 a37,800 ab38,600 a39,000 a39,200 a
Control1917 e4500 b34,100 c
F value4.793.253.42
p value≤0.001≤0.001≤0.001
Note: Different lowercase letters denote significant difference.
Table 2. Boron content in groundnut and cabbage crop under various dosages of B application.
CropB Content in Groundnut Pod (mg kg−1)B Content in Groundnut Haulm (mg kg−1)B Content in Cabbage Head (mg kg−1)
Rates
(kg B ha−1)
0.51.01.52.00.51.01.52.00.51.01.52.0
Frequencies
First year only12.9 hi13.6 gh13.9 g14.2 fg31.3 g32.7 f33.4 ef34.7 de25.5 f26.1 ef26.8 de27.4 d
Alternate years14.2 fg14.8 ef15.4 de16.1 cd32.9 f33.7 ef35.6 cd36.9 bc27.3 d27.2 d28.528.9 bc
Every year15.7 d16.6 bc17.1 ab17.5 a35.8 cd36.6 bc37.9 b39.4 a28.8 c29.8 b31.2 a31.3 a
Control12.4 i29.5 h24.4 g
F value35.339.342.1
p value≤0.001≤0.001≤0.001
Note: Different lowercase letters denote significant difference.
Table 3. Available B in soil as affected by various dosages of B addition to the groundnut-cabbage cropping system.
Available B (mg kg−1)
Rates (kg B ha−1)0.51.01.52.0
Frequencies
First year only0.68 gh0.70 fg0.76 f0.83 e
Alternate years0.95 d1.00 d1.09 c1.18 b
Every year1.18 b1.19 b1.35 a1.40 a
Control0.64 h
F value170
p value≤0.001
Note: Different lowercase letters denote significant difference.
Table 4. Boron fractions (mg kg−1) as influenced by various dosages of B addition to the groundnut-cabbage cropping system.
FractionRS-BSA-BOx-B
Rates (kg B ha−1)0.51.01.52.00.51.01.52.00.51.01.52.0
Frequencies
First year only0.62 ef0.67 de0.66 de0.72 c1.25 gh1.27 fgh1.30 efg1.35 bcde3.15 f3.74 e3.99 de4.27 cde
Alternate years0.67 d0.73 c0.75 c0.83 b1.31 defg1.32 cdef1.34 bcde1.38 bcd3.97 de4.36 cd4.45 cd4.79 bc
Every year0.85 b0.9 a0.90 a0.93 a1.33 bcdef1.39 bc1.40 b1.47 a4.46 cd4.79 bc5.22 b5.81 a
Control0.59 g1.21 h2.67 f
F value62.69.020.0
p value≤0.001≤0.001≤0.001
FractionOr-BRes-BT-B
Rates (kg B ha−1)0.51.01.52.00.51.01.52.00.51.01.52.0
Frequencies
First year only1.79 ef1.88 de1.91 de2.04 bcde116 h122 gh125 fgh127 efg123 h130 gh133 fg135 efg
Alternate years1.88 de1.93 cde2.09 bcd2.18 bc133 def136 cde137 cde139 bcd141 def144 cde145 cd149 cd
Every year1.98 cde2.25 b2.49 a2.59 a141 bcd145 abc149 ab152 a150 bcd154 abc159 ab163 a
Control1.63 f103 i109 i
F value10.918.621.2
p value≤0.001≤0.001≤0.001
Note: RS-B—readily soluble boron, SA-B—specifically adsorbed boron, Ox-B—oxide bound boron, Or-B—organically bound boron, Res-B—residual boron, T-B—total boron. Different lowercase letters denote significant difference.
Disclaimer/Publisher’s Note: The statements, opinions and data contained in all publications are solely those of the individual author(s) and contributor(s) and not of MDPI and/or the editor(s). MDPI and/or the editor(s) disclaim responsibility for any injury to people or property resulting from any ideas, methods, instructions or products referred to in the content.

