Article

Participatory On-Farm Evaluation of Improved Groundnut Genotypes in the Guinea Savannah Agro-Ecological Zone of Ghana

by
Ophelia Asirifi Amoako
*,
Richard Oteng-Frimpong
,
Julius Yirzagla
,
Yussif Baba Kassim
,
Theophilus Kwabla Tengey
,
Desmond Sunday Adogoba
,
Mercy Mingle
,
Ramatu Alhassan
and
Abdul Aleem Ibrahim
CSIR-Savanna Agricultural Research Institute, Tamale P.O. Box TL 52, Ghana
*
Author to whom correspondence should be addressed.
Agriculture 2023, 13(12), 2249; https://doi.org/10.3390/agriculture13122249
Submission received: 1 November 2023 / Revised: 26 November 2023 / Accepted: 1 December 2023 / Published: 7 December 2023

Abstract

:
The on-farm mother–baby trial experimental approach was employed to evaluate the performance of elite groundnut genotypes on farmers’ fields in the Guinea savannah agroecology of Ghana in the 2020 and 2021 cropping seasons. Analysis of the data from the mother trial revealed significant (p < 0.05) genotypic differences for the traits measured over the two years. The genotype ICGV-IS 13842 reached physiological maturity in 88 days and was identified as the genotype with the shortest maturity period. However, in terms of pod yield and its associated components, genotype ICGV-IS 13864 emerged as the best from the mother trial. During farmer evaluation of the materials, genotype ICGV-IS 13979 was selected as the most preferred in addition to genotypes ICGV-IS 13864 and ICGV-IS 131090. The genotypes ICGV-IS 13864 and ICGV-IS 131090 were observed to combine both high pod yield and high haulm yield. These two traits were identified as very important by the farmers who participated in the study as the haulms serve as fodder for their animals and fetch additional household income when sold with the pods harvested. The preference for genotype ICGV-IS 13842, an early maturing genotype, can be seen as an indication of farmers responding to the changing growing season due to erratic rainfall. However, if genotypes ICGV-IS 13864 and ICGV-IS 131090 are combined with some water management practices in the future, they could potentially withstand the changing growing season. Economic analysis showed that the improved genotypes had a greater net return on investment and higher cost–benefit ratio ranging from 2.74 to 4.84 across both years.

1. Introduction

Groundnut is an important annual leguminous crop that is a rich source of edible oil (50%), protein (25–28%), and carbohydrates (20%) worldwide [1]. It is globally known as the fourth oilseed crop, the third most significant source of vegetable protein after soybean, and the thirteenth most important food crop [2]. The global production area and average yield of groundnut are reported to be 25.34 million hectares and 1.68 mt/ha, respectively [3]. It is a key crop rotation component in many sub-Saharan countries [4]. In Ghana, groundnut is one of the most important legumes that partly contributes to the agricultural share of the Gross Domestic Product (GDP) [5]. Ghana has had an average annual groundnut production of 500,000 tonnes in recent decade [6]. Additionally, statistics show that in 2016, the area planted to groundnut in Ghana was 327,000 hectares, with an annual production of 426,000 tonnes [7]. Although groundnut is grown throughout Ghana, it is mostly produced in the Guinea savannah zone, which accounts for about 94% of the national production [8]. In Ghana, particularly in the northern part, groundnut cultivation is vital for ensuring food security and meeting the nutritional needs of people across all social classes. Additionally, it plays a significant role in creating employment opportunities and thereby improving the living standards of small-scale farmers who have limited resources [9].
Groundnut is not only highly nutritious, but it also enhances soil fertility by fixing atmospheric nitrogen into the soil [10,11]. Additionally, groundnut haulms are a rich source of feed for both livestock and poultry [12,13]. Despite being a significant source of livelihood, the yields of groundnut are usually low due to a combination of factors such as the use of unimproved varieties, diseases, pest infestation, low soil fertility, unreliable rains, and limited access to technology by small-scale farmers [14]. Farmers usually achieve an average yield of 1.5 MT/ha compared to the potential yield of 2.5 MT/ha [15]. Since there is inadequate seed availability of improved varieties, farmers recycle seeds, which further exacerbates the situation [16]. One of the possible solutions to increase the production and productivity of groundnut-based cropping systems in Ghana, especially in the Guinea savannah zone, is to provide farmers with access to improved varieties. However, if research institutes in Ghana develop improved varieties that are high-yielding, high in protein and oil, and drought-tolerant without considering farmers’ perceptions and preferences for a particular variety, this could result in low adoption rates and difficulties in disseminating the varieties.
As per a report published in [17], varietal evaluation and decisions solely by researchers have not resulted in the expected pace of variety release or their dissemination afterward. The report further stated that classical plant breeding faces two major hurdles while developing new materials and extending them to farmers. Firstly, new varieties can be a letdown to farmers if undesirable traits go undetected during the breeding process. Secondly, breeders often discard many crosses and varieties during the selection process because of traits considered undesirable; however, these traits may be of interest to farmers. Therefore, it is important to involve farmers in the introduction of new varieties, in addition to on-farm trials, to effectively evaluate and select new varieties and other technologies [18,19]. To achieve this, the study used participatory variety selection as a tool to select preferred groundnut genotypes. The objective of this study was to evaluate and identify high-yielding groundnut genotypes, assess farmers’ preferences for the genotypes, and determine the economic returns of each of the genotypes. It was hypothesized that participatory varietal selection leads to faster dissemination and adoption of improved varieties.

2. Materials and Methods

2.1. Description of the Study Area

On-farm evaluations of groundnut genotypes were conducted using mother (researcher-managed) and baby (farmer-managed) [20] trial design during the 2020 and 2021 cropping seasons at Tamale Metro and Sagnerigu District of the Northern region under rainfed conditions. The Northern region (9.5439° N, 0.9057° W, 132 m above sea level) is in the Guinea savannah agro-ecological zone of Ghana. The Guinea savannah zone covers over 40% of the entire land area of Ghana and is characterized by high temperatures and low humidity for most parts of the year [21]. The climate is warm and semi-arid, with a mono-modal annual rainfall of 900–1200 mm between May/June and October. The area is also characterized by a long and windy dry season (harmattan), which usually begins in November and lasts until April.
The predominant soils are sandy loam (classified as Typic-plinthic Paleustalf) according to the (United States Department of Agriculture Soil Taxonomy) by texture within the 0–30 cm soil depth. The soil is inherently low in terms of natural fertility and has a low moisture retention capacity. On average, the soils in the region have a pH of 6.21 (1:1 H2O), 1.09% organic matter, 0.05 mg/kg total N, 0.14 mg/kg exchangeable K, and 7.23 mg/kg available P (Bray-1 P) [22].

2.2. Treatments, Experimental Design, Experimental Materials, Land Preparation, and Field Management

The locations used for the baby trials were Kulaa, Gbalahi Sanga and Wovogu, Futa, Labariga in the Sagnerigu District and Yong-Dakpemyili, Bamvim, Zorbogu in the Tamale Metro. Farmers’ selection was based on the representativeness of most smallholder farmers and their ability to disseminate the information to other farmers. The mother trial was laid out in a randomized complete block design (RCBD) with three replications in the Sagnerigu District. A plot size of 4 m × 4 m was used. The planting distance was 40 cm between rows and 15 cm between plants, with one seedling per stand, resulting in a recommended plant population of 166,600 plants per hectare. The genotypes evaluated were ICGV-IS 09926, ICGV-IS 13979, ICGV-IS 13937, ICGV-IS 131090, ICGV-IS 13864, ICGV-IS 13842, and the farmers’ variety. These genotypes were selected for their pod and haulm yield from different breeding populations developed for the Guinea savannah zone of Ghana. The field was plowed and harrowed using a tractor, after which the mother trial was planted on 27 May 2020 and 26 May 2021. A pre-emergence herbicide (Pendimethalin) was applied at the rate of 2.5 L ha−1 immediately after planting. Triple Super Phosphate (TSP) was applied in the form of P2O5 at the rate of 60 kg/ha within 10 days after sowing. Sulfur and calcium nutrition and soil conditioning, Omya Calcipril™ (Omya (Schweiz) AG, Oftringen, Switzerland), were applied at the rate of 200 kg/ha before 30 days. Each baby trial consisted of one genotype planted alongside a farmers’ variety on a plot size of 2.4 m × 2.4 m, and replication was conducted across 24 farmers. The baby trials were planted in each of the six locations between 25 May and 30 June in both years.

2.3. Data Collection and Analysis

2.3.1. Researcher-Managed Agronomic Data

Data taken from the researcher-managed (mother trial) trial included plot establishment two weeks after planting, the number of plants at harvest, days to 50% flowering, days to physiological maturity, number of pods per plant, number of seeds per pod, dry pod, and haulm yield, hundred-seed weight, and harvest index. The pod and haulm yields were obtained by weighing sun-dried pods and haulms harvested from the two inner rows. The weights recorded were converted to kilograms per hectare (kg/ha). A 200 g composite sample was taken from the quantity mixed in each plot and analyzed for soil texture and pH in water using a soil-to-water ratio of 1:2.5 [23]. The total nitrogen of soil from the experimental plot was determined by using the Kjeldahl distillation and titration method [24]. Available phosphorus was measured using the Bray and Kurtz method [25]. Exchangeable potassium was determined using flame photometry PFP7 after extraction with ammonia acetate. Organic carbon was determined by using the wet digestion method [26] before planting was completed.

2.3.2. Farmer Field Days, Farmer Participatory Evaluation, and Data Analysis

Field days were organized about eighty days after planting in both years to give farmers an opportunity to provide feedback on the performance of the evaluated genotypes. The Department of Agriculture (DoA) facilitated the organization of these field days by mobilizing farmers to the trial sites. During the event, the research team explained the objectives and methodology used for the trials and asked farmers to evaluate the plots one at a time. Farmers were tasked with choosing which genotype/plot they preferred. Farmers compared each genotype against the others. They selected the treatment they preferred the most and the one they considered the least. Farmers assessed each genotype based on the following traits: plant stand, number of days to maturity, pod and haulm yield, number of matured pods per plant, and seed size. Farmers’ opinions and perceptions of the varieties were assessed using pairwise ranking, resulting in an overall ranking on a scale of 1–7 (1 = highly preferred and 7 = least preferred). Quantitative data were analyzed using Agricolae Package Version 1.4.0 software [27] in R statistical software. Pearson’s correlation was used to determine the relationships between pod yield and the other traits using corrplot in R statistical software. To understand the contribution of each trait to the total variation observed among the genotypes, a principal component analysis and cluster analysis was performed using Hierarchical Clustering on Principal Components function of the FactoMine [28] in R statistical software version 4.2.2. Treatment means were separated using the least significant difference (LSD) at 5% probability.

2.4. Economic Analysis

Economic analysis was performed to compare the profitability of producing different sets of groundnut genotypes in the semi-arid agroecology of northern Ghana using the same inputs across different locations. The economic analysis was based on a partial budgeting approach, given that not all the input costs were extensively captured. The crop partial budget technique was used to estimate the cost of production, revenue, gross margins, net revenue, and the benefit–cost ratio of groundnut genotypes to compare their profitability. However, the net return and benefit–cost ratio are presented in this study. The cost of all recommended variable inputs used in the study was considered. Crop (unshelled groundnut) prices and all input prices were surveyed in the study area using seasonal averages that prevailed in the study area during the cropping seasons. The value of the groundnut was taken at harvesting periods and, therefore, there was no cost borne for storage. The variable costs were the real input prices paid by farmers each year, which comprised the cost of planting material, weeding, harvesting, carting, and land preparation, as well as the field cost of fertilizer and weedicides purchased. Net returns or total benefit per hectare were then calculated as the difference between the gross income and total variable costs. The benefit–cost ratio was computed for comparison.
B/C = TB/TVC
where,
  • B/C—Benefit Cost Ratio
  • TB—Total Benefit
  • TVC—Total Variable Cost
When the B/C ratio is = 1.8, it implies that for each USD 1 invested in an enterprise, the farmer will recover their USD 1, plus an extra GHS 0.8 as a net benefit. All other things being equal, farmers should be willing to accept a variety if the B/C ratio of that variety is greater than the minimum acceptable B/C rate of 1 (B/C > 1). An enterprise with a ratio greater than 1 (B/C > 1) is economically profitable.

3. Results

3.1. Baseline Soil Analysis

Soil analysis was conducted prior to planting at the mother trial experimental site in both 2020 and 2021. The analysis showed that in 2020, the soil was sandy silt with a pH of 5.80, 0.16% total nitrogen, 16.82 mg kg−1 available phosphorus, 63 mg kg−1 potassium, and 1.76% organic carbon. In 2021, the soil was sandy silt with a pH of 5.68, 0.14% total nitrogen, 15.82 mg kg−1 available phosphorus, 54 mg kg−1 potassium, and 1.52% organic carbon. Planting in both years started late in May due to the delayed onset of the rainy season.

3.2. Analysis of Variance

Significant differences (p < 0.05) were observed among the genotypes evaluated in the mother trial for various parameters such as plant establishment (measured two weeks after planting), number of plants at harvest, days to 50% flowering, days to physiological maturity, number of pods per plant, pod yield, haulm yield, hundred-seed weight, and harvest index in both the 2020 and 2021 cropping seasons. However, the number of seeds per pod was not found to be significantly different in 2020 (Table 1 and Table 2).

3.3. Relationship among Traits

To analyze the relationship between pod yield and other traits observed in the study, we calculated the Pearson correlation coefficient for each year. The results are presented in Figure 1. The number of plants that were established at 2 WAP exhibited a highly significant positive correlation (r = 0.755 ** in 2020, r = 0.786 ** in 2021) with the number of plants that were harvested. Days to 50% flowering also showed a highly significant positive correlation with days to maturity (r = 0.564 ** and r = 0.709 ** for 2020 and 2021, respectively). The results also revealed that traits such as number of plants established at 2 WAP, number of plants at harvest, days to 50% flowering, days to maturity, and the number of seeds per pod were negatively correlated with pod yield in 2020. In both years, a consistently significant association was observed between pod yield and the number of matured pods per plant, hundred-seed weight, and harvest index. In 2021, it was observed that all the traits measured were positively correlated to pod yield except days to physiological maturity (Figure 1). In terms of magnitude, the highest correlation coefficient was observed between pod yield and harvest index (r = 0.755 **), followed by pod yield and number of matured pods per plant (r = 0.697 **) in 2020. Again, pod yield and hundred-seed weight (r = 0.596 **) and pod yield and haulm yield (r = 0.360 *) followed in that order in the same year. In 2021, the highest correlation coefficient was observed between pod yield and hundred-seed weight (r = 0.710 **), followed by pod yield and number of matured pods per plant (r = 0.665 **) and pod yield and harvest index (r = 0.083 **).

3.4. Performance of the Genotypes

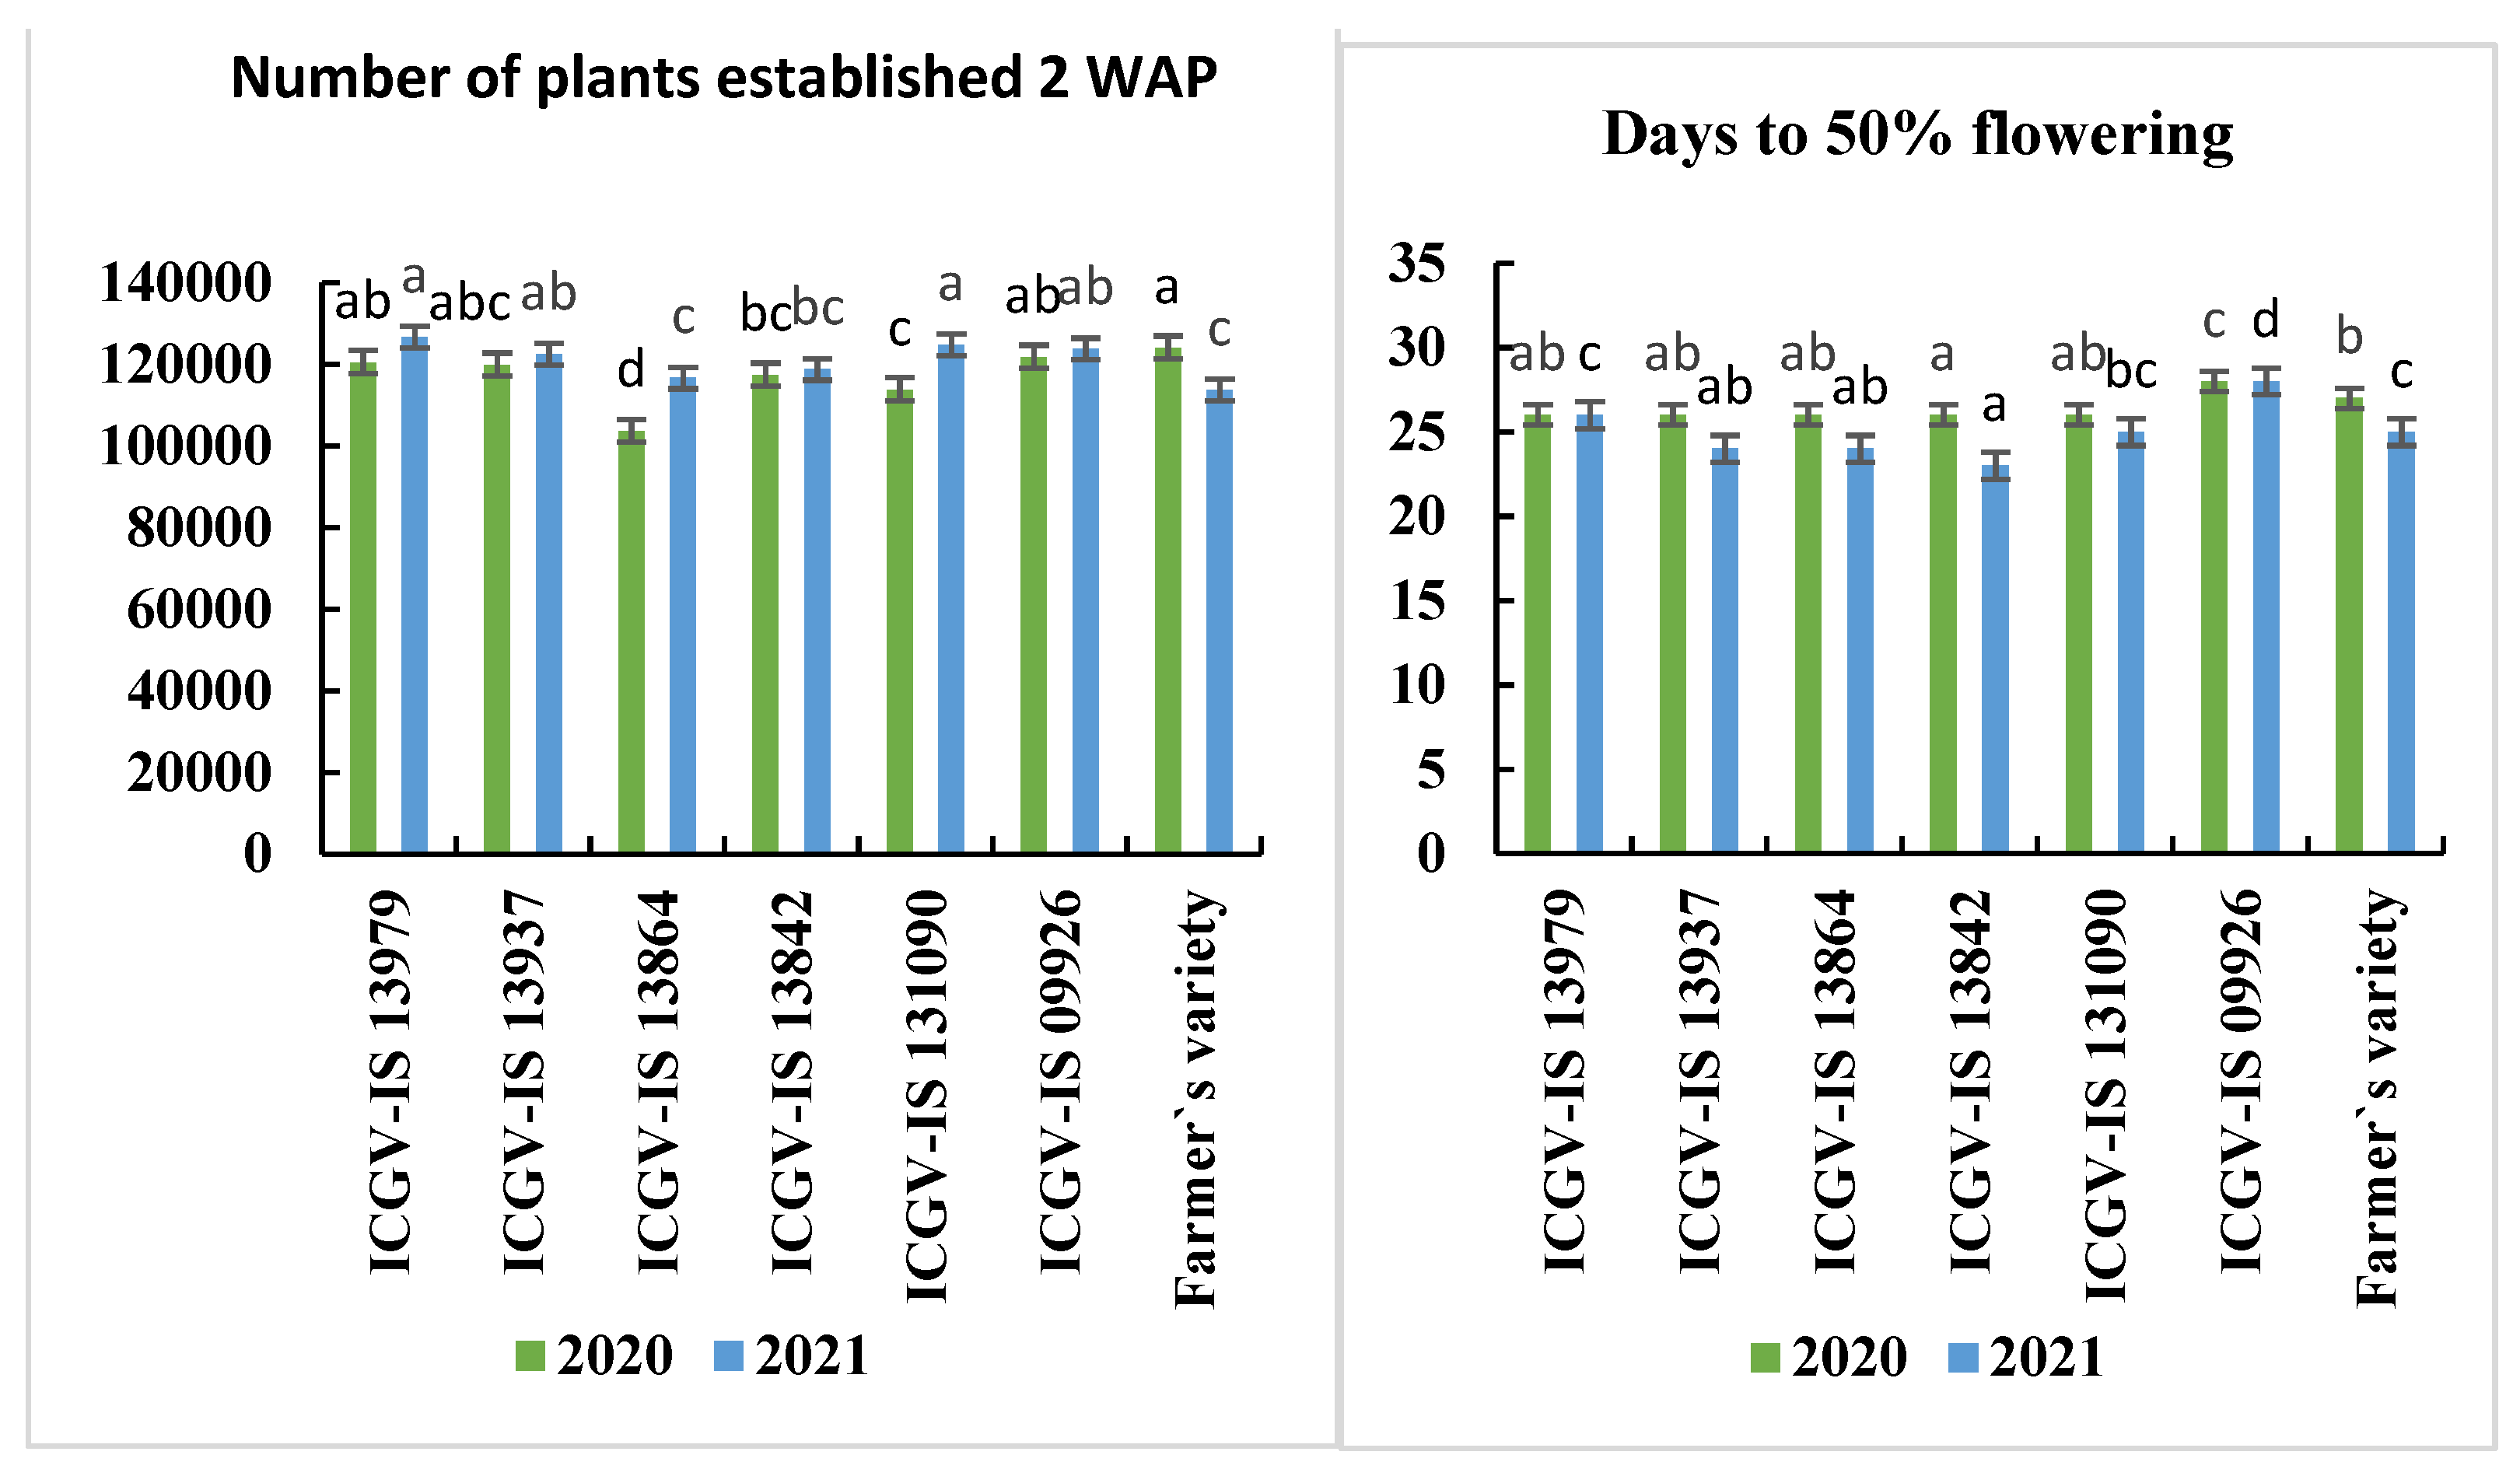
3.4.1. Number of Plants Established Two Weeks after Planting

Significant differences were observed among the genotypes for plant establishment. In the 2020 cropping season, farmers’ variety (F.V) was observed to have 123,958 plants/ha emerging two weeks after planting. This value was the highest number observed, but it did not differ statistically from genotypes ICGV-IS 09926 (121,667 plants/ha), ICGV-IS 13979 (1,204,167 plants/ha), and ICGV-IS 13937 (119,792 plants/ha) (Figure 2). Genotype ICGV-IS 13864 was observed to have the poorest plant stand of 103,542 plants/ha. With an average of 120,982 plants/ha emerging in the 2021 cropping season, emergence among the varieties was generally higher in 2021 than in the 2020 cropping season. In the 2021 cropping season, the number of plants emerging from the farmers’ variety two weeks after planting was 113,750 plants/ha, which is lower than that recorded in 2020. Genotypes ICGV-IS 13979 and ICGV-IS 131090 had 126,667 and 124,792 seedlings emerging two weeks after planting in 2021, respectively.

3.4.2. Days to 50% Flowering

Significant differences (p < 0.05) were observed among the genotypes evaluated in this study in both growing seasons. In the 2020 growing season, genotype ICGV-IS 13842 was the first to reach 50% flowering with an average of 25.6 days, followed by genotypes ICGV-IS 13979, ICGV-IS 13937, ICGV-IS 13864, and ICGV-IS 131090 (Figure 2). Genotype ICGV-IS 09926 took the longest period (28 days) to flower, followed by the farmers’ variety. A similar trend was observed during the 2021 growing season, where genotype ICGV-IS 13842 reached 50% flowering earlier in 23.3 days, whereas genotype ICGV-IS 09926 took the longest mean period (28 days). Generally, the genotypes reached 50% flowering earlier in the 2021 growing season compared to the 2020 growing season.

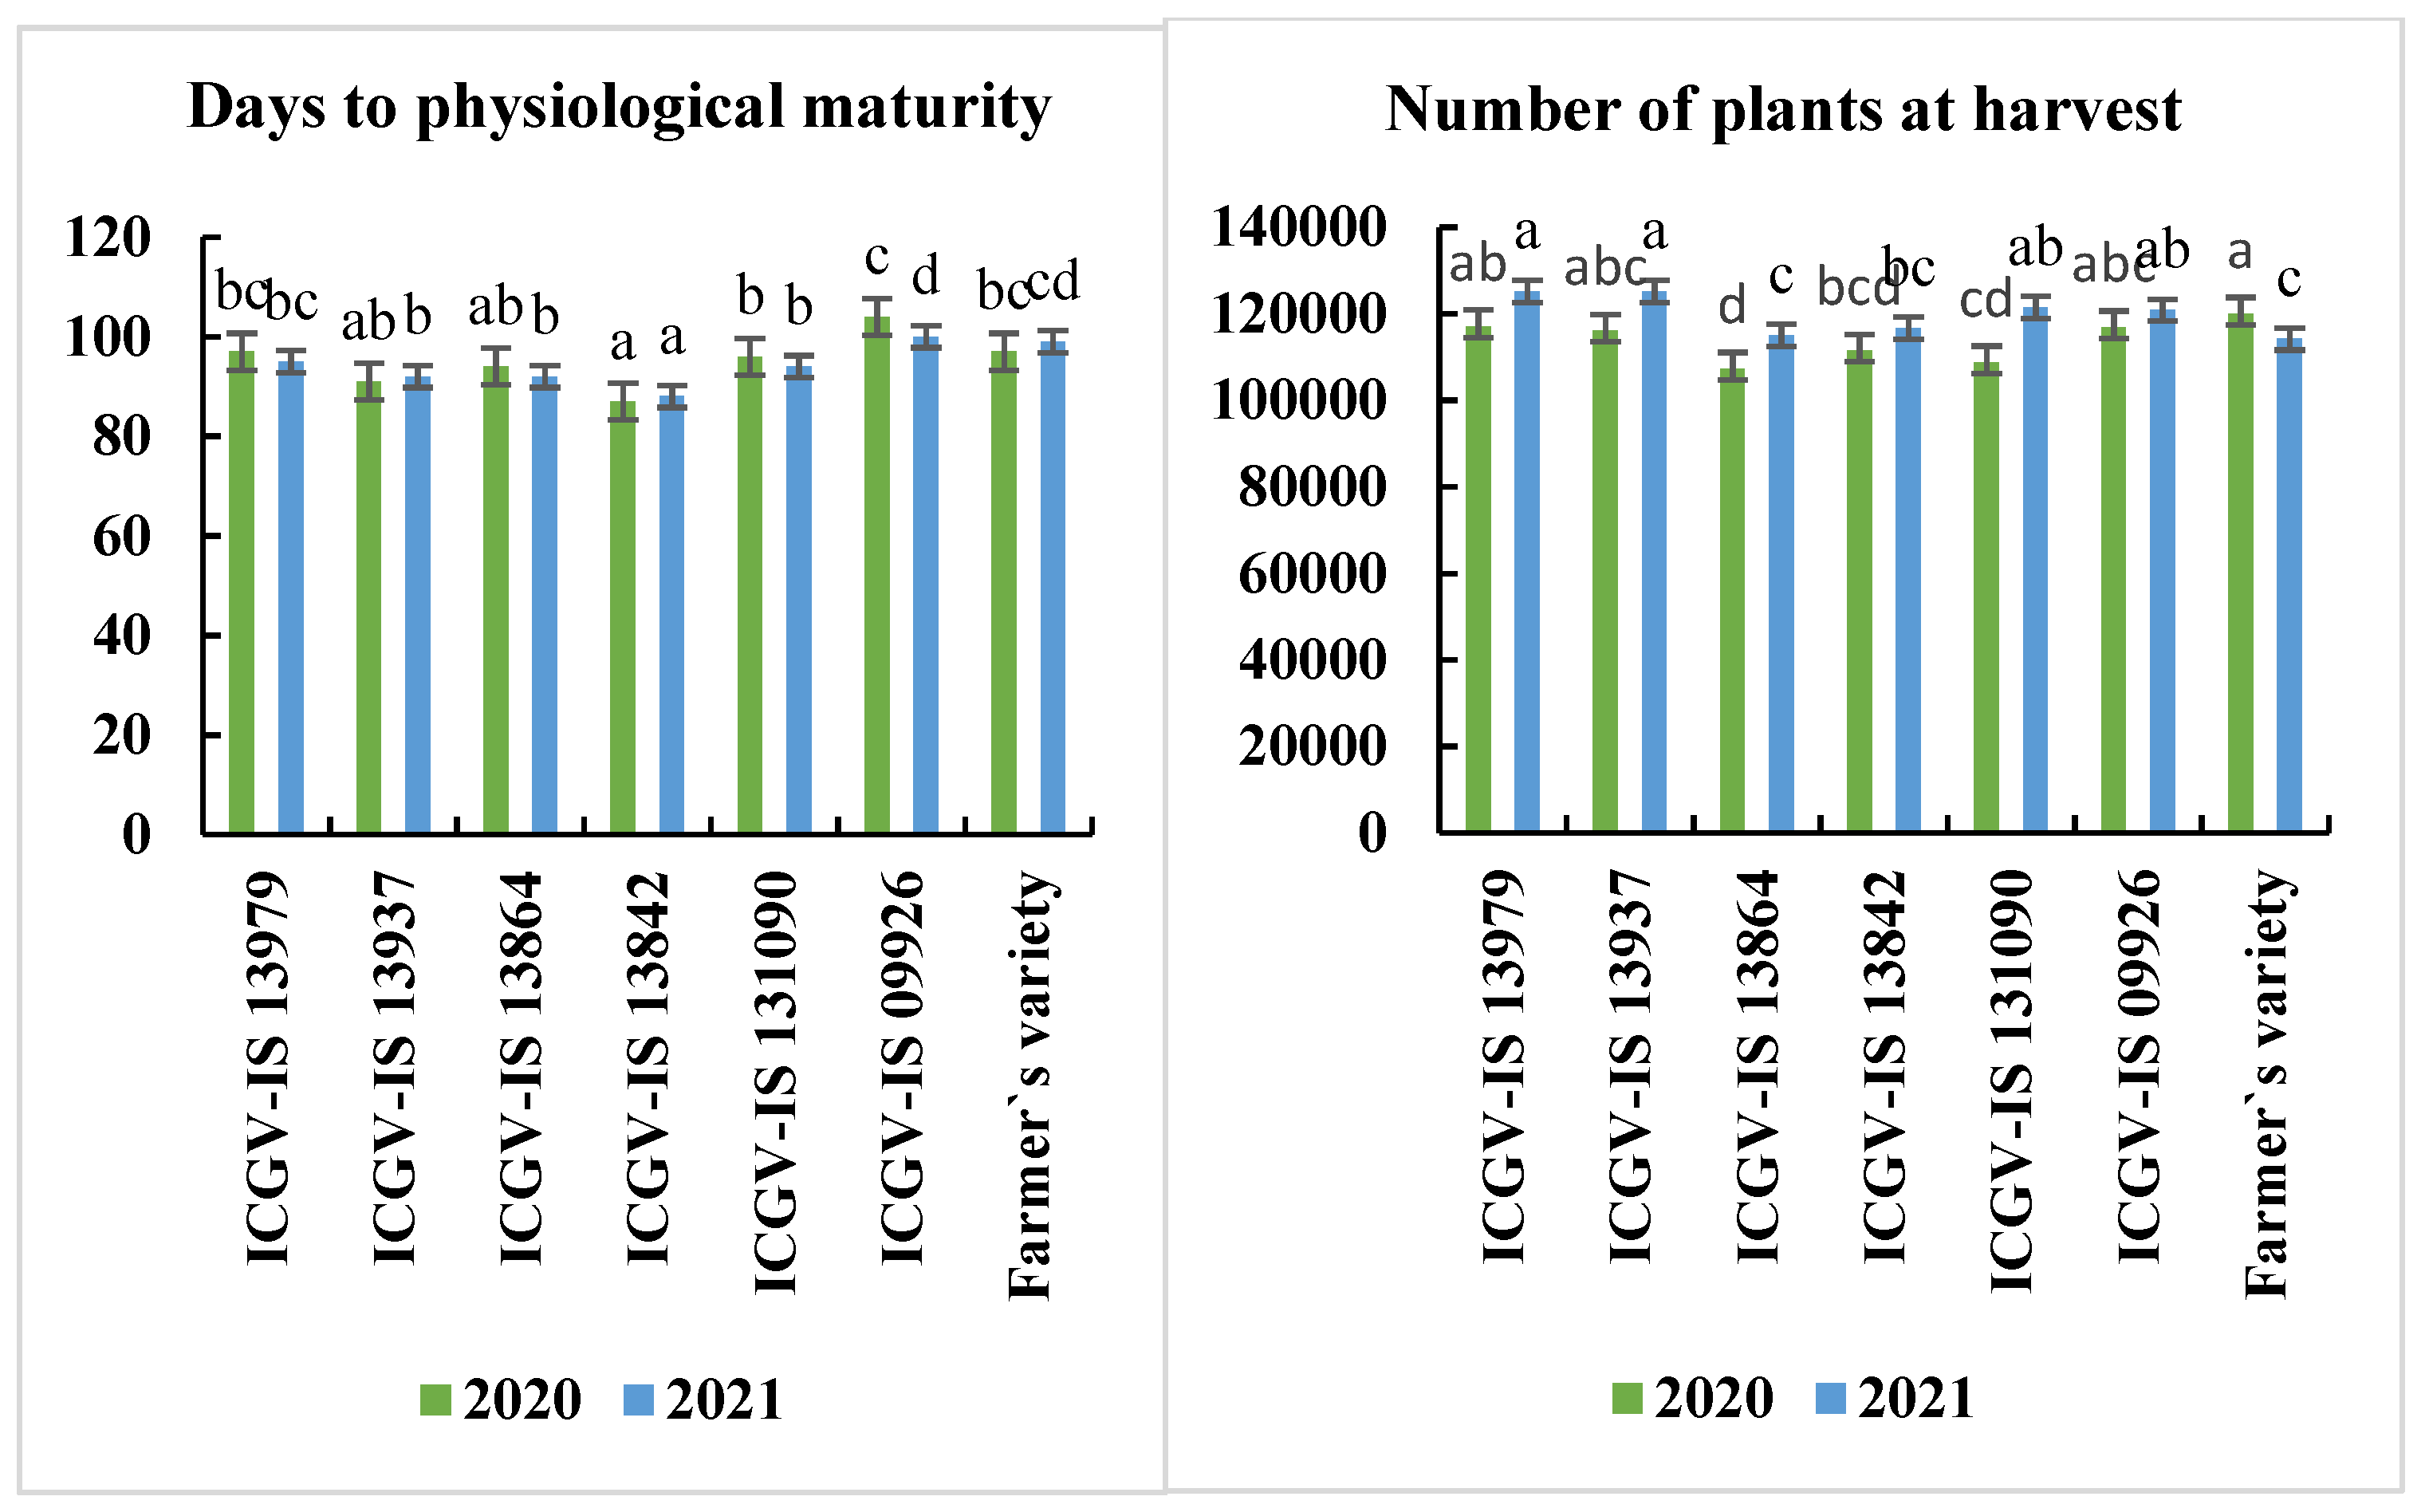
3.4.3. Days to Physiological Maturity

Harvesting groundnuts at the correct time is crucial for successful postharvest handling and expression of traits like high oleic acid. In both years, significant differences (p < 0.05) were observed among the genotypes (Figure 3). During the 2020 cropping season, it took between 87 and 104 days after planting for the crops to reach physiological maturity. The genotype ICGV-IS 13842 was the first to reach maturity in 87 days, while genotype ICGV-IS 09926 was the last to reach maturity in 104 days. During the 2021 cropping season, physiological maturity was achieved earlier compared to 2020, with a range of 88–100 days after planting. Like the trend observed in the 2020 cropping season, genotype ICGV-IS 13842 reached physiological maturity earliest, while ICGV-IS 09926 reached the same stage latest.

3.4.4. Number of Plants at Harvest

During the 2020 cropping season, the farmers’ variety had the highest number of plants at harvest, with 120,000 plants per hectare. This result was significantly different from the other genotypes, except for ICGV-IS 13979, with 117,083 plants per hectare; ICGV-IS 09926, with 116,875 plants per hectare; and ICGV-IS 13937, with 116,042 plants per hectare, as shown in Figure 3. Genotype ICGV-IS 13864 had a significantly lowest number of plants at harvest (107,292 plants/ha) but was statistically similar to genotypes ICGV-IS 13842 (111,458 plants/ha) and ICGV-IS 131090 (108,750 plants/ha). In the 2021 growing season, genotypes ICGV-IS 13979 and ICGV-IS 13937 had significantly more plants at harvest than the other genotypes. Farmers’ variety had significantly fewer plants at harvest.

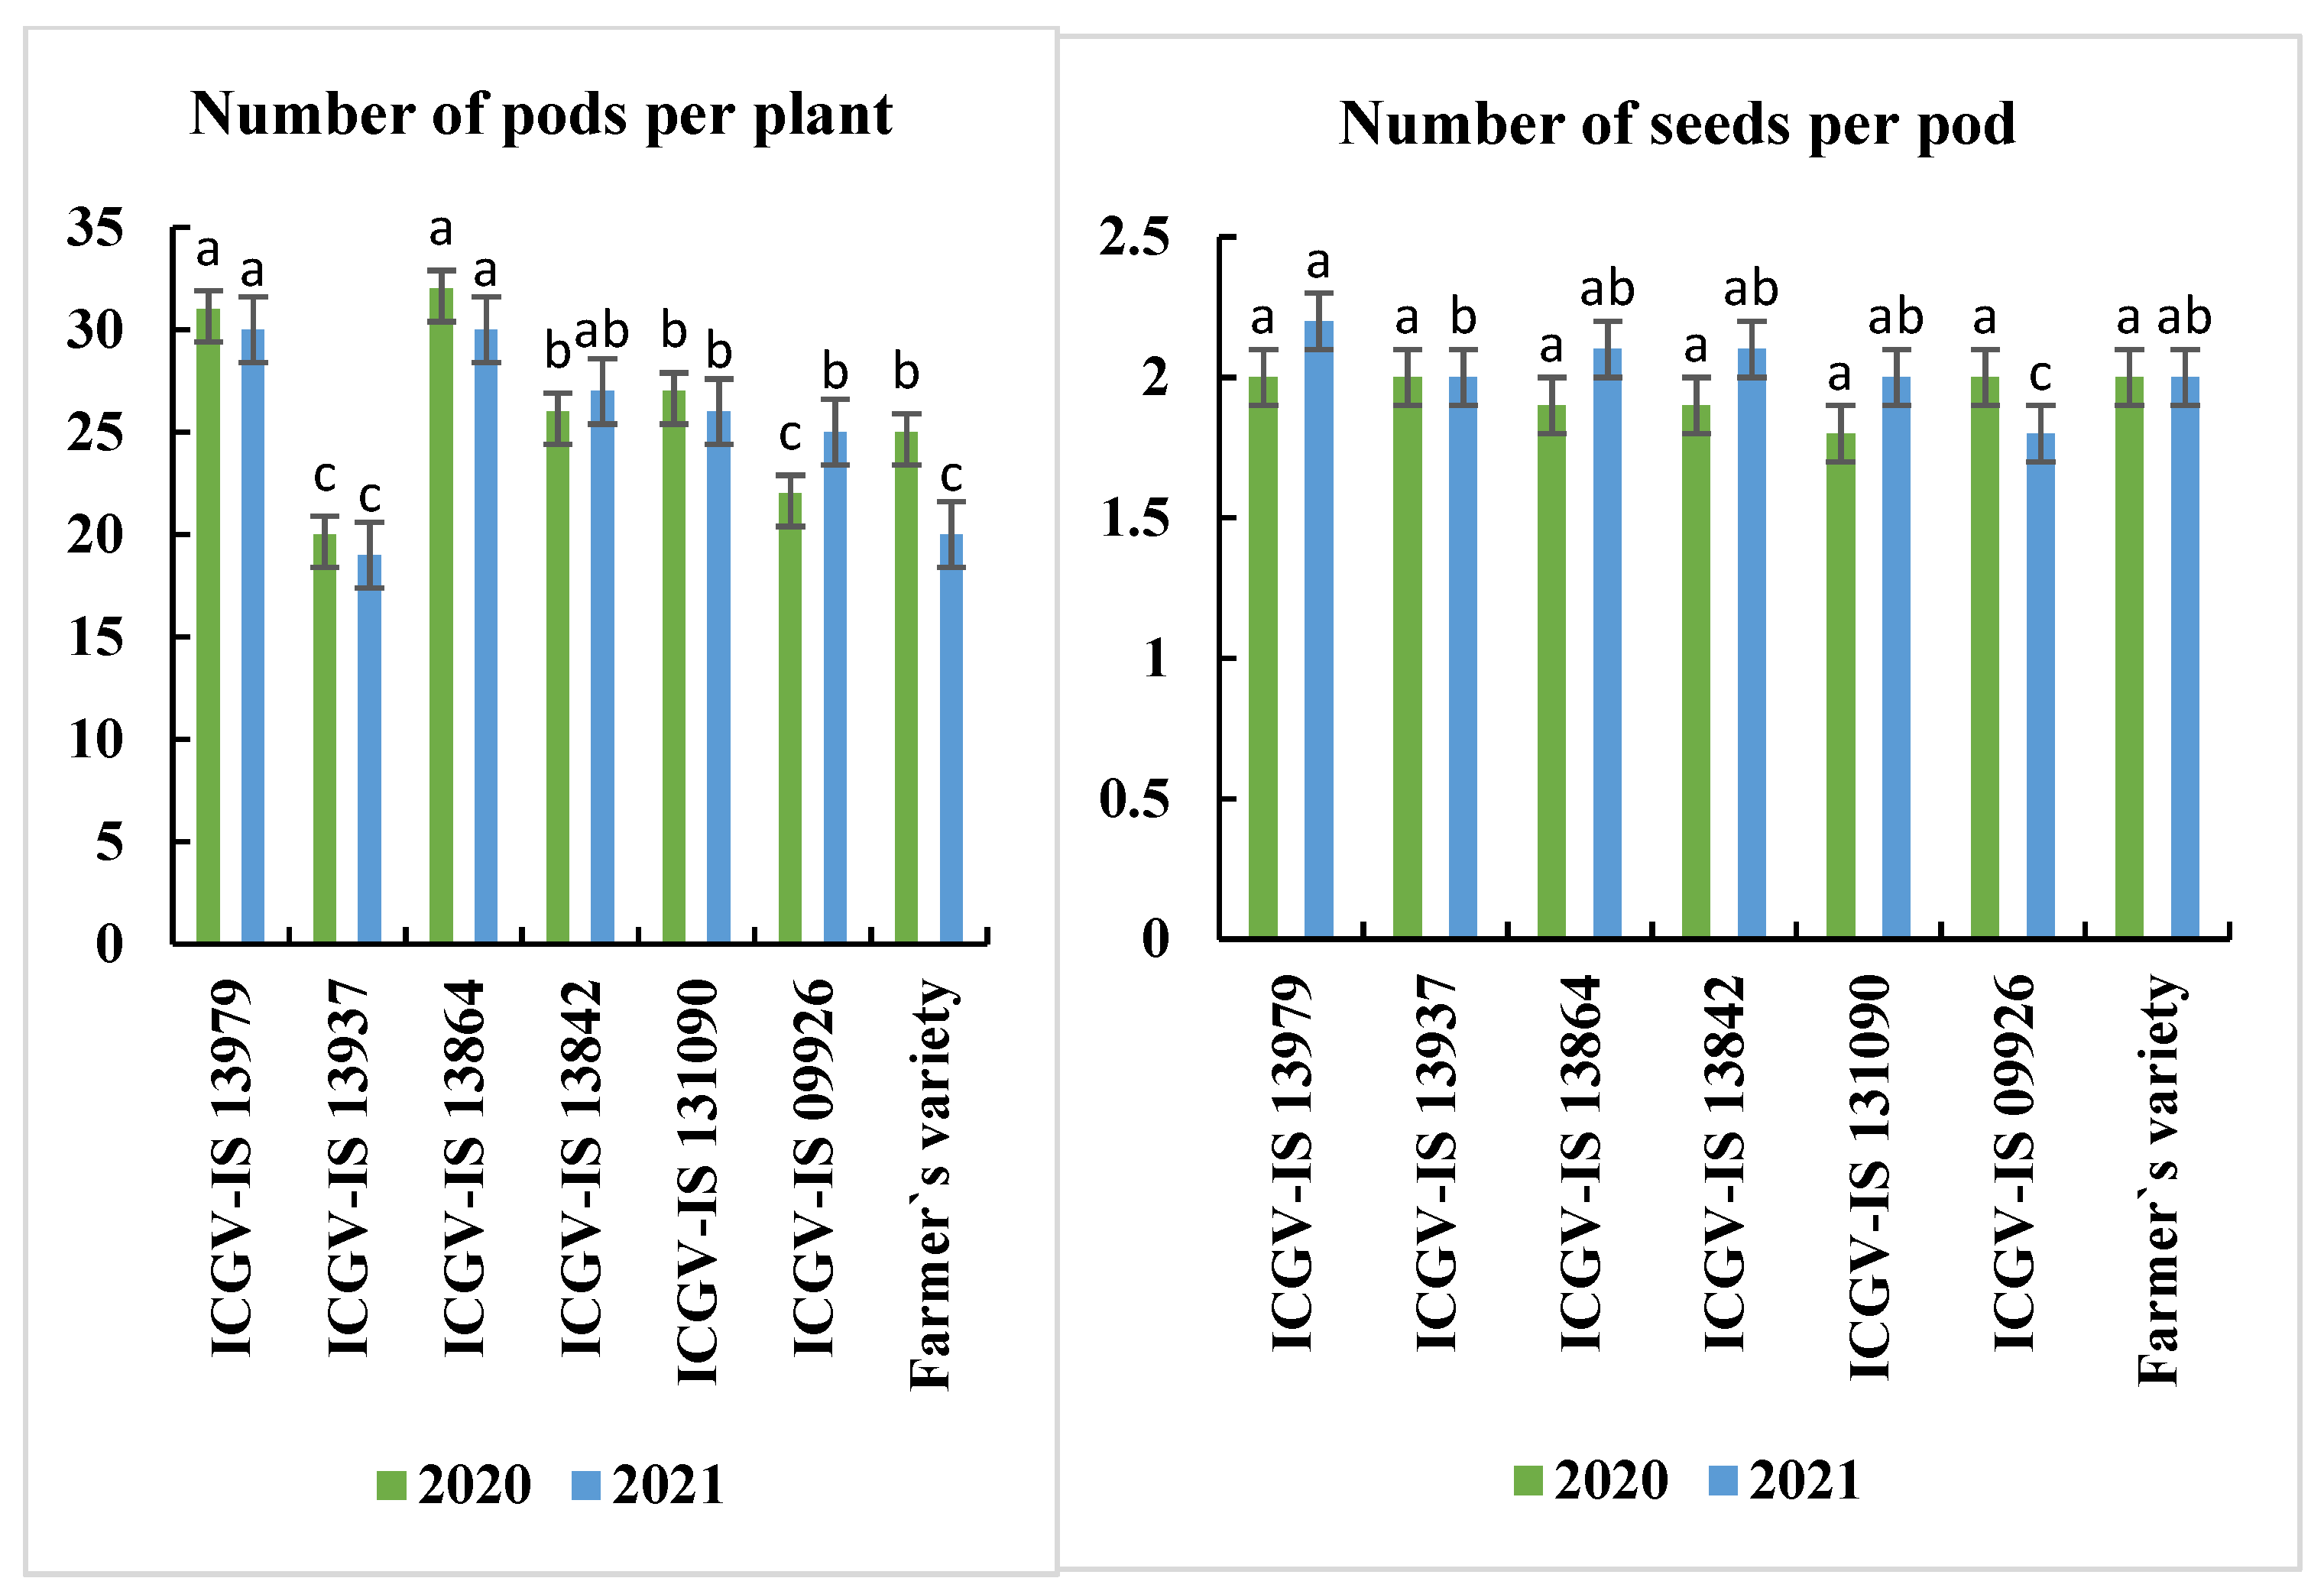
3.4.5. Number of Pods per Plant

During the 2020 cropping season, the genotype ICGV-IS 13864 produced significantly more pods per plant (32.3 pods) than the other genotypes and the farmers’ variety, except for genotype ICGV-IS 13979 (30.8 pods) (Figure 4). The lowest number of pods per plant (20.5 pods) was recorded in relation to genotype ICGV-IS 13937 (Figure 4). However, in the 2021 cropping season, genotype ICGV-IS 13979 produced more pods per plant (30 pods), which was followed by genotype ICGV-13864 (29.7). Genotype ICGV-IS 13937 produced significantly fewer pods per plant (19.3), which was followed closely by the farmers’ variety (20 pods).

3.4.6. Number of Seeds per Pod

The number of seeds per pod ranged from 1.8 to 2.1 in the 2020 cropping season. However, there was no significant difference observed among the genotypes in that year. In the 2021 cropping season, significant differences were observed among the genotypes in this study (Figure 4). Among the genotypes, ICGV-IS 13979 significantly had the highest number of seeds per pod (2.2 seeds), whereas genotype ICGV 09926 obtained the lowest number of seeds per pod (1.8 seeds) during the 2021 cropping season. However, apart from genotype ICGV 09926, there was no significant difference between all the genotypes and the farmers’ variety.

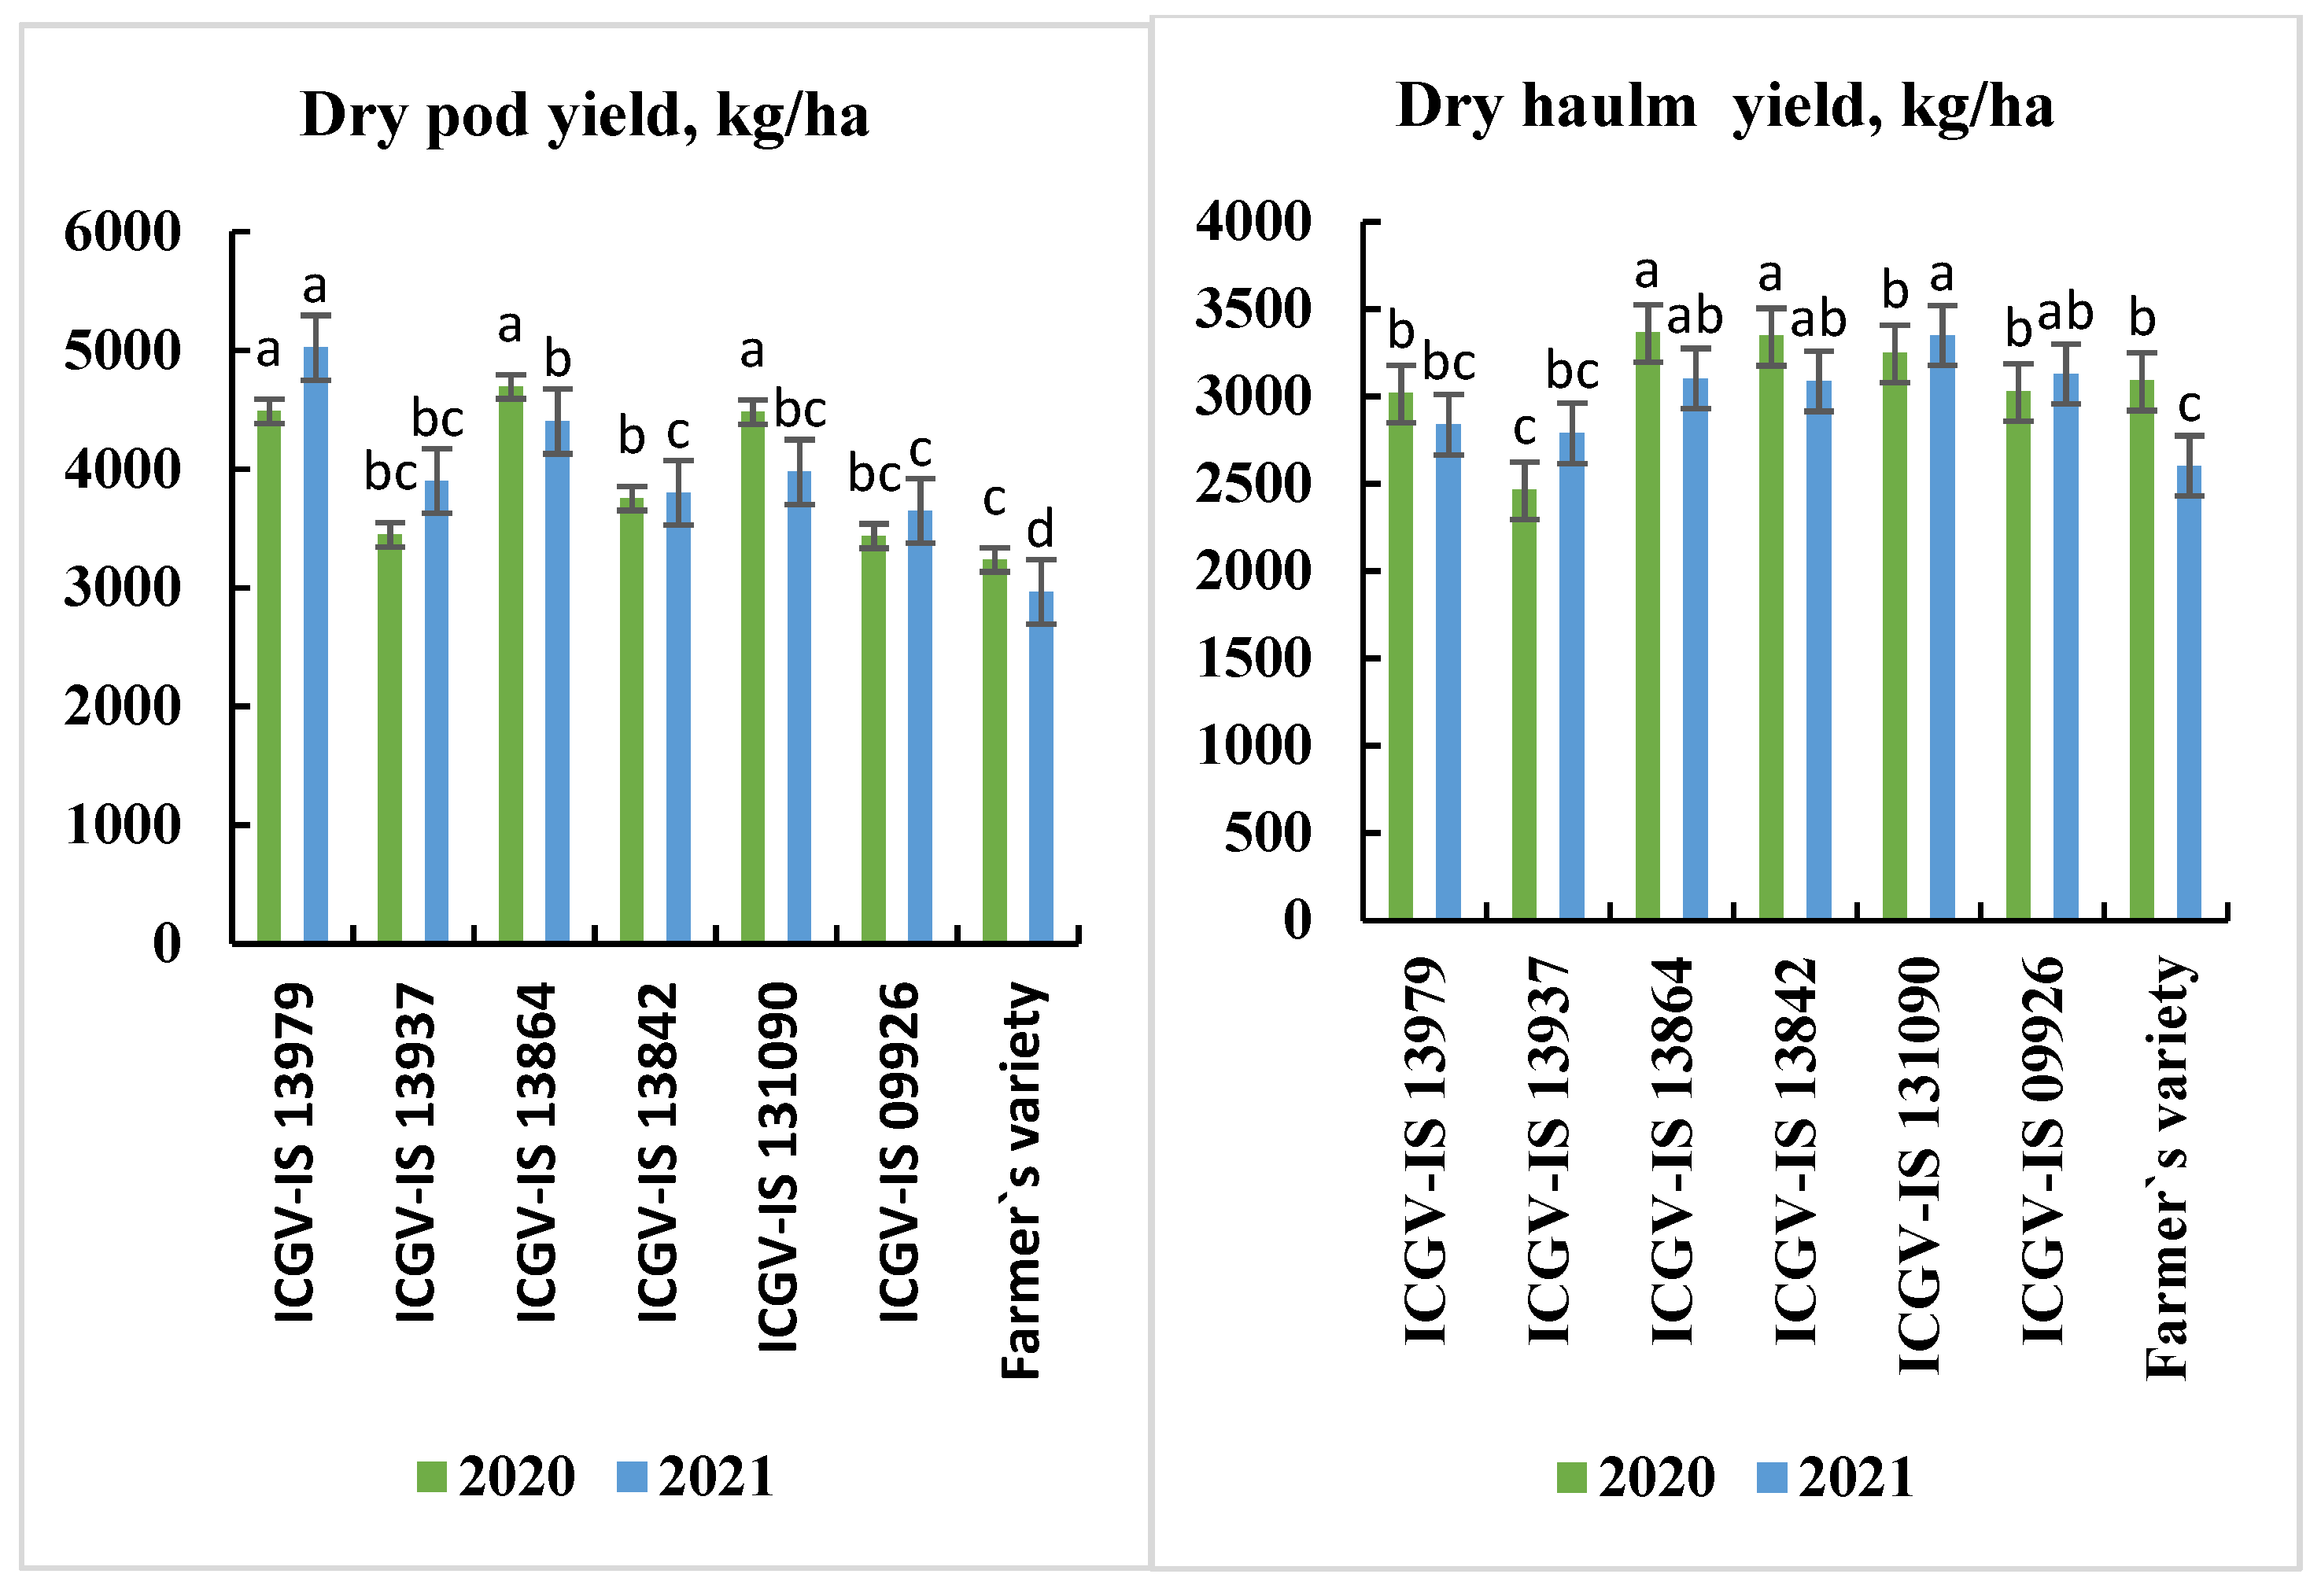
3.4.7. Dry Pod Yield

During the 2020 cropping season, the highest pod yield of 4693.6 kg/ha was observed in the genotype ICGV-IS 13864, and this was significantly higher than pod yields of genotypes ICGV-IS 13842 (3753.1 kg/ha), ICGV-IS 13937 (3446.8 kg/ha), ICGV-IS 09926 (3436.4 kg/ha) and farmers’ variety (3236.5 kg/ha). However, it was statistically similar with genotypes ICGV-IS 13979 (4488.0 kg/ha) and ICGV-IS 131090 (4479.9 kg/ha). Farmers’ variety significantly produced the lowest pod yield compared to all the genotypes evaluated (Figure 5). In the 2021 cropping season, genotype ICGV-IS 13979 obtained the highest pod yield of 4658.5 kg/ha. However, it did not differ significantly from genotypes ICGV-13864 (4401.6 kg/ha) and ICGV-IS 131090 (3975.2 kg/ha). Significantly, the farmer’s variety obtained the lowest pod yield of 2936.5 kg/ha.

3.4.8. Haulm Yield

Significant differences were observed between the test genotypes and the farmers’ variety. Genotype ICGV-IS 13864 (3367.7 kg/ha) significantly outyielded genotypes ICGV-IS 13979 (3020.7 kg/ha), ICGV-09926 (3030.4 kg/ha) and ICGV-IS 13937 (2467.8 kg/ha) during 2020 cropping season, with the farmers’ variety significantly obtaining the lowest haulm yield of 2603.1 kg/ha (Figure 5). In the 2021 cropping season, genotype ICGV-IS 131090 had the highest haulm yield of 3349.1 kg/ha; however, it was statistically similar to genotypes ICGV-09926 (3129.5 kg/ha), ICGV-13864 (3103.1 kg/ha) and ICGV-IS 13842 (3086.8 kg/ha). Significantly, genotype ICGV-IS 13937 obtained the lowest haulm yield of 2489.1 kg/ha.

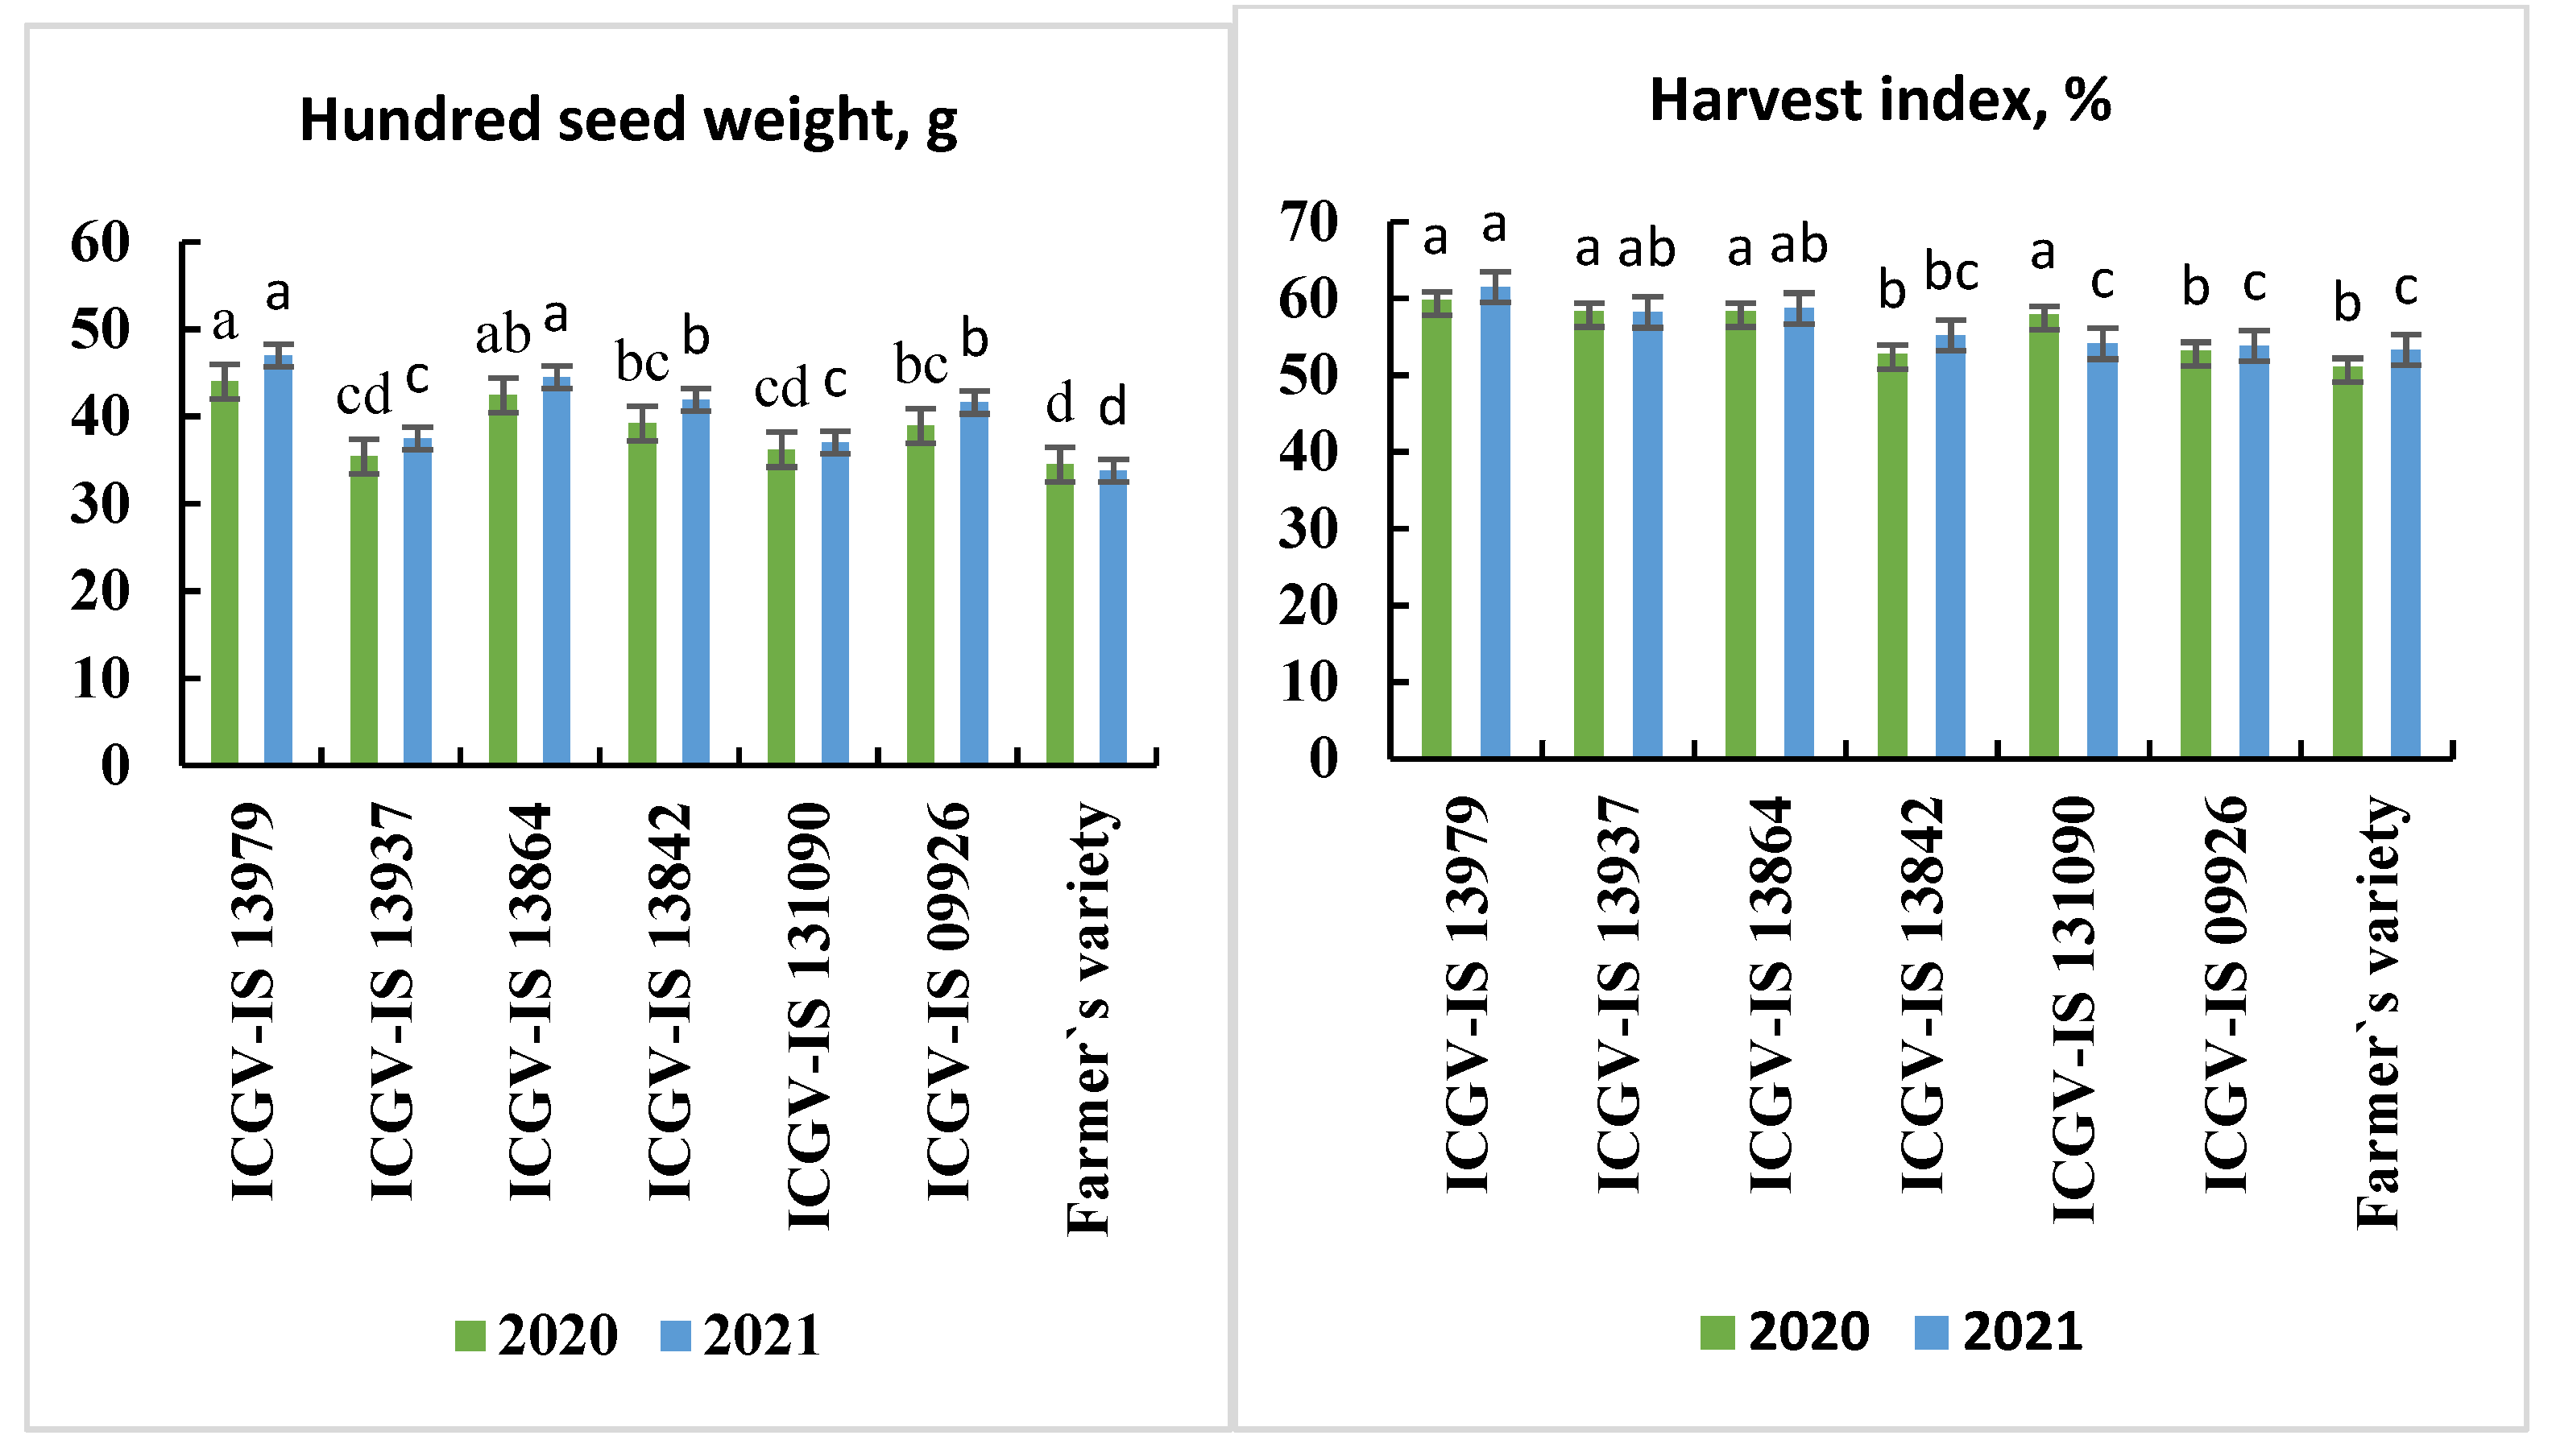
3.4.9. Hundred-Seed Weight

During the 2020 growing season, genotype ICGV-IS 13979 produced significantly heavier seeds of 44 g than all the other genotypes except for genotype ICGV-IS 13864 (42 g). Significantly, the lightest seed (34 g) was produced by the farmers’ variety, and it was significantly different from all the genotypes evaluated (Figure 6). A similar trend was observed during the 2021 growing season, whereby genotype ICGV-IS 13979 Significantly produced the heaviest seeds (46 g) but was statistically at par with genotype ICGV-IS 13864 (44 g) whereas the lightest seeds were obtained from the farmers’ variety (33.7 g).

3.4.10. Harvest Index

In the 2020 growing season, the genotype ICGV-IS 13979 had the highest harvest index of 0.60. However, genotypes ICGV-IS 13937, ICGV-IS 131090, and ICGV-IS 13864 also had statistically similar harvest indexes of 0.58. The farmers’ variety had the lowest harvest index of 0.51, which was significantly lower than all the other genotypes (Figure 6). Similarly, in the 2021 cropping season, the genotype ICGV-IS 13979 had the highest harvest index of 0.61, which was significantly higher than the harvest indexes of all other genotypes except for genotypes ICGV-IS 13937 (0.58) and ICGV-IS 13864 (0.59). Again, the farmers’ variety had the lowest harvest index of 0.53.

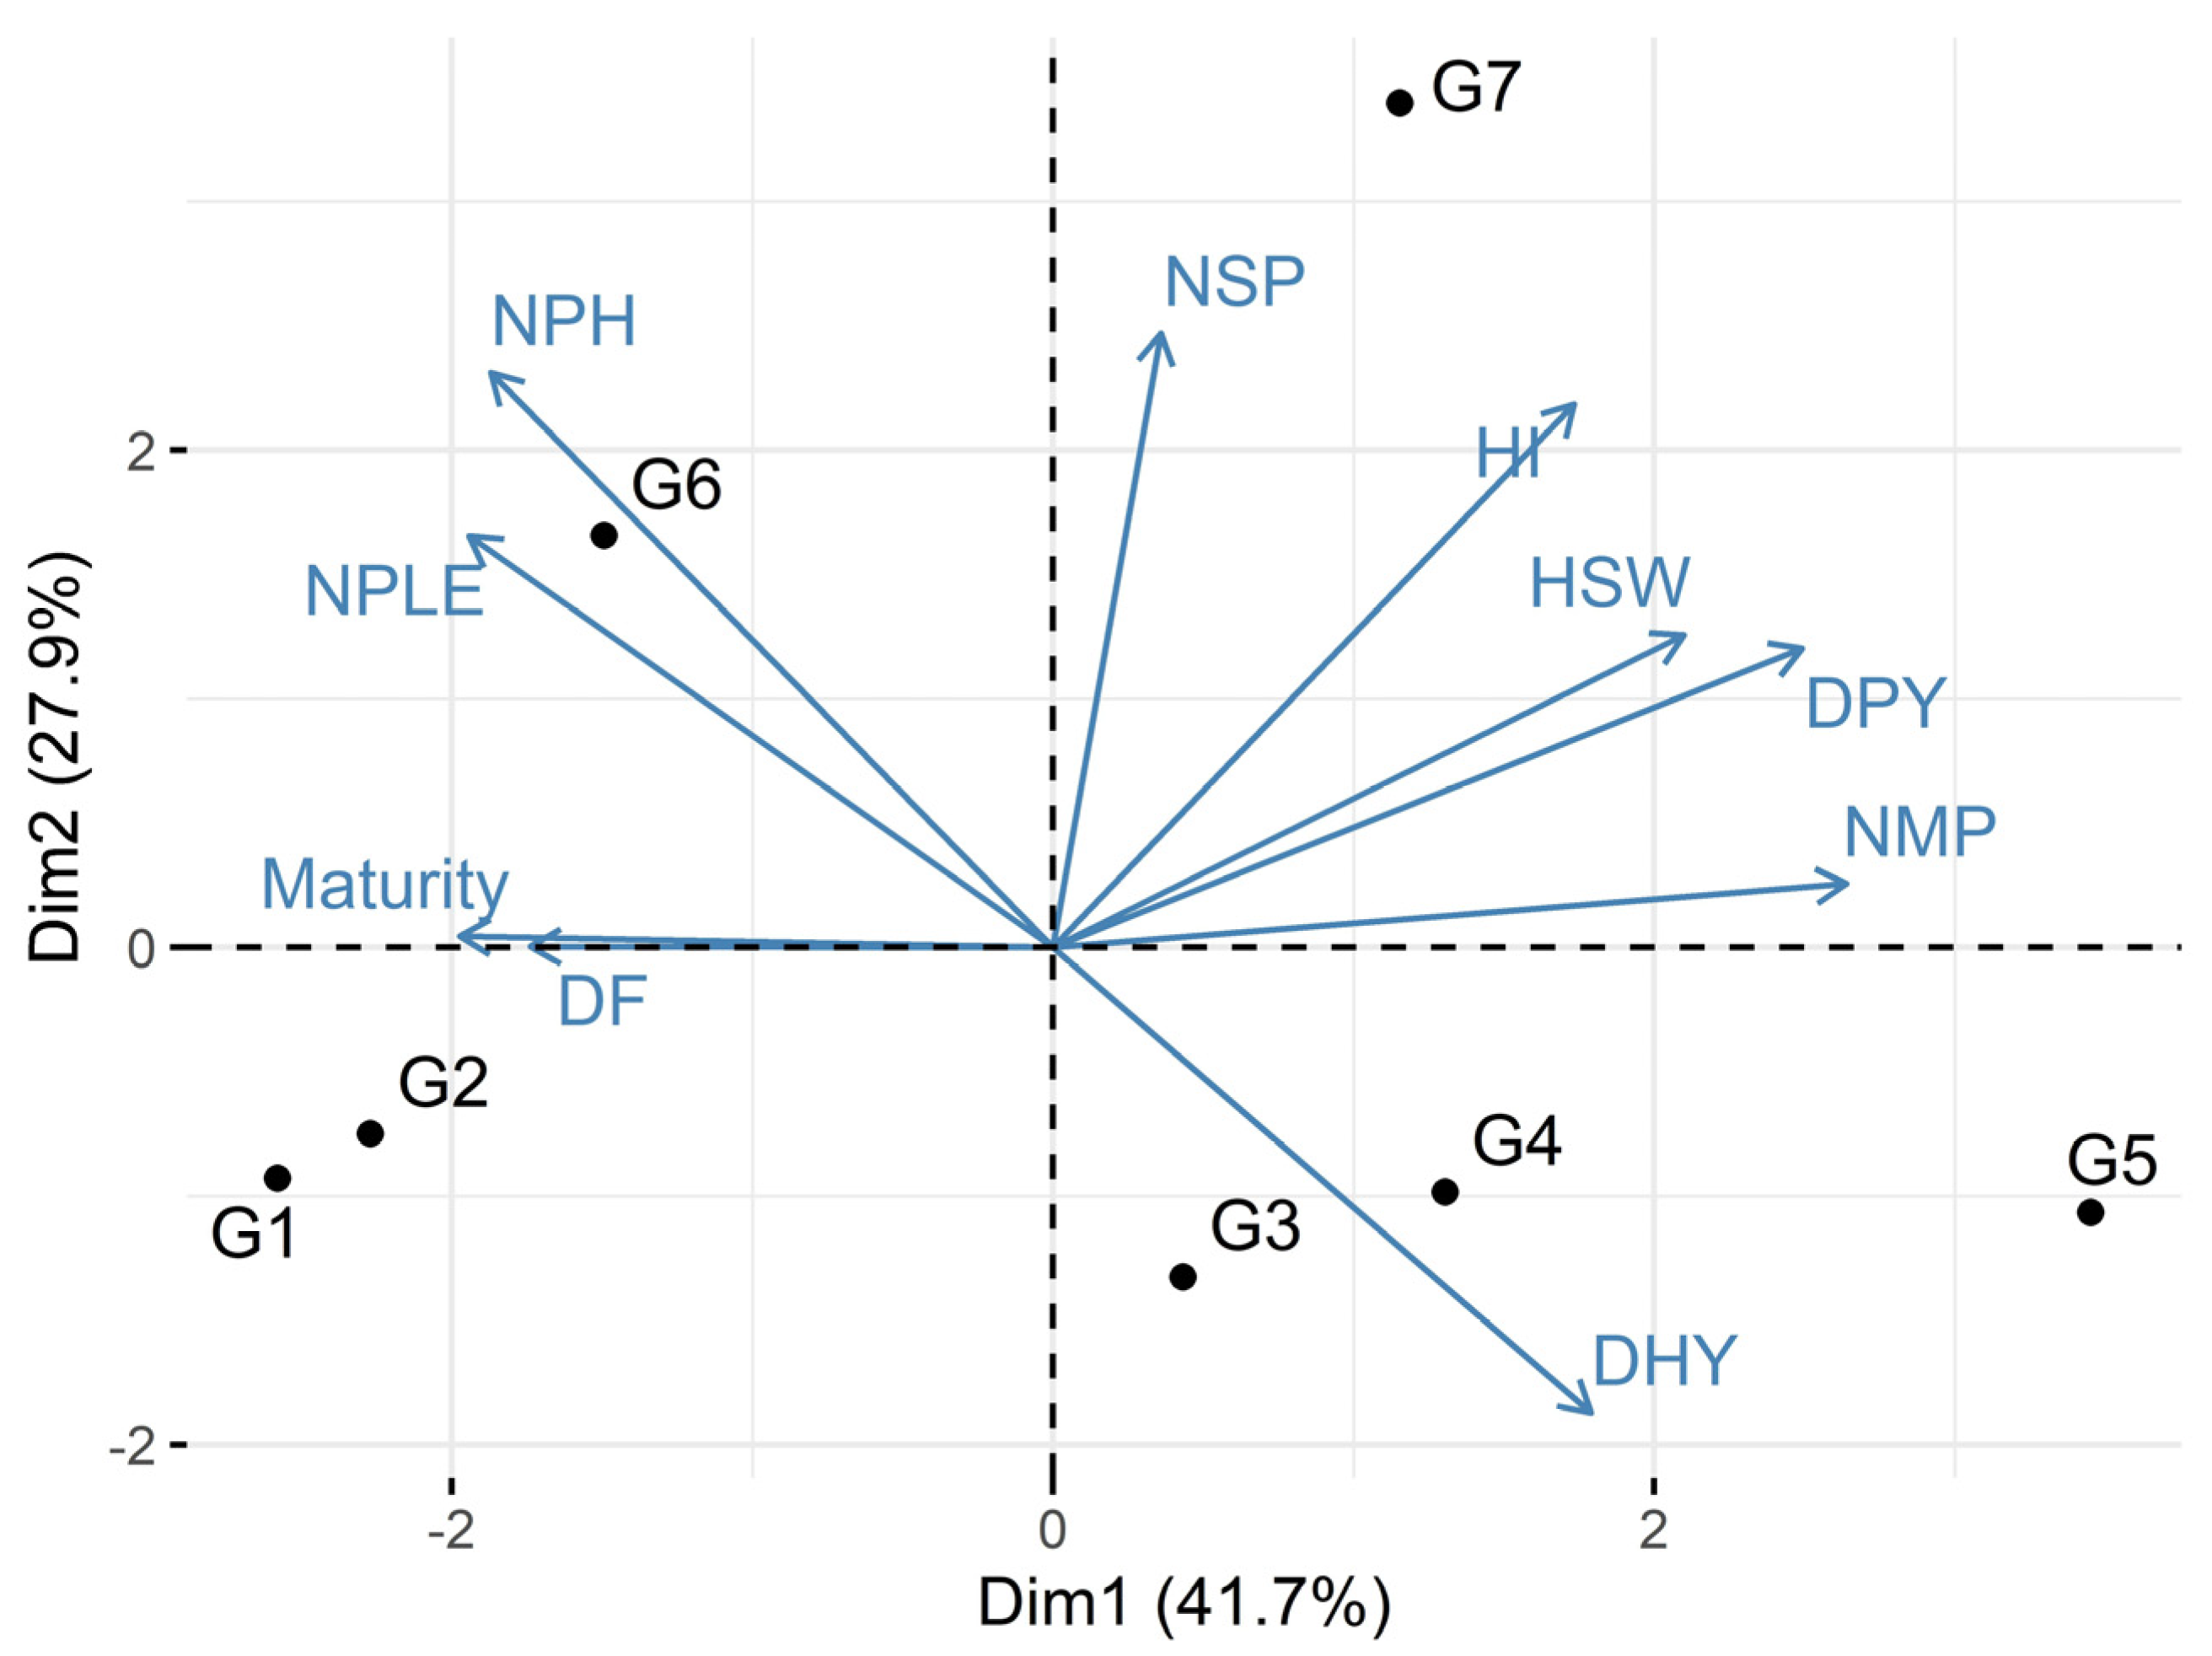
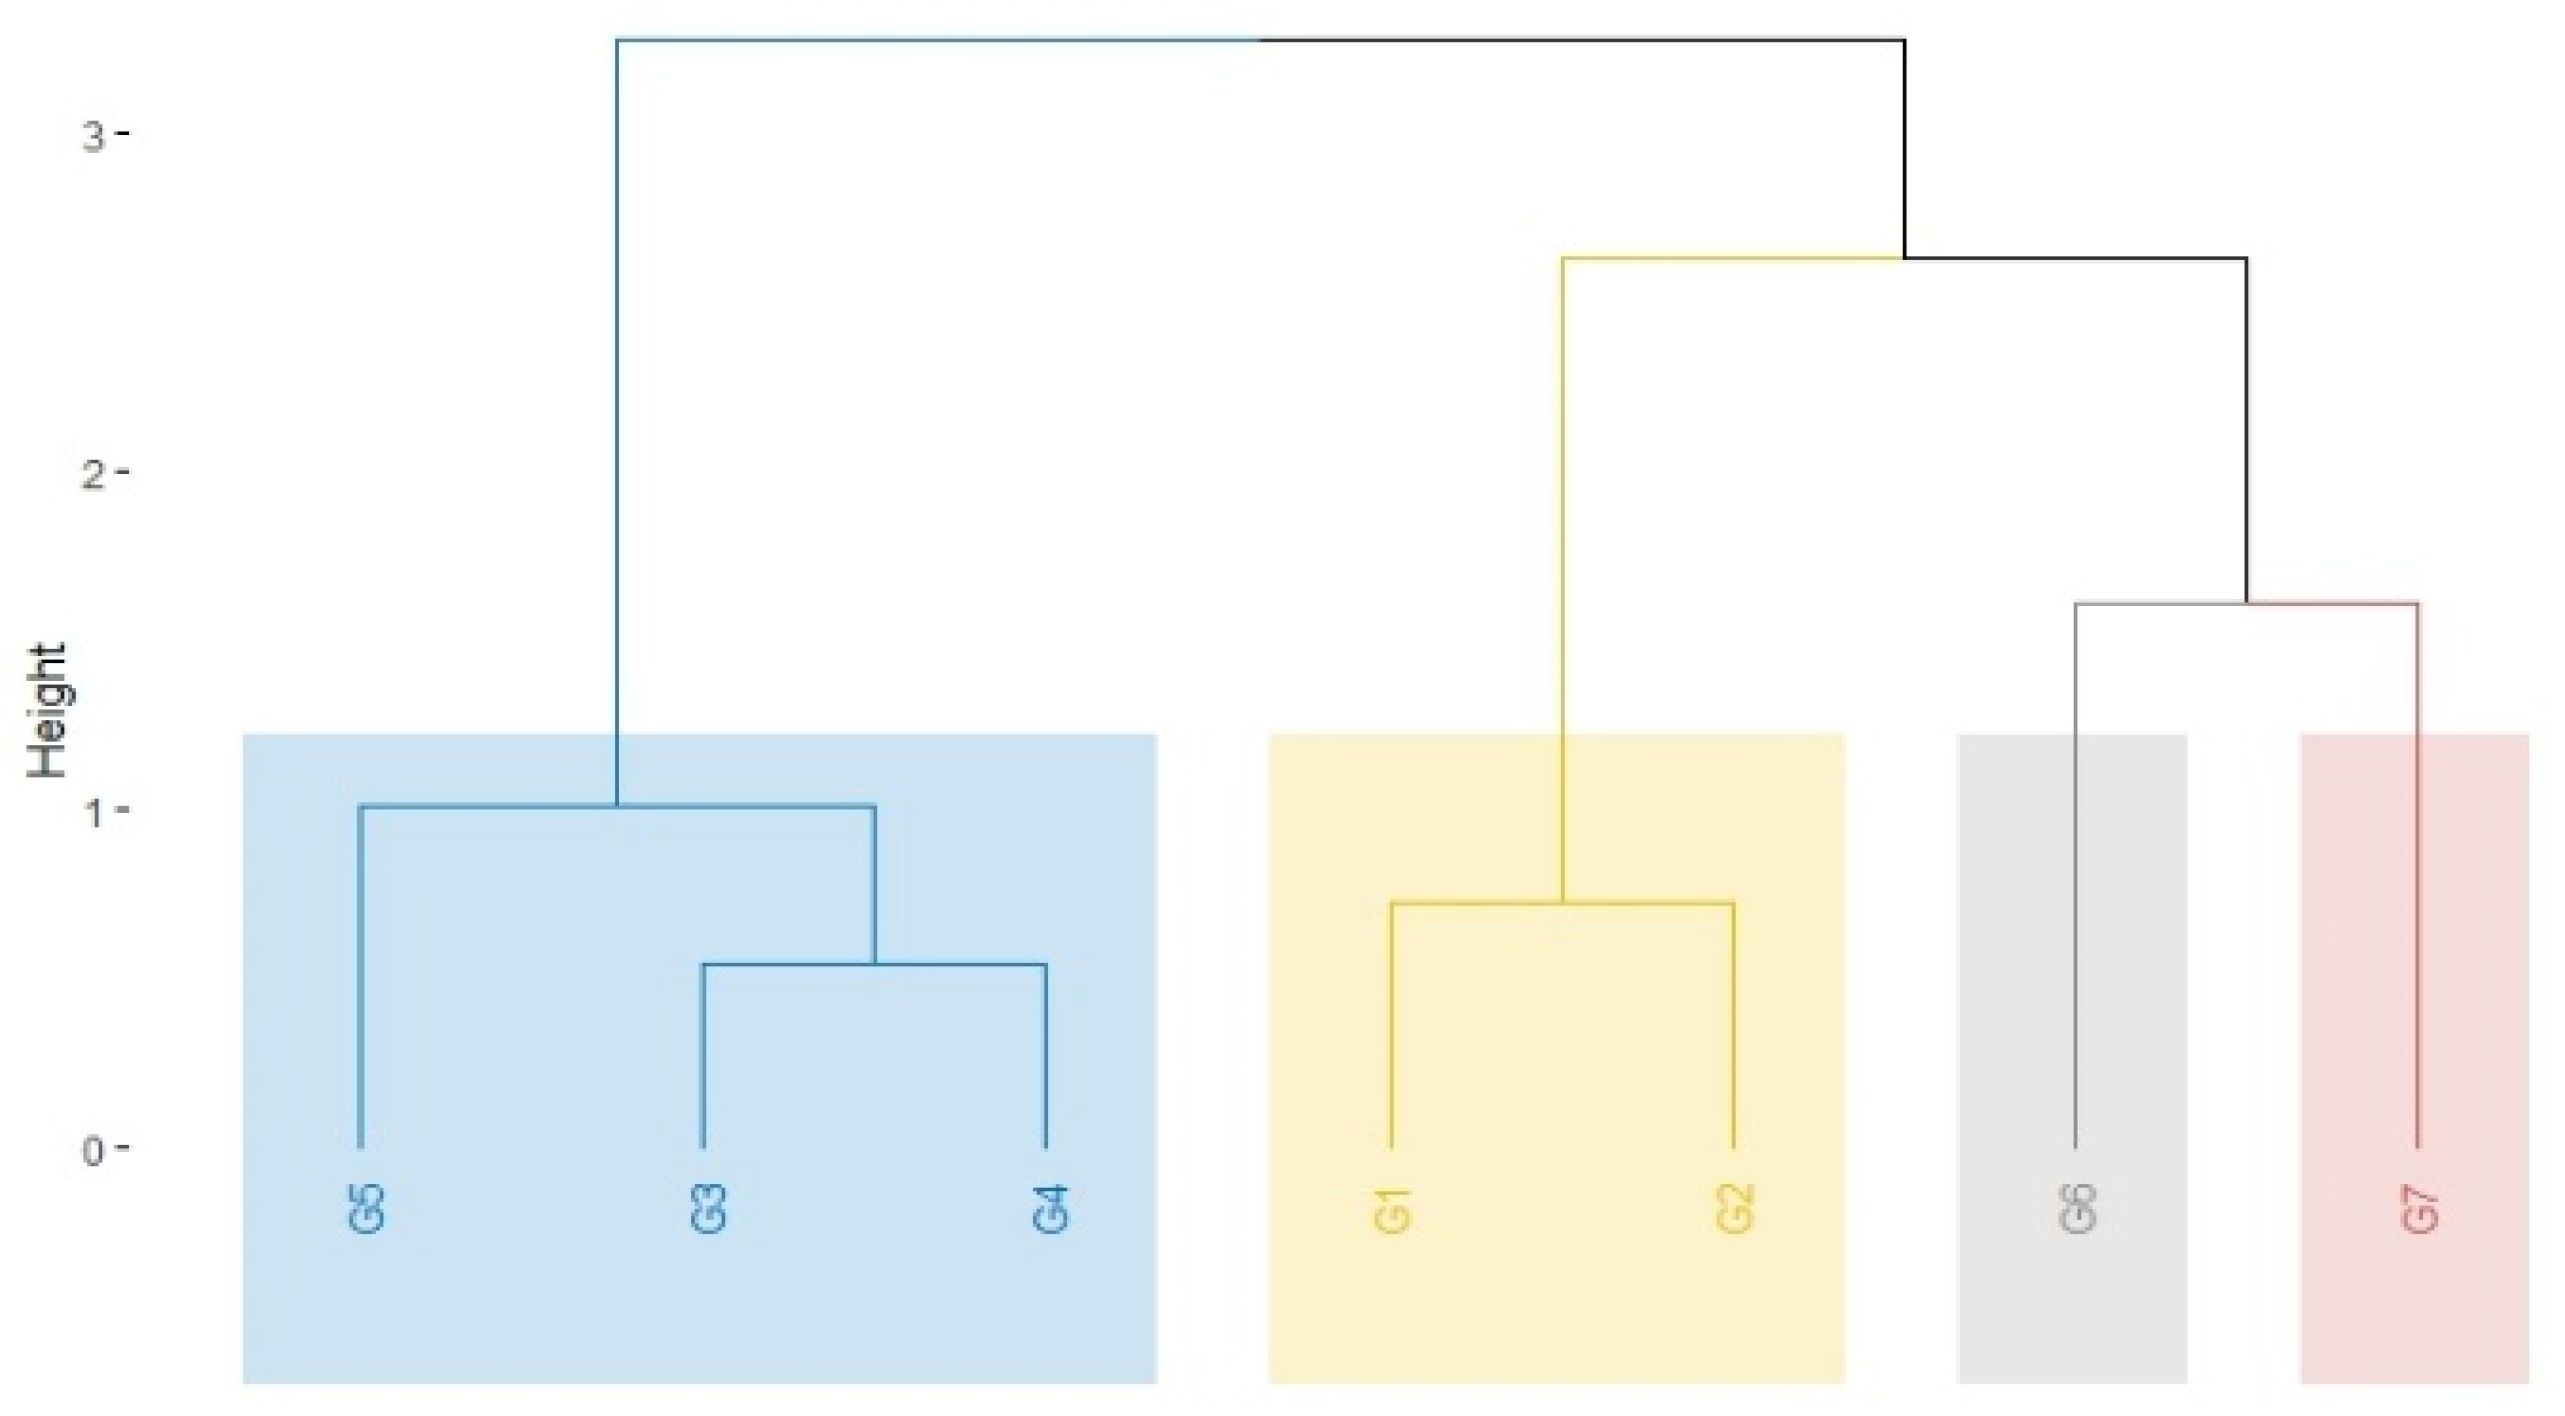
3.4.11. Principal Component Analysis and Cluster Analysis

The morphological data were subjected to principal component analysis (PCA) to identify traits that revealed the most variation among the genotypes. Principal components (PC) one, two, and three contributed 41.65%, 27.84%, and 19.18%, respectively, to the total variation (Supplementary Table S1). Cumulatively, PC one and two accounted for 69.49% of the total variation observed among the genotypes, while principal components one to three accounted for 86.68% (Supplementary Table S1). The PCA biplot revealed how the variances of the traits were associated, with traits within the same quadrant having a degree of association (Figure 7). The dendrogram of hierarchical cluster analysis grouped the genotypes into four clusters indicated by the different coloration (Figure 8).

3.4.12. Ranking of the Genotypes

During the physiological maturity stage of groundnuts, a field day was held where a total of 87 farmers, consisting of 51 males and 36 females, were present. These farmers included those who participated in the trials and those who did not. They shared their opinions on the performance of the genotypes. The key criteria used by the farmers to select and rank the genotypes, in order of importance, were pod yield, seed size, earliness, haulm yield, number of pods per plant, and plant stand. Table 3 presents the results of the evaluation conducted by farmers. Most farmers ranked ICGV-IS 13937 as the top genotype for a good plant stand, followed by ICGV-IS 13979 and ICGV-IS 09926. On the other hand, ICGV-IS 13864 was ranked seventh in this regard. In terms of earliness, ICGV-IS 13842 was ranked first by the farmers, followed by ICGV-IS 13937 and ICGV-IS 13864. Farmers’ variety and ICGV-IS 09926 were ranked lowest, at sixth and seventh, respectively. Most farmers ranked ICGV-IS 13979 as the most preferred variety in terms of pod yield, followed by ICGV-IS 13864 and then ICGV-IS 131090. The farmers’ variety was ranked last, followed by ICGV-IS 09926. Based on haulm yield, most farmers ranked ICGV-IS 131090 as the top performer, followed by ICGV-IS 13842 and ICGV-IS 13979. ICGV-IS 13937 and the farmers’ variety were rated sixth and seventh, respectively. In terms of the number of pods per plant, ICGV-IS 13979 was ranked first by most farmers, followed by ICGV-IS 13864 and ICGV-IS 131090. According to farmers, the genotypes with the least number of pods per plant were ICGV-IS 09926 and ICGV-IS 13937. When it comes to seed size, most farmers preferred ICGV-IS 13979, followed by ICGV-13864 and then ICGV-IS 13842. The farmers’ variety was ranked last, followed by ICGV-IS 13937. The overall ranking of genotypes by the farmers was as follows: ICGV-IS 13979 > ICGV-13864 > ICGV-IS 131090 > ICGV-IS 13842 > ICGV-IS 13937 > ICGV 09926 > farmer’s variety.

3.4.13. Economic Analysis

Table 4 provides a detailed economic analysis of the different genotypes included in this study. The analysis is based on the field yields of the varieties over two consecutive years (2020 and 2021). In addition, Table 4 outlines the total variable cost of production and net returns from the different varieties. It is worth noting that the farmers’ variety produced a field yield of 3236.53 kg ha−1 in 2020 and 2966.28 kg ha−1 in 2021. Given a total variable cost of USD 725.45 in the year 2020 and USD 699.15 in the year 2021, the farmer variety recorded a net return of USD 1643.09 in 2020 and USD 1717.48 in 2021, with benefit–cost ratios of 2.27 and 2.45. The values recorded for the farmers’ variety were the lowest among the test genotypes. Genotype ICGV-IS 09926 recorded a net return of USD 1790.54 in 2020 and USD 2269 in 2021, with a benefit–cost ratio of 2.40 and 3.25, respectively. ICGV-IS 13864 recorded the highest field yield of 4693.67 kg ha−1 in 2020 and the second highest field yield of 4401.5 kg ha−1 in 2021. In addition, the genotype also generated a net return of USD 2710.99 and USD 2881.77, respectively, with a benefit–cost ratio of 3.74 and 4.12. On the other hand, ICGV-IS 13979 recorded the highest field yield of 5022.48 kg ha−1 in the second year and generated a net return of USD 2560.44 in 2020 and USD 3386.93 in 2021 with a benefit–cost ratio of 3.53 and 4.84.

4. Discussion

An analysis of variance (ANOVA) indicated that genotypes ICGV-IS 13842 and ICGV-IS 13937 took a shorter time to reach 50% flowering and physiological maturity compared to the other genotypes and the farmers’ variety. The number of days it took to reach 50% flowering was also positively correlated with the number of days it took to reach physiological maturity. This means that genotypes that flower early can also reach physiological maturity early. Flowers are the fundamental reproductive unit essential for the growth of all seed crops. Early onset of flowering is a key component of early maturity, as mentioned by [29,30]. Farmers ranked genotypes ICGV-IS 13842 and ICGV-IS 13937 first and second, respectively, in terms of earliness. Interestingly, the ANOVA result also ranked them first and second, respectively. According to [11,31], adopting early maturing genotypes is one way to mitigate the negative impact of climate change. As a result, breeders have recognized the need to develop such genotypes given the increased shortening of the growing season in the Guinea savannah agroecology. Additionally, they recommended developing and promoting short-duration improved varieties among smallholder farmers, who are mostly affected by the long dry spells in Northern Ghana. Moreover, farmers overwhelmingly desire to adopt early maturing genotypes, which can give them another window of opportunity to plant another crop after harvesting groundnuts. They further explained that, in the North, groundnuts are usually grown early in the season, and if early maturing genotypes are used, the land can be used again for cultivating a late-season crop, such as cowpea.
As per [11], the weight of 100 seeds determines the size of groundnut seeds. The study revealed that genotype ICGV-IS 13979 had heavier seeds and maintained a higher plant establishment rate until harvesting. This finding confirms that reported by [32], who found that seedling vigor was lower in shriveled and small seeds than in bigger ones. Larger and heavier seeds tend to utilize cotyledonary reserve faster, which leads to faster stem elongation and accumulation of root and shoot dry weight, as per [33]. Additionally, [34] reported that larger seeds perform better due to the greater amount of nutrients available to the embryo. Likewise, refs. [35,36,37] found that seedlings from large, heavy seeds are more vigorous and stress-tolerant than those from small, light seeds. They also discovered that Hysyn 110 and Fairview had a 5% higher plant establishment rate than AC Boreal, which had the lowest seed weights. However, apart from the number of plants established two weeks after planting and at harvest in 2021, hundred-seed weight had a negative correlation with plant establishment rate. Genotypes ICGV-IS 13979 and ICGV-13864 were preferred by farmers due to their bigger seed sizes, which are easier to market and process.
The study found that genotype ICGV-IS 13864 produced the highest pod yields, followed by genotype ICGV-IS 13979. This was due to the higher number of pods per plant, higher number of seeds per pod, and higher 100-seed weight observed in these genotypes. Similar findings were also reported by previous studies [38,39,40], which highlighted thousand-kernel weight as the main variable affecting yield in response to cultivar improvement.
Correlation analysis in this study revealed that pod yield was highly and positively associated with the number of pods per plant and 100-seed weight, indicating that these were the major traits contributing to high pod yield. This result agrees with the work conducted by [41], which found a significant and positive correlation between the number of pods per plant, 100-seed weight, and seed yield. Farmers ranked genotypes ICGV-IS 13979, ICGV-IS 13864, and ICGV-IS 131090 as their most preferred in terms of pod yield. However, the analysis of pod yield data from the mother trials ranked genotypes ICGV-IS 13864, ICGV-IS 13979, and ICGV-IS 131090 as the top performers for pod yield in descending order. The first three components of the PCA explained over 80% of the variation observed among the genotypes. This is indicative that the genotypes evaluated were diverse enough for the traits under consideration and, therefore, selecting among them will be efficient for the traits required by farmers. According to the biplot, the number of matured pods per plant, pod yield, and number of plants harvested were the most discriminating as they had the longest axis projected from the origin. Farmers’ ranking of genotypes ICGV-IS 131090, ICGV-IS 13864, and ICGV-IS 13842 as their most preferred with regard to the haulm yield agreed with the results from the mother trial. Furthermore, genotypes ICGV-IS 13864 and ICGV-IS 131090 combined high haulm yields with high pod yield. In a previous study reported by [11], it was suggested that groundnut varieties that combine high haulm yield with high pod yield are very desirable for farmers in the Guinea savannah agroecology of Ghana. In earlier work by [42,43], they enumerated the importance of groundnut haulms in the Guinea savannah agroecology of Ghana and stated that farmers use them for feeding livestock. They contain high amounts of nitrogen, which has the potential to improve soil fertility when incorporated into the soil.
The genotype ICGV-IS 13979 had the highest harvest index (HI), which is the ratio of economic yield and biological yield. This can be attributed to its ability to direct more photosynthates to harvestable seeds, resulting in higher pod yield. Similar observations were made by [44], who reported that high-yielding varieties generally have a higher harvest index than lower-yielding ones among sweet potato landraces. Different authors have indicated that yield improvement is associated with increasing harvest index and have pointed out that the major cause of low crop yield is a low crop harvest index, and vice versa [45,46]. In this study, there was a strong and positive correlation between harvest index and pod yield, suggesting that harvest index might have contributed to yield improvement and could be considered an ideal trait for selection to improve yield productivity [46]. Farmers considered the characteristics of each genotype and ranked them based on their importance. The overall ranking of the genotypes was as follows: ICGV-IS 13979 > ICGV-13864 > ICGV-IS 131090 > ICGV-IS 13842 > ICGV-IS 13937 > ICGV-09926 > farmers’ variety. Despite farmers ranking genotype ICGV-IS 13979 fifth in terms of earliness, they chose it as the best genotype to adopt because of its high grain yield, bigger seed size, and comparable number of matured pods per plant. According to [47], farmers are rational decision makers as they make choices to maximize the returns from their production activities.
Farmers also preferred ICGV-IS 13864 as the second most preferred genotype because of its high yield, bigger seed size, and high haulm yield. However, they pointed out its poor plant stand as a disadvantage. Yet, that did not discourage them from choosing it over most of the other genotypes. According to them, the higher number of pods and bigger seed size could compensate for the yield difference. This assertion agrees with [48] and [49], who noted that breeders may discard many varieties because of traits considered undesirable to them, though these traits may be of interest to farmers. Farmers identified ICGV-IS 131090 as the third most preferred genotype because of its ability to combine high pod yield with haulm yield. Their reasons corroborate earlier suggestions made by [28,40], who enumerated the importance of groundnut haulms in the Guinea savannah agroecology of Ghana. Although the farmers’ variety had similar yields with some of the genotypes, farmers ranked it seventh and it was the least preferred. This was because of its smaller seed size, which makes it lose its market value and the fact that it is sometimes difficult to process.
During field visits and field days, it was observed that farmers’ managed trials had low plant density and were mostly weedy. The researchers noted that the farmers were impressed with the researcher-managed trials. As a result, the researchers brought to the attention of the farmers the need to combine improved varieties with good agricultural practices to achieve the maximum yield. This supports an earlier study by [47], which found that improved varieties perform better when accompanied by recommended cultural practices. The researchers also saw this as an opportunity to encourage farmers to adopt good agricultural practices. In turn, farmers who saw the outcome of the researcher-managed fields were enthusiastic to learn more. Through this participatory variety evaluation process, farmers learned and gained knowledge about the benefits of adopting good agricultural practices. This is consistent with the results of [47], who reported that participatory variety selection is an avenue that adds new and more information to what farmers already have. Additionally, [50] concluded that incorporating farmers’ selection criteria in the advancement process of new maize hybrids by breeders is useful in the changing maize-growing environments in sub-Saharan Africa. Undertaking on-farm research comes with various challenges, including the lack of motivation from farmers, working in remote areas, cultural and language barriers, high personnel time for communication, and inadequate administrative structures and data analysis [51]. However, in this specific case, some challenges were minimal due to the farmers’ willingness and enthusiasm demonstrated throughout the experiment. Additionally, Agricultural Extension Agents (AEAs) and some community focal persons assisted with translating the local dialect to overcome language barriers. Economics is one of the major criteria used to evaluate the best variety of crops that can give higher economic returns and can be accepted by farmers [52]. In this study, genotypes ICGV-IS 13979 and ICGV-IS 13864 had the highest benefit–cost ratios of 4.84 and 4.12, respectively. This implies that the most economically viable genotypes are ICGV-IS 13979 and ICGV-IS 13864.5.

5. Conclusions

The study utilized the on-farm testing approach to evaluate advanced groundnut breeding lines across different locations and gather feedback from farmers in the development of improved varieties. Through this process, the adoption of released varieties has increased. A group of selected farmers were tasked to evaluate the genotypes in both mother and baby trials, and their preferences for the evaluated genotypes were recorded. Several traits were identified as crucial to farmers, including pod yield, seed size, earliness, haulm yield, number of pods per plant, and plant stand. The study found that improving one of these preferred traits genetically could have a positive impact on the others. After analyzing the data from both the researcher-managed trials and the farmer preferences, genotypes ICGV-IS 13979 and ICGV-IS 13864 were determined to be the best and most preferred, alongside genotypes ICGV-IS 131090 and ICGV-IS 13842.
Finally, though the farmers’ variety was feasible, the improved varieties were relatively profitable, especially ICGV-IS 13979, with a benefit–cost ratio of 3.53 in 2020 and 4.84 in 2021. Hence, policy interventions aimed at enhancing farmers’ ability to adopt improved groundnut cultivars could lead to increased profitability among smallholder farmers. We found that the mother–baby approach for participatory variety selection is cost-intensive, and other tools like triadic comparisons of technologies (TRICOTs) should be considered.

Supplementary Materials

The following supporting information can be downloaded at: https://www.mdpi.com/article/10.3390/agriculture13122249/s1. Table S1: Eigen values, percentage variance and cumulative percentage variance of the principal components obtained from the principal component analysis.

Author Contributions

Conceptualization, O.A.A. and R.O.-F.; methodology, O.A.A., R.O.-F., J.Y., Y.B.K., T.K.T., R.A. and A.A.I.; formal analysis O.A.A., R.O.-F., Y.B.K., D.S.A., R.A. and M.M.; investigation, O.A.A., R.O.-F., D.S.A. and T.K.T.; resources, R.O.-F. and O.A.A.; data curation, O.A.A., R.O.-F., R.A., A.A.I., D.S.A. and M.M.; writing—original draft preparation, O.A.A. and R.O.-F.; writing—review and editing, O.A.A., R.O.-F., Y.B.K., M.M., J.Y., T.K.T. and D.S.A.; project administration, O.A.A.; funding acquisition, R.O.-F. All authors have read and agreed to the published version of the manuscript.

Funding

This study was made possible by the generous support of the BMGF funded Accelerated Varietal Improvement and Seed Systems for Legumes and Cereals in Africa (AVISA) Project (Grant Number OPP1198373).

Institutional Review Board Statement

Not applicable.

Data Availability Statement

Data will be made available upon written request to the corresponding author.

Acknowledgments

The authors wish to express their profound gratitude to the Management and Staff of CSIR-Savanna Agricultural Research Institute for technical support and Accelerated Varietal Improvement and Seed Systems for Africa (AVISA) for their financial support.

Conflicts of Interest

The authors declare that this research was conducted in the absence of any commercial financial relationships that could be construed as potential conflicts of interest.

References

  1. Girei, A.; Dauna, Y.; Dire, B. An Economic Analysis of Groundnut (Arachis hypogea) Production in Hong Local Government Area of Adamawa State, Nigeria. J. Agric. 2013, 1, 84–89. Available online: http://sciencewebpublishing.net/jacr/archive/2013/December/pdf/Girei%20et%20al.pdf (accessed on 5 January 2023).
  2. Taphe, B.G.; Agbo, F.U.; Okorji, E.C. Resource productivity and technical efficiency of small-scale groundnut farmers in Taraba State, Nigeria. J. Biol. Agric. Healthc. 2015, 5, 25–35. [Google Scholar]
  3. United States Department of Agriculture. World Agricultural Production. Circular Series WAP 2–18. 2018. Available online: https://downloads.usda.library.cornell.edu/usda-esmis/files/5q47rn72z/ws859g16b/rn301181z/worldag-production-02-08-2018.pdf (accessed on 23 January 2023).
  4. Gbèhounou, G.; Adango, E. Trap crops of Striga hermonthica: In vitro identification and effectiveness in situ. Crop Prot. 2003, 22, 395–404. [Google Scholar] [CrossRef]
  5. MoFA. Agriculture in Ghana Facts and Figures 2016. Available online: https://mofa.gov.gh/site/publications/research-reports/374-agriculture-in-ghana-facts-figures-2016 (accessed on 11 January 2023).
  6. FAOSTAT. FAOSTAT Online Database. 2016. Available online: www.fao.org/faostat/en/ (accessed on 30 October 2023).
  7. MoFA-SRID. Agriculture in Ghana: Facts and Figures 2017. In Statistics, Research, and Information Directorate (SRID); Ministry of Food and Agriculture (MoFA): Accra, Ghana, 2017. [Google Scholar]
  8. Angelucci, F.; Bazzucchi, A. Analysis of Incentives and Disincentives for Groundnuts in Ghana; Technical Notes Series; MAFAP, FAO: Rome, Italy, 2013; pp. 1–26. Available online: https://gatesopenresearch.org/documents/3-426 (accessed on 30 October 2023).
  9. Lal, C.; Radhakrishnan, T.; Mathur, R.K.; Manivel, P.; Samdur, M.Y.; Gor, H.K.; Chika, B.M. Evaluation of Groundnut Varieties for Yield and Quality Characters. Legume Res. 2006, 29, 102–105. [Google Scholar]
  10. Mokgehle, S.N.; Dakora, F.D.; Mathews, C. Variation in N2 fixation and N contribution by 25 groundnut (Arachis hypogaea L.) varieties grown in different agro-ecologies, measured using 15N natural abundance. Agric. Ecosyst. Environ. 2014, 195, 161–172. [Google Scholar] [CrossRef]
  11. Oteng-Frimpong, R.; Konlan, S.P.; Denwar, N.N. Evaluation of Selected Groundnut (Arachis hypogaea L.) Lines for Yield and Haulm Nutritive Quality Traits. Int. J. Agron. 2017, 2017, 7479309. [Google Scholar] [CrossRef]
  12. Singh, B.B.; Musa, A.; Ajeigbe, H.A.; Tarawali, S.A. Effect of Feeding Crop Residues of Different Cereals and Legumes on Weight Gain of Yankassa Rams. Int. J. Livest. Prod. 2011, 2, 17–23. Available online: http://www.academicjournals.org/IJLP (accessed on 30 October 2023).
  13. Ribadiya, N.K.; Savsani, H.H.; Patil, S.S.; Garg, D.D.; Gadariya, M.R.; Karangiya, V.K.; Gajera, A.P. Effect of feeding varying levels of groundnut haulms on feed intake and growth performance in broiler chickens. Vet. World 2015, 8, 139–142. [Google Scholar] [CrossRef]
  14. Ryan, J.; Spencer, D. Future Challenges and Opportunities for Agricultural R&D in the Semi-Arid Tropics. 2001. Available online: http://oar.icrisat.org/id/eprint/1107 (accessed on 5 January 2023).
  15. Ibrahim, M.; Florkowski, W.J.; Kolavalli, S. The Determinants of Farmer Adoption of Improved Peanut Varieties and Their Impact on Farm Income: Evidence from Northern Ghana. 2012. Available online: https://ideas.repec.org/p/ags/aaea12/125000.html (accessed on 30 October 2023).
  16. Doss, C.; Mwangi, W.; Verkuijl, H.; de Groote, H. Economics Working Paper 03-01. Adoption of Maize and Wheat Technologies in Eastern Africa: A Synthesis of the Findings of 22 Case Studies. Available online: www.cimmyt.org (accessed on 30 October 2023).
  17. Tadesse, D.; Ayalew, A.; Medhin, Z.G. Participatory on-farm evaluation of improved maize varieties in Chilga district of Northwestern Ethiopia. Int. J. Agric. For. 2014, 4, 402–407. [Google Scholar] [CrossRef]
  18. Bucheyeki, T.L.; Shenkalwa, E.M.; Mapunda, T.X.; Matata, L.W. On-Farm Evaluation of Promising Groundnut Varieties for Adaptation and Adoption in Tanzania. 2008. Available online: http://www.academicjournals.org/AJAR (accessed on 30 October 2023).
  19. Adjei-Nsiah, S.; Kuyper, T.W.; Leeuwis, C.; Abekoe, M.K.; Giller, K.E. Evaluating sustainable and profitable cropping sequences with cassava and four legume crops: Effects on soil fertility and maize yields in the forest/savannah transitional agro-ecological zone of Ghana. Field Crop. Res. 2007, 103, 87–97. [Google Scholar] [CrossRef]
  20. de Groote, H.; Siambi, M.; Friesen, D.; Diallo, A. Identifying Farmers’ Preferences for New Maize Varieties in Eastern Africa. In Quantitative Analysis of Data from Participatory Methods in Plant Breeding. Quant. Anal. Data Particip. Methods Plant Breed. 2002, 82–103. Available online: https://www.researchgate.net/publication/235733099 (accessed on 30 October 2023).
  21. EPA. EPA’s Report on the Environment (2003 Draft)|Environmental Assessment|US EPA. Available online: https://cfpub.epa.gov/ncea/cfm/eroe/recordisplay.cfm?deid=56830 (accessed on 11 January 2023).
  22. Tetteh, F.; Larbi, A.; Nketia, K.A.; Senayah, J.K.; Hoeschle-Zeledon, I.; Abdulrahman, N. Suitability of Soils for Cereal Cropping in Northern Ghana. 2016. Available online: http://africa-rising.net/ (accessed on 30 October 2023).
  23. Page, A.L.; Miller, R.H.; Keeney, D.R. Methods of Soil Analysis. Part 2; ASA Inc.: Madison, WI, USA, 2023. [Google Scholar]
  24. Bremner, J.M.; Keeney, D.R. Steam distillation methods for determination of ammonium, nitrate, and nitrite. Anal. Chim. Acta 1965, 32, 485–495. [Google Scholar] [CrossRef]
  25. Bray, R.H.; Kurtz, L.T. Determination of total, organic, and available forms of phosphorus in soils. Soil Sci. 1945, 59, 39–45. [Google Scholar] [CrossRef]
  26. Nelson, D.W.; Sommers, L.E. Total Carbon, Organic Carbon, and Organic Matter. Methods Soil Anal. Part 3 Chem. Methods 2015, 5, 539–579. [Google Scholar] [CrossRef]
  27. de Mendiburu, F.; Yaseen, M. Statistical Procedures for Agricultural Research. R Package Version 1.4.0. Agricolae. 2020. Available online: https://myaseen208.github.io/agricolae/https://cran.r-project.org/package=agricolae (accessed on 3 April 2023).
  28. Lê, S.; Josse, J.; Husson, F. FactoMineR: An R package for multivariate analysis. J. Stat. Softw. 2008, 25, 1–18. [Google Scholar] [CrossRef]
  29. Kaba, J.S.; Kumaga, F.K.; Ofori, K. Effect of Flower Production and Time of Flowering on Pod Yield of Peanut (Arachis hypogaea L.) Genotypes. 2014. Available online: www.iosrjournals.orgwww.iosrjournals.org (accessed on 30 October 2023).
  30. Coulibaly, M.A.; Ntare, B.R.; Gracen, V.E.; Danquah, E.Y.; Ofori, K.; Mahamane, A.S. Phenotyping groundnut genotypes to identify sources of earliness in niger. Int. J. Innov. Eng. Res. Technol. 2017, 4, 242. [Google Scholar]
  31. Martey, E.; Etwire, P.M.; Adogoba, D.S.; Tengey, T.K. Farmers’ preferences for climate-smart cowpea varieties: Implications for crop breeding programmes. Clim. Dev. 2022, 14, 105–120. [Google Scholar] [CrossRef]
  32. Sulochanamma, B.N.; Reddy, T.Y. Effect of Seed Size on Growth and Yield of Rainfed Groundnut. Legume Res.-Int. J. 2007, 30, 33–36. [Google Scholar]
  33. Swank, J.C.; Egli, D.B.; Pfeiffer, T.W. Seed Growth Characteristics of Soybean Genotypes Differing in Duration of Seed Fill. Crop Sci. 1987, 27, 85–89. [Google Scholar] [CrossRef]
  34. Khan, M.L.; Shankar, U. Effect of seed weight, light regime, and substratum microsite on germination and seedling growth of Quercus semiserrata Roxb. Only for academic use 118 Seed Germination and Seedling Growth in Oak. Trop. Ecol. 2001, 42, 117–125. Available online: https://www.researchgate.net/publication/236628018 (accessed on 30 October 2023).
  35. Elliott, R.H.; Mann, L.W.; Olfert, O.O. Effects of seed size and seed weight on seedling establishment, seedling vigour and tolerance of summer turnip rape (Brassica rapa) to flea beetles, Phyllotreta spp. Can. J. Plant Sci. 2007, 87, 385–393. [Google Scholar] [CrossRef]
  36. Talebi, R.; Fayaz, F.; Jelodar, N.A.B. Correlation and Path Coefficient Analysis of Yield and Yield Components of Chickpea (Cicer arientinum L.) under Dryland Conditions in the West of Iran. J. Plant Sci. 2007, 6, 1151–1154. Available online: https://agris.fao.org/agris-search/search.do?recordID=DJ2012050624 (accessed on 5 January 2023).
  37. Tambal, H.A.A.; Erskine, W.; Baalbaki, R.; Zaiter, H. Relationship of Flower and Pod Numbers Per Inflorescence with Seed Yield in Lentil. Exp. Agric. 2000, 36, 369–378. [Google Scholar] [CrossRef]
  38. Zhang, C.; Zheng, B.; He, Y. Improving Grain Yield via Promotion of Kernel Weight in High Yielding Winter Wheat Genotypes. Biology 2022, 11, 42. [Google Scholar] [CrossRef] [PubMed]
  39. Wu, W.; Li, C.; Ma, B.; Shah, F.; Liu, Y.; Liao, Y. Genetic progress in wheat yield and associated traits in China since 1945 and future prospects. Euphytica 2014, 196, 155–168. [Google Scholar] [CrossRef]
  40. Lopes, M.S.; Reynolds, M.P.; Manes, Y.; Singh, R.P.; Crossa, J.; Braun, H.J. Genetic yield gains and changes in associated traits of CIMMYT spring bread wheat in a ‘Historic’ set representing 30 years of breeding. Crop Sci. 2012, 52, 1123–1131. [Google Scholar] [CrossRef]
  41. Rajanna, M.P.; Viswanatha, S.R.; Kulkarni, R.S.; Ramesh, S. Correlation and path analysis in soybean [Glycine max (L.) Merrill]. Crop Res. 2000, 20, 244–247. [Google Scholar]
  42. Martey, E.; Wiredu, A.N.; Oteng-Frimpong, R. Baseline Study of Groundnut in Northern Ghana Scholar; LAP Lambert Academic Publishing: Saarbrücken, Germany, 2015; Available online: https://www.researchgate.net/publication/321918124 (accessed on 30 October 2023).
  43. Ahiabor, B.D.K.; Fosu, M.; Atsu, E.; Tibo, I.; Sumaila, I. Integrated Soil Fertility Management for Increased Maize Production in the Degraded Farmlands of the Guinea Savanna Zone of Ghana Using Devil-Bean (Crotalaria retusa) and Fertilizer Nitrogen. Innov. Key Green Revolut. Afr. 2011, 183–189. [Google Scholar] [CrossRef]
  44. Nwankwo, I.I.M.; Akinbo, O.K.; Ikoro, A.I.; Orji, N.A.C.; Njoku, T.C. Evaluation of selected sweet potato landraces for high harvest index and high root yield indices for parental selection. Int. J. Agric. Policy Res. 2018, 6, 90–97. [Google Scholar] [CrossRef]
  45. Sharma-Natu, P.; Ghildiyal, M.C. Potential Targets for Improving Photosynthesis and Crop Yield. Curr. Sci. 2005, 88, 1918–1928. Available online: https://www.jstor.org/stable/24110618 (accessed on 7 January 2023).
  46. Asefa, G. The Role of Harvest Index in Improving Crop Productivity: A Review. J. Nat. Sci. Res. 2019, 31, 24–28. [Google Scholar] [CrossRef]
  47. Buah, S.S.J.; Kombiok, J.M.; Kanton, R.A.L.; Denwar, N.N.; Haruna, H.; Wiredu, A.N.; Abdulai, M.S. Participatory evaluation of drought tolerant maize varieties in the Guinea Savanna of Ghana using mother and baby trial design. J. Sci. Technol. 2013, 33, 12–23. [Google Scholar] [CrossRef]
  48. Getahun, A.; Atnaf, M.; Abady, S.; Degu, T.; Dilnesaw, Z. Participatory variety selection of soybean Glycine max (L.) Merrill) varieties under rainfed condition of Pawe district, north-western Ethiopia. Int. J. Appl. Sci. Math. 2016, 3, 40–43. [Google Scholar]
  49. Ojulong, H.; Letayo, E.; Sakwera, L.; Mgonja, F.; Sheunda, P.; Kibuka, J.; Otwani, D.; Audi, P.; Mgonja, M.; Manyasa, E.O. Participatory Variety Selection for Enhanced Promotion and adoption of improved finger millet varieties: A Case for Singida and Iramba Districts in Central Tanzania Formerly working with ICRISAT, but now with Alliance for a Green Revolution in Africa-Tanzania (AGRA-TZ). Afr. J. Rural. Dev. 2017, 2, 77–93. [Google Scholar]
  50. Worku, M.; De Groote, H.; Munyua, B.; Makumbi, D.; Owino, F.; Crossa, J.; Beyene, Y.; Mugo, S.; Jumbo, M.; Asea, G.; et al. On-Farm performance and farmers’ participatory assessment of new stress-tolerant maize hybrids in Eastern Africa. Field Crop. Res. 2020, 246, 107693. [Google Scholar] [CrossRef]
  51. Gwaze, F.R.; Mwale, M.; Chimonyo, M. Challenges encountered in conducting farmer-oriented livestock research among resource-limited farmers of Sub-Saharan Africa. Afr. J. Agric. Res. 2011, 6, 4840–4851. [Google Scholar]
  52. Amoako, O.A.; Adjebeng-Danquah, J.; Bidzakin, J.K.; Abdulai, H.; Kassim, B.Y.; Owusu, E.Y. Response of Improved Cowpea Varieties to Spacing in The Guinea Savannah Ecology of Ghana. J. Ghana Sci. Assoc. 2020, 19, 30–40. [Google Scholar]
Figure 1. Correlations among the traits measured in the 2020 and 2021 cropping seasons. NPLE: number of plants established; NPH: number of plants harvested; DF: days to 50% flowering; DPM: days to physiological maturity; NMP: number of matured pods per plant; NSP: number of seeds per pod; DHY: dry haulm yield at harvest; DPY: pod yield; HSW: hundred-seed weight; HI: harvest index. *—p < 0.05.
Agriculture 13 02249 g001
Figure 2. Mean and standard errors of plant establishment and days to flowering of groundnut genotypes were evaluated in 2020 and 2021 in the mother trials. WAP = weeks after planting. Genotypes followed by the same letters are not significantly different.
Agriculture 13 02249 g002
Figure 3. Mean and standard errors of number of plants at harvest and days to maturity of groundnut genotypes evaluated in 2020 and 2021 in the mother trials. Genotypes followed by the same letters are not significantly different.
Agriculture 13 02249 g003
Figure 4. Mean and standard errors of number of pods harvested and number of seeds per pod recorded on groundnut genotypes evaluated in 2020 and 2021 in the mother trials. Genotypes followed by the same letters are not significantly different.
Agriculture 13 02249 g004
Figure 5. Mean and standard errors of the dry pod and haulm yields of groundnut genotypes evaluated in the mother trial in 2020 and 2021. Genotypes followed by the same letters are not significantly different.
Agriculture 13 02249 g005
Figure 6. Mean and standard errors of hundred-seed weight and harvest index of groundnut genotypes evaluated in 2020 and 2021 in the mother trials. Genotypes followed by the same letters are not significantly different.
Agriculture 13 02249 g006
Figure 7. PCA Biplot of components 1 and 2 showing the relatedness and distribution of the genotypes and measured traits. G1 = farmers’ variety, ICGV−IS 09926 = G2, ICGV−IS 131090 = G3, ICGV−IS 13842 = G4, ICGV−IS 13864 = G5, ICGV−IS 13937 = G6, ICGV−IS 13979 = G7.
Agriculture 13 02249 g007
Figure 8. Dendrogram showing the clusters of the genotypes indicated by different colors. G1 = farmers’ variety, ICGV-IS 09926 = G2, ICGV-IS 131090 = G3, ICGV-IS 13842 = G4, ICGV-IS 13864 = G5, ICGV-IS 13937 = G6, ICGV-IS 13979 = G7.
Agriculture 13 02249 g008
Table 1. Mean square values from ANOVA for parameters measured in the mother trial for 2020 cropping season.
Sources of VariationDegrees of FreedomNPLENPHDFDPMNMP
Replication2650.90203.570.193.7611.61
Treatment6359.87 ***175.27 *2.54 **84.60 *53.99 ***
Residual1234.6854.7940.4717.651.09
CV (%) 3.144.062.584.43.96
Sources of VariationDegrees of FreedomNSPDPYDHYHSWHI
Replication20.0132,89760,9999.7810.183
Treatment60.024 NS1,093,068 ***282,527 ***38.50 **35.192 ***
Residual120.0146,83030,9265.081.598
CV (%) 6.075.505.705.832.26
NPLE: number of plants established; NPH: number of plants harvested; DF: days to 50% flowering; DPM: days to physiological maturity; NMP: number of matured pods per plant; NSP: number of seeds per pod; DHY: dry haulm yield at harvest; DPY: pod yield; HSW: hundred-seed weight; HI: harvest index; CV: coefficient of variation, ***—p < 0.001, **—p < 0.01, *—p < 0.05.
Table 2. Mean square values from ANOVA for parameters measured in the mother trial for 2021 cropping season.
Sources of VariationDegrees of FreedomNPLENPHDFDPMNMP
Replication23.0018.470.900.334.91
Treatment6169.86 **162.44 **8.60 ***79.60 *56.21 ***
Residual1226.66725.090.7920.063.17
CV (%) 2.662.613.564.737.05
Sources of VariationDegrees of FreedomNSPDPYDHYHSWHI
Replication20.001184,8933,3701.371.172
Treatment60.042 **794,279 ***144,548 ***64.03 ***28.978 **
Residual120.00794,08111,3992.1784.87
CV (%) 4.257.894.213.653.917
NPLE: number of plants established; NPH: number of plants harvested; DF: days to 50% flowering; DPM: 100 days to maturity; NMP: number of matured pods per plant; NSP: number of seeds per pod; DHY: dry haulm yield at harvest; DPY: pod yield; HSW: hundred-seed weight; HI: harvest index; CV: coefficient of variation, ***—p < 0.001, **—p < 0.01, *—p < 0.05.
Table 3. Assessment of groundnut genotypes based on their individual traits by farmers in Tamale metro and Sagnerigu district.
GenotypePlant StandEarlinessHigher Pod YieldHigher Haulm YieldHigher Pod NumberLarge Seed Size
ICGV 09926376574
ICGV 13864732222
ICGV-IS 13937223746
ICGV-IS 131090644135
ICGV-IS 13979251411
ICGV-IS 13842515353
Farmer’s variety467667
Table 4. Economic analysis of groundnut varieties.
2020 2021
VarietiesYield, kg ha−1Total Variable Cost USDNet Returns USDBC RatioYield, kg ha−1Total Variable Cost USDNet Returns USDBC Ratio
Farmer variety 3236.53725.451644.162.272966.28699.151714.092.45
ICGV-IS 099263436.47725.451790.542.473648.84699.152269.393.25
ICGV-IS 1310904479.97725.452554.533.523975.19699.152534.903.63
ICGV-IS 138423753.13725.452022.382.793800.00699.152392.373.42
ICGV-IS 138644693.67725.452710.993.744401.55699.152881.774.12
ICGV-IS 139373446.87725.451798.152.473900.00699.152473.733.54
ICGV-IS 139794488.03725.452560.443.535022.48699.153386.934.84
Disclaimer/Publisher’s Note: The statements, opinions and data contained in all publications are solely those of the individual author(s) and contributor(s) and not of MDPI and/or the editor(s). MDPI and/or the editor(s) disclaim responsibility for any injury to people or property resulting from any ideas, methods, instructions or products referred to in the content.

