Article

How Does Network Infrastructure Construction Affect Livestock Carbon Emissions?

School of Public Policy and Administration, Chongqing University, No. 174 Shazheng Street, Chongqing 400044, China
*
Author to whom correspondence should be addressed.
Agriculture 2023, 13(12), 2244; https://doi.org/10.3390/agriculture13122244
Submission received: 23 October 2023 / Revised: 14 November 2023 / Accepted: 30 November 2023 / Published: 5 December 2023
(This article belongs to the Topic Low Carbon Economy and Sustainable Development)

Abstract

:
Against the backdrop of new carbon peak and carbon neutrality targets, China must address livestock carbon emissions (LCEs), which account for the largest proportion of agricultural carbon emissions in China. China has been promoting network infrastructure construction (NIC) for digital transformation. This study explores whether NIC can affect LCEs. To capture the potential effects of NIC, a conceptual framework is constructed originally and its impacts on LCEs are tested empirically through a two-way fixed effect model. The results show that NIC can significantly reduce LCEs. The results hold steady in various robustness checks, and the impacts express heterogeneities across provinces with different LCE levels, NIC levels, and regions. Mechanism analysis reveals that NIC can increase LCEs through the livestock industry scale effect, which is nevertheless outweighed by technological innovation and factor allocation’s reduction effects triggered by NIC. Additionally, transportation infrastructure construction serves a moderating role by reinforcing the reduction effect of NIC on LCEs. The conclusions are crucial for advancing the understanding of NIC’s potential benefits and policymaking for carbon emissions reduction in China.

1. Introduction

Currently, climate change caused by greenhouse gases is harmful to human survival and sustainable economic development, and controlling greenhouse gas emissions, such as carbon dioxide, has become a global consensus [1]. China has consistently held the title of the world’s foremost emitter since 2007. As of 2021, China’s carbon emissions have soared to 11.47 billion tons, accounting for 31.6% of the global carbon emissions. To cope with climate change and assume corresponding carbon reduction responsibilities, China has embarked on its carbon peak and neutrality targets (The dual-carbon target refers to the carbon peak target and carbon neutrality target. China’s carbon peak target is to achieve peak carbon dioxide emissions by 2030, and China’s carbon neutrality goal is to achieve carbon neutrality by 2060), and promised to lower CO2 emissions per unit of GDP by over 65% from the 2005 level and to increase the share of non-fossil fuels in primary energy consumption to around 25% [2].
To achieve these goals, China has implemented a series of policies to control carbon emissions in various fields. Aiming at reducing industrial emissions, China has implemented policies such as a carbon emission trading system and renewable energy subsidies. As a result of these measures, industrial carbon emissions witnessed a decline in recent years [3]. China has also made efforts to reduce agricultural emissions, the typical policies include the introduction of the “Management Measures for Modern Agricultural Production Development Funds from the Central Government” [4] and the “National Agricultural Sustainable Development Plan (2015–2030)” [5]. However, the impact of these measures on agricultural carbon emissions has been limited, as evidenced by the fluctuating and rising agricultural carbon emissions in recent years [6].
China’s agriculture sector still has a large potential for carbon reduction. For China to forge ahead in its endeavors toward agricultural carbon reduction, it is imperative to depart from the hitherto generalized policies at the overall level of agriculture and further subdivide the agriculture sectors with detailed policies to fully tap into the potential of carbon reduction in specific fields. As a part of agriculture, the livestock subsector emitted a considerable 300 million tons of carbon dioxide equivalent in 2020, accounting for nearly half of the aggregate greenhouse gas emissions arising from the agriculture sector [7]. Therefore, addressing the issue of livestock carbon emissions (LCEs) is a challenge that China must overcome in the process of promoting comprehensive and in-depth carbon abatement endeavors.
The elevated LCEs can be ascribed to several factors. Primarily, China’s livestock production adopts a substantial scale. The livestock production reached 0.45 billion pigs, 98.17 million cattle, 0.32 billion sheep, and 6.79 billion poultry in 2021 [8]. Secondly, the breeding technology is relatively backward [9]. In some regions, conventional and less efficient livestock production methods, such as free-range and semi-free-range practices, persist. Farmers often lack access to scientific breeding techniques and modern facilities to adequately treat livestock and poultry waste in a low-carbon way. Thirdly, the factor allocation efficiency of the livestock industry is relatively low. The inadequate marketization brings a disjunction between supply and demand aspects, as well as upstream–downstream misalignments within the production chain, which gives rise to wasteful production practices and resource underutilization, consequently augmenting LCEs [10]. In summary, to reduce LCEs, China can start by adjusting the livestock industry scale, improving livestock technology innovation, and promoting the efficiency of factor allocation in the livestock industry.
As an important component of new infrastructure construction, network infrastructure construction (NIC) engenders transformative shifts in the production process across diverse industries [11], which hold a close nexus with the genesis of carbon emissions [12]. After the implementation of a series of policies such as Broadband China (On 17 August 2013, the State Council of China released the Broadband China strategic implementation plan, deploying broadband development goals and paths for the next 8 years) and Made in China (2025) (Made in China 2025 is a strategic document that was issued by the State Council of China in May 2015. The document points out the need to strengthen the construction of internet infrastructure) by the Chinese government, China’s NIC has achieved rapid development, with the number of Internet access ports in China reaching 946 million, and with the initial completion of construction of backbone networks [13]. The existing literature has revealed that NIC exerts a substantial reduction in regional carbon emissions [14]. Nonetheless, its specific impact on LCEs remains indeterminate. While past studies have yet to furnish a definitive answer, they do present a coherent chain of reasoning. Research has revealed that the NIC facilitates the mitigation of factor misallocation and fosters progress in technology innovation [15]. Furthermore, the reduction of factor misallocation and the improvement of technology innovation in the livestock industry are conductive to reducing LCEs [16,17]. However, no literature combines the two aspects of research to explore whether NIC can affect LCEs and the potential transmission pathways.
This study aims to establish a framework for examining the effects of NIC on LCEs. Based on the panel data of 30 provinces in China from 2011 to 2020, this study uses a two-way fixed effects model that controls year and provincial effects to probe the impact of NIC on LCEs. After endogenous treatment, rigorous robustness checks, and heterogeneity analysis, the study delves into mediation mechanisms, which encompass the livestock industry scale effect, technology innovation effect, and factor allocation effect. The potential contributions of this study are as follows: (1) it extends the research on the environmental effects of NIC to the field of livestock industry. (2) This study concludes that NIC can suppress LCEs, providing policy references for the coordinated realization of NIC goals and dual-carbon targets. (3) This study explores the mechanism of the impact of NIC on LCEs, providing reference for specific measures to suppress LCEs.

2. Background

2.1. Development of NIC in China

NIC refers to the process of building and maintaining a series of technical systems in support of network communication aimed at providing stable and efficient network connections for various devices, applications, and services. Hardware components such as servers, routers, and switches, as well as software products like operating systems, database management systems, and security solutions, are all part of it. In addition, the development of new technologies, such as big data analysis and the Internet of Things, is also involved in NIC.
To promote NIC, China has taken several measures, by first accelerating fiber optic network construction, 4G/5G base station construction, and accelerating broadband internet port access to form a high-speed network covering the entire nation. Second, drive the research and application of 5G, big data, and Internet of Things technologies by promoting cooperation between schools and enterprises and establishing comprehensive experimental zones. The NIC in China has achieved significant results. China’s internet penetration rate had reached 76.4%, with 29.37 million 5G base stations by 2023.

2.2. How Does NIC Affect LCEs: Examples from China

The development of China’s NIC not only includes the development of networks but also covers deep integration with industries. In the field of livestock industry, NIC can reduce LCEs through the deep integration of new generation information technologies (digital twins, cloud computing, artificial intelligence, and big data) and livestock industries.
First, animal gut digestion and fecal pollution during livestock production are the direct causes of greenhouse gas production. Therefore, optimizing the feeding and fecal treatment of livestock and poultry through network technology can reduce the production of LCEs from the source. For example, Tu et al. (2010) have built an intelligent feeding system that connects pig farm feeding equipment through network terminal devices, allowing for scientific feed allocation and feeding of live pigs in farms remotely, reducing LCEs generated in the digestion process of livestock and poultry from the source by optimizing feeding [18]. Furthermore, as a traditional livestock county in Hebei Province, Haixing County produces 922,400 tons of livestock and poultry manure annually. To timely and reasonably handle livestock and poultry manure, Haixing County has developed and applied a computer intelligent system to complete the automated process of separating, collecting, filtering, and producing organic fertilizer materials [19]. This has improved the full utilization of livestock and poultry manure and reduced the greenhouse gas generated by manure stacking.
Second, the production process of the livestock industry is affected by the spread of epidemics, which lead to the death of a large number of livestock and poultry, resulting in the decay of corpses and waste of production capacity. This is one of the reasons for the generation of excess LCEs. The remote-control function developed by the Internet of Things-related technology can resolve this problem. The pig networking pig breeding service platform developed by He (2019) can intelligently monitor abnormal environments in pig houses by connecting devices such as temperature and humidity sensors and carbon dioxide sensors in the farm, thereby providing timely intervention and treatment for livestock and poultry to prevent the epidemics [20]. The application of internet technology can timely prevent the common epidemics of the livestock industry, thereby preventing the generation of excess carbon dioxide due to the decay of animal carcasses and overcapacity.
Third, due to the requirement of freshness preservation of livestock and poultry products, the disconnection between livestock production, processing, transportation, and sales may lead to product deterioration, resulting in waste of production capacity and the generation of excess LCEs. In the tide of “Internet plus + animal husbandry”, various platforms have emerged. For example, the “crowdfunding pork” model emerged in many cities in China. It uses social media to select different parts of pork and crowdfunding a whole pig. After receiving the order, the enterprise starts breeding, and a few months later, the slaughtered and frozen fresh pork can be delivered to the doorstep [21]. The integration of internet technology and the livestock industry has improved the connection between livestock production, processing, transportation, and sales, avoiding the generation of excess LCEs due to inventory, deterioration, and waste.
The deep integration of network infrastructure with the livestock industry will certainly lead to the digital, intelligent, and efficient transformation of production in these industries. This transformation may affect several key factors that influence LCEs (such as livestock industry scale, technology innovation, and factor allocation efficiency), which will be discussed in detail in Section 4.

3. Literature Review

Macro-level influencing factors are mainly probed through the adept utilization of factor mathematical decomposition models. Chen et al. (2014) utilized the LMDI model to uncover that economic increase and a higher scale of agriculture engender increased LCEs, while the enhancement of livestock production efficiency is identified as a key driver for diminishing LCEs [22]. Yao et al. (2017) extended the Kaya model and combined it with the LMDI analysis method, revealing that improving the livestock production efficiency and increasing urbanization rate would inhibit LCEs, while an increased share of livestock industry output, increased agricultural production per agricultural worker, and population growth would promote LCEs [23]. Zou and Xiang (2016) employed the truncated regression model with censored dependent variables (Tobit model) to perform factor decomposition, and the results demonstrated that labor education level positively reduces LCEs, while the level of livestock industry economic development, agricultural industrial structure, and the proportion of cattle and pig farming can increase LCEs [24]. Other studies used empirical methods to explore the macro-influencing factors of LCEs. Sun et al. (2022) used the spatial econometric model to reveal that the economic growth, the scale of beef cattle breeding, mechanization, environmental regulation intensity, the educational level of livestock laborers, and the urban-rural income gap exert significant impacts on the LCEs [25]. Hao et al. (2023) used a two-way fixed effects model and found that the LCEs were affected by livestock breeding structure, technical level, and livestock scale [26]. Shang et al. (2023) employed the spatial Durbin model and found that the optimization of livestock structure, the elevation of livestock labor’s educational level, and the augmentation of urbanization levels could reduce LCEs [27].
The micro-level influencing factors predominantly draw upon livestock experiments conducted on farms. Van Middelaar et al. (2013) found that the promotion of balanced feed effectively mitigates carbon emissions stemming from the digestion process of livestock and poultry [28]. Vida and Tedesco (2017) have demonstrated that the integration of a renewable energy system with anaerobic digestion exerts a tangible reduction in greenhouse gas emissions during milk production [29]. Van Den Oever et al. (2021) found that using more manure storage technology can reduce the production of greenhouse gases in the livestock industry [30]. Kumari et al. (2020) proposed that improving the level of aquaculture management could reduce LCEs [31].
To date, no literature has explored the direct specific impact of NIC on LCEs. Nevertheless, extant studies posit that NIC has the potential to influence the underlying factors affecting LCEs. First, NIC can exert a notable impact on factors that foster the progress of technology innovation in livestock industry. The establishment and growth of NIC play a pivotal role in facilitating the exchange and dissemination of knowledge among researchers located across disparate regions [32], thereby driving technological advancements in the livestock industry, which will help to reduce LCEs. Second, NIC affects the factors that reduce the misallocation of factors in the livestock industry. The advent of sophisticated NIC curtails transaction costs and mitigates asymmetry in commercial information [33], thereby fostering a harmonization of factors within the livestock sector. This factor alignment, in turn, will augment production efficiency and rationalize the production structure within the livestock industry, ultimately culminating in a reduction of LCEs. Lastly, NIC influences the factors that induce shifts in livestock industry scale. By fostering interregional collaboration [34], NIC promotes economic progress. Moreover, it effectively curtails information asymmetry within the market [35], thereby guiding more factors such as capital and labor force engaging in the livestock industry, a domain that yields comparatively higher returns within the agriculture sector [36]. This process will precipitate the expansion of the livestock industry scale, inevitably resulting in an upswing in LCEs.
Although the literature on the impact of NIC on LCEs is currently lacking, research from related fields offers valuable references and support for the research methods, theoretical analysis, and conclusions. Luo and Yuan (2022) applied the double difference model and illuminated the potential of NIC to effectively ameliorate carbon emissions through the facilitation of green technology advancements, enhancements in energy efficiency, the optimization of industrial structure, and the establishment of robust financial mechanisms [37]. Awan et al. (2022) applied the innovative Method of Moments Quantile Regression, illuminating the link between augmented internet usage and a commensurate reduction in environmental degradation [38]. Bai et al. (2023) utilized spatial measurements to demonstrate that the rapid development of China’s NIC in recent years effectively limited the spatial transfer of carbon emissions [39]. Wang et al. (2022) employed the instrumental variable-generalized method of moments (IV-GMM) approach, unearthing the dynamic wherein the internet economy exerted an indirect influence on carbon emission efficiency. This phenomenon is engendered through the facilitation of human capital promotion, the fostering of clean technological innovations, and the diversification of the energy mix away from coal. Consequently, the NIC will significantly contribute to the reduction of carbon emissions [40]. Kou and Xu (2022) utilized static panel and panel quantile regression models, elucidating the role of NIC in fostering carbon emissions reduction [41]. Pan et al. (2023) employed the dual fixed effects model and ascertained that NIC played a crucial role in driving the low-carbon transformation of cities. This is achieved through upgrading the industrial structure, promoting green innovation, and strengthening environmental regulations [42].

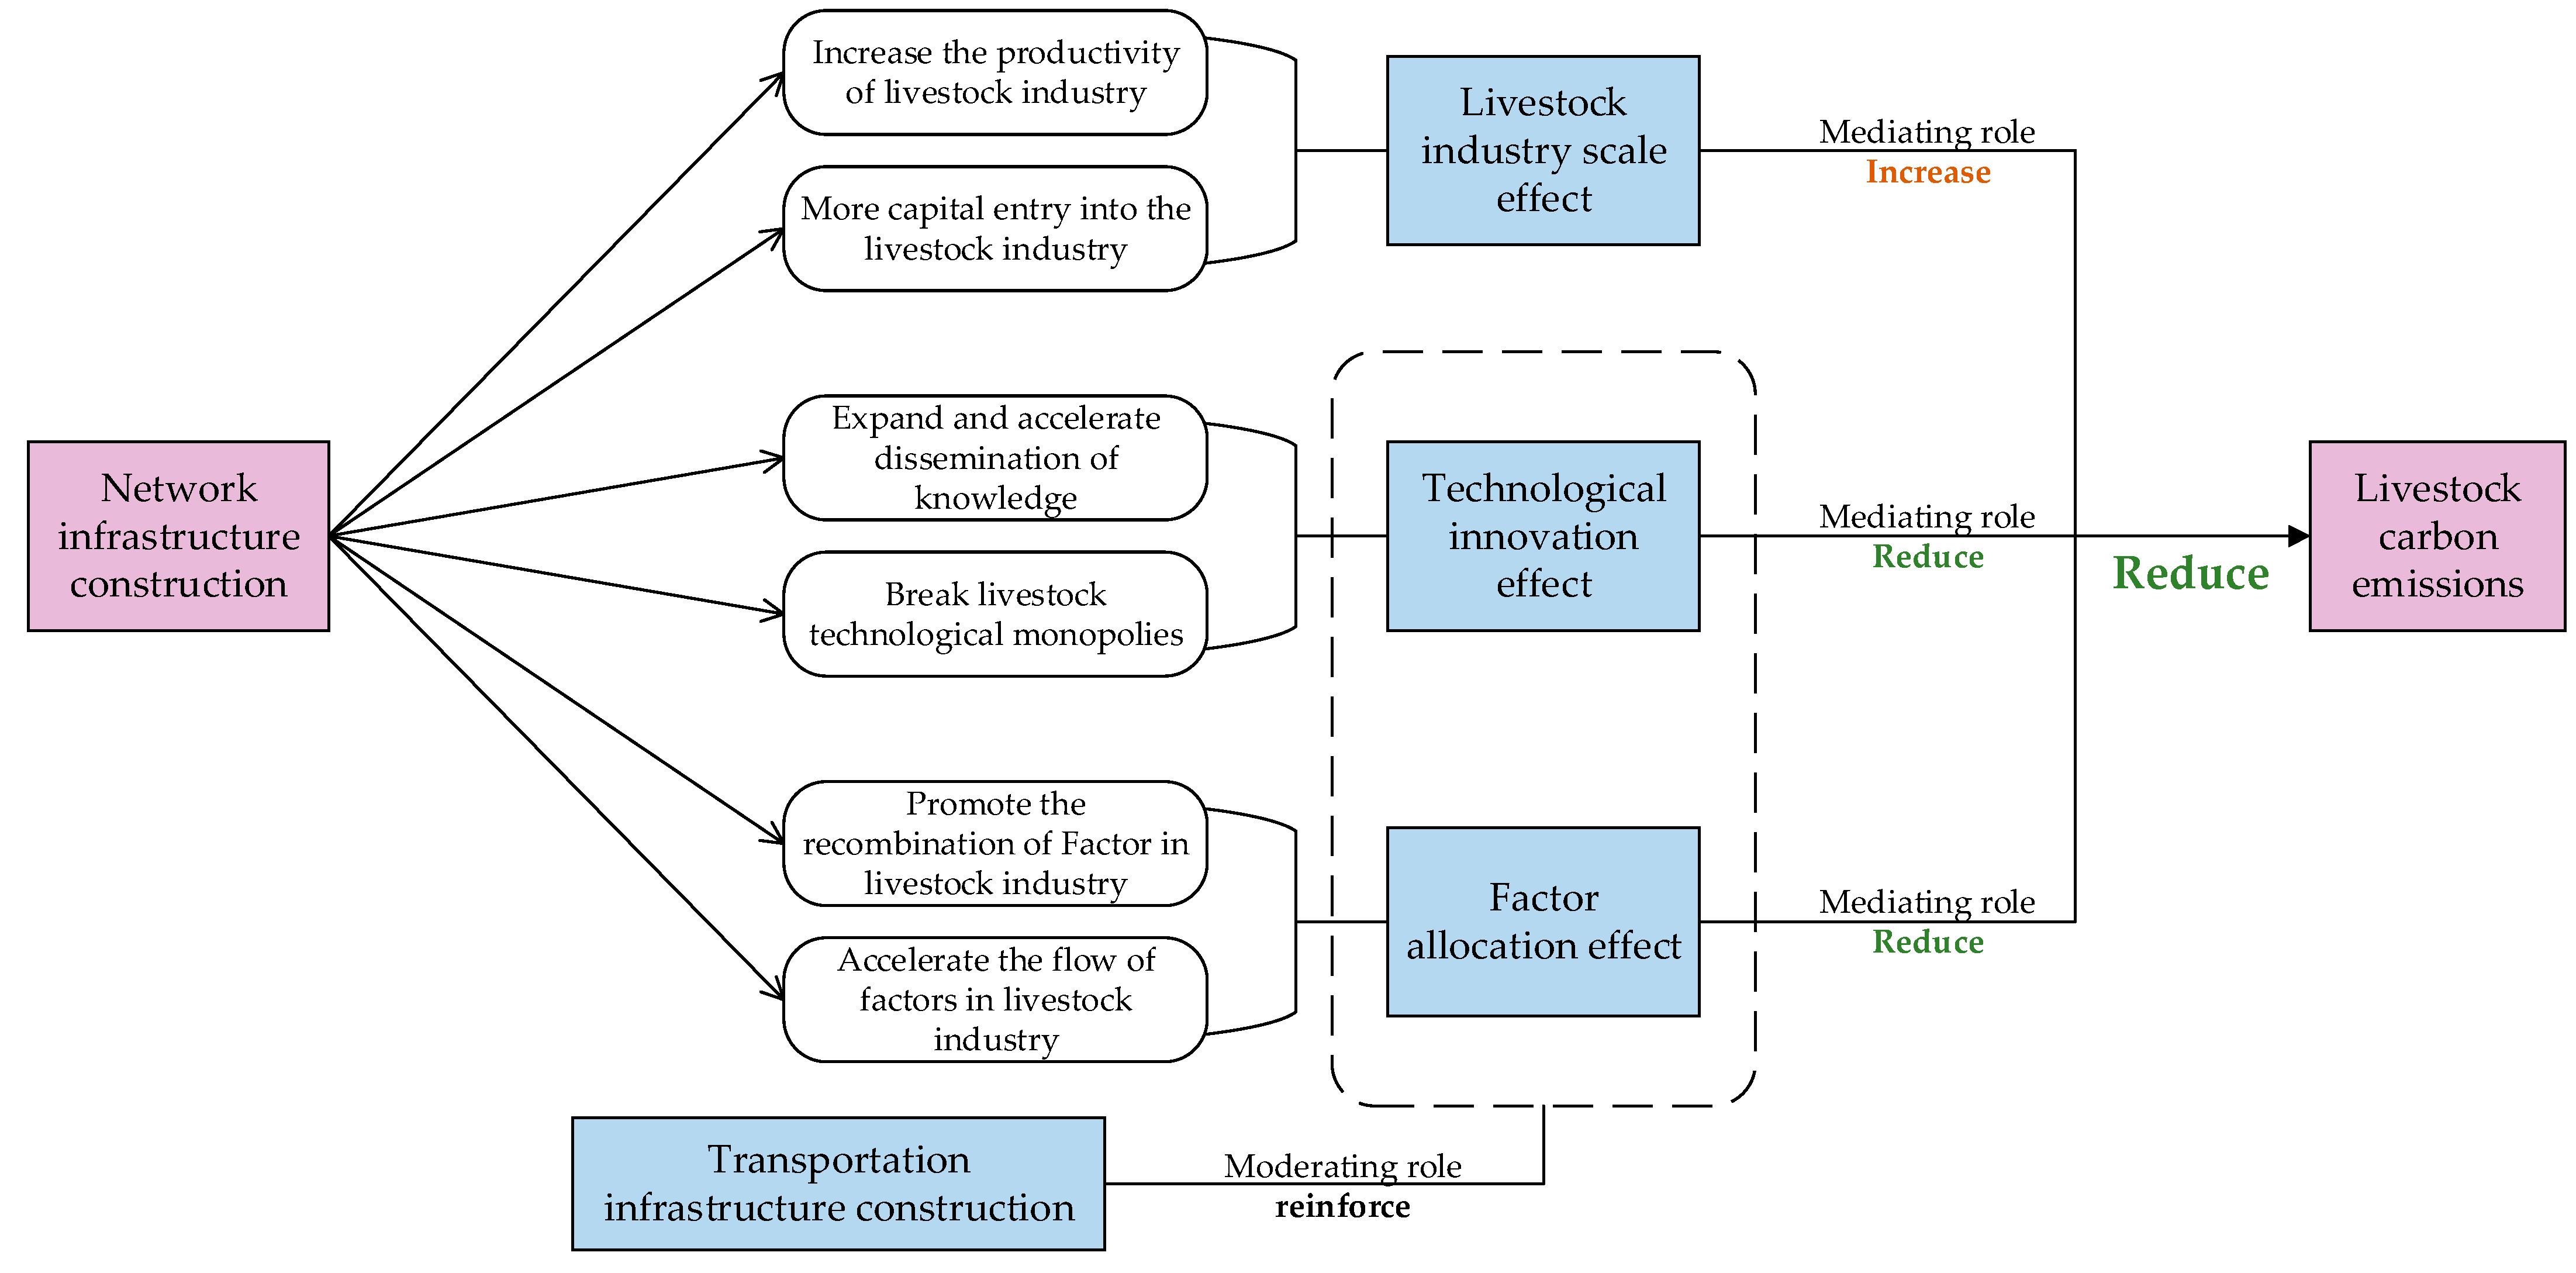
4. Theoretical Analysis and Hypotheses

NIC affects LCEs through the livestock industry scale. On the one hand, NIC facilitates the expansion of livestock production. First, the establishment of network infrastructure exerts a transformative influence on conventional livestock production methods, fostering their seamless digitization and intelligent evolution, leading to the establishment of a modernized livestock production system [43]. The transformation of digitization and modernization has made livestock industry production more efficient, resulting in an expansion in livestock industry scale. For example, the Kangde Egg Industry Corporation in Jiangsu Province has achieved the automation process of egg collection, cleaning, separation of egg white and egg liquid, and production through intelligent monitoring and complex network technology, greatly improving production efficiency and reducing costs, reaching the scale of managing 60,000 chickens per person [44]. It can be seen that the intelligent reform of the traditional livestock industry brought about by NIC is conducive to quantifying production. Second, the NIC augments the transparency of information flow, facilitating expeditious and seamless transmission and exchange of data [45]. This process improved the visibility of the factor return rate. Consequently, factors such as capital and labor force entry into the livestock industry offer the highest returns within the agriculture sector, thereby promoting the expansion of the livestock industry scale. On the other hand, the expansion of the livestock industry scale contributes to increased LCEs. First, LCEs predominantly originate from animal enteric fermentation and manure management, hence the enlargement of the production scale inevitably increases LCEs. Second, the expansion of the livestock industry scale may lead to malicious competition in the entire industry due to its high agglomeration, which may open up barriers to high carbon emissions [46]. Specifically, some livestock enterprises may pursue profits excessively regardless of environmental protection in harsh competitive environments, such as using cheap but high-carbon feed. Moreover, the expansion of the livestock industry scale entails increased demand for related activities such as feed production, transportation, and logistics, entailing amplified energy consumption that, in turn, increases LCEs. Based on the above analysis, the following research hypothesis is proposed:
Hypothesis 1.
NIC can expand the livestock industry scale, thereby increasing LCEs.
NIC affects LCEs through the technology innovation effect. On the one hand, NIC facilitates the enhancement of technology innovation in the livestock industry. First, traditional infrastructure only enables unidirectional information transmission, limiting the multifaceted exchange and dissemination of knowledge. In contrast, the NIC, encompassing broadband and mobile communication, possesses the capacity for seamless information dissemination across temporal and spatial boundaries, facilitating boundless information flow on a large scale. This virtuous mechanism fosters the dissemination, sharing, and amplification of innovative livestock advancements from disparate regions, thereby inciting a spillover effect for progressive livestock technologies [47]. For example, the promotion of the “smart ranch” model based on cloud platforms and big data in China can achieve information sharing and business linkage among multiple livestock enterprises and improve the dissemination of the latest technology nationwide [48]. Second, the paucity of information resources in the livestock technology market, predominantly controlled by a limited number of enterprises, has spawned pronounced information asymmetry and hampered the efficacy of livestock technology innovation endeavors. The transmissibility facilitated by NIC serves as a solution to information asymmetry within the livestock technology market, extending access to cutting-edge technology for more enterprises, thereby enhancing the efficiency and quality of livestock technology innovation. On the other hand, the incorporation of low-carbon-friendly technologies within the livestock industry exerts a positive impact on curtailing wastes and optimizing resource utilization, and, consequently yielding a contribution to mitigate LCEs. For example, the research and application of biodegradation technology can effectively treat organic waste in the livestock industry achieve resource recycling and reuse, and reduce pollution and emission. Based on the above analysis, the following research hypothesis is proposed:
Hypothesis 2.
NIC is conducive to promoting technology innovation in the livestock industry, thereby reducing LCEs.
NIC affects LCEs through the factor allocation effect. On the one hand, NIC facilitates the efficiency of factor allocation. First, it instigates a departure from the conventional mode of factor allocation. Traditional factor flows are typically limited within specific sectors or regions. Networks inherently embody characteristics of intertemporal and unrestricted dissemination, thereby facilitating the seamless conversion and recombination of labor, capital, and information among diverse individuals, sectors, and regions. These transformative characteristics effectively mitigate factor misallocation and rectify imbalances in supply and demand stemming from spatial constraints and information asymmetry within the livestock industry, ultimately culminating in the enhancement of factor allocation efficiency. For example, using big data technology to establish a talent pool for the livestock industry can timely understand the expertise of experts in this field, providing guarantees for the rational flow of experts [49]. Second, the progress in NIC accelerates the speed of factor allocation. With the further development of NIC, more data centers, cloud computing platforms, and other cutting-edge information hubs are established. These platforms can afford augmented computing and storage capacities, thereby expanding the pathways for factor allocation and fostering factor mobility within the livestock industry [50]. Thus, the overall efficiency of factor allocation can be enhanced. On the other hand, the improvement in factor allocation efficiency contributes to a suppression of LCEs. Heightened factor allocation efficiency mitigates imbalances that might otherwise arise between the upstream and downstream segments of the production chain, as well as between the demand and supply sides, thus curbing resource wastes in production processes and the attendant reduction of unnecessary LCEs [51]. For example, the NIC has flourished in the development of e-commerce platforms, which can integrate various supply and demand information, thereby providing effective sales channels and price information for livestock producers, reducing inventory and unsold risks, and ultimately reducing carbon emissions caused by unnecessary waste. Based on the above analysis, the following research hypothesis is proposed:
Hypothesis 3.
NIC will improve the efficiency of factor allocation, thereby reducing LCEs.
The development of NIC represents a pivotal opportunity for alleviating LCEs. As analyzed earlier, while NIC can impart a livestock industry scale effect leading to an increase of LCEs, it simultaneously facilitates mitigation of LCEs through technology innovation and factor allocation effects. However, the potential influence of the livestock industry scale effect may be superseded by the concurrent ameliorating impact of the technology innovation effect and factor allocation effect. As a result, NIC might emerge as an environmentally friendly venture, fostering a decline in LCEs. Based on the above analysis, the following research hypothesis is proposed:
Hypothesis 4.
NIC will mitigate LCEs.
The level of transportation infrastructure construction moderates the impact of NIC on LCEs. First, the transportation of materials, devices, and products, as well as the smooth flow of the labor force within the livestock industry, rely significantly on well-developed transportation infrastructure construction. Consequently, well-developed transportation infrastructure construction might facilitate the factor allocation effect triggered by NIC, thereby strengthening the emission-reducing effect of NIC on LCEs [51]. Second, developed transportation infrastructure construction enables the mobility of researchers, facilitating on-site exchanges and mutual learning among them, which fosters the technology innovation effect triggered by NIC, thereby strengthening the emission-reducing effect of NIC on LCEs. Based on the above analysis, the following research hypothesis is proposed:
Hypothesis 5.
The transportation infrastructure construction plays a moderating role by strengthening the emission-reducing effect of NIC on LCEs.
In summary, NIC can increase LCEs through livestock industry scale effect, and can reduce LCEs through technological innovation effect and factor allocation effect. And the emission reduction effects triggered by technological innovation and factor allocation efficiency exceeds the emission increasing effect of livestock industry scale, so NIC will reduce LCEs. In addition, the transportation infrastructure construction will strengthen the reducing effect of NIC on LCES. The entire conceptual framework can be seen in Figure 1.

5. Methods and Data

5.1. Econometric Model

This study employs a two-way fixed effects model controlling year and provincial effects to examine the impact of NIC on LCEs:
L C E i t = α 0 + α 1 N I C i t + β j X i t + μ i + ϑ t + ε i t
where subscript i represents the ith province and subscript t represents the t year. L C E i t denotes the explained variable, which represents LCEs in province i in year t. N I C i t represents the level of NIC, and its coefficient α 1 reflects the effect of NIC on LCEs. X i t represents control variables that capture the impact of time-varying factors specific to each province on LCEs. ϑ t represents year fixed effects, μ i represents province fixed effects, and ε i t is the residual term. The unit of the explained variable, LCEs, is measured in kilotons and varies between hundreds and millions across provinces.

5.2. Variable Selection

5.2.1. Explained Variable

The accounting methods of LCEs have evolved from the OECD measurement, the Intergovernmental Panel on Climate Change (IPCC) coefficient method, and Life cycle assessment (LCA). At present, the IPCC coefficient method is widely used due to its high accuracy and strong operability [52]. The greenhouse gas emissions from livestock mainly come from methane ( C H 4 ) produced by ruminant animal enteric fermentation and methane ( C H 4 ) and nitrous oxide ( N 2 O ) produced by livestock manure management. In this study, we selected cattle, sheep, horses, mules, donkeys, camels, pigs, poultry, and rabbits as the carbon emission accounting objects. We calculated the C H 4 and N 2 O emissions based on the greenhouse gas emission coefficient and average feeding number of various livestock and poultry. Then we converted C H 4 and N 2 O into C O 2 equivalents based on their global warming potentials. The conversion factors used were 25 for C H 4 and 298 for N 2 O . The calculation formula for livestock greenhouse gas emissions is as follows:
L C E = L C E C H 4 + L C E N 2 O = N i × δ i + N i × θ i
where L C E , L C E C H 4 , and L C E N 2 O represent the total greenhouse gas emissions from livestock, C H 4 emissions, and N 2 O emissions, respectively. N i represents the average feeding number of the ith type of animal being raised, while δ i and θ i represent the C H 4 and N 2 O emission coefficient for the ith type of animal.
Given that different types of animals have varying feeding cycles, it is necessary to adjust the average number of animals raised based on the number of animals slaughtered and the year-end stock. Following the approach by Hu (2011) [53], when the slaughter rate exceeds 1, the average number of animals raised is calculated as follows:
N i = D a y s a l i v e i × L i s t i n g i 365
where D a y s a l i v e i represents the lifecycle of the ith type of animal, with lifecycles of 200 days for pigs, 55 days for poultry, and 105 days for rabbits.
For animals with a slaughter rate less than 1, the average number of animals raised is calculated as follows:
N i = 1 2 × S t o c k i t + S t o c k i t 1
where S t o c k i t and S t o c k i t 1 represent the end-year stock of the ith type of animal for the current year and the previous year, respectively.
The C H 4 emission coefficients for animals in this study are sourced from the 2006 IPCC Guidelines for National Greenhouse Gas Inventories, while the N 2 O emission coefficients are sourced from Hu (2010) [53]. For non-dairy cattle, it is derived as the average of buffalo and water buffalo. The specific emission coefficients are provided in Table 1.

5.2.2. Explanatory Variables

Drawing on the approach of Shen et al. (2022), using the number of internet access ports to represent the level of NIC can directly reflect the level of network infrastructure supply [54]. Although the number of internet users and telecommunications business volume in China are directly related to the supply of internet infrastructure, they are influenced by consumer communication demand [55], hence these two indicators are used for robustness checks.

5.2.3. Control Variables

The control variables include: (1) Urbanization rate. As urbanization advances, a growing influx of rural residents migrates to urban centers, engendering a decline in the agricultural workforce. As a consequence, the number of laborers involved in livestock farming diminishes, culminating in a reduction in LCEs [33]. To measure urbanization rate, this study uses the ratio of urban permanent population to total population. (2) Agricultural structure. In the realm of agriculture, a direct correlation is confirmed between the escalation of the livestock industry’s proportion and the concomitant rise in LCEs [56]. To measure the relative scale of livestock industry production, this study adopts the ratio of the total output value of the livestock industry to that of agriculture, forestry, animal husbandry, and fishery. (3) Education level. As the education level of livestock industry practitioners advances, they are more easily to learn novel low-carbon technologies and efficient resource-saving management methods within the production process, thereby achieving a reduction in LCEs [30]. To measure the education level, this study adopts the ratio of higher education and secondary school students to the total permanent population within each province. (4) Livestock fiscal expenditure. The extent of financial support by the government to the livestock industry exhibits a direct correlation with the development of livestock production, thereby indirectly influencing the volume of LCEs [57]. This study employs the ratio of annual agricultural, forestry, and water fiscal expenditure to the total fiscal expenditure within each province as a metric to represent the level of livestock fiscal expenditure. (5) Income level. As income level rises, so does the purchasing power and demand for meat, eggs, and dairy products across the nation. This upswing in consumer demand fosters the scale of the livestock production, which will simultaneously bring higher LCEs [31]. This study uses China’s per capita disposable income to represent income level.

5.2.4. Intermediate Variables

Based on the theoretical analysis in the previous sections, it can be inferred that the NIC affects LCEs through three pathways: livestock industry scale effect, technology innovation effect, and factor allocation effect. This study employs the logarithm of total livestock output value to represent the livestock industry scale. The number of patents granted in each province per year is used to indicate the level of technology innovation. Following the approach of Bai and Liu (2018) [58], the capital misallocation index and labor misallocation index are calculated to measure the degree of factor allocation. Lower the indexes, higher the degree of factor allocation. The capital misallocation index and labor misallocation index are computed as follows:
γ K i = K i K s i θ K i θ K ,   γ L i = L i L s i θ L i θ L
where s i = Y i / Y represents the share of output Y i in the total output Y of the economy for region i . θ K = i N s i θ K i represents the output-weighted contribution of capital. K i / K represents the actual proportion of capital used in region i relative to the total capital stock. s i θ K i / θ K represents the theoretical proportion of capital that should be used in region i under efficient allocation. The ratio of K i / K to s i θ K i / θ K reflects the deviation between the actual amount of capital used and the amount that would be used under efficient allocation, indicating the degree of capital misallocation in region i . θ L = i N s i θ L i represents the output-weighted contribution of labor. L i / L represents the actual proportion of labor force in region i relative to the total labor force. s i θ L i / θ L represents the theoretical proportion of labor that should be used in region i under efficient allocation. The ratio of L i / L to s i θ L i / θ L reflects the deviation between the actual labor force and the labor force that would be used under efficient allocation, indicating the degree of labor misallocation in region i .
To calculate the capital output elasticity ( θ K ) and labor output elasticity ( θ L ), we emploied the Solow residual method. Assuming a constant return to scale C-D production function, the production function is defined as follows:
Y i t = A K i t θ K i L i t 1 θ K i
By taking the natural logarithm of the variables in the above equation and regressing them using historical data, we obtain the values of θ K i and θ L i . The output variable Y i t is represented by the GDP of each province, the labor input L i t is represented by the average annual employment in each province, and the capital input K i t is calculated using the perpetual inventory method, as defined by the following formula:
K t = I t P t + 1 δ t K t 1
where K t represents the current stock of fixed capital. I t represents the total formation of nominal fixed assets in the current period. P t is the price index for fixed asset investment. δ t represents the depreciation rate, with a value of 9.6% [59], and K t 1 represents the fixed capital stock from the previous period.
Finally, after calculating the capital misallocation index and labor misallocation index, for convenience in subsequent regression analysis, we take the absolute values of all the capital misallocation index and labor misallocation index.

5.2.5. Moderating Variable

Due to the regulatory role of transportation infrastructure construction in livestock industry, which generally occurs during the transportation of goods, the variable of transportation infrastructure construction is represented by freight volume.

5.3. Data Sources and Descriptive Statistics of Variables

This study utilizes panel data from 30 provincial-level administrative regions (excluding Tibet, Hong Kong, Taiwan, and Macau) for the period 2011 to 2020. The original data for the explained variable, LCEs, is sourced from the China Livestock and Veterinary Yearbook. Other variables’ original data is derived from the China Statistical Yearbook. Detailed descriptions and descriptive statistics of variables are presented in Table 2.

6. Empirical Analysis

6.1. Analysis of Baseline Regression Results

This study estimates the impact of NIC on LCEs. A two-way panel fixed effects model with year and provincial fixed effects is employed. The regression results are presented in Table 3. The regression results without control variables are presented in Column (1). The regression results with control variables but without fixed effects are shown in Column (2). The results with control variables and provincial fixed effect are presented in Column (3). The results with all control variables, as well as provincial and yearly fixed effects, are presented in Column (4). The regression coefficient of NIC in Column (4) exhibits statistical significance with the number of 0.7864, significant at the 1% level. The regression findings convincingly indicate that NIC has a significant impact on reducing LCEs. More specifically, a 10,000 increment in the count of internet access ports yields a decrease of 0.7864 million tons in LCEs. This outcome is ascribed to the various benefits of NIC, which imparts heightened efficiency in the diffusion of knowledge and information, thereby fostering advancements in emission reduction technologies within the livestock domain. Moreover, this infrastructural development curtails resource wastage resulting from misallocation, thereby effectively reducing LCEs. In summary, the empirical evidence lends robust support to the assertion of Hypothesis 4.

6.2. Solution to Endogeneity

The three main reasons for endogeneity are reverse causality, omitted variables, and measurement errors. For this study, objective carbon emissions cannot affect the subjective behavior of NIC. Therefore, we analyze the possible reasons for endogeneity from two aspects: omitted variables and measurement errors. This study discusses the endogeneity from two key perspectives. First, the omitted variables. The model above considers a series of variables from both the supply and demand sides and controls for provincial fixed effects and year-fixed effects to account for unobservable variables varying with provinces like the primary livestock species in each province [60], alongside controlling for unobservable variables varying with time such as economic fluctuations. Nevertheless, even after controlling for year and province effects, some variables that vary both over time and across provinces cannot be controlled, such as the consumption habits toward livestock products and the agricultural environment in each province. The omitted variables may result in potential disparities within the regression outcomes. Second, measurement error. The emission coefficients used in calculating LCEs are based on unified data, as there is currently no research that provides emission coefficients for specific livestock species in different regions in China. Hence, there is a measurement error in LCEs, which could also contribute to inconsistencies in the regression results. In summary, the model faces endogeneity issues.
To address endogeneity, we first used the instrumental variable method. The key to using the instrumental variable method lies in identifying an appropriate instrumental variable. In this study, the number of fixed phones per 100 people in 1984 serves as the selected instrumental variable. This selection is based on the following considerations: first, the selected instrumental variable satisfies the correlation requirement. Fixed telephony has exerted an obvious influence on the emergence and evolution of regional NIC. As a result, cities boasting higher fixed telephone penetration rates have correspondingly witnessed notable advancements in communication infrastructure, accompanied by relatively elevated levels of internet penetration. Second, the selected instrumental variable fulfills the exogeneity requirement. With the rise of mobile phones and the appearance of diverse communication platforms, fixed telephones have gradually receded from the forefront of public consciousness. Consequently, the penetration rate of fixed phones in 1984 is unlikely to exert direct influences on LCEs from 2011 to 2020 (Since this instrumental variable is a value that does not change over time and cannot be used for panel regression, it is multiplied by the reciprocal of the year and multiplied by 1000 during regression). The regression results presented in column (1) and column (2) of Table 4 indicate that after employing the instrumental variable method, the significant negative effect of NIC on LCEs persists. These findings verify the validity of Hypothesis 4, even after considering the implications of endogeneity.
We then emploied the system Generalized method of moments (Sys-GMM) and difference method of moments (Diff-GMM) to estimate the dynamic model to address endogeneity. The dynamic model is as follows:
L C E i t = γ L C E i t 1 + α 0 + α 1 N I C i t + β j X i t + μ i + ϑ t + ε i t
where L C E i t 1 is one-year-lagged L C E i t , and other parts are similar to Formula (1). In Table 4, Column (3) shows the regression outcome of Sys-GMM, while Column (4) shows the regression outcome of Diff-GMM. The coefficients of NIC in Column (3) and Column (4) are both significantly negative, which indicate that after employing GMM regress, the emission reduction effect of NIC on LCEs still persists. These findings verify the validity of Hypothesis 4, even after considering the implications of endogeneity.

6.3. Robustness Checks

To ensure the reliability of the empirical findings presented earlier, this study conducts the following robustness checks.

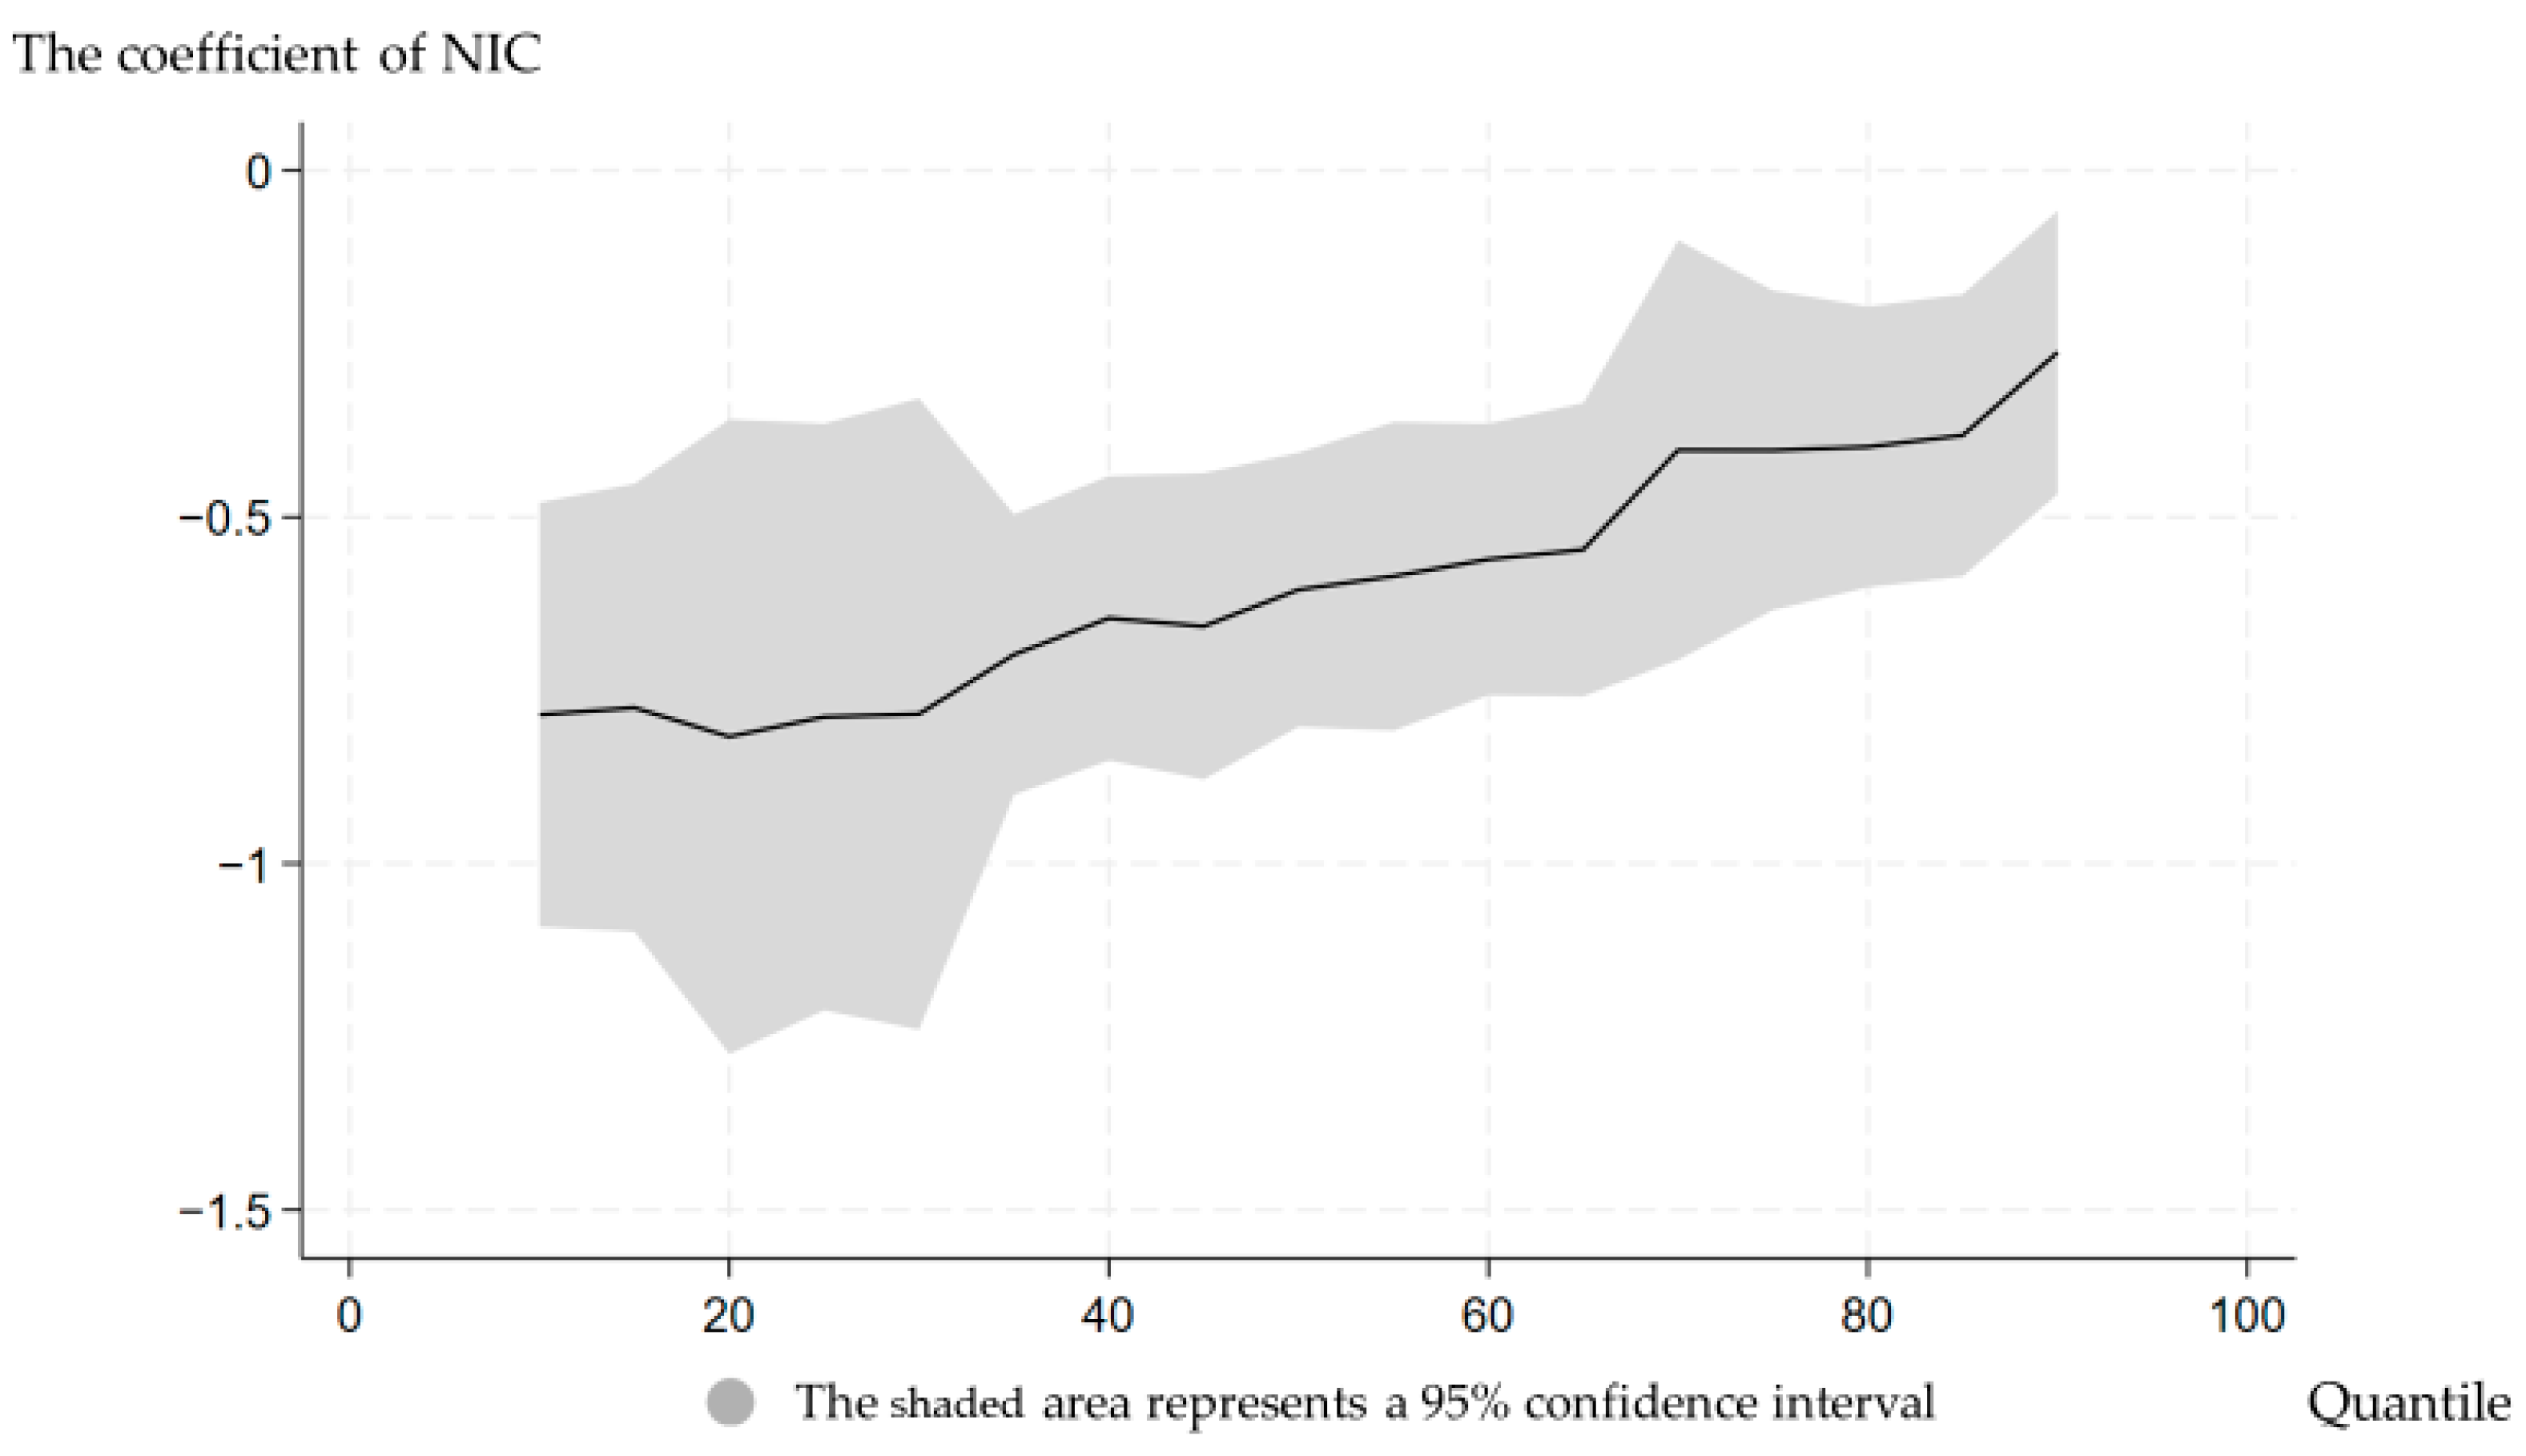
6.3.1. Quantile Regression

The parameter estimates derived from quantile regression can provide more comprehensive and informative outcomes, therefore this study employs quantile regression as a robustness check. Specifically, quantile regressions are conducted at the 10th, 25th, 50th, 75th, and 90th percentiles of LCEs, with the resultant outcomes presented in Table 5. Figure 2 depicts the variation of NIC coefficients with quantiles. The regression results reveal that the coefficients of NIC exhibit significant negative effects at the 1% level across all quantiles, with magnitudes aligning with those observed in the baseline regression. Notably, the magnitude of the NIC coefficient manifests as larger at lower quantiles and relatively smaller at higher quantiles, indicating diminishing marginal effects of NIC on LCEs as the levels of LCEs ascend. The possible reason for this phenomenon is that various factors, including capital and labor technology, have a characteristic of diminishing marginal effects. Therefore, the role of NIC in driving technological progress and factor allocation efficiency on LCEs is also marginal diminishing. In summary, the principal findings of this study withstand rigorous scrutiny under the quantile regression analysis, confirming the robustness and validity of the reported outcomes.

6.3.2. Replacing Explanatory Variables

In the baseline regression, the explanatory variable of NIC is represented by the number of internet access ports. As a part of the robustness checks, this study alternatively uses the number of internet users and the volume of telecommunications business to measure the level of NIC. While both the number of internet users and the volume of telecommunications services can be influenced by consumer communication demands, they nonetheless offer insightful reflections of the extent of NIC [61]. Table 6, with Column (1) featuring regression results based on the number of internet users as the explanatory variable and Column (2) presenting results with the volume of telecommunications services as the explanatory variable, showcases the outcomes. In both Column (1) and Column (2) of Table 6, the regression coefficients of the explanatory variables continue to evince significant negativity, thereby corroborating the consistency of these results with those derived from the baseline regression. Furthermore, in these two robustness checks, the coefficients of the explanatory variables manifest as slightly smaller compared with those observed in the baseline regression, thus affirming the appropriateness and accuracy of the explanatory variable selection in the baseline regression. In conclusion, these outcomes validate the robustness of the principal findings of this study, affirming the steadfastness and credibility of the reported results.
The regression results presented above demonstrate that, under various robustness checks, the regression coefficients of NIC are all significantly negative. This robustly supports the conclusion that NIC has a suppressing effect on LCEs.

6.3.3. PCSE Method

Due to potential issues of heteroscedasticity and serial correlation within groups when analyzing panel data, which can affect the robustness and consistency of estimation results, the panel-corrected standard error (PCSE) regression method was employed to re-estimate the regression results presented earlier, as shown in Column (3) of Table 6. The regression results indicate that even after applying the PCSE model, the coefficient of the explanatory variable remains significantly negative, and its magnitude is close to that obtained in the baseline regression. This confirms the robustness and reliability of the core findings of this study.

6.3.4. Changing the Window Period

The regression period of 2011–2020 is replaced with a shorter period, namely 2016–2020. The results, shown in Column (4) of Table 6, demonstrate that the coefficient of the explanatory variables remain significantly negative. The absolute value of the coefficient of NIC here is greater than that in the baseline regression, indicating that the integration of NIC and livestock industry has become increasingly close in recent years, and related network technologies are playing an increasingly important role in livestock production.

7. Further Analysis

7.1. Heterogeneity Analysis

The foregoing analysis establishes the substantial suppressed influence of NIC on the increase of LCEs. Nonetheless, this analysis only scrutinizes the effect across the entire sample, neglecting potential heterogeneity. In pursuit of more detailed and comprehensive conclusions, this study extends its examination to probe the heterogeneity of NIC’s impact on LCEs from three distinct dimensions: the level of LCEs, the level of NIC, and geographical location.

7.1.1. Heterogeneity of LCEs Level

Given the regional differences in LCEs, the sensitivity of LCEs to the impact of NIC may exhibit variations across different regions. To confirm it, the data are divided into two distinct groups based on the average LCEs from 2011 to 2020. The first group encompasses provinces characterized by higher average LCEs, while the second group includes provinces with comparably lower average LCEs. The regression results are presented in Table 7, with Column (1) unveiling the outcomes for the first group and Column (2) showing the results for the second group. The regression results indicate that the coefficients of the explanatory variables are significantly negative for both groups, but the absolute magnitude and significance are greater for the first group. The results suggest that NIC has a stronger impact on LCEs in regions with higher LCEs. This phenomenon can be attributed to the fact that in regions with higher LCEs, livestock farming tends to be more intensive in scale, therefore the improvements in livestock farming techniques and practices brought about by NIC can be applied more quickly and on a larger scale [61].

7.1.2. Heterogeneity of NIC Level

The effects of NIC are different at distinct developmental stages. In the initial stage of construction, the focus was on expanding network coverage, while in the advanced stage, with the backbone of the NIC completed, the focus shifted towards the quality and stability of the network [62]. Consequently, it is necessary to examine whether different levels of NIC cause heterogeneity in their impact on LCEs. To accomplish this validation, provinces are classified into two groups, grounded in specific criteria. Given the differences across provinces, the explanatory variable in the baseline regression—the number of internet access ports—is largely connected with the population and territorial expanse in different provinces. To make meaningful comparisons between the levels of NIC in various provinces, the proportion of internet users relative to the total population is selected as a more appropriate metric. After computing the average proportion of internet users to the total population for each province spanning from 2011 to 2020, the 15 provinces with higher proportions are classified as possessing a higher level of NIC, while the 15 provinces with lower proportions are classified as having a lower level. The regression outcomes, presented in Table 7, unveil the results for the first group in Column (3) and the results for the second group in Column (4).
The regression findings show that the coefficients of the explanatory variables in both groups are significantly negative, denoting a significant suppressive impact on LCEs in regions characterized by diverse levels of NIC. Nevertheless, the coefficient in the second group exhibits a larger absolute value, signaling a stronger inhibitory effect of NIC on LCEs in regions distinguished by a lower level of NIC. This result indicates that the role of NIC in reducing LCEs has a marginal decreasing characteristic. Therefore, it is necessary to grasp the optimal period for NIC to play its role.

7.1.3. Regional Heterogeneity

The regional heterogeneity in the impact of NIC on LCEs may exist heterogeneity. To unveil this heterogeneity, the study divided all provinces into three distinct groups based on their geographical locations (eastern, central, and western regions), and subsequently conducted separate regressions for each group. The outcomes of these regressions are presented in Table 8, where Column (1), (2), and (3) distinctly delineate the regression results for the eastern, central, and western regions, respectively. Remarkably, the regression results indicate that in the central and western regions, the absolute value of the coefficient of the explanatory variable proves larger and more robust in terms of statistical significance. In contrast, the eastern region exhibits a smaller absolute value for this coefficient and comparatively diminished statistical significance, thereby suggesting a relatively weaker effect of NIC on reducing LCEs. This difference could potentially be attributed to the relatively smaller livestock industry scale in the eastern region due to geographical and natural limitations, consequently resulting in a less pronounced impact in comparison to the central and western regions.

7.2. Mechanism Analysis

Drawing upon the empirical findings, the results convincingly establish the significant role of NIC in mitigating the rise of LCEs. Based on the theoretical analysis above, this study further scrutinizes the mediating effects of livestock industry scale, technology innovation, and factor allocation, while also considering transportation infrastructure construction development as the moderating variable. Through this comprehensive approach, the proposed mechanisms are subjected to rigorous testing and analysis.
Following the approach employed by Ruan et al. (2014) [63], a two-step modeling approach is employed to test the mediating mechanisms. The model is specified as follows:
Z i t = α 0 + α 1 N I C i t + β j X i t + μ i + ϑ t + ε i t
Formula (1) represents the first step of the two-step mediation approach, while Formula (9) represents the second step of the two-step mediation approach, where the mediating variable Z i t is taken as the explained variable, and the explanatory variable N I C i t from the baseline regression is used as the explanatory variable. The remaining control variables are kept consistent with Formula (1). If the coefficient of N I C i t in Formula (9) is statistically significant and has the expected sign, it indicates the presence of a mediating effect.
The test model for the moderation effect in this study is as follows:
L C E i t = α 0 + α 1 I i t + α 3 T I C i t × N I C i t + α 4 S i t + β j X i t + μ i + ϑ t + ε i t
In Formula (10), T I C i t represents the moderating variable. If, after incorporating the moderating variable and the interaction term between the moderating variable and the explanatory variable, the coefficient of the explanatory variable remains significant and the coefficient of the interaction term is also significant, it indicates the presence of a moderation effect.

7.2.1. Mediating Mechanism of Livestock Industry Scale Effect

The regression outcomes exploring livestock industry scale as a mediating variable are presented in Table 9, Column (1). These results unveil a significantly positive coefficient associated with the explanatory variable NIC, thereby indicating the presence of a mediating effect of livestock industry scale. This observation suggests that NIC fosters an expansion of livestock industry scale, subsequently leading to increased LCEs. In summary, Hypothesis 1 has been proven.

7.2.2. Mediating Mechanism of Technology Innovation Effect

The regression results using technology innovation as the mediating variable are presented in Table 9, Column (2). These findings emphasize a significantly positive coefficient attributed to the explanatory variable NIC, thereby proving the presence of a mediating effect concerning technology innovation. This observation suggests that NIC exerts a suppressive influence on LCEs by fostering technology innovation. In summary, Hypothesis 2 has been proven.

7.2.3. Mediating Mechanism of Factor Allocation Effect

The regression results for the mediating variable of factor allocation (capital misallocation and labor misallocation) are shown in Columns (3) and (4) respectively of Table 9. The results indicate that the coefficient of capital misallocation is significantly negative, while the coefficient of labor misallocation is not significant. This suggests the presence of a mediating effect of factor allocation efficiency, wherein NIC reduces factor misallocation, thereby mitigating LCEs. However, the factor allocation effect of NIC mainly comes from the process of capital allocation rather than the process of labor allocation, which indicates that capital plays an important role in the productive process of livestock. The possible reason for this phenomenon is that modern livestock enterprises largely rely on automated management rather than worker management, so labor misallocation plays a small role in influencing channels. In summary, Hypothesis 3 has been proven.

7.2.4. Moderating Effect of Transportation Infrastructure Construction

The regression outcomes encompassing transportation infrastructure construction as the moderating variable are presented in Column (5) of Table 9. Remarkably, these results indicate that even after incorporating the moderating variable of transportation infrastructure construction and the interaction term between this moderating variable and the explanatory variable in the baseline regression, the coefficient of NIC remains significantly negative. Additionally, the coefficient of the interaction term exhibits a significant negative association. This observation signifies that transportation infrastructure construction serves as a catalyzing force, enhancing the reduction effect of NIC on LCEs. Specifically, as transportation infrastructure construction attains greater levels of development, the reduction effect of NIC on LCEs becomes more significant. Possible explanations for this phenomenon are as follows: First, the hardware facilities involved in the process of transportation infrastructure construction heavily rely on labor and raw materials. In regions where transportation infrastructure construction is more developed, the flow of labor and raw materials becomes more convenient, thereby providing a distinct advantage to the development of NIC. Second, the impacts of NIC on technology innovation and factor allocation efficiency also to some extent rely on the smooth flow and exchange of labor, various raw materials, intermediate products, and final goods, while the process of flow and exchange relies on transportation infrastructure construction. Therefore, the robust development of transportation infrastructure construction further enhances the technology innovation effect and factor allocation effect of NIC, and then effectively suppresses LCEs. In summary, Hypothesis 5 has been proven.

7.3. Limitations and Future Endeavors

First, due to the availability of data for variables such as LCEs and NIC, this study only focused on the provincial level. However, in fact, there are significant differences in the structure and development level of livestock industry within each province, as well as the degree and coverage of network infrastructure construction. For example, within Xinjiang Province in China, the northern Xinjiang region has a good ecological environment, suitable climate conditions, and abundant grassland resources, making livestock industry more developed, and the livestock production value of Ili Kazakh Autonomous Prefecture in the northern Xinjiang region accounts for more than half of the province’s total; in contrast, the northern Xinjiang region has relatively poor conditions for livestock industry development due to its dry climate and scarce water sources. Provincial level data may not fully reflect such differences, resulting in biased results. Therefore, future research should further focus on the city-level or even county-level panel data to explore more valuable economic information.
Second, the calculation of LCEs usually uses the Intergovernmental Panel on Climate Change (IPCC) coefficient method, which considers the carbon emission coefficients of animals of the same species as a unified one. However, this calculation method is relatively crude, ignoring the differences in livestock and poultry in different regions. For example, China has a vast territory, with the annual average temperature in the northernmost province of Heilongjiang below 0 °C, while the annual average temperature in the southernmost province of Hainan is above 25 °C. The metabolic rates of the same animals in different regions with huge climate differences also vary, resulting in differences in carbon emission coefficients. With the gradual improvement and refinement of global carbon emission statistics, more accurate carbon emission data from the livestock industry can be used for such research in the future.
Finally, due to the constraints of data, there is no distinction in empirical evidence between whether the LCEs come from traditional small farmers or large-scale farming enterprises. Raising livestock and poultry accounts for an important source of income for Chinese farmers’ survival. If research focuses on traditional small farmers, it can provide more targeted policy recommendations for assisting the low-carbon and efficient transformation of the traditional domestic livestock industry, as well as poverty alleviation and prosperity for farmers. In addition, the data on technological innovation is not detailed enough, and it is not precise enough to include technological innovation in the livestock industry. If there is suitable experimental data in the future, it can be used for research in this area.

8. Conclusions and Implications

This study employed panel data encompassing 30 provinces in China over the period of 2011–2020. Employing a province-year fixed effects model, this study demonstrated that NIC exerts a mitigation effect on LCEs. This conclusion holds steadfastly even after addressing potential endogeneity and conducting various robustness checks. Moreover, we examined the heterogeneity of the reduction effect of NIC across diverse provinces, considering factors such as variations in the level of LCEs, levels of NIC, and geographical regions (eastern, central, and western). Notably, this reduction effect is more obvious in regions characterized by higher LCEs, and lower levels of NIC, as well as provinces situated in the central and western regions of China. Furthermore, the mechanism analysis indicates that NIC increases LCEs through the livestock industry scale effect, while it achieves a reduction in emissions through technology innovation and factor allocation effects. In general, the reduction effects outweigh the emission increase effect. Additionally, transportation infrastructure construction plays a moderating role in reinforcing the mitigation effect of NIC on LCEs. This finding of moderating effect underscores the synergistic interplay between both types of infrastructure can enhance the effective reduction in LCEs. In summation, this study offers profound insights into the profound impact of NIC on LCEs.
Based on the above findings, this study provides the following implications: First, improving informatization and modernization construction of the livestock industry can reduce LCEs. This strategic path constitutes a pivotal direction for the advancement of the modern livestock sector, bestowing the capacity to elevate the efficiency and productivity of livestock farming. In pursuit of this imperative, the government can augment its investments in the informatization construction of the livestock industry and the innovation of livestock technologies. Second, implementing regional targeted policies for reducing LCEs. Considering the heterogeneity observed across regions, tailored policies can be implemented to address specific challenges and opportunities unique to each area. Provinces with higher LCEs or those in the central and western regions may require targeted support to maximize the emission reduction effect of NIC. Third, implementing integrated infrastructure planning. Recognizing the reinforcing moderating effect of transportation infrastructure construction, an integrated approach to infrastructure planning is essential. Coordinating NIC with transportation infrastructure construction projects will amplify the emission reduction potential and yield more profound environmental benefits.

Author Contributions

Conceptualization, M.Y. and P.S.; Methodology, M.Y.; Software, M.Y.; Validation, M.Y. and P.S.; Formal Analysis, M.Y. and P.S.; Investigation, P.S.; Resources, P.S.; Data Curation, M.Y. and W.Y.; Writing—Original Draft Preparation, M.Y.; Writing—Review & Editing, M.Y., P.S. and W.Y.; Supervision, P.S.; Project Administration, P.S.; Funding Acquisition, P.S. All authors have read and agreed to the published version of the manuscript.

Funding

This research was funded by the Social Science Foundation of China (grant number 21BJY115), and the Fundamental Research Funds for the Central Universities (grant number 2022CDJSKPT02).

Institutional Review Board Statement

Not applicable.

Data Availability Statement

The data presented in this study are available upon reasonable request from the first author.

Acknowledgments

We would like to express our heartfelt appreciation to Linjie Zhang for her empirical advices.

Conflicts of Interest

The authors declare no conflict of interest.

References

  1. Han, Y.; Zhang, J.J.; Yuan, M.J. Carbon emissions and economic growth in the Yellow River Basin: Decoupling and driving factors. Front. Environ. Sci. 2022, 10, 2466. [Google Scholar] [CrossRef]
  2. Climate Ambition Summit 2020. Available online: https://www.moj.gov.cn/pub/sfbgw/gwxw/ttxw/202012/t20201230_127109.html (accessed on 16 September 2023).
  3. Wang, Y.Q.; Tao, S.J. Study on the impact of industrial intelligence on the efficiency of industrial carbon emissions in China and its spatial effects. J. Technol. Econ. 2023, 42, 130–140. (In Chinese) [Google Scholar]
  4. Management Measures for Modern Agricultural Production Development Funds from the Central Government. Available online: http://nys.mof.gov.cn/czpjZhengCeFaBu_2_2/201301/t20130116_728308.htm (accessed on 22 August 2023).
  5. National Agricultural Sustainable Development Plan (2015–2030). Available online: https://www.gov.cn/xinwen/2015-05/28/content_2869902.htm (accessed on 23 August 2023).
  6. Wei, M.S.; Yan, T.W.; Luo, S.X. The impacts of scale management and technological progress on green and low-carbon development of agriculture: A quasi-natural experiment based on the establishment of major grain-producing areas. Chin. Rural. Econ. 2023, 2, 41–65. (In Chinese) [Google Scholar]
  7. Food and Agriculture Organization of the United Nations Statistic Database. Available online: https://search.library.wisc.edu/database/UWI12320 (accessed on 23 August 2023).
  8. Summary of Agricultural and Rural Statistics in China. Available online: http://zdscxx.moa.gov.cn:8080/misportal/public/publicationRedStyle.jsp?key=%E4%B8%AD%E5%9B%BD%E5%86%9C%E4%B8%9A%E5%86%9C%E6%9D%91%E7%BB%9F%E8%AE%A1%E6%91%98%E8%A6%81 (accessed on 11 October 2023).
  9. Liu, G.; Luo, Q.F.; Zhang, L.X. The development of animal husbandry since 40 Years of reform and opening-up: Achievements, challenges and countermeasures. Chin. Rural. Econ. 2018, 12, 19–36. (In Chinese) [Google Scholar]
  10. Xu, B.W.; Shen, Z.Y.; Lin, G.H. Evolution of green total factor productivity and regional disparity in China’s husbandry. Chin. J. Eco-Agric. 2019, 27, 612–622. (In Chinese) [Google Scholar]
  11. Du, X.; Zhang, H.M.; Han, Y.W. How does new infrastructure investment affect economic growth quality? Empirical evidence from China. Sustainability 2022, 14, 3511. [Google Scholar] [CrossRef]
  12. Zhu, Y.; Huo, C.J. The impact of agricultural production efficiency on agricultural carbon emissions in China. Energies 2022, 15, 4464. [Google Scholar] [CrossRef]
  13. China Internet Network Development Report 2021. Available online: http://tradeinservices.mofcom.gov.cn/article/lingyu/jsmyi/202107/117921.html (accessed on 12 November 2023).
  14. Guo, J.; Wang, L.; Zhou, W.J.; Wei, C. Powering green digitalization: Evidence from 5G network infrastructure in China. Resour. Conserv. Recycl. 2022, 182, 106286. [Google Scholar] [CrossRef]
  15. Tian, Y.; Feng, C. How does internet development drive the sustainable economic growth of China? Evidence from internal-structural perspective of green total-factor productivity. Sci. Total Environ. 2023, 887, 164125. [Google Scholar] [CrossRef]
  16. Rendel, J.; Mackay, A.; Smale, P.; Manderson, A.; Scobie, D. Optimisation of the resource of land-based livestock systems to advance sustainable agriculture: A farm-level analysis. Agriculture 2020, 10, 331. [Google Scholar] [CrossRef]
  17. Menendez, H.M.; Brennan, J. 82 application of precision sensor technologies, real-time data analytics, and dynamic models on extensive western rangeland grazing Systems. J. Anim. Sci. 2021, 99, 43. [Google Scholar] [CrossRef]
  18. Tu, Y.L.; Feng, B.Y.; Hu, X.N.; Bai, H.W.; Liu, J. The design and implementation of swine feed formulation system based on smart phone platform. Agric. Netw. Inf. 2010, 2, 15–18. (In Chinese) [Google Scholar]
  19. Sun, L.; Zhang, H.F.; Wang, H.M.; Wang, H.; Fu, Y.F. The case of intelligent black water fly breeding in the regional fecal sewage treatment center of Pengyu Biotechnology Co., Ltd. in Cangzhou. N. Anim. Husb. 2023, 4, 9–10. (In Chinese) [Google Scholar]
  20. He, A.G. “Pig networking”—“Internet plus” pig breeding service platform. Sichuan Agric. Agric. Mach. 2019, 4, 16–18. (In Chinese) [Google Scholar]
  21. Hong, T. Innovate the e-commerce model of China’s animal husbandry and pig industry. Chin. Anim. Husb. Vet. Abstr. 2016, 32, 1–2. (In Chinese) [Google Scholar]
  22. Chen, Y.; Shang, J. Estimation and effecting factor decomposition of green house gas emission of animal husbandry industry in four pastoral areas. China Popul. Resour. Environ. 2014, 24, 89–95. (In Chinese) [Google Scholar]
  23. Yao, C.S.; Qian, S.S.; Mao, Y.H.; Li, Z.T. Decomposition of impacting factors of animal husbandry carbon emissions change and its spatial differences in China. Trans. Chin. Soc. Agric. Eng. 2017, 33, 10–19. (In Chinese) [Google Scholar]
  24. Zou, J.; Xiang, C.Y. Research on the livestock environmental efficiency in mainland China and its influencing factors. Environ. Pollut. Control. 2016, 38, 90–96. (In Chinese) [Google Scholar]
  25. Sun, Y.M.; Yang, C.; Wang, M.L.; Xiong, X.Z.; Long, X.F. Carbon emission measurement and influencing factors of China’s beef cattle industry from a whole industry chain perspective. Sustainability 2022, 14, 23. [Google Scholar] [CrossRef]
  26. Hao, G.M.; Zhu, H.H.; Cui, Y.C. Measurement and influencing factors of carbon emissions of China’s livestock husbandry in the post-COVID-19 era—Based on the supply-side perspective. Sustainability 2023, 15, 913. [Google Scholar] [CrossRef]
  27. Shang, L.Y.; Cui, C.; Zhao, H.F. Spatial-temporal evolution characteristics and influencing factors of carbon emission efficiency of animal husbandry in Beijing-Tianjin-Hebei region. Chin. J. Agric. Resour. Reg. Plan. 2023. accepted. (In Chinese) [Google Scholar]
  28. Van Middelaar, C.E.; Berentsen, P.B.M.; Dijkstra, J.; De Boer, I.J.M. Evaluation of a feeding strategy to reduce greenhouse gas emissions from dairy farming: The level of analysis matters. Agric. Syst. 2013, 121, 9–22. [Google Scholar] [CrossRef]
  29. Vida, E.; Tedesco, D.E.A. The carbon footprint of integrated milk production and renewable energy systems–A case study. Sci. Total Environ. 2017, 609, 1286–1294. [Google Scholar] [CrossRef] [PubMed]
  30. Van Den Oever, A.E.M.; Cardellini, G.; Sels, B.F.; Messagie, M. Life cycle environmental impacts of compressed biogas production through anaerobic digestion of manure and municipal organic waste. J. Clean. Prod. 2021, 306, 127156. [Google Scholar] [CrossRef]
  31. Kumari, S.; Fagodiya, R.; Hiloidhari, M.; Dahiya, R.; Kumar, A. Methane production and estimation from livestock husbandry: A mechanistic understanding and emerging mitigation options. Sci. Total Environ. 2020, 709, 136135. [Google Scholar] [CrossRef]
  32. Cassi, L.; Corrocher, N.; Malerba, F.; Vonortas, N. Research networks as infrastructure for knowledge diffusion in European regions. Econ. Innov. New Technol. 2008, 17, 7–8. [Google Scholar] [CrossRef]
  33. Weng, F.L.; Liu, X.; Huo, X.X. Impact of internet use on farmers’ organic fertilizer investment: A new perspective of access to credit. Agriculture 2023, 13, 219. [Google Scholar] [CrossRef]
  34. Chong, Z.H.; Gao, Z.H.; Qin, C.L. Network infrastructure construction and inter-city cooperative innovation: Evidence of the “Broadband China” pilot program and its spread. J. Financ. Econ. 2022, 48, 79–93. (In Chinese) [Google Scholar]
  35. Kusumawardhani, N.; Pramana, R.; Saputri, N.S.; Suryadarma, D. Heterogeneous impact of internet availability on female labor market outcomes in an emerging economy: Evidence from Indonesia. World Dev. 2023, 164, 106182. [Google Scholar] [CrossRef]
  36. Yao, C.S.; Qian, S.S.; Li, Z.T.; Liang, L.W. Provincial animal husbandry carbon emissions in China and temporal-spatial evolution mechanism. Resour. Sci. 2017, 39, 698–712. (In Chinese) [Google Scholar]
  37. Luo, S.C.; Yuan, Y.L. The path to low carbon: The impact of network infrastructure construction on energy conservation and emission reduction. Sustainability 2023, 15, 3683. [Google Scholar] [CrossRef]
  38. Awan, A.; Abbasi, K.R.; Rej, S.; Bandyopadhyay, A.; Lv, K.J. The impact of renewable energy, internet use and foreign direct investment on carbon dioxide emissions: A method of moments quantile analysis. Renew. Energy 2022, 189, 454–466. [Google Scholar] [CrossRef]
  39. Bai, T.T.; Qi, Y.; Li, Z.H.; Xu, D. Digital economy, industrial transformation and upgrading, and spatial transfer of carbon emissions: The paths for low-carbon transformation of Chinese cities. J. Environ. Manag. 2023, 344, 118528. [Google Scholar] [CrossRef] [PubMed]
  40. Wang, J.D.; Dong, K.Y.; Sha, Y.Z.; Yan, C. Envisaging the carbon emissions efficiency of digitalization: The case of the internet economy for China. Technol. Forecast. Soc. Chang. 2022, 184, 121965. [Google Scholar] [CrossRef]
  41. Kou, J.L.; Xu, X.G. Does internet infrastructure improve or reduce carbon emission performance?—A dual perspective based on local government intervention and market segmentation. J. Clean. Prod. 2022, 379, 134789. [Google Scholar] [CrossRef]
  42. Pan, M.J.; Zhao, X.; Lv, K.J.; Rosak-Szyrocka, J.; Mentel, G.; Truskolaski, T. Internet development and carbon emission-reduction in the era of digitalization: Where will resource-based cities go? Resour. Policy 2023, 81, 103345. [Google Scholar] [CrossRef]
  43. Martin, K.; Heinz, B.; Reiner, B.; Wolfgang, B.; Eduardo, C.; Henri, G.; Johannes, M.; Heiko, T.; Kathrin, T.; Clemens, W.; et al. Can livestock farming benefit from industry 4.0 technology? Evidence from recent study. Appl. Sci. 2022, 12, 24. [Google Scholar]
  44. Wu, Q. Efficient and intelligent development of animal husbandry in Jiangsu province. Jiangsu Rural. Econ. 2018, 8, 25. (In Chinese) [Google Scholar]
  45. Chen, Y.Y.; Li, Y.; Li, C.J. Electronic agriculture, blockchain and digital agricultural democratization: Origin, theory and application. J. Clean. Prod. 2020, 268, 122071. [Google Scholar] [CrossRef]
  46. Xu, J.B.; Wang, J.J.; Wang, T.Y.; Li, C.X. Impact of industrial agglomeration on carbon emissions from dairy farming—Empirical analysis based on life cycle assessmsent method and spatial Durbin model. J. Clean. Prod. 2023, 406, 137081. [Google Scholar] [CrossRef]
  47. Yu, B.B. The impact of the internet on industrial green productivity: Evidence from China. Technol. Forecast. Soc. Chang. 2022, 177, 121527. [Google Scholar] [CrossRef]
  48. Ren, Q.H.; Peng, H. Dairy farming: From smart ranching to smart animal husbandry, from data analysis to data application. China Dairy 2020, 12, 79–83. (In Chinese) [Google Scholar]
  49. Zhang, J. The construction of animal husbandry big data platform and the application technology of the Internet of Things. Chin. J. Anim. Husb. Vet. Med. 2022, 12, 59–61. (In Chinese) [Google Scholar]
  50. Wang, B.; Yu, M.X.; Zhu, Y.C.; Bao, P.J. Unveiling the driving factors of carbon emissions from industrial resource allocation in China: A spatial econometric perspective. Energy Policy 2021, 158, 112557. [Google Scholar] [CrossRef]
  51. Wang, D.H.; Hussain, R.Y.; Ahmad, I. Nexus between agriculture productivity and carbon emissions a moderating role of transportation; evidence from China. Front. Environ. Sci. 2023, 10, 2302. [Google Scholar] [CrossRef]
  52. Shi, S.; Li, C.X.; Li, M.T. Review of research from carbon emissions to carbon footprint in livestock husbandry. China Popul. Resour. Environ. 2017, 27, 36–41. (In Chinese) [Google Scholar]
  53. Hu, X.D.; Wang, J.M. Estimation of livestock greenhouse gases discharge in China. Trans. Chin. Soc. Agric. Eng. 2010, 26, 247–252. (In Chinese) [Google Scholar]
  54. Shen, K.R.; Lin, J.W.; Fu, Y.H. Network infrastructure construction, information accessibility and the innovation boundaries of enterprises. China Ind. Econ. 2023, 1, 57–75. (In Chinese) [Google Scholar]
  55. Sun, W.Z.; Guo, D.M. The impact of information infrastructure on enterprise labor demand: Change of labor demand scale and structure, and its influence channel. China Ind. Econ. 2021, 11, 78–96. (In Chinese) [Google Scholar]
  56. Dai, X.W.; Wu, X.; Chen, Y.; He, Y.Q.; Wang, F.; Liu, Y.Y. Real drivers and spatial characteristics of CO2 emissions from animal husbandry: A regional empirical study of China. Agriculture 2022, 12, 510. [Google Scholar] [CrossRef]
  57. Bai, Z.H.; Ma, W.Q.; Ma, L.; Velthof, G.L.; Wei, Z.B.; Havlík, P.; Oenema, O.; Lee, M.R.; Zhang, F.S. China’s livestock transition: Driving forces, impacts, and consequences. Sci. Adv. 2018, 4, eaar8534. [Google Scholar] [CrossRef]
  58. Addessi, W. Population age structure and consumption expenditure composition: Evidence from European countries. Econ. Lett. 2018, 168, 18–20. [Google Scholar] [CrossRef]
  59. Bai, J.H.; Liu, Y.Y. Can outward foreign direct investment improve the resource misallocation of China. China Ind. Econ. 2018, 1, 60–78. (In Chinese) [Google Scholar]
  60. Zhu, T.; Zhang, J. By how much is China’s consumption underestimated? China J. Econ. 2014, 1, 42–67. (In Chinese) [Google Scholar]
  61. Li, K.; Qi, S.Z. Trade openness, economic growth and carbon dioxide emission in China. Econ. Res. J. 2011, 46, 60–72+102. (In Chinese) [Google Scholar]
  62. Qian, Y.; Song, K.H.; Hu, T.; Ying, T.Y. Environmental status of livestock and poultry sectors in China under current transformation stage. Sci. Total Environ. 2018, 622–623, 702–709. [Google Scholar] [CrossRef]
  63. Ruan, R.P.; Zheng, F.T.; Liu, L. The power of religious believing: Does religion influence entrepreneurship? Econ. Res. J. 2014, 49, 171–184. (In Chinese) [Google Scholar]
Figure 1. Conceptual framework: the mechanisms that the NIC affects LCEs.
Agriculture 13 02244 g001
Figure 2. The coefficient of NIC varying with quantiles.
Agriculture 13 02244 g002
Table 1. Greenhouse gas emission coefficients of livestock and poultry (kg/hedd/year).
TypeDairy DowNon-Dairy CowHorseMule/
Donkey
PigCamelSheepRabbitPoultry
C H 4
emission coefficient
Enteric fermentation6851.4181014650.254
Manure management161.51.640.93.51.920.160.080.02
N 2 O
emission coefficient
Manure management11.371.391.390.531.390.330.020.02
Table 2. Descriptive statistics of variables.
VariableVariable DescriptionAverageStandard DeviationMinimum ValueMaximum Value
Livestock carbon emissions (LCE)The calculation method is shown above.
Unit: Million tons.
11,942.11718446.4051254.778834,273.7254
Network infrastructure construction (NIC)Represented by the number of internet access ports.
Unit: 10,000 units.
2034.21501695.278662.00008653.2300
Represented by the number of internet users.
Unit: 10,000 people.
2421.66471711.5861207.000010,922.6693
Represented by the Telecommunications business volume.
Unit: 100 million CNY.
1488.01572038.015445.900016,294.3700
Urbanization rateRepresented by the ratio of the urban permanent population to the total permanent population in each province. This variable has a small order of magnitude, therefore multiply it by 1000.583.3763121.4284349.6000896.0000
Agricultural structureRepresented by the ratio of the total output value of livestock industry to the total output value of agriculture, forestry, animal husbandry, and fishin. This variable has a small order of magnitude, therefore multiply it by 1000.286.612989.9452105.0898581.9365
Educational levelRepresented by the ratio of students in higher education and secondary schools in each province to the total permanent population. This variable has a small order of magnitude, therefore multiply it by 1000.903.7477130.5548599.30581243.0020
Livestock fiscal expenditureRepresented by the ratio of ratio of annual agricultural, forestry, and water fiscal expenditure to total fiscal expenditure. This variable has a small order of magnitude, therefore multiply it by 1000.114.545032.839741.0973203.8401
Income levelRepresented by per capita disposable income of residents in each province.
Unit: CNY.
23,531.518411,158.44818025.360072,232.4000
Livestock industry scaleRepresented by the average annual livestock and poultry production in each province.
Unit: 10,000 units.
44,304.407844,377.3153840.0869250,532.3233
Technology innovationRepresented by the number of authorized patents per year in each province.
Unit: 1 unit.
58,602.216789,366.5462502.0000709,725.0000
Capital misallocationThe calculation method is shown above. This variable has a small order of magnitude, therefore multiply it by 1000.339.71312857.57509.3209392.1609
Labor misallocationThe calculation method is shown above. This variable has a small order of magnitude, therefore multiply it by 1000.270.86361437.74000.0315217.2945
Transportation infrastructure constructionRepresented by the freight volume of each province.
Unit: 10,000 tons.
12,927.020017,538.2877414.000092,002.0000
Instrumental variableRepresented by the number of fixed telephones per 100 people in each provincial capital in 1984. This variable has a small order of magnitude, therefore multiply it by 1000.1241.72364079.2336368.7024746.5710
Table 3. Empirical results of panel two-way fixed effects model.
VariablesLCEs
(1)(2)(3)(4)
NIC−0.9185 ***−0.5874 ***−0.7893 ***−0.7864 ***
(0.1118)(0.1195)(0.1185)(0.1160)
Urbanization rate −4.49551.646919.5329 ***
(3.3334)(3.3619)(6.0516)
Agricultural structure 9.4436 ***7.6727 ***13.0177 ***
(2.6598)(2.5725)(2.6558)
Educational level −7.8218 ***−8.5838 ***−4.6788 ***
(1.3006)(1.2599)(1.3983)
Livestock fiscal expenditure 20.7437 ***13.5741 **17.2525 ***
(6.2549)(6.1672)(6.2025)
Income level 0.02060.02110.1914 ***
(0.0207)(0.0197)(0.0415)
Constant term12,842.3653 ***17,261.9112 ***16,094.1921 ***−2000.2875
(222.1823)(2097.8643)(1708.9864)(4089.1964)
Observations300300300300
R-squared0.4162 0.42280.5204
Number of province30303030
Provincial FEYESNOYESYES
Year FEYESNONOYES
Note: *** and ** indicate significance at the 1% and 5% levels, respectively (t-values in parentheses).
Table 4. Empirical result of instrumental variable method, Diff-GMM, and Sys-GMM.
VariablesNICLCEsLCEsLCEs
(1)
First Stage of IV Method
(2)
Second Stage of IV Method
(3)
Sys-GMM
(4)
Diff-GMM
NIC −1.9068 ***−0.1453 **−0.3679 **
(0.6441)(0.0620)(0.1618)
Instrumental variable308.0213 ***
(89.6242)
LCEs (one-year-lag) 0.9858 ***0.5689 ***
(0.0138)(0.1227)
Urbanization rate6.3972 *30.5603 ***−2.1664 **9.7126
(3.2940)(9.4046)(0.9976)(14.9545)
Agricultural structure−5.0165 ***8.2687 **−0.958512.8074 *
(1.3964)(4.0939)(0.9707)(7.1480)
Educational level−1.4400 *−5.8391 ***−1.8582−1.5005
(0.7449)(1.7597)(1.1822)(1.8493)
Livestock fiscal expenditure−16.9400 ***−4.16870.52493.7449
(3.1234)(14.0541)(3.1539)(9.9517)
Income level0.0503 **0.2126 ***0.00530.1318
(0.0237)(0.0499)(0.0129)(0.0956)
Constant term2515.1480−2420.31762847.7800
(3946.7778)(4785.2655)(2209.2548)
Observations300300270240
R-squared0.76140.34480.98740.5511
Number of id30303030
Provincial FEYESYESYESYES
Year FEYESYESYESYES
Note: ***, ** and * indicate significance at the 1%, 5% and 10% levels, respectively (t-values in parentheses).
Table 5. Empirical results of quantile regression.
VariablesLCEs
(1)
10%
(2)
25%
(3)
50%
(4)
75%
(5)
90%
NIC−0.7852 ***−0.7885 ***−0.6049 ***−0.4038 ***−0.2623 **
(0.1555)(0.2151)(0.1005)(0.1172)(0.1039)
Urbanization rate29.8301 **26.2004 ***21.0773 ***15.3809 **9.9724 ***
(11.5166)(4.6493)(5.2236)(7.7614)(3.0745)
Agricultural structure2.27802.70624.5807 **5.7508 ***6.1814 ***
(2.2722)(2.2898)(2.1030)(1.5944)(1.5163)
Educational level−3.2371 **−2.7145 *−3.3776 **−2.7973−2.0489
(1.4517)(1.6426)(1.3073)(1.8958)(1.4195)
Livestock fiscal expenditure14.9656 ***11.3090 *7.570310.07286.9856 *
(5.3747)(6.1348)(5.4787)(8.2784)(3.8598)
Income level0.2364 ***0.1781 ***0.1399 ***0.0938 **0.0703 ***
(0.0897)(0.0566)(0.0429)(0.0367)(0.0190)
Constant term−32,902.3336 **−27,610.6074 ***−21,488.6849 ***−15,626.3721 *−10,710.2482 ***
(13,680.8804)(6374.9226)(5942.1624)(8911.1041)(3317.2659)
Observations300300300300300
Number of pro3030303030
R-squared0.97210.97690.98320.98100.9792
Firm FEYESYESYESYESYES
Year FEYESYESYESYESYES
Note: ***, ** and * indicate significance at the 1%, 5% and 10% levels, respectively (t-values in parentheses).
Table 6. Empirical results of robustness checks.
VariablesLCEs
(1)
Internet Users
(2)
Telecommunications Business
(3)
PCSE
(4)
2016–2020
NIC−1.7784 ***−0.4704 ***−0.7864 ***−1.3529 ***
(0.2079)(0.0666)(0.1682)(0.3160)
Urbanization rate17.0839 ***19.9216 ***19.5329 ***8.9275
(5.7249)(6.0154)(2.6420)(13.1879)
Agricultural structure12.1715 ***14.0615 ***13.0177 ***18.5247 ***
(2.5467)(2.6131)(1.5644)(3.9669)
Educational level−4.3407 ***−4.9129 ***−4.6788 ***−7.1703 **
(1.3353)(1.3920)(1.1685)(3.0469)
Livestock fiscal expenditure14.5076 **22.7776 ***17.2525 ***23.5931 **
(5.9239)(5.9103)(6.4629)(9.3421)
Income level0.1546 ***0.2106 ***0.1914 ***0.3252 ***
(0.0397)(0.0414)(0.0304)(0.0951)
Constant term2515.1480−3614.8781−24,872.4816 ***816.2611
(3946.7778)(4071.3395)(3206.6826)(9864.4131)
Observations300300300150
R-squared0.56010.52660.98740.5511
Number of id30303030
Provincial FEYESYESYESYES
Year FEYESYESYESYES
Note: *** and ** indicate significance at the 1% and 5% levels, respectively (t-values in parentheses).
Table 7. Empirical results of heterogeneity analysis.
VariablesHeterogeneity of LCEsHeterogeneity of NIC
(1)
High-Level
(2)
Low-Level
(3)
High-Level
(4)
Low-Level
NIC−1.0232 ***−0.8085 ***−0.5681 ***−1.4317 ***
(0.1682)(0.1706)(0.1188)(0.2363)
Urbanization rate24.8898 ***11.297328.1391 ***11.4575
(5.9477)(11.1654)(6.2812)(11.3193)
Agricultural structure7.5310 **16.4140 ***4.919714.7650 ***
(3.1719)(4.1497)(2.9823)(4.9987)
Educational level0.7262−12.3718 ***−3.8938 **−2.2844
(1.5649)(2.2791)(1.5881)(2.3268)
Livestock fiscal expenditure23.7360 ***−27.6642 *26.1292 ***17.6066 *
(6.0111)(14.9409)(6.9550)(10.2033)
Income level0.16150.2103 ***0.1429 ***0.2825
(0.1221)(0.0693)(0.0387)(0.1727)
Constant term−3670.16758730.6467−10,531.5405 **2996.7266
(3753.0034)(8469.5847)(4458.0253)(6840.7090)
Observations150150150150
Number of
province
30303030
R-squared0.57890.60460.57600.5909
Firm FEYESYESYESYES
Year FEYESYESYESNO
Note: ***, ** and * indicate significance at the 1%, 5% and 10% levels, respectively (t-values in pa-rentheses).
Table 8. Empirical results of regional heterogeneity analysis.
VariablesLCEs
(1)
Eastern Region
(2)
Central Region
(3)
Western Region
NIC−0.4477 ***−2.6357 ***−0.9636 ***
(0.0959)(0.4689)(0.2149)
Urbanization rate10.2196 *1.1124−28.6997 *
(6.1329)(20.5507)(16.1938)
Agricultural structure4.7332 **20.1046 ***4.8102
(2.3309)(6.5990)(5.1010)
Educational level−2.8004 *−9.6133 ***2.9701 *
(1.6683)(3.4425)(1.7385)
Livestock fiscal expenditure0.4147−29.1748 *11.9239
(8.4364)(16.9815)(8.5107)
Income level0.1202 ***0.6028 ***−0.2065
(0.0297)(0.2045)(0.2216)
Constant term1050.591715,031.067422,792.8480 **
(4172.9919)(10,299.5881)(10,120.4738)
Observations1209090
Number of provinces1299
R-squared0.76590.73590.5897
Firm FEYESYESYES
Year FEYESYESYES
Note: ***, ** and * indicate significance at the 1%, 5% and 10% levels, respectively (t-values in pa-rentheses).
Table 9. Empirical results of mechanism analysis.
VariablesMediating EffectsModerating Effect of Transportation Infrastructure Construction
Livestock Industry SCALE EffectTechnology Innovation EffectFactor Allocation Effect
(1)
Livestock Industry Scale
(2)
Technology Innovation
(3)
Capital Misallocation
(4)
Labor Misallocation
(5)
LCEs
NIC3.5649 ***36.6431 ***−0.0378 ***0.0094−0.5469 ***
(0.8675)(3.0656)(0.0098)(0.0060)(0.1369)
Transportation infrastructure construction 0.1254 ***
(0.0363)
NIC × Transportation infrastructure construction −0.0000 ***
(0.0000)
Urbanization rate−33.5463−430.2482 ***−0.8371−0.5013−0.5469 ***
(45.2763)(159.9901)(0.5091)(0.3139)(0.1369)
Agricultural structure71.0978 ***103.6833−0.15880.169418.0707 ***
(19.8697)(70.2123)(0.2234)(0.1377)(5.9496)
Educational level10.8123−143.1018 ***0.4905 ***−0.057412.7421 ***
(10.4616)(36.9676)(0.1176)(0.0725)(2.6148)
Livestock fiscal expenditure−44.7134−275.8578 *0.9494 *0.4568−4.6591 ***
(46.4048)(163.9779)(0.5218)(0.3217)(1.4038)
Income level−0.44962.3591 **0.0332 ***−0.0124 ***18.9208 ***
(0.3101)(1.0959)(0.0035)(0.0021)(6.0989)
Constant term33,473.4450326,510.1119 ***−270.0558701.0471 ***−2717.2566
(30,593.8976)(108,107.8647)(344.0142)(212.0736)(4045.3444)
Observations300300300300300
Number of province3030303030
R-squared0.32790.66910.58120.27770.5428
Provincial FEYESYESYESYesYES
Year FEYESYESYESYesYES
Note: ***, ** and * indicate significance at the 1%, 5% and 10% levels, respectively (t-values in parentheses).
Disclaimer/Publisher’s Note: The statements, opinions and data contained in all publications are solely those of the individual author(s) and contributor(s) and not of MDPI and/or the editor(s). MDPI and/or the editor(s) disclaim responsibility for any injury to people or property resulting from any ideas, methods, instructions or products referred to in the content.

