Article

Multi-Sample Detection of Soil Nitrate Nitrogen Using a Digital Microfluidic Platform

1
School of Electrical and Information Engineering, Anhui University of Science and Technology, Huainan 232001, China
2
Intelligent Agriculture Engineering Laboratory of Anhui Province, Institute of Intelligent Machines, Hefei Institutes of Physical Science, Chinese Academy of Sciences, Hefei 230031, China
3
Agricultural Sensors and Intelligent Perception Technology Innovation Center of Anhui Province, Zhongke Hefei Institutes of Collaborative Research and Innovation for Intelligent Agriculture, Hefei 231131, China
*
Authors to whom correspondence should be addressed.
Agriculture 2023, 13(12), 2226; https://doi.org/10.3390/agriculture13122226
Submission received: 24 October 2023 / Revised: 27 November 2023 / Accepted: 28 November 2023 / Published: 30 November 2023
(This article belongs to the Special Issue Advances in Nutrient Management in Soil-Plant System)

Abstract

:
The rapid quantification of nitrate nitrogen concentration plays a pivotal role in monitoring soil nutrient content. Nevertheless, the low detection efficiency limits the application of traditional methods in rapid testing. For this investigation, we utilized a digital microfluidic platform and 3D-printed microfluidics to accomplish automated detection of soil nitrate nitrogen with high sensitivity across numerous samples. The system combines digital microfluidics (DMF), 3D-printed microfluidics, a peristaltic pump, and a spectrometer. The soil solution, obtained after extraction, was dispensed onto the digital microfluidic platform using a micropipette. The digital microfluidic platform regulated the movement of droplets until they reached the injection area, where they were then aspirated into the 3D-printed microfluidic device for absorbance detection. Implementing this approach allows for the convenient sequential testing of multi-samples, thereby enhancing the efficiency of nitrate nitrogen detection. The results demonstrate that the device exhibits rapid detection (200 s for three samples), low reagent consumption (40 µL per sample), and low detection limit (95 µg/L). In addition, the relative error between the detected concentration and the concentration measured by ultraviolet spectrophotometry is kept within 20%, and the relative standard deviation (RSD) of the measured soil samples is between 0.9% and 4.7%. In the foreseeable future, this device will play a significant role in improving the efficiency of soil nutrient detection and guiding fertilization practices.

1. Introduction

Soil nitrate nitrogen serves as a primary reservoir of vital nitrogen for the flourishing of crops [1,2,3]. Inadequate levels of soil nitrate nitrogen could have a significant detrimental effect on grain productivity, whereas excessive application of nitrogen fertilizers may result in resource inefficiency and environmental contamination [4,5,6,7]. Therefore, it is of great theoretical and practical significance to monitor the accurate content and dynamic distribution in the formation of nitrate nitrogen [8,9]. The conventional approach for nitrate nitrogen detection entails the manual examination of individual samples conducted by skilled personnel, which lacks the element of automation. The circumstances call for the implementation of mechanized machinery to augment the efficacy of detection and alleviate physical exertion. Lately, there has been an upsurge in the adoption of robotic systems for the identification of soil nitrate. However, these automated detection devices frequently have a significant physical bulk and are constrained to perform only individual sample analyses [10,11]. Hence, there arises a pressing demand for a compact and automated apparatus dedicated to analyzing soil nitrate levels across multiple samples. Up to now, various analytical techniques have emerged for detecting soil nitrate. These include microfluidic paper-based devices [12], electrochemical sensors [13,14], ion-selective electrodes [15,16], capillary electrophoresis sensors [17,18,19], and UV spectrophotometric detection [20,21]. Nevertheless, some researchers have employed paper-based devices for on-site monitoring of nitrates. These devices are simple to operate, but each paper-based device can only test one sample at a time. Moreover, these methodologies are limited to individualized sample assessments. For example, researchers such as Md. Azahar Ali et al. have used a combination of microfluidics and electrochemistry to measure soil nitrate [13]. The sample is injected into the microfluidic device using a syringe pump for electrochemical detection. However, the microfluidic channels need to be cleaned after each sample measurement, requiring additional time before the next soil sample can be tested. In addition, researchers have used 3D-printed microfluidics devices with integrated membranes and embedded reagents [20]. But this method can only detect one sample at a time and requires a waiting time of at least 5 min. Finally, there are researchers like Ming Chen who have used ion-selective electrodes to detect soil nitrate [22]. Nevertheless, this detection method is also limited to spot measurements of individual samples. Typically, after measuring a sample using these methods, manual cleaning is required before measuring the next sample.
In response to the above-mentioned issues, in recent years, digital microfluidics technology has been applied in various fields such as food safety [23,24], medicine [25,26,27], and environmental monitoring [28,29], enabling multi-sample detection and even multi-parameter detection. In order to achieve multi-channel detection of soil nitrate, digital microfluidics technology was introduced in this study. According to the National Standard of the People’s Republic of China (GB/T 32737-2016), soil nitrate is typically optically detected at wavelengths of 220 nm and 275 nm. However, when performing optical detection on a digital microfluidic platform, there is an issue with the short optical path length of droplets in vertical detection using closed digital microfluidic chips [30,31,32]. To address this problem, some researchers have proposed detecting droplets from a horizontal plane [33]. However, this method may result in slight differences in the optical path length for each detection, and the fiber optic ports may be prone to contamination. It is worth noting that fixed-length photometric detection can be achieved in microfluidics, and some researchers have used microfluidic structures to increase the optical path length and improve sensitivity [34,35,36]. Nevertheless, materials such as PMMA have lower light transmittance in the 200 nm to 300 nm range compared to quartz glass. Some researchers have employed three-layer quartz glass fabrication for microfluidics [37,38], which achieves good light transmittance in the 200 nm to 300 nm range and a 10 mm optical path length. The edges of the detection channels have also been polished. Due to the 350 µm depth and 350 µm width of the channel walls, it is challenging to polish the inner walls, resulting in a certain degree of unevenness on the channel’s inner surface. Consequently, there is an urgent need for a microfluidic structure with highly sensitive and flat inner and outer surfaces to be integrated into digital microfluidics for the high-sensitivity detection of nitrate.
Herein, we developed an integrated digital microfluidics and 3D-printed microfluidics device for high-sensitivity and automated detection of soil nitrate nitrogen in multiple samples. The device utilizes 3D-printed microfluidics channels, with the detection channel’s two ends embedded with quartz glass to construct the optical path. It achieves high sensitivity and full-spectrum detection by ensuring a smooth 10 mm optical path and flat inner and outer surfaces. The 3D-printed microfluidics device incorporates an SMA905 collimating mirror, threaded into place, to enable absorbance detection with a fiber optic spectrometer. Furthermore, a systematic comparison of soil nitrate nitrogen detection data was performed with a desktop UV spectrophotometer, demonstrating a strong correlation between the two methods. Hence, this device enables low reagent consumption, low detection limits, and multi-sample testing for soil nitrate nitrogen.

2. Materials and Methods

2.1. Chemicals and Materials

Ultrapure water (18.25 MΩ cm, DI water) was used to prepare all reagent solutions. Potassium chloride (KCl, purity of 99.5%) and potassium nitrate ( K N O 3 , purity of 99.997%) were purchased from Shanghai Aladdin Biochemical Technology Co., Ltd. (Shanghai, China). The 5 cst silicone oil was obtained from Dow Corning (Midland, MI, USA). Laboratory film was purchased from Parafilm Company (Neenah, WI, USA). The 3D-printed microfluidics was produced by the San Wei Hou Company under JiaLiChuang Company, and the material selected for printing was LEDO 6060 (Shenzhen, China). The AB glue was produced by Hengjun Technology Co., Ltd. (Shenzhen, China). Quartz glass was purchased from Donghai Qi Optical Scientific Research Co., Ltd. (Lianyungang, China). The preparation of related solutions and the pre-treatment of soil samples referred to the national standard of the People’s Republic of China (GB/T 32737-2016). Potassium chloride solution (1 mol/L) was prepared by dissolving 74.55 g of KCl with 1 L of ultrapure water. The standard nitrate nitrogen stock solution (1000 mg/L) was prepared by dissolving 7.2182 g of K N O 3 which was pre-dried at 110 °C for 2 h and diluted with 1000 mL of ultrapure water. The stock nitrate nitrogen solution was stored in a refrigerator at 0–4 °C. The preparation of nitrogen standard intermediate solution (100 mg/L) involved pipetting 1 mL of the stock solution into a 10 mL polyethylene bottle and diluting it with 1000 mL of ultrapure water.
To prepare the nitrate nitrogen standard working solutions, take 0 mL, 0.05 mL, 0.1 mL, 0.2 mL, 0.3 mL, and 0.4 mL of K N O 3 (100 mg/L) into separate 10 mL polyethylene bottles. Then, add KCl (1 mol/L) to each bottle to achieve 10 mL of volume. Mixing evenly, the standard working solution of nitric acid nitrogen with the concentration of 0, 0.5, 1, 2, 3, 4 mg/L was obtained. Take 5 g of soil sample in 25 mL KCl (1 mol/L) and place it in a thermostatic reciprocating shaker (220 r/min, 1 h, 25 °C). Subsequently, the supernatant will be filtered through paper and stored at 4 °C for testing.

2.2. Instruments

Ultrapure water was produced by the Aikopu ultrapure water machine (AWL-1001-M, Dover, DE, USA). The fiber optic spectrometer was purchased from Shanghai Wenyi Optoelectronics Technology Co., Ltd. (DH-mini, Shanghai, China), with its light source utilizing the DH-mini miniature broad-spectrum light source that includes deuterium and tungsten lamps. The model of the fiber optic spectrometer is PC2000, and it utilizes XSR200-0.5 quartz fiber optic for detection in the wavelength range of 200 nm to 1100 nm. The peristaltic pump was obtained from Union Zhongwei Technology Co., Ltd. (LHZW005, Huizhou, China), equipped with a 6-roller configuration and 0.4 × 3 silicone tubing, enabling flow rate adjustment from 0 to 4 mL/min. The all-in-one desktop was purchased from Shenzhen City Touch Think Intelligent Co., Ltd. (TPC070-QD64-ZHN, Shenzhen, China). The digital microfluidic platform was obtained from Opendrop (http://www.gaudi.ch/OpenDrop/, accessed on 20 October 2023) (OpenDrop V4, Gaudi Labs, Luzern, Switzerland) [39]. The thermostatic reciprocating oscillator was purchased from Shanghai Shaying Instruments (Shanghai, China). The UV-Vis spectrophotometer was purchased from Shanghai Instrument & Meter Co., Ltd. (UV1810, Yoke, Shanghai, China).

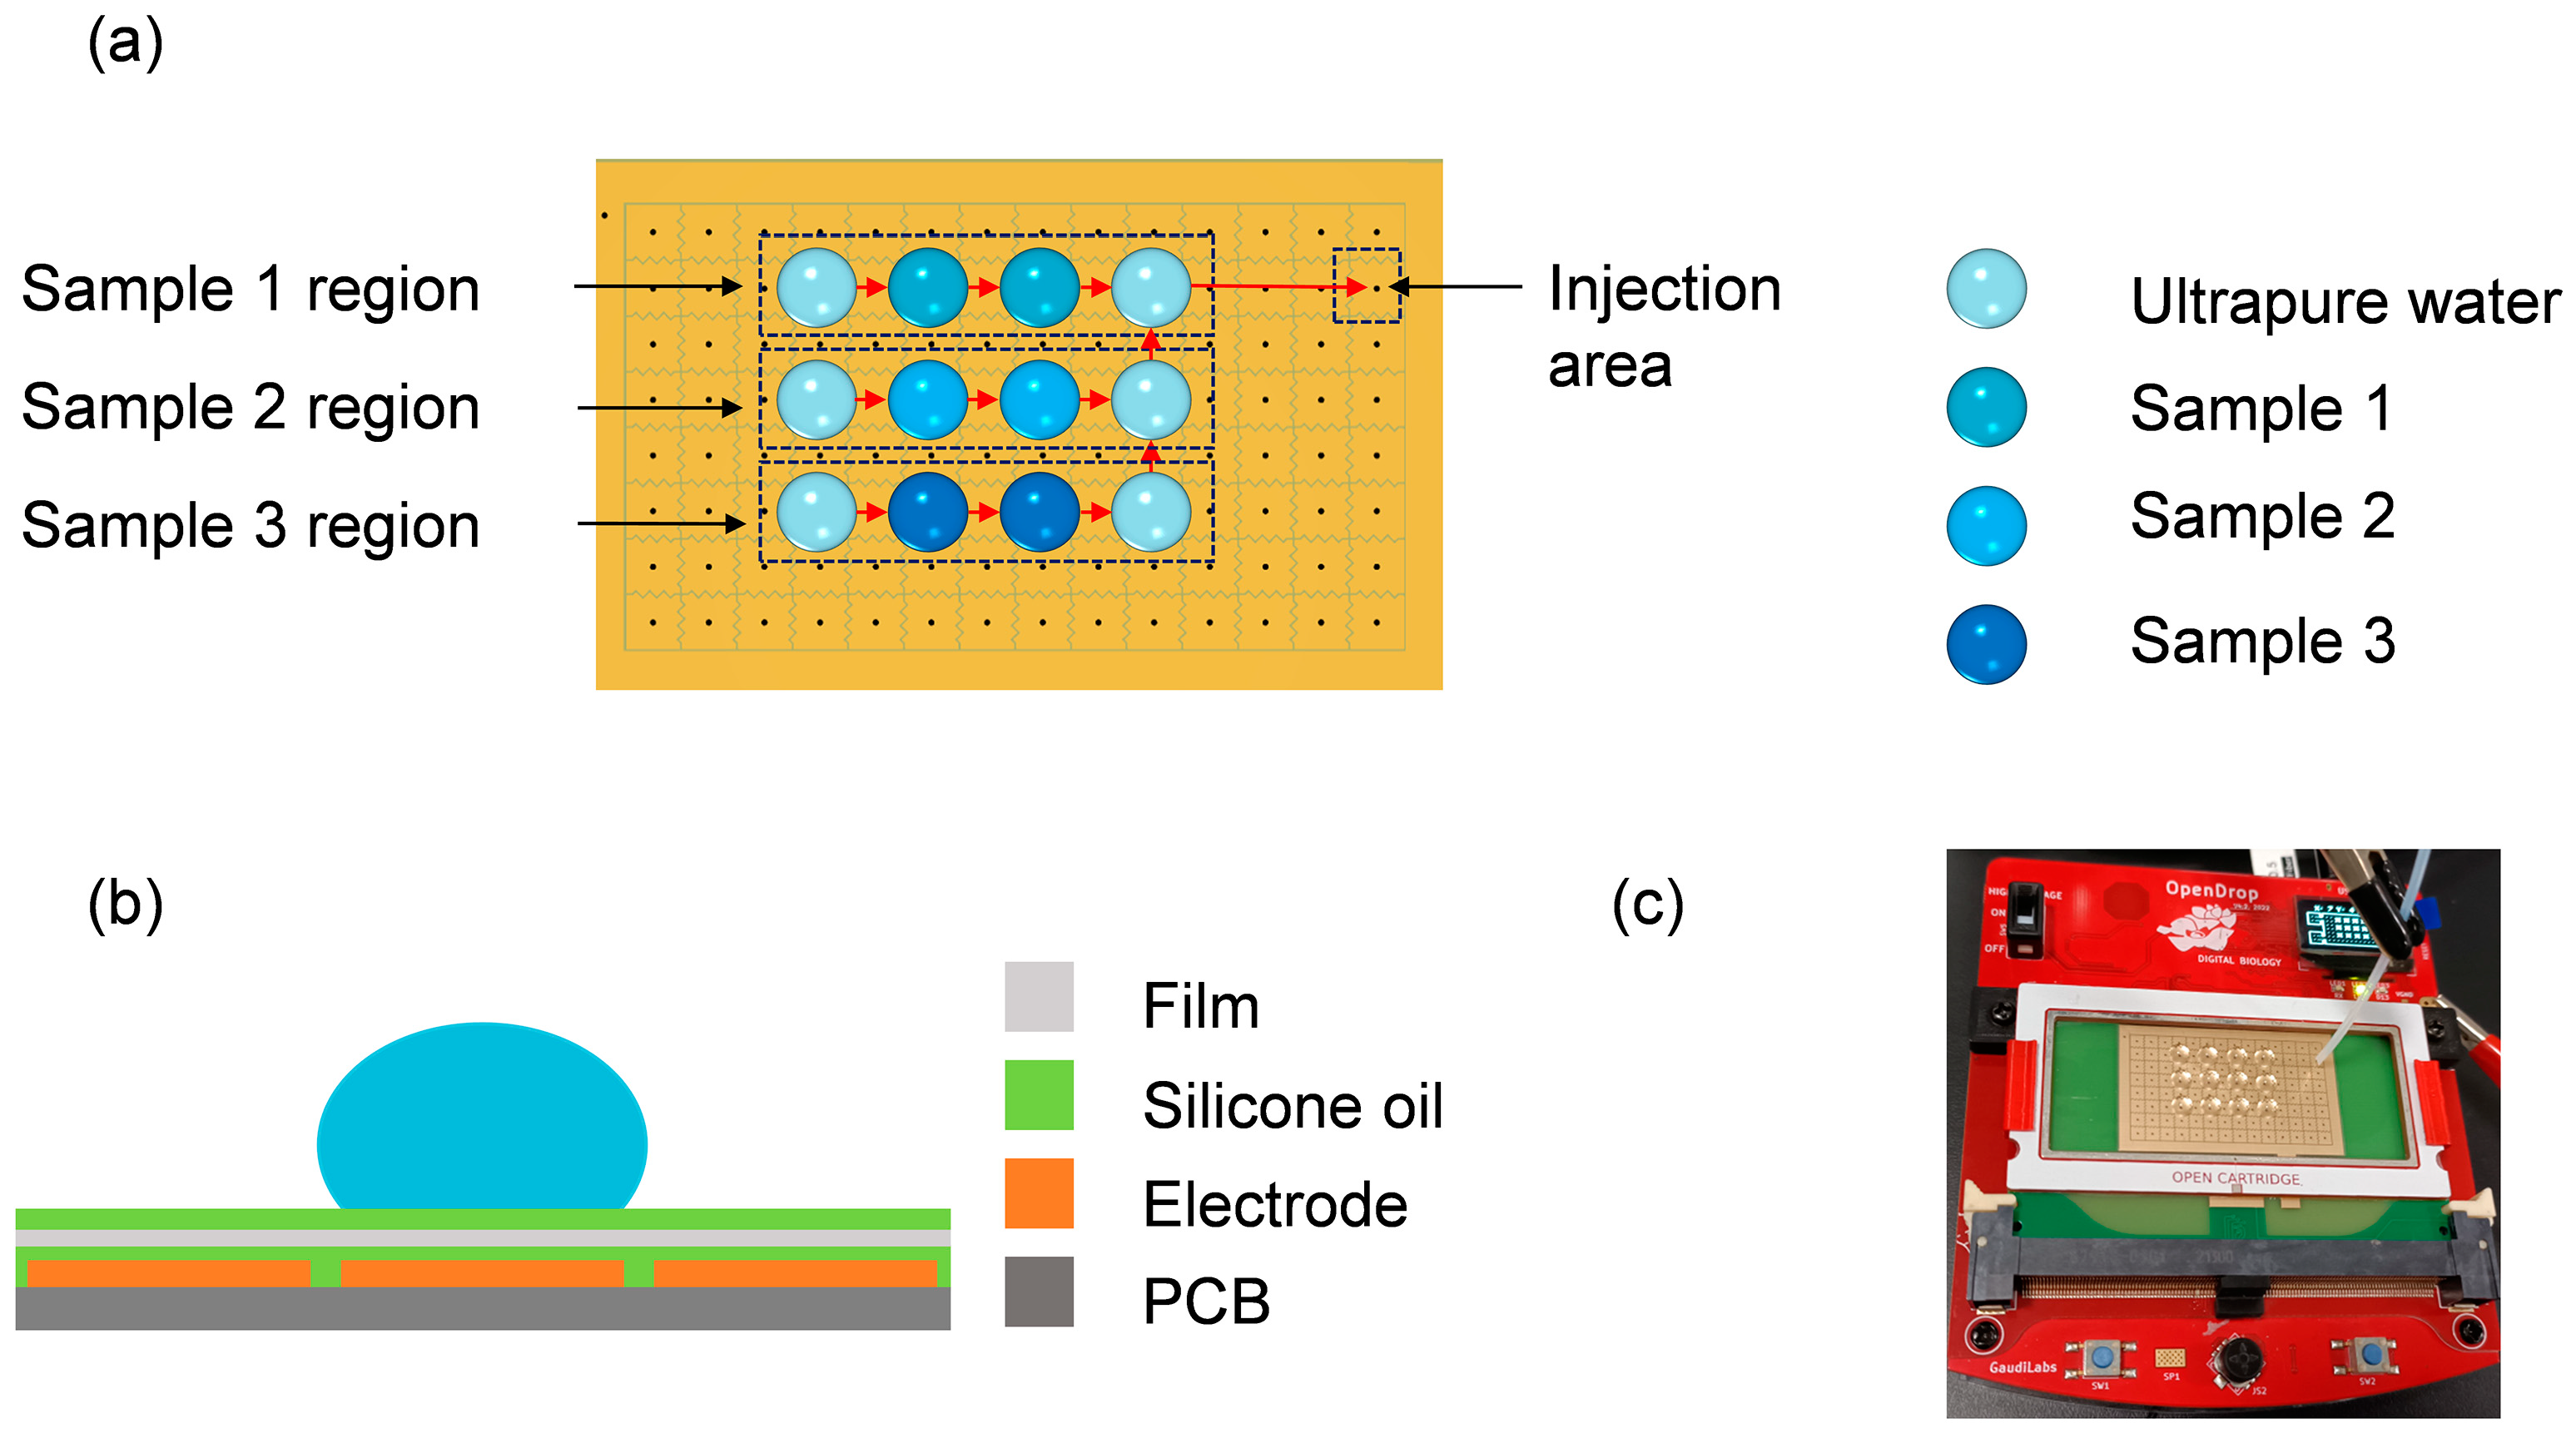
2.3. Digital Microfluidic Chip Design

The depiction of digital microfluidics can be observed in Figure 1. OpenDrop V4 is utilized as the circuit control terminal for digital microfluidics chips. The software manipulation was achieved through custom modifications to the original code obtained from the official OpenDrop GitHub repository (https://github.com/GaudiLabs/OpenDrop, accessed on 20 October 2023). As for the PCB electrode plate utilized in the digital microfluidics, it was fabricated using the immersion gold technique executed by JiaLiChuang Company. The thickness of each electrode was roughly 1 microinch, while the gap between adjacent electrodes measured 0.11 mm. The dimensions of each electrode were approximately 2.5 mm × 2.5 mm. There was a central through-hole with a diameter of 0.3 mm on each electrode, connecting to the PCB’s gold finger connectors at the bottom via wires. This enabled the connection to the OpenDrop control terminal via the gold finger slot. The process of controlling droplets involved sequentially maneuvering the droplets into the area for sample injection and then extracting them into the 3D-printed microfluidics using a peristaltic pump. Ultrapure water primarily aimed to cleanse the detection channels. Following this, a rinse with the sample solution was conducted, ultimately leading to the successful detection of the desired solution. This procedure employed a total of twelve liquid droplets, as depicted in Figure 1a. Figure 1b illustrates the cross-sectional configuration of the DMF platform. In order to ensure the utmost fluidity of the droplets during the subsequent film deposition process, it was of utmost importance to commence the proceedings by thoroughly purifying the surface of the PCB using anhydrous ethanol. This meticulous cleansing endeavor served the purpose of eradicating any traces of dust particles and averting any potential irregularities on the surface. After drying, 15 µL of silicone oil was applied, which was then evenly spread with the stretched sealing film on the PCB to serve as both the dielectric and hydrophobic layers. The silicone oil ensured secure adhesion between the film and the PCB surface. Additionally, 15 µL of silicone oil was applied onto the film surface to facilitate droplet lubrication [40]. The physical appearance is illustrated in Figure 1c.

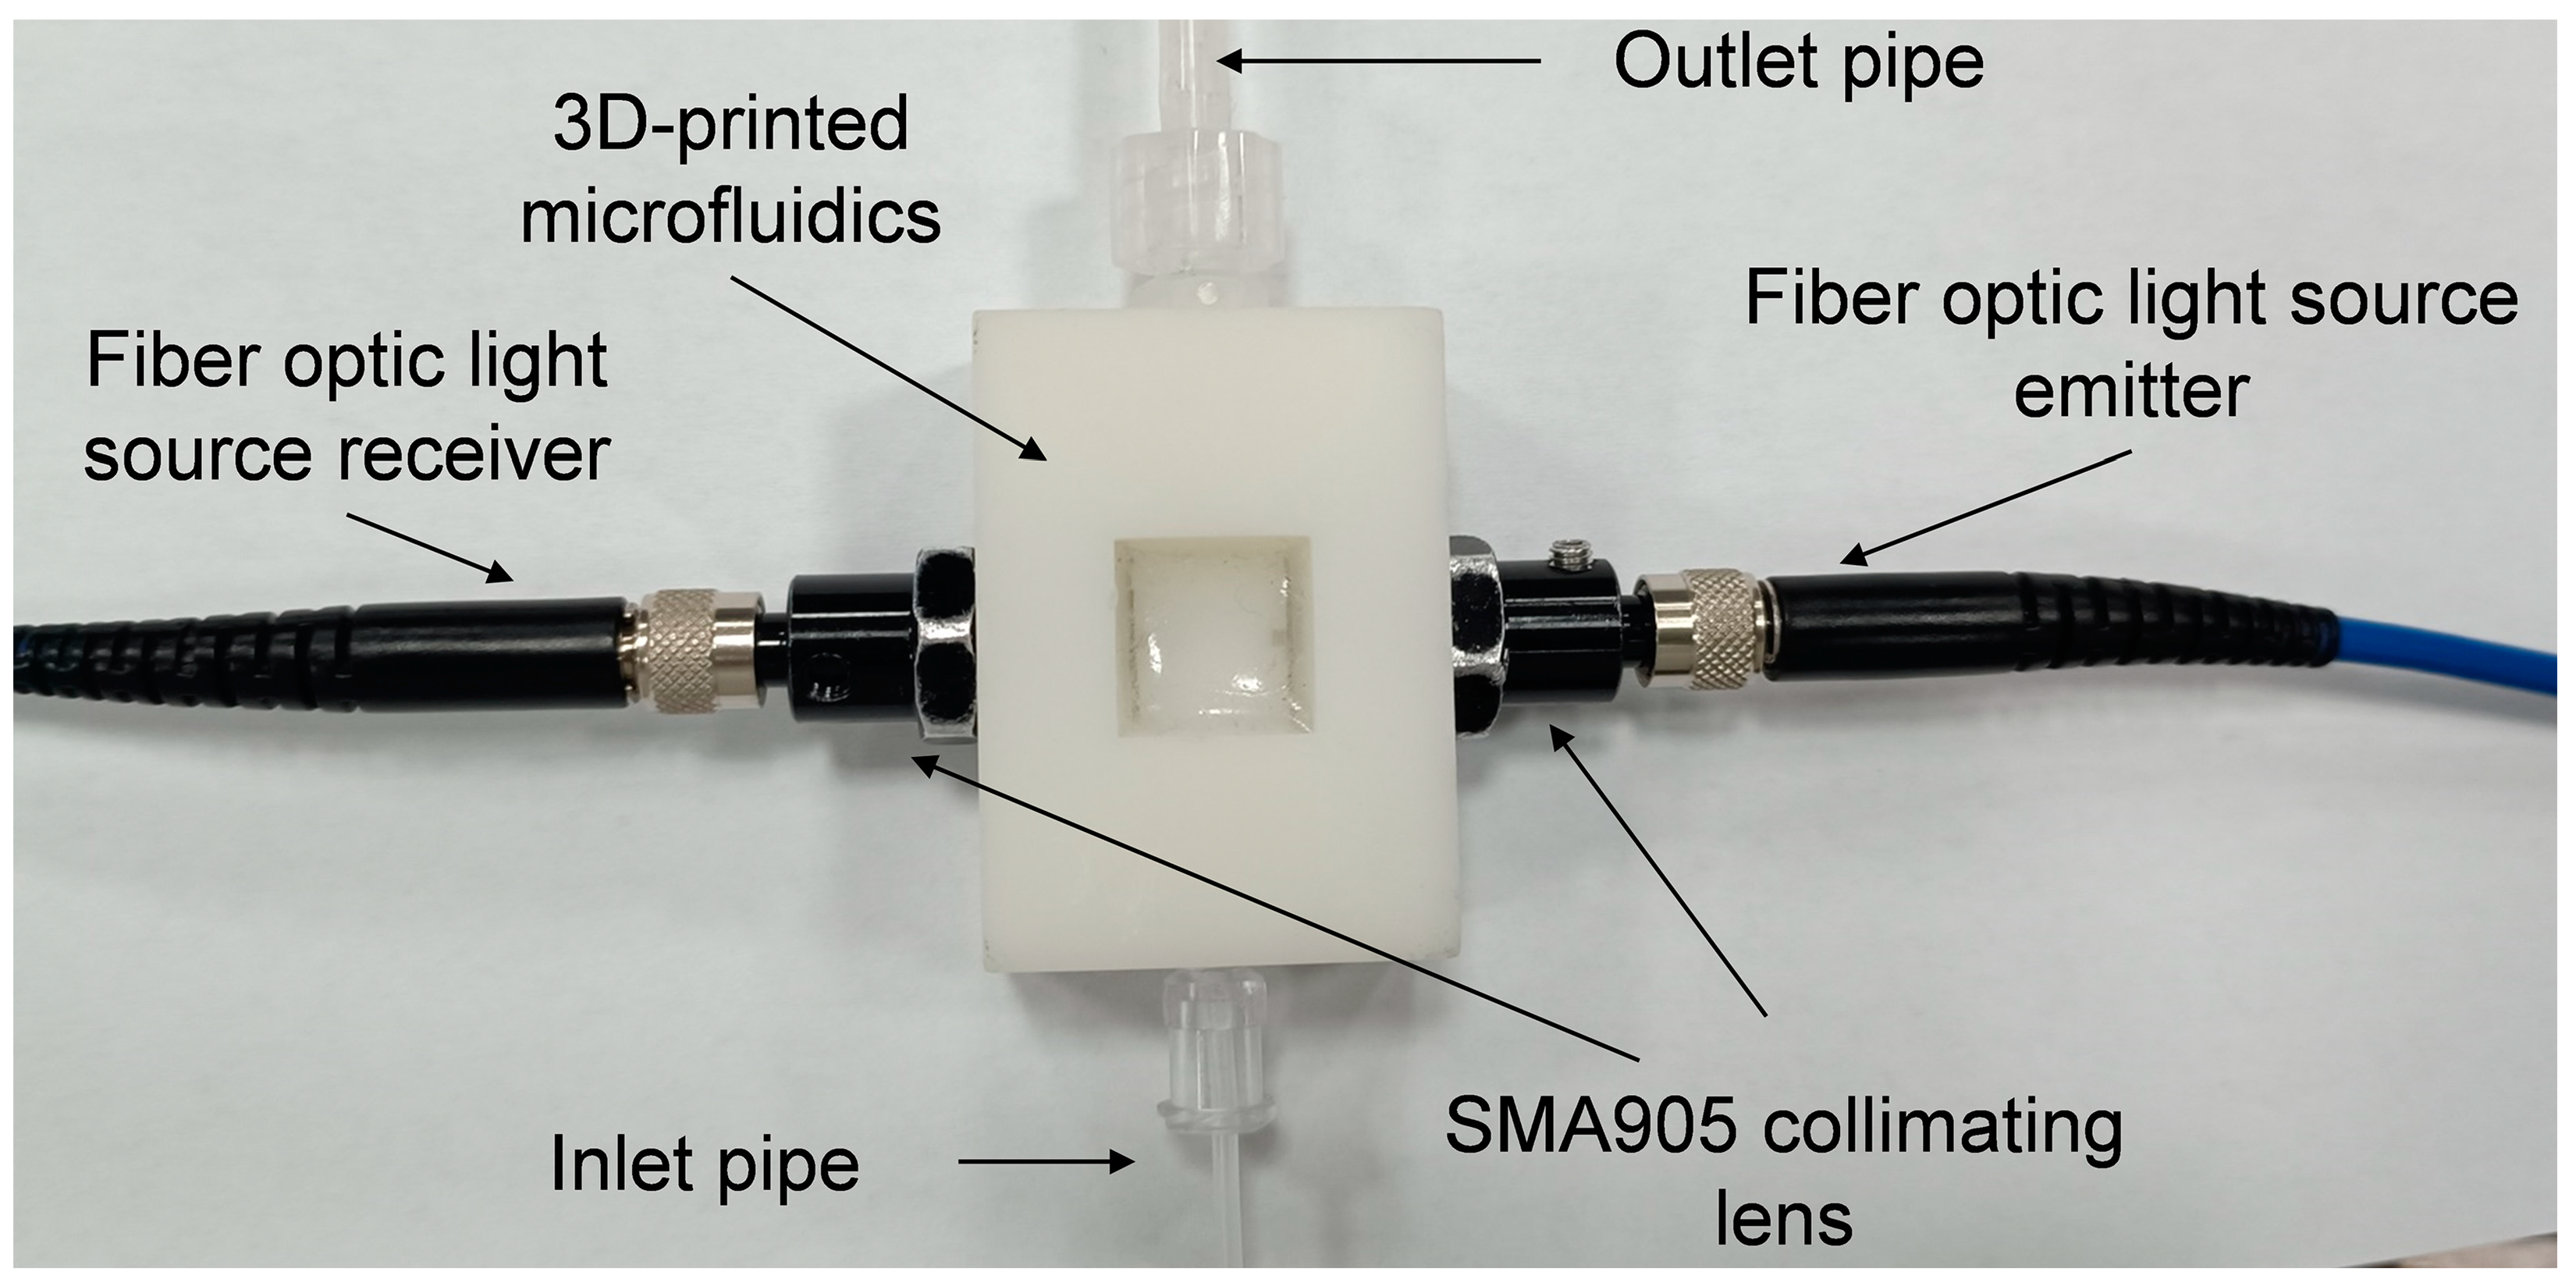
2.4. 3D-Printed Microfluidic Design

The 3D-printed microfluidics exhibit a notable channel diameter, measuring 1 mm, accompanied by an optical path length of 10 mm. The microfluidic channel is shown in Figure 2d with label 5. Labels 1, 2, 3, and 4 represent the sample inlet, sample outlet, light source reflection end, and light source reception end. Labels 14 and 15 represent the embedded quartz glass at the ends of micro channel. Labels 6, 7, 8, 9, 10, and 11 are used for sealing the flow inlet of the AB glue. These labels represent sealing channels that AB glue is flowing through to create the seal. In the supplemental 3D model, these channels are very well observable (File: S1 3D-printed microfluidics model. STL). Labels 12 and 13 represent the sealing structure. The specific model is shown in Figure 2d. The sealed cross-section is shown in Figure 2e. The AB glue will flow into the designed structure inside the groove and bond with the quartz glass and 3D-printed microfluidic chip, thereby achieving a sealing effect. More detailed information about the model can be downloaded in File S1. To attain exceptional transparency within the wavelength range of 220 nm to 275 nm, quartz glass serves as the ideal sealant. A 10 mm × 10 mm × 1 mm piece of quartz glass is put in a 12 mm × 12 mm × 1.05 mm slot to ensure the glass’s stability and attain the necessary transparency at 200 nm and 275 nm, as portrayed in Figure 2b. After pouring the thoroughly mixed AB glue into the groove of the mold, it was placed in a vacuum chamber and the air pressure was adjusted to −0.06 Mpa. Under the action of air pressure, the AB glue flowed into the channels in the groove, thus achieving a seal. The distribution of AB adhesive after solidification in the sealed channel is shown in Figure 2c. It should be noted that the air pressure should not be too high, and the vacuum chamber should not be left for a prolonged period of time. After 3 min, the model was taken out and left at room temperature for one day to completely solidify. Otherwise, the AB adhesive might seep onto the pristine surface of the translucent quartz glass, thus resulting in a setback for the production procedure. Upon completion of production, it was necessary to verify the seal integrity and transparency of the inspection channel. Finally, the preparation of the 3D-printed micro-channel was completed. When detecting the sample solution, the optical fiber is directed through a SMA905 collimator and then irradiated onto the detection channel with parallel light. Only the middle channel in the detection pathway is transparent, while the channels on either side are opaque. The light pathway irradiates the sample solution and is then focused by SMA905 onto the receiving optic fiber. Because of the exceptional translucency possessed by quartz glass, this microfluidics device crafted through 3D printing proves to be well-suited for an array of material spectrophotometric measurements within the wavelength span of 200 nm to 1100 nm.

2.5. Device Setup

The soil diversity sampling system is composed of digital microfluidic (Opendrop V4), 3D-printed microfluidics, peristaltic pumps, fiber optic spectrometers, and an all-in-one desktop computer. By utilizing an officially open-source software, we can achieve precise control over the actuation of digital microfluidic electrodes, thereby regulating the movement of droplets. The digital microfluidic platform precisely governs the locomotion of the droplets, guiding their path towards the pipeline, whereupon they are subsequently drawn in by the peristaltic pump and introduced into 3D-printed microfluidics. The radiant deuterium lamp, serving as an illuminating source of light, emits its luminance. After traversing through quartz glass, the light is subsequently concentrated into parallel rays by SMA905 before turning its brilliance upon the sample. The incident light passes through the quartz glass medium and is directed toward the fiber optic receiver via SMA905. The received light is then analyzed by PC2000, producing a visual representation on the display screen. The droplets enter the 3D-printed microfluidics device in a sequential manner. The Coral (http://www.wyoptics.com/down_b.html, accessed on 20 October 2023) software is utilized to analyze the light intensity data and display droplet data sequentially. Ultimately, the effluent is expelled via the conduit. A comprehensive illustration of the apparatus is depicted in Figure 3.

2.6. Soil Nitrate Nitrogen Detection Methods

The soil detection method used in this design is the national standard of the People’s Republic of China (GB/T 32737-2016). Upon the completion of soil sample processing and extraction using KCL, the nitrate ion within the samples exhibits notable absorption at a wavelength of 220 nm, and the intensity of this absorption is directly correlated to the concentration of nitrate ion. As nitrate ions in the soil do not absorb at 275 nm while organic matter does, it is necessary to multiply the correction factor. The absorbance of the calibrated nitrate is
A = A 220 2.23 A 275 ,
A is the absorbance of the calibrated nitrate nitrogen. A 220 is the absorbance at 220 nm wavelength. A 275 is the absorbance at 275 nm. The main reference is from GB/T 32737-2016, where nine different types of Chinese soil were measured in the laboratory to obtain empirical correction factors f through averaging. Factor 2.23 corresponds to the correction factor f. By calibrating the absorbance and absorbance data of the standard solution, one can deduce the corresponding nitrate nitrogen concentration.
To calculate absorbance, the measured intensity is compared with the intensity measured from a blank calibration solution using the Beer–Lambert Law. The above formula can also be expressed using the following equation:
A = lg I 220 I 0 220 + 2.23 l g ( I 275 I 0 275 ) ,
I 0 220 and I 0 275 represent the light intensity of the calibration solution at 0 mg/L at 220 nm and 275 nm wavelengths, respectively. These intensities are the average of three measurements, with each data point obtained by averaging a set of intensity data. I 220 and I 275 represent the light intensity data of the sample solution at 220 nm and 275 nm wavelengths, respectively, and are also the average of three measurements.

3. Results and Discussion

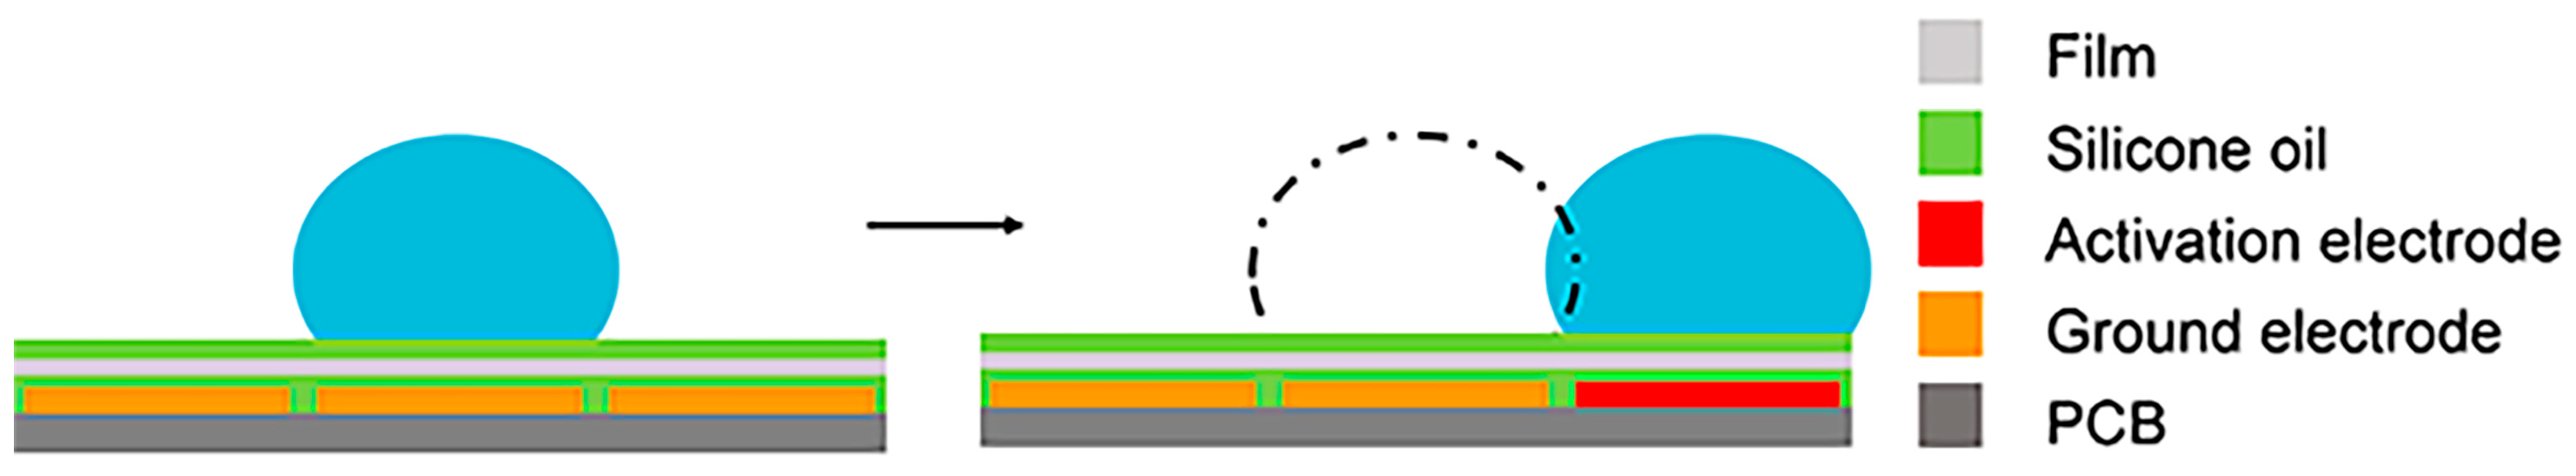
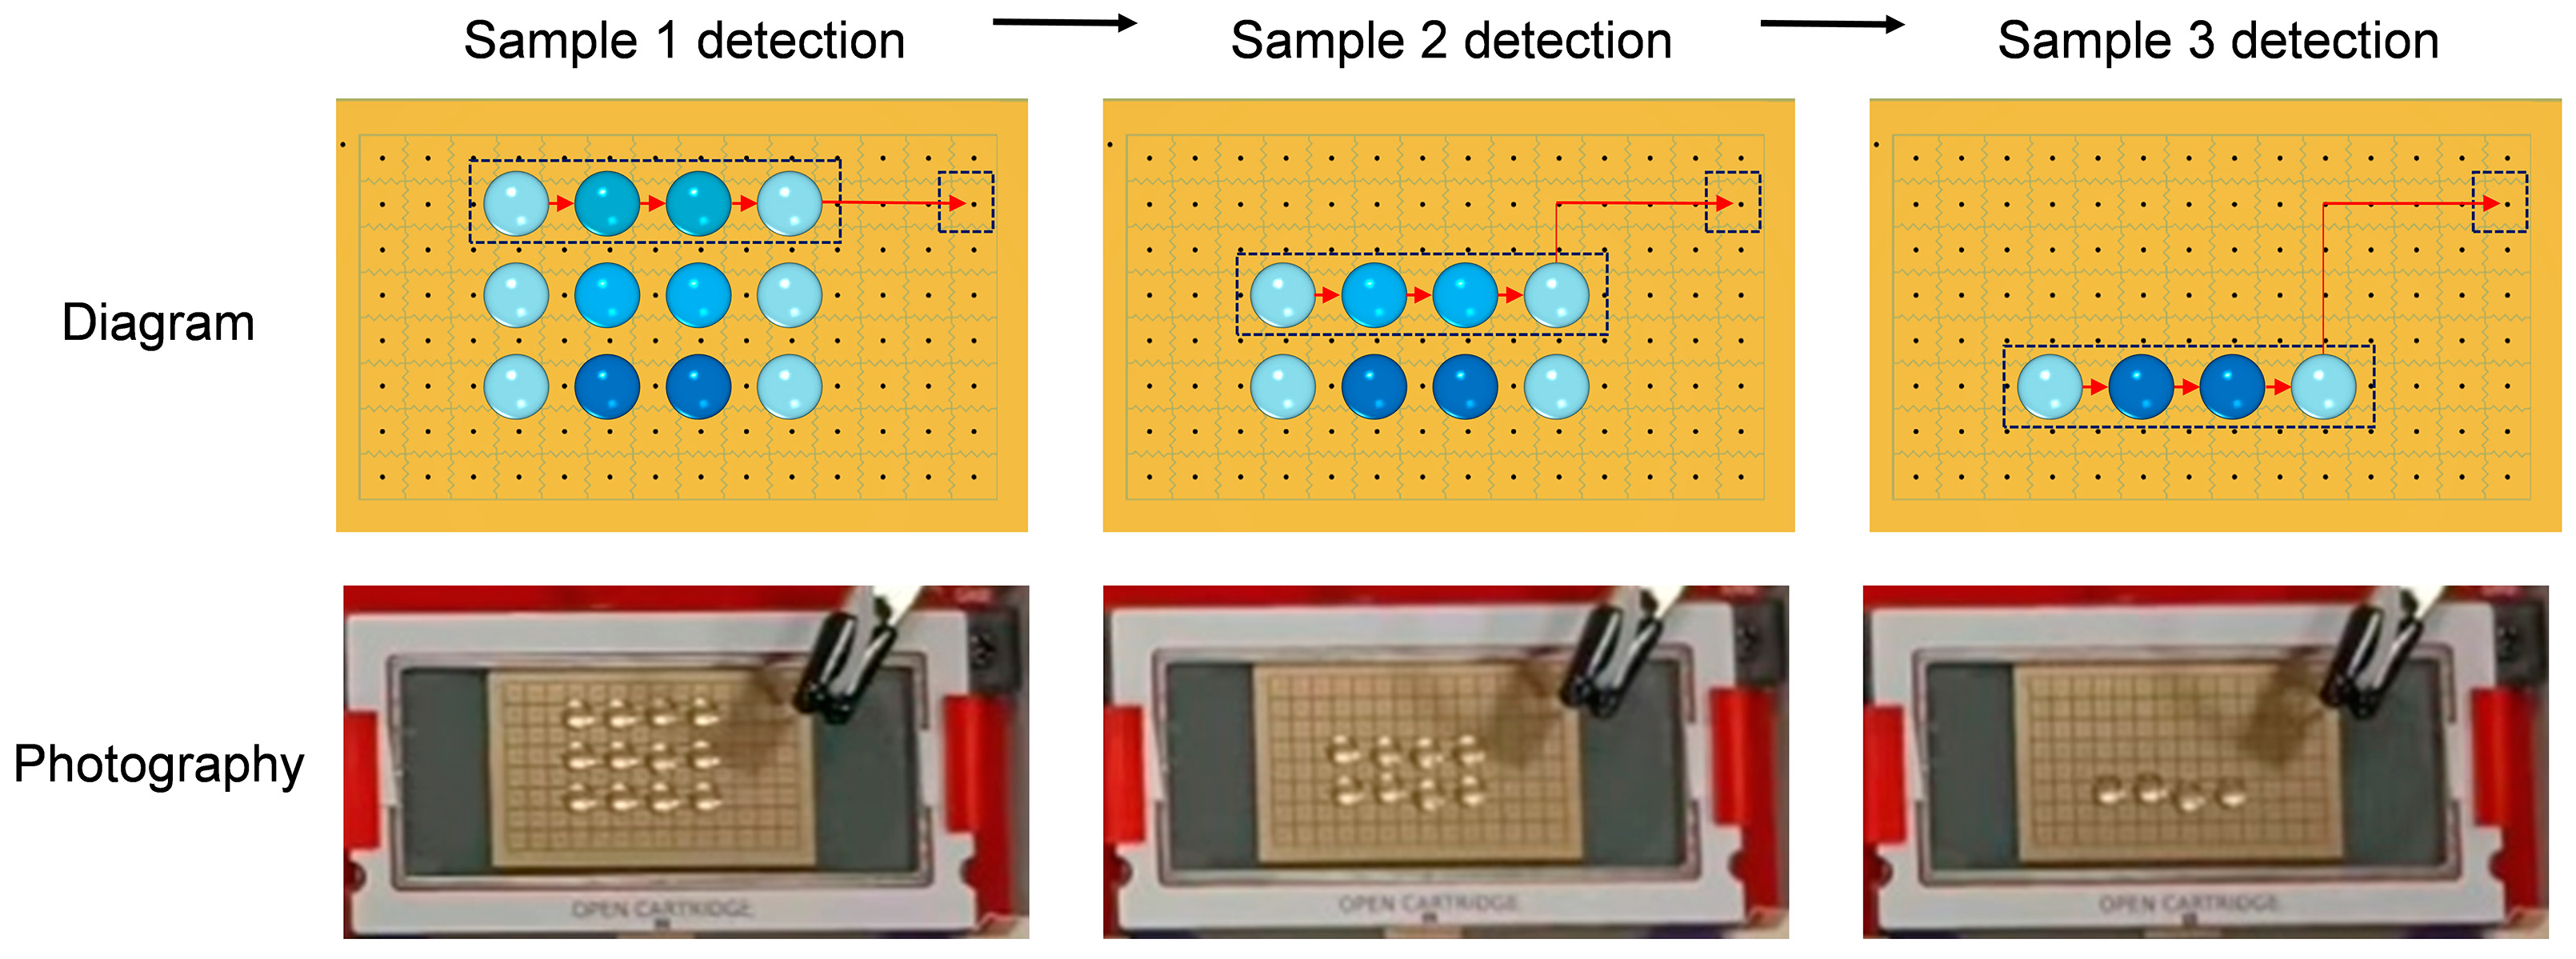
3.1. Principle of Digital Microfluidic Multi-Sample Driving

The process of manipulating a single droplet using the digital microfluidic electrowetting method is shown in Figure 4. When a voltage is applied to the electrode, electrowetting occurs. The contact angle of the droplet changes, resulting in a force being exerted on it. The droplet moves until the force is rebalanced. The contact angle of a droplet can be used to observe the wetting behavior of a liquid. This angle is regulated by the well-known Young–Lipmann equation [41]:
c o s θ v = c o s θ 0 + ε r ε 0 V 2 2 γ d ,
where θ v is the contact angle of the droplet during electrode activation, while θ 0 is the contact angle during electrode ground. The relative permittivity and vacuum permittivity are denoted by ε r and ε 0 , respectively. The voltage V represents the voltage of electrode activation. The surface tension between a solid and a liquid is denoted by γ . The thickness of the dielectric layer is represented by d. An amount of 240 V is used as the driving voltage for digital microfluidic systems in the device.
This article discusses the impact of different droplet volumes on driving and how to avoid collisions between adjacent droplets. According to the driving principle of digital microfluidics, multiple droplets can be driven simultaneously. However, when driving multiple droplets, adjacent droplets may collide. Therefore, this article discusses the relationship between droplet volume and the distance between adjacent droplets. This is shown in Figure 5. Specific physical drawings can be found in Figures S1–S5. When the droplet is 30 µL, the distance between adjacent droplets driven is 0.72–1.29 mm. When the distance between adjacent droplets is less than 1 mm, droplets are prone to collide. When the droplet is 25 µL, the distance between adjacent droplets driven is 0.96–1.49 mm, and there are also cases where adjacent droplets are less than 1 mm apart, which makes them likely to collide. When the droplet volume is 20 µL, the distance between adjacent droplets driven is 1.33–1.61 mm, and the distance between adjacent droplets is mostly greater than 1.3 mm, which keeps the droplets at a safe distance and less likely to collide. The adjacent distance between droplets with a volume of 10 µL and 15 µL is within a safe range. However, droplets with smaller volumes have a smaller contact area with the digital microfluidic platform. During the driving process, droplets may fail to be driven if they do not make contact with the driving electrode. With the increase in droplet volume, the overall error in droplet placement also increases. Droplets of 10 µL and 15 µL have better fixation effects when digital microfluidic electrodes are conducting, while 20 µL droplets have average fixation effects. Droplets of 25 µL and 30 µL have poorer fixation effects. The fixation effect may be related to the size of the digital microfluidic electrode. When the droplet is small, the size of the droplet base is similar to that of the electrode surface. When the droplet is large, the size of the droplet base is larger than that of the electrode surface, resulting in partial wetting of the droplet base and larger errors due to the larger volume of the droplet and smaller distances between adjacent droplets. Therefore, to ensure successful driving, droplets with a volume of 20 µL are recommended.

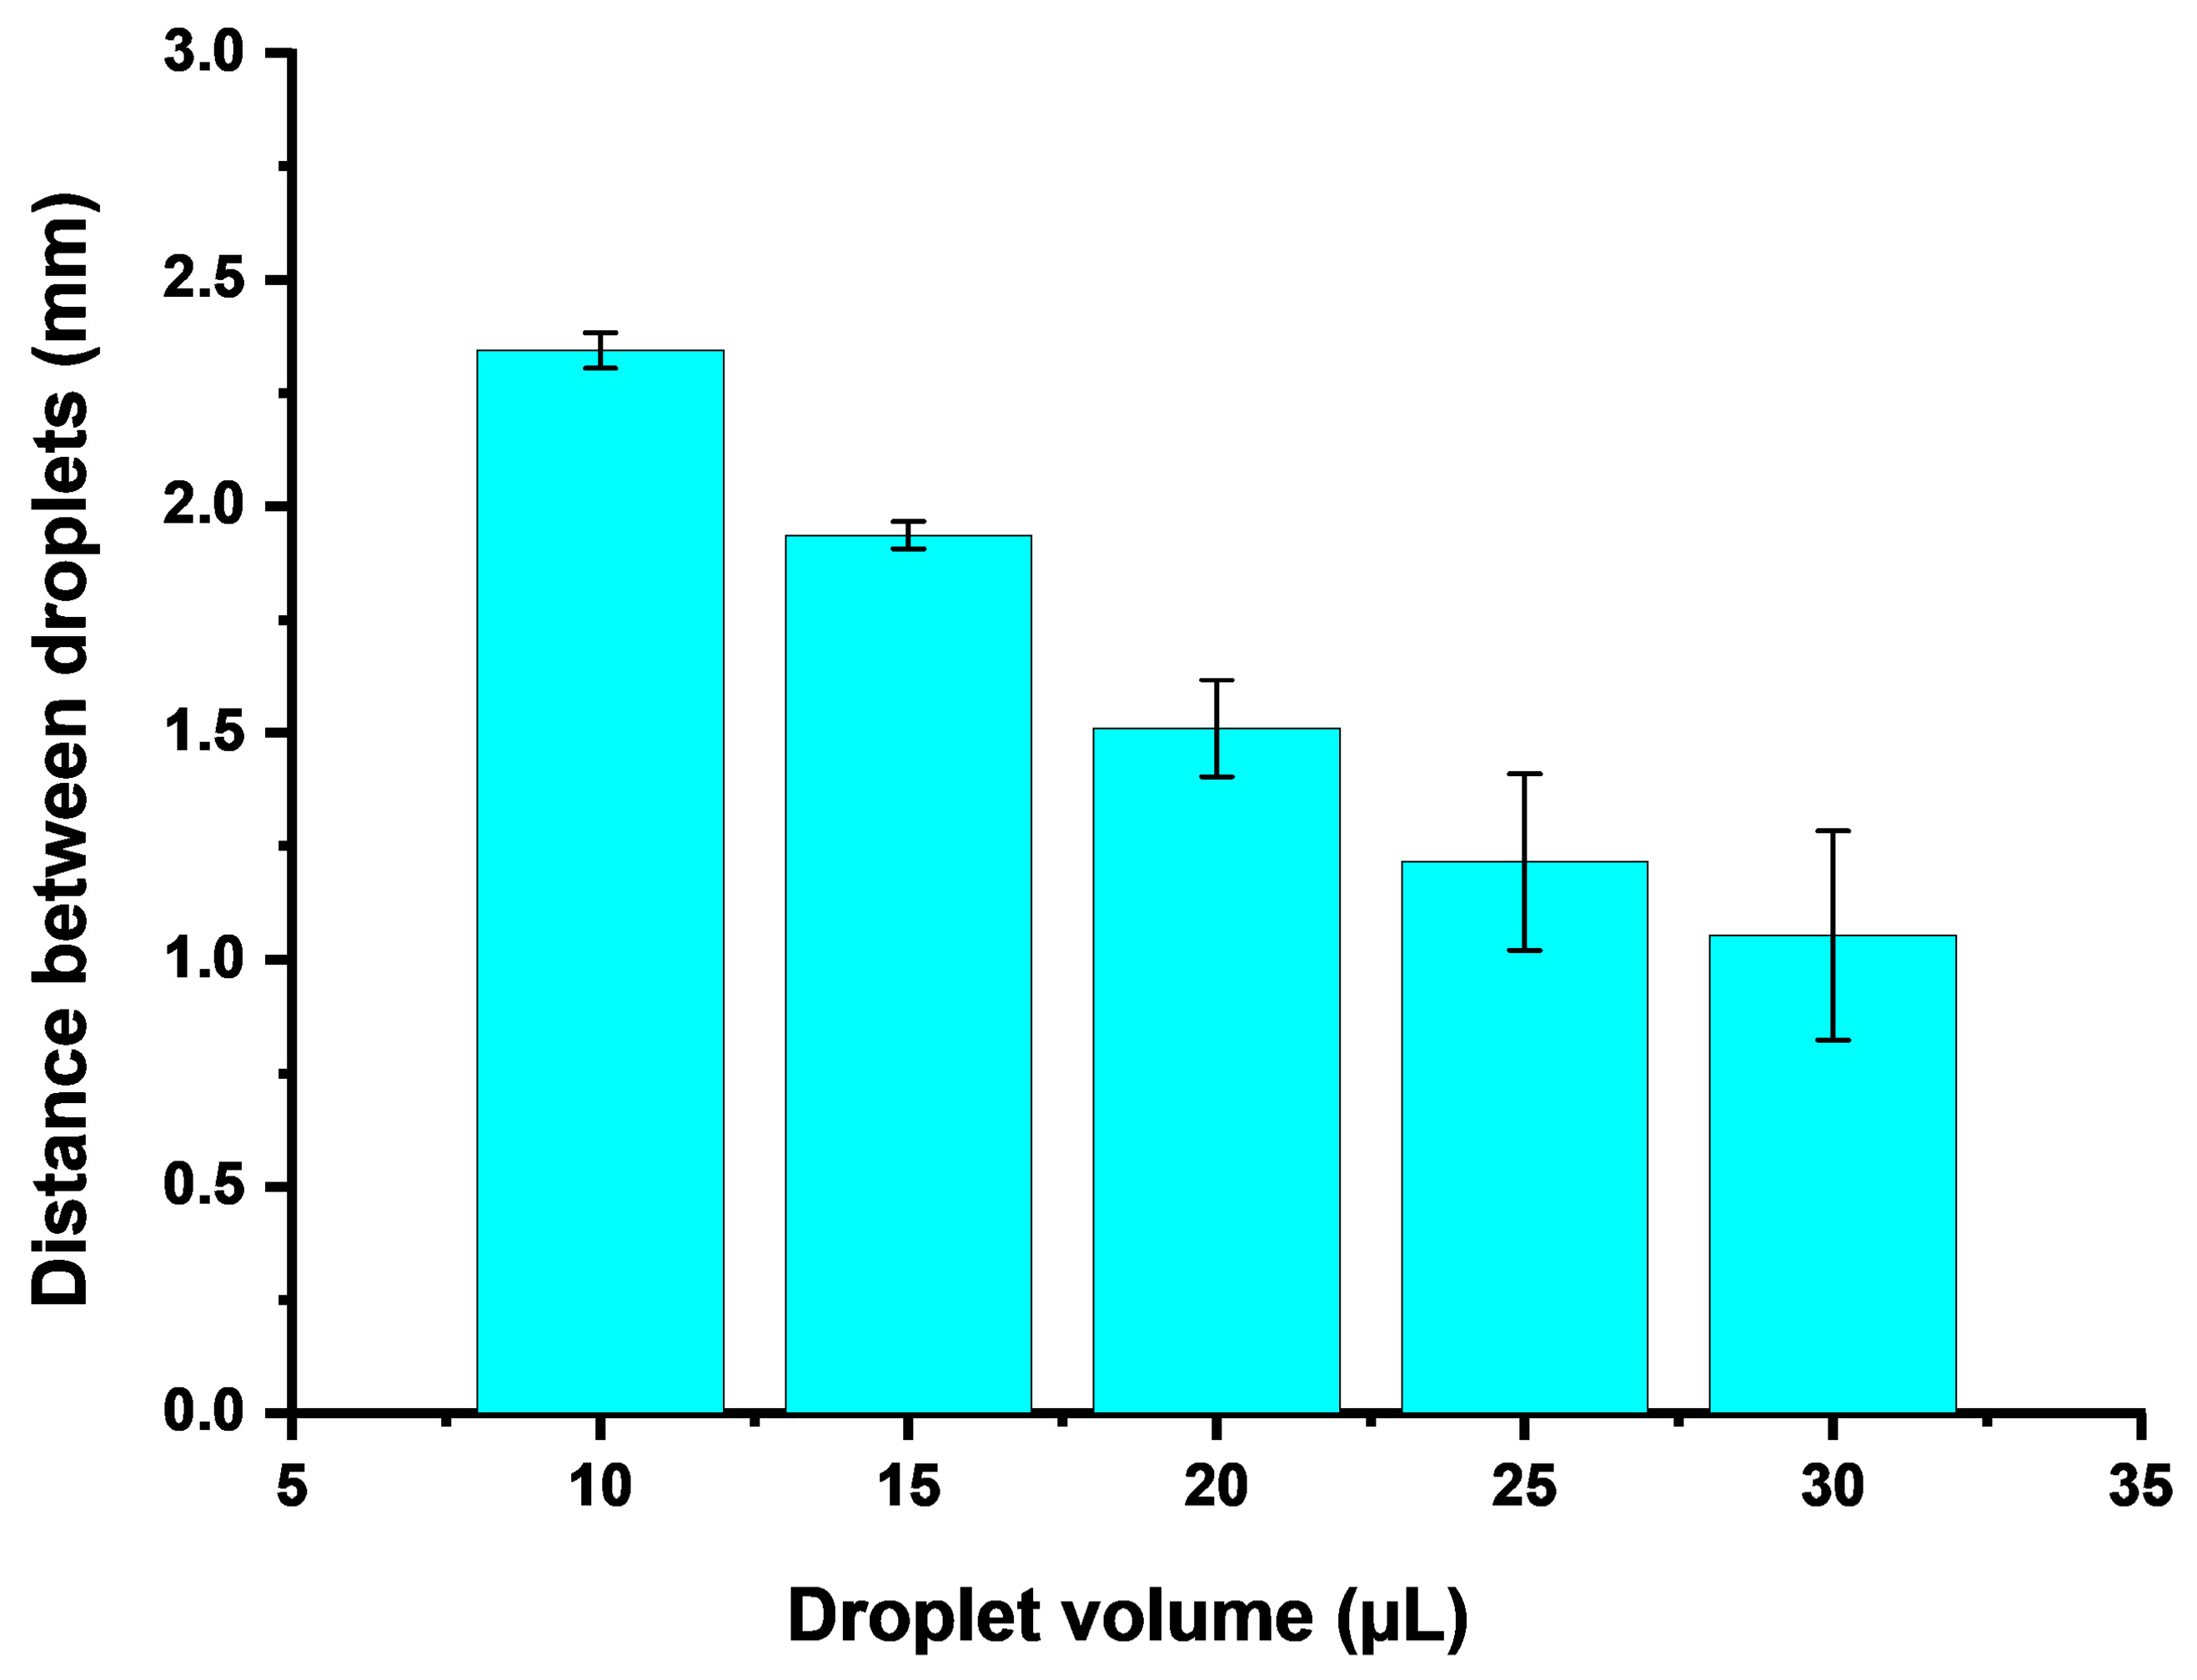
3.2. Determination of Experimental Parameters for 3D-Printed Microfluidic Devices

Confirming the relevant parameters of microfluidics helps to achieve better detection of 20 µL droplets. It is necessary to determine the length and radius of the microfluidic detection channel. In accordance with the reference standard (GB/T 32737-2016), a 10 mm colorimetric dish is utilized. Accordingly, the length of the microfluidic channels for 3D printing shall be designated as 10 mm; thereafter, the consideration of the radius of the detection channels is required. The volume of the droplet has been determined to be 20 µL. The volume V 1 of the channel satisfies the following formula:
d π r 2 = V 1 ,
where the length of the detection channel is denoted by d, measured in millimeters. The radius of the detection channel is represented by r and measured in millimeters. V 1 corresponds to the volume of the detection channel, which is measured in microliters. For the droplet to fully pass through the channel, the design has chosen a droplet volume of at least twice the volume of the channel. The radius of the channel is calculated to be less than or equal to 0.56 mm. As the radius of the channel decreases, the collected light intensity becomes weaker, necessitating an extended integration time for the fiber optic spectrometer. Furthermore, to prevent printing errors, it is advisable to avoid making the channel size too small during 3D printing. Therefore, the channel radius for 3D printing should be rounded down to 0.5 mm. Upon completion of the 3D-printed microfluidics device boasting a channel diameter of 0.5 mm, the application of fiber optic technology allows for the detection of water within 400 milliseconds. The specific physical object is shown in Figure 6. Continuing on, the flow rate of the peristaltic pump needs to be considered to ensure an adequate number of sample points are collected. For this study, it is planned to have at least 10 detections per sample droplet. Previously, the droplet volume (V) was determined to be 20 µL, the channel radius (r) as 0.5 mm, and the channel length (d) as 10 mm. Hence, the volume V 1 of the channel is 7.9 µL. In order to ensure that each data point collects at least n = 10 samples, the following inequalities can be formulated:
V V 1 v     t n ,
where the volume of a droplet is denoted as V and measured in microliters. The volume of a channel is also measured in microliters and represented by V 1 . The speed of the peristaltic pump, also measured in µL/s, is noted as v . We set the integration time, t, at 400 milliseconds with n as the number of data points collected for each sample. To ensure that 10 data points can be collected, substitute n = 10 into the above equation. Solving for v ≤ 3.03 µL/s, we find that the speed of the peristaltic pump is less than or equal to 181.8 µL/min. For this study, we opted for a speed of 180 µL/min for the pump.

3.3. Digital Microfluidic Droplet Driving Process

Design a digital microfluidic multi-sample drive process and validate the feasibility of a multi-sample detection scheme. Based on the driving principle of digital microfluidics, individual droplets can be actuated by controlling the activation of electrodes. Controlling multiple electrodes allows for the actuation of multiple droplets and therefore the detection of multiple samples. A single sample is detected by arranging cleaning droplets (ultrapure water), rinsing droplets (sample droplets), sample droplets, and cleaning droplets (ultrapure water) in sequence. Three samples are detected by arranging such droplets in three groups, as shown in the driving process diagram in Figure 7 and in Supplementary Video S1. The driven droplets are successively introduced into the 3D-printed microfluidic chip for optical intensity detection at 220 nm and 275 nm. The detected data are shown in Figure 8 and Supplementary Video S1. As shown in the figure, each droplet corresponds to a data change. The difference in the duration of the waveforms may be due to the discontinuous pumping of the peristaltic pump, where the varying pumping rates result in some waveforms being longer or shorter in duration. In the future, if it is desired to increase the detection speed, the electrode drive speed and pump speed can be shortened. These waveforms verify the feasibility of using this device for multiple sample detection of soil nitrate nitrogen using digital microfluidics and the feasibility of using 3D-printed microfluidics for optical fiber sample detection.

3.4. Soil Nitrate Nitrogen Markers and Determination of Detection Limits

The linearity and limit of detection (LOD) of the nitrate nitrogen standards were determined to assess the performance and reliability of the assay system. The time series plot of the light intensity of the nitrate nitrogen standard solution is shown in Figure 9. Linearity was assessed by analyzing six nitrate nitrogen standards of different concentrations as shown in Figure 10. Each sample was measured three times, and the error bars represent the standard deviation. The calibration absorbance is calculated using Formula (2). The calibration curve was established by plotting the measured absorbance against the nitrate nitrogen concentration and was found to be linear between 0 and 4 mg/L with the equation y = 0.22368x − 0.00417 for the standard concentration versus absorbance. The corresponding temporal variation of the light intensity of the standard solution is shown in Figure 9. The system achieved an adjusted coefficient of determination (R2) of 0.99926. LOD was defined as three times the standard deviation of the blank baseline divided by the slope of the calibration curve. In this study, the detection limit was determined to be 95 µg/L after measuring the blank samples 15 times. The limit of quantitation (LOQ) is 0.316 mg/L, calculated as the standard deviation of 15 blank measurements multiplied by 10 and then divided by the slope of the calibration curve. The calibration absorbance of 15 blank samples is shown in Figure 11. The determination of the LOD included systematic errors and fluctuations in peristaltic pump flow rate, among other things. The detection range of the device was 0.095–4 mg/L. The satisfactory linearity, precision, and LOD and LOQ values indicate that this method can be used for the detection of nitrate nitrogen in soil samples.

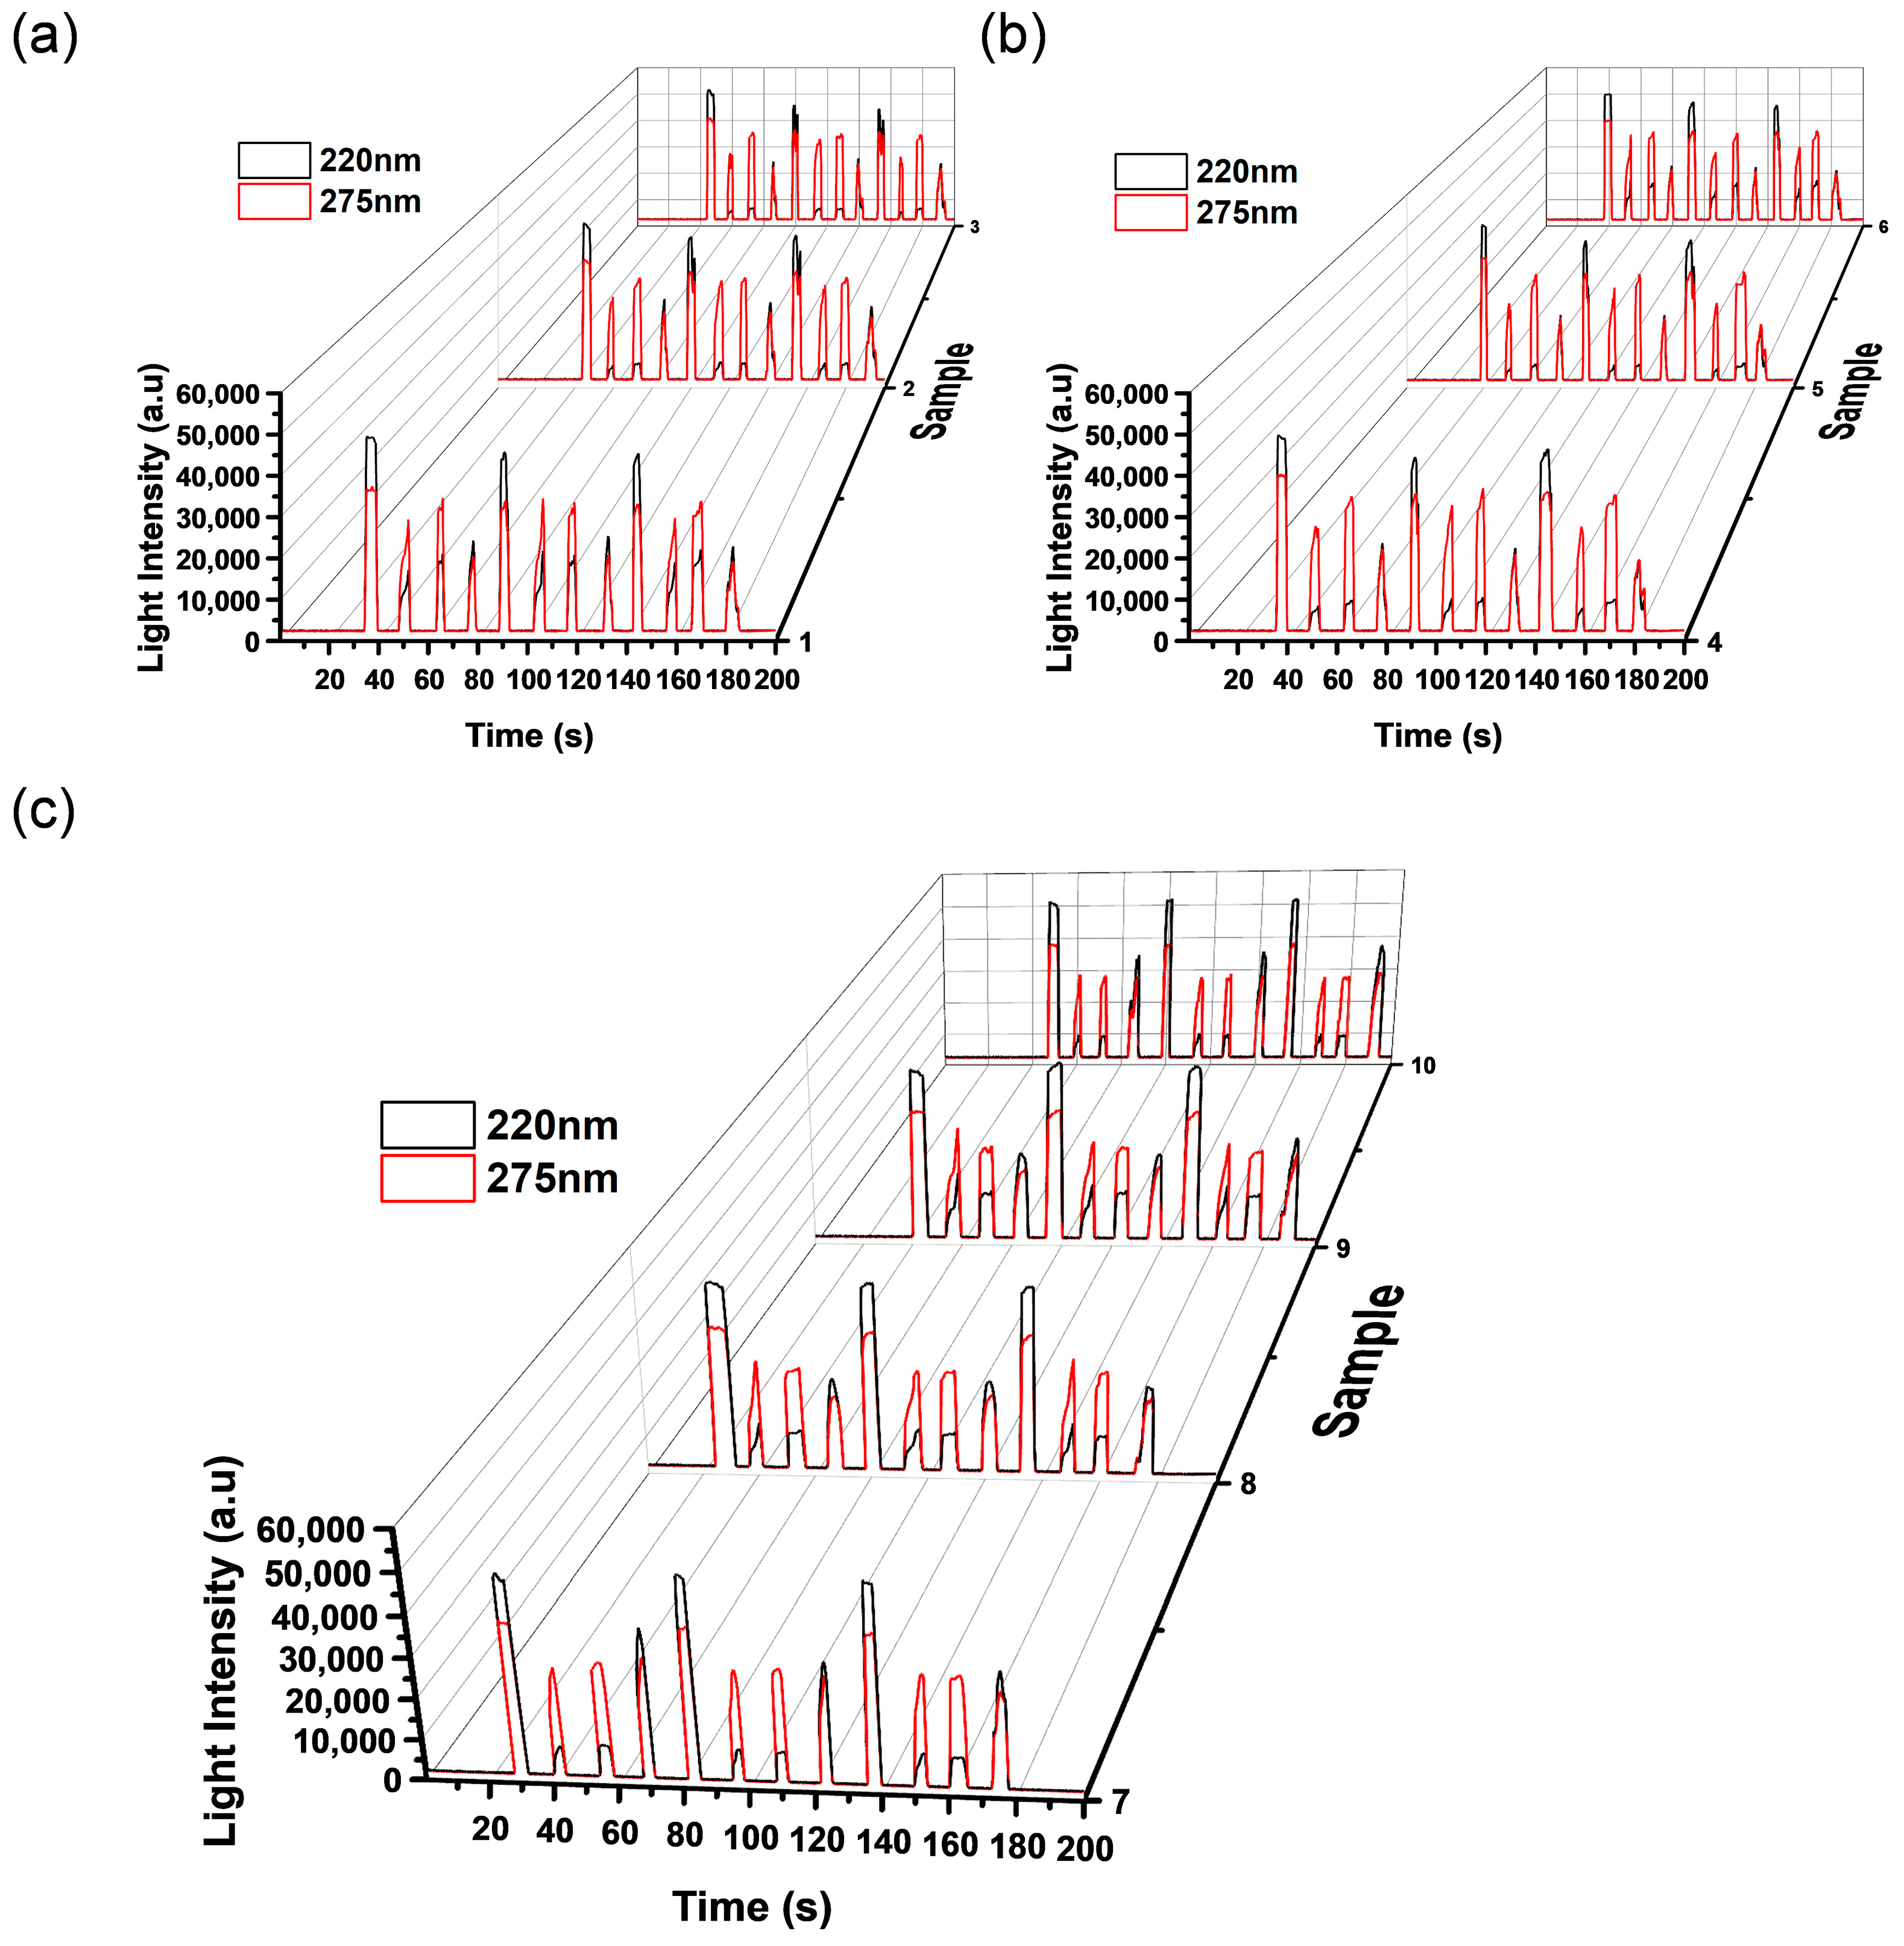
3.5. Soil Sample Testing

To evaluate the detection data of this device, we compared the detection data of this device with that of the national standard method. We collected 10 soil samples from farmland in Changfeng County, Hefei. The soil samples were pre-processed according to the national standard method, and then the processed solution was compared with the data detected by the UV spectrophotometer of the national standard method. When detecting nitrate nitrogen in soil using this device, three measurements are taken for each soil sample and the average value is taken as the detection result for nitrate nitrogen. The time series plot of the sample light intensity for the detection is shown in Figure 12. Afterwards, the calibration absorbance is calculated using Formula (2) and then substituted into the calibration curve to obtain the concentration of nitrate nitrogen. The final calculated nitrate nitrogen results are shown in Table 1. By comparison, it was found that the relative standard deviation (RSD) of nitrate nitrogen concentration in soil samples detected by this device and that measured by the desktop UV spectrophotometer of the national standard method was between 0.9% and 4.7%. The relative error range of the device’s detection results compared with that of the standard method was between 1.3% and 18.5%, and the relative error of most samples was below 10%. Therefore, this method can be used for nitrate nitrogen detection in soil samples.
After completing the testing of soil samples, it is necessary to conduct equipment recovery rate experiments to verify the accuracy and reliability when monitoring nitrate nitrogen in soil samples. The method we used involves mixing 2 mL of soil extract solution with a 2 mg/L nitrate nitrogen standard solution for detection. In the mixed solution, the concentrations of soil nitrate nitrogen and the added nitrate nitrogen correspond to the second and third columns, respectively. The fourth column corresponds to the nitrate nitrogen concentration in the mixed solution after mixing. Three measurements were taken for each the mixed solution using the device, and the average value of nitrate nitrogen in each the mixed solution was recorded. The device instrument exhibited a recovery range of 90–105% for soil nitrate nitrogen, with the RSD of the samples generally maintained below 3%, indicating satisfactory repeatability. A summary of the results is presented in Table 2. The recovery rates showed favorable results, verifying the appropriateness of this technique for analyzing soil nitrate nitrogen.
Table 3 presents a comparative analysis of the relevant parameters of various nitrate nitrogen detection techniques in conjunction with the device. After examining a sample, researchers typically require manual cleansing before testing subsequent samples. However, this study proposes the use of digital microfluidics, which enables controlled droplet cleansing and rinsing during subsequent sample examinations. This approach enables the analysis of three samples consecutively. The device reduces the amount of sample required for testing, as only 40 µL of sample solution is needed. This includes 20 µL of rinsing solution drops (sample droplets) and 20 µL of sample solution drops. Additionally, this apparatus also boasts an low detection limit of 95 µg/L, with a nitrate nitrogen detection range spanning from 0.095 to 4 mg/L. Some researchers have measured nitrate nitrogen in natural water with concentrations much lower than the detection limit of this device, which is due to its 25 mm optical path length [42]. However, the linear range of nitrate nitrogen is narrower compared to this device. It is worth noting that there are also researchers who use closed digital microfluidics to detect nitrate nitrogen. The detection optical path is 1 mm, and the detection range is 0.993–9.93 mg/L [43]. However, the linearity of the calibration curve is only 0.9567. In contrast, this device exhibits a good linear relationship with the standard solution. In addition, researchers have also employed paper-based microfluidic devices and colorimetric methods to detect nitrate nitrogen in water, saliva, and food samples. This method offers a user-friendly approach for detection, requiring low sample volume. This device has also been compared with this method, as shown in Table 3. By reducing the length of the absorption cell, we can achieve a wider detection range. On the contrary, increasing the optical path length reduces the detection limit [44].

4. Conclusions

In summary, we have proposed an innovative 3D-printing microfluidic embedded quartz glass fabrication process, which has been well applied in the detection of soil nitrate nitrogen. This study aims to utilize the potential of the collaboration between digital microfluidics and 3D-printed microfluidics to attain remarkably precise detection of soil nitrate nitrogen levels across multi-sample. The concentration range of nitrate nitrogen detected by the device is 0.095–4 mg/L, and the detection limit is 95 µg/L. Compared to other methods for detecting nitrate nitrogen in soil, this instrument is unique in its ability to analyze three samples simultaneously and in its ability to facilitate automatic cleaning and rinsing of the droplets through digital microfluidic. Additionally, this system uses less reagents than other methods, with a low volume of only 40 µL. When detecting nitrate nitrogen in soil, the device achieves similar detection results with the traditional desktop UV spectrophotometer. Meanwhile, this device provides a promising method for the detection of soil nitrate nitrogen in multiple samples.

Supplementary Materials

The following supporting information can be downloaded at https://www.mdpi.com/article/10.3390/agriculture13122226/s1. File S1: 3D-printed microfluidics model; Figures S1–S5: The different volume of liquid droplets and their distances from adjacent droplets; Video S1: The process of device detection.

Author Contributions

Conceptualization, X.C. and Y.H.; methodology, L.W.; software, Z.X.; validation, Z.X.; formal analysis, Z.X.; investigation, Z.X. and Y.C.; resources, X.C., R.W. and Y.H.; data curation, Z.X.; writing—original draft preparation, Z.X.; writing—review and editing, X.C., L.W., J.S., Q.H. and Y.H.; project administration, X.C.; funding acquisition, X.C. and R.W. All authors have read and agreed to the published version of the manuscript.

Funding

This research was funded by the National Key Research and Development Program of China (2021YFD2000204); the National Natural Science Foundation of China (12304236 and 32301688); the Natural Science Foundation of Anhui Province (2308085QA19 and 1908085QE202); Science and Technology Mission Program of Anhui Province (S2022t06010123).

Institutional Review Board Statement

Not applicable.

Data Availability Statement

All data from the current study are available from the corresponding author upon reasonable request.

Conflicts of Interest

The authors declare no conflict of interest.

References

  1. Wang, X.T.; Xiao, J.H.; Li, L.; Guo, J.F.; Zhang, M.X.; An, Y.Y.; He, J.M. Ethylene Acts as a Local and Systemic Signal to Mediate UV-B-Induced Nitrate Reallocation to Arabidopsis Leaves and Roots via Regulating the ERFs-NRT1.8 Signaling Module. Int. J. Mol. Sci. 2022, 23, 9068. [Google Scholar] [CrossRef] [PubMed]
  2. Larrea-Alvarez, M.; Purton, S. The Chloroplast of Chlamydomonas reinhardtii as a Testbed for Engineering Nitrogen Fixation into Plants. Int. J. Mol. Sci. 2021, 22, 8806. [Google Scholar] [CrossRef] [PubMed]
  3. Saito, M.; Konishi, N.; Kanno, K.; Yamaya, T.; Kojima, S. Transcriptional repressor IAA17 is involved in nitrogen use by modulating cytosolic glutamine synthetase GLN1;2 in Arabidopsis roots. Soil Sci. Plant Nutr. 2017, 63, 163–170. [Google Scholar] [CrossRef]
  4. Martinez-Dalmau, J.; Berbel, J.; Ordonez-Fernandez, R. Nitrogen Fertilization. A Review of the Risks Associated with the Inefficiency of Its Use and Policy Responses. Sustainability 2021, 13, 5625. [Google Scholar] [CrossRef]
  5. Cui, M.; Zeng, L.H.; Qin, W.; Feng, J. Measures for reducing nitrate leaching in orchards:A review. Environ. Pollut. 2020, 263, 114553. [Google Scholar] [CrossRef] [PubMed]
  6. Chen, Z.; Dolfing, J.; Zhuang, S.; Wu, Y. Periphytic biofilms-mediated microbial interactions and their impact on the nitrogen cycle in rice paddies. Eco-Environ. Health 2022, 1, 172–180. [Google Scholar] [CrossRef]
  7. Penuelas, J.; Sardans, J. Human-driven global nutrient imbalances increase risks to health. Eco-Environ. Health 2023, 2, 246–251. [Google Scholar] [CrossRef]
  8. Fan, Y.Z.; Wang, X.Y.; Qian, X.; Dixit, A.; Herman, B.; Lei, Y.; McCutcheon, J.; Li, B.K. Enhancing the Understanding of Soil Nitrogen Fate Using a 3D-Electrospray Sensor Roll Casted with a Thin-Layer Hydrogel. Environ. Sci. Technol. 2022, 56, 4905–4914. [Google Scholar] [CrossRef]
  9. Fan, Y.Z.; Wang, X.Y.; Funk, T.; Rashid, I.; Herman, B.; Bompoti, N.; Mahmud, S.; Chrysochoou, M.; Yang, M.J.; Vadas, T.M.; et al. A Critical Review for Real-Time Continuous Soil Monitoring: Advantages, Challenges, and Perspectives. Environ. Sci. Technol. 2022, 56, 13546–13564. [Google Scholar] [CrossRef]
  10. Kitic, G.; Krkljes, D.; Panic, M.; Petes, C.; Birgermajer, S.; Crnojevic, V. Agrobot Lala-An Autonomous Robotic System for Real-Time, In-Field Soil Sampling, and Analysis of Nitrates. Sensors 2022, 22, 4207. [Google Scholar] [CrossRef]
  11. Li, Y.; Yang, Q.; Chen, M.; Wang, M.; Zhang, M. An ISE-based On-Site Soil Nitrate Nitrogen Detection System. Sensors 2019, 19, 4669. [Google Scholar] [CrossRef] [PubMed]
  12. Charbaji, A.; Heidari-Bafroui, H.; Rahmani, N.; Anagnostopoulos, C.; Faghri, M. A 3D Printed Lightbox for Enhancing Nitrate Detection in the Field Using Microfluidic Paper-Based Devices. Present. Innov. Microfluid. 2022, 3, 21. [Google Scholar]
  13. Ali, M.A.; Jiang, H.W.; Mahal, N.K.; Weber, R.J.; Kumar, R.; Castellano, M.J.; Dong, L. Microfluidic impedimetric sensor for soil nitrate detection using graphene oxide and conductive nanofibers enabled sensing interface. Sens. Actuators B-Chem. 2017, 239, 1289–1299. [Google Scholar] [CrossRef]
  14. Ali, M.A.; Mondal, K.; Wang, Y.F.; Jiang, H.W.; Mahal, N.K.; Castellano, M.J.; Sharma, A.; Dong, L. In situ integration of graphene foam-titanium nitride based bio-scaffolds and microfluidic structures for soil nutrient sensors. Lab Chip 2017, 17, 274–285. [Google Scholar] [CrossRef] [PubMed]
  15. Baumbauer, C.L.; Goodrich, P.J.; Payne, M.E.; Anthony, T.; Beckstoffer, C.; Toor, A.; Silver, W.; Arias, A.C. Printed Potentiometric Nitrate Sensors for Use in Soil. Sensors 2022, 22, 4095. [Google Scholar] [CrossRef] [PubMed]
  16. Ali, M.A.; Wang, X.R.; Chen, Y.C.; Jiao, Y.Y.; Mahal, N.K.; Moru, S.; Castellano, M.J.; Schnable, J.C.; Schnable, P.S.; Dong, L. Continuous Monitoring of Soil Nitrate Using a Miniature Sensor with Poly(3-octyl-thiophene) and Molybdenum Disulfide Nanocomposite. ACS Appl. Mater. Interfaces 2019, 11, 29195–29206. [Google Scholar] [CrossRef] [PubMed]
  17. Smolka, M.; Puchberger-Enengl, D.; Bipoun, M.; Klasa, A.; Kiczkajlo, M.; Smiechowski, W.; Sowinski, P.; Krutzler, C.; Keplinger, F.; Vellekoop, M.J. A mobile lab-on-a-chip device for on-site soil nutrient analysis. Precis. Agric. 2017, 18, 152–168. [Google Scholar] [CrossRef]
  18. Xu, Z.; Wang, X.; Weber, R.J.; Kumar, R.; Dong, L. Nutrient Sensing Using Chip Scale Electrophoresis and In Situ Soil Solution Extraction. IEEE Sens. J. 2017, 17, 4330–4339. [Google Scholar] [CrossRef]
  19. Zhang, J.Q.; Wang, R.J.; Jin, Z.; Guo, H.Y.; Liu, Y.; Chang, Y.J.; Chen, J.N.; Li, M.Y.; Chen, X.Y. Development of On-Site Rapid Detection Device for Soil Macronutrients Based on Capillary Electrophoresis and Capacitively Coupled Contactless Conductivity Detection (C4D) Method. Chemosensors 2022, 10, 84. [Google Scholar] [CrossRef]
  20. Li, F.; Smejkal, P.; Macdonald, N.P.; Guijt, R.M.; Breadmore, M.C. One-Step Fabrication of a Microfluidic Device with an Integrated Membrane and Embedded Reagents by Multimaterial 3D Printing. Anal. Chem. 2017, 89, 4701–4707. [Google Scholar] [CrossRef]
  21. Bleyen, N.; Albrecht, A.; De Canniere, P.; Wittebroodt, C.; Valcke, E. Non-destructive on-line and long-term monitoring of in situ nitrate and nitrite reactivity in a clay environment at increasing turbidity. Appl. Geochem. 2019, 100, 131–142. [Google Scholar] [CrossRef]
  22. Chen, M.; Zhang, M.; Wang, X.M.; Yang, Q.L.; Wang, M.H.; Liu, G.; Yao, L. An All-Solid-State Nitrate Ion-Selective Electrode with Nanohybrids Composite Films for In-Situ Soil Nutrient Monitoring. Sensors 2020, 20, 2270. [Google Scholar] [CrossRef] [PubMed]
  23. Xie, M.; Chen, T.L.; Xin, X.; Cai, Z.W.; Dong, C.; Lei, B. Multiplex detection of foodborne pathogens by real-time loop-mediated isothermal amplification on a digital microfluidic chip. Food Control 2022, 136, 108824. [Google Scholar] [CrossRef]
  24. Wang, A.Y.; Feng, X.; He, G.Y.; Xiao, Y.; Zhong, T.; Yu, X. Recent advances in digital microfluidic chips for food safety analysis: Preparation, mechanism and application. Trends Food Sci. Technol. 2023, 134, 136–148. [Google Scholar] [CrossRef]
  25. Lee, M.S.; Chang, Y.C.; Huang, H.Y.; Hsu, W.S. Single-type reporter multiplexing with A single droplet through bead-based digital microfluidics. J. Pharm. Biomed. Anal. 2022, 219, 114877. [Google Scholar] [CrossRef]
  26. Li, H.B.; Liu, X.M.; Zhu, F.J.; Ma, D.C.; Miao, C.Y.; Su, H.R.; Deng, J.; Ye, H.Y.; Dong, H.Y.; Bai, X.; et al. Spatial barcoding-enabled highly multiplexed immunoassay with digital microfluidics. Biosens. Bioelectron. 2022, 215, 114557. [Google Scholar] [CrossRef]
  27. Xie, M.; Chen, T.L.; Cai, Z.W.; Lei, B.; Dong, C. A digital microfluidic platform coupled with colorimetric loop-mediated isothermal amplification for on-site visual diagnosis of multiple diseases. Lab Chip 2023, 23, 2778–2788. [Google Scholar] [CrossRef]
  28. Foudeh, A.M.; Brassard, D.; Tabrizian, M.; Veres, T. Rapid and multiplex detection of Legionella’s RNA using digital microfluidics. Lab Chip 2015, 15, 1609–1618. [Google Scholar] [CrossRef]
  29. Shih, S.C.C.; Mufti, N.S.; Chamberlain, M.D.; Kim, J.; Wheeler, A.R. A droplet-based screen for wavelength-dependent lipid production in algae. Energy Environ. Sci. 2014, 7, 2366–2375. [Google Scholar] [CrossRef]
  30. Gu, Z.; Wu, M.L.; Yan, B.Y.; Wang, H.F.; Kong, C. Integrated Digital Microfluidic Platform for Colorimetric Sensing of Nitrite. ACS Omega 2020, 5, 11196–11201. [Google Scholar] [CrossRef]
  31. Gu, Z.; Luo, J.J.; Ding, L.W.; Yan, B.Y.; Zhou, J.L.; Wang, J.G.; Wang, H.F.; Kong, C. Colorimetric Sensing with Gold Nanoparticles on Electrowetting-Based Digital Microfluidics. Micromachines 2021, 12, 1423. [Google Scholar] [CrossRef] [PubMed]
  32. Srinivasan, V.; Pamula, V.K.; Fair, R.B. An integrated digital microfluidic lab-on-a-chip for clinical diagnostics on human physiological fluids. Lab Chip 2004, 4, 310–315. [Google Scholar] [CrossRef] [PubMed]
  33. Choi, K.; Mudrik, J.M.; Wheeler, A.R. A guiding light: Spectroscopy on digital microfluidic devices using in-plane optical fibre waveguides. Anal. Bioanal. Chem. 2015, 407, 7467–7475. [Google Scholar] [CrossRef] [PubMed]
  34. Wang, F.; Zhu, J.M.; Hu, X.J.; Chen, L.F.; Zuo, Y.F.; Yang, Y.; Jiang, F.H.; Sun, C.J.; Zhao, W.H.; Han, X.T. Rapid nitrate determination with a portable lab-on-chip device based on double microstructured assisted reactors. Lab Chip 2021, 21, 1109–1117. [Google Scholar] [CrossRef] [PubMed]
  35. Legiret, F.E.; Sieben, V.J.; Woodward, E.M.S.; Bey, S.; Mowlem, M.C.; Connelly, D.P.; Achterberg, E.P. A high performance microfluidic analyser for phosphate measurements in marine waters using the vanadomolybdate method. Talanta 2013, 116, 382–387. [Google Scholar] [CrossRef] [PubMed]
  36. Sieben, V.J.; Floquet, C.F.A.; Ogilvie, I.R.G.; Mowlem, M.C.; Morgan, H. Microfluidic colourimetric chemical analysis system: Application to nitrite detection. Anal. Methods 2010, 2, 484–491. [Google Scholar] [CrossRef]
  37. Nelson, G.L.; Lackey, H.E.; Bello, J.M.; Felmy, H.M.; Bryan, H.B.; Lamadie, F.; Bryan, S.A.; Lines, A.M. Enabling Microscale Processing: Combined Raman and Absorbance Spectroscopy for Microfluidic On-Line Monitoring. Anal. Chem. 2021, 93, 1643–1651. [Google Scholar] [CrossRef]
  38. Nelson, G.L.; Lines, A.M.; Bello, J.M.; Bryan, S.A. Online Monitoring of Solutions Within Microfluidic Chips: Simultaneous Raman and UV-Vis Absorption Spectroscopies. ACS Sensors 2019, 4, 2288–2295. [Google Scholar] [CrossRef]
  39. Alistar, M.; Gaudenz, U. OpenDrop: An Integrated Do-It-Yourself Platform for Personal Use of Biochips. Bioengineering 2017, 4, 45. [Google Scholar] [CrossRef]
  40. Liu, D.; Yang, Z.H.; Zhang, L.Y.; Wei, M.L.; Lu, Y. Cell-free biology using remote-controlled digital microfluidics for individual droplet control. RSC Adv. 2020, 10, 26972–26981. [Google Scholar] [CrossRef]
  41. Lippmann, G. Relations entre les phénomènes électriques et capillaires. Ann. Chim. Phys. 1875, 5, 494–549. [Google Scholar]
  42. Beaton, A.D.; Cardwell, C.L.; Thomas, R.S.; Sieben, V.J.; Legiret, F.-E.; Waugh, E.M.; Statham, P.J.; Mowlem, M.C.; Morgan, H. Lab-on-Chip Measurement of Nitrate and Nitrite for In Situ Analysis of Natural Waters. Environ. Sci. Technol. 2012, 46, 9548–9556. [Google Scholar] [CrossRef] [PubMed]
  43. Huang, S.; Connolly, J.; Khlystov, A.; Fair, R.B. Digital Microfluidics for the Detection of Selected Inorganic Ions in Aerosols. Sensors 2020, 20, 1281. [Google Scholar] [CrossRef] [PubMed]
  44. Nightingale, A.M.; Hassan, S.U.; Warren, B.M.; Makris, K.; Evans, G.W.H.; Papadopoulou, E.; Coleman, S.; Niu, X.Z. A Droplet Microfluidic-Based Sensor for Simultaneous in Situ Monitoring of Nitrate and Nitrite in Natural Waters. Environ. Sci. Technol. 2019, 53, 9677–9685. [Google Scholar] [CrossRef]
  45. Chen, S.; Chen, J.H.; Qian, M.Y.; Liu, J.; Fang, Y.M. Low cost, portable voltammetric sensors for rapid detection of nitrate in soil. Electrochim. Acta 2023, 446, 142077. [Google Scholar] [CrossRef]
  46. Charbaji, A.; Heidari-Bafroui, H.; Anagnostopoulos, C.; Faghri, M. Sensitive Detection of Nitrate using a Paper-based Microfluidic Device. In Proceedings of the Innovations in Microfluidics and Single Cell Analysis, Boston, MA, USA, 17–18 August 2020. [Google Scholar]
  47. Ferreira, F.T.S.M.; Mesquita, R.B.R.; Rangel, A.O.S.S. Novel microfluidic paper-based analytical devices (μPADs) for the determination of nitrate and nitrite in human saliva. Talanta 2020, 219, 121183. [Google Scholar] [CrossRef]
  48. Thongkam, T.; Hemavibool, K. An environmentally friendly microfluidic paper-based analytical device for simultaneous colorimetric detection of nitrite and nitrate in food products. Microchem. J. 2020, 159, 105412. [Google Scholar] [CrossRef]
Figure 1. The digital microfluidic platform for soil nitrate nitrogen detection. (a) Schematic diagram of soil nitrate nitrogen sample driving. (b) Structure and cross-sectional diagram of open digital microfluidic chip. (c) Physical image of the entire digital microfluidic nitrate nitrogen detection platform.
Agriculture 13 02226 g001
Figure 2. Soil nitrate nitrogen detection 3D-printing module. (a) The 3D-printed micro-channel prototype mold. (b) Mold with quartz glass slide inserted. (c) Mold after injecting AB glue. (d) The 3D-printed microfluidic top-view structure. (e) The structure used for sealing inside the 3D-printed microfluidic groove.
Agriculture 13 02226 g002
Figure 3. Setup of the device used for soil nitrate nitrogen determination.
Agriculture 13 02226 g003
Figure 4. The principle of droplet motion on a digital microfluidic platform.
Agriculture 13 02226 g004
Figure 5. On the digital microfluidic platform, the volume of liquid droplets and their distances from adjacent droplets.
Agriculture 13 02226 g005
Figure 6. There are photographs available showcasing the details and designs of 3D-printed microfluidics, pipes, and fiber optic connections.
Agriculture 13 02226 g006
Figure 7. Schematic diagram of digital microfluidics multi-sample driving.
Agriculture 13 02226 g007
Figure 8. Raw data for nitrate nitrogen concentration detection at 0 mg/L, 0.5 mg/L, and 1 mg/L.
Agriculture 13 02226 g008
Figure 9. The time series plot of nitrate nitrogen standard solution light intensity. (a) The time series plot of light intensity for nitrate nitrogen standard solutions of 0 mg/L, 0.5 mg/L, and 1 mg/L. (b) The time series plot of light intensity for nitrate nitrogen standard solutions of 2 mg/L, 3 mg/L, and 4 mg/L.
Agriculture 13 02226 g009
Figure 10. The standard linear curve of light absorption and nitrate nitrogen nitrate concentration.
Agriculture 13 02226 g010
Figure 11. Scatter plot of calibration absorbance of 15 blank samples.
Agriculture 13 02226 g011
Figure 12. The time series plot of soil samples 1–10 light intensity. (a) The time series plot of soil samples 1–3 light intensity. (b) The time series plot of soil samples 4–6 light intensity. (c) The time series plot of soil sample 7–10 light intensity.
Agriculture 13 02226 g012
Table 1. Detecting soil nitrate nitrogen content with this device and national standard method.
SampleFiber Optic Spectrometer (mg/L)UV Spectrophotometer (mg/L)RSD (%)Relative Error (%)
10.9561.1424.716.3
22.9702.8453.94.4
33.3863.3004.22.6
42.5852.4331.96.2
53.1503.0110.94.6
61.6761.5823.35.9
71.9711.9462.11.3
81.3861.5341.59.6
90.8571.0514.418.5
101.7161.9823.913.4
Table 2. Content and recovery of nitrate nitrogen in soil based on our device.
SampleNitrate Nitrogen Concentration (mg/L)Amount Spiked (mg/L)Amount Detected (mg/L)Recovery (%)RSD (%, n = 3)
111.48512.510102.51.86
121.69312.64294.90.76
131.29312.302100.90.60
141.57512.621104.62.52
Table 3. Comparison of existing nitrate nitrogen devices.
Number of Samples per TestDetection Range (mg/L)Application ScenariosMeasurement MethodsTotal Samples ConsumptionLODRef.
10.0993–99.77SoilImpedance1 mL30 µg/L[13]
10–13.54SoilColorimetric Determination-1.129 mg/L[20]
10.7–69.98 Soil Voltametric-32.19 µg/L[45]
-0.993–9.93Aerosolsspectrometera few microliters-[43]
In Situ0.000361–0.28Natural watersColorimetric-361 ng/L[42]
10.0023–11.29Waters and other fieldsColorimetric95 µL120 µg/L[46]
62.8–16.79Human salivaColorimetric25 µL1.12 mg/L[47]
10.11–9.03FoodColorimetric20 µL90 µg/L[48]
30.095–4SoilUV-vis absorption40 µL95 µg/LThis work
Disclaimer/Publisher’s Note: The statements, opinions and data contained in all publications are solely those of the individual author(s) and contributor(s) and not of MDPI and/or the editor(s). MDPI and/or the editor(s) disclaim responsibility for any injury to people or property resulting from any ideas, methods, instructions or products referred to in the content.

