Article

Organic Hydromulches in Young Olive Trees in Pots: Effects on Soil and Plant Parameters

1
Higher Technical School of Agricultural Engineering in Ciudad Real, University of Castilla-La Mancha, Ronda de Calatrava 7, 13071 Ciudad Real, Spain
2
Council of Agriculture, Water and Rural Development, Junta de Comunidades de Castilla-La Mancha, 13270 Ciudad Real, Spain
*
Author to whom correspondence should be addressed.
Agriculture 2023, 13(12), 2211; https://doi.org/10.3390/agriculture13122211
Submission received: 15 October 2023 / Revised: 19 November 2023 / Accepted: 24 November 2023 / Published: 28 November 2023
(This article belongs to the Special Issue Sustainable and Ecological Agriculture in Crop Production)

Abstract

:
Organic hydromulches (liquid spray-on mulches) have been used traditionally in land rehabilitation, mainly to mitigate post-fire runoff and erosion. However, in recent years, a new application of these materials as an eco-friendly alternative to the widely used polyethylene mulch, both in vegetable and woody crops, has been studyied. This work analyzes the effects of six hydromulches, based on organic by-products, on different soil parameters (water content, temperature, and CO2 flux), plant–water relations (stem water potential, leaf gas exchange, and leaf temperature), and the growth (trunk diameter) of young olive trees planted in large pots in the open field over a 2-year trial. The hydromulches tested were: rice husk (RH), rice husk with linen oil (RHL), mushroom substrate (MS), wheat straw (WS), pistachio (PW), and vineyard (VW) pruning wood chips, mixed with different additives (gypsum, recycled paper paste, and Kraft fiber). A non-mulched manual weeding control (NM) was included. The results indicated that hydromulches, in comparison with NM, resulted in increased volumetric soil water content (on average, 22.9% in hydromulches and 19.5% in NM), reduced soil temperature fluctuations (4.97 °C in hydromulches and 6.13 °C in NM), and increased soil CO2 fluxes (0.80 and 0.49 g CO2 m−2 h−1, respectively). Although the differences in the soil water content did not have an obvious effect on the plant–water status, crop growth was reduced in NM (≈23% lower than PW, MS, RHL, and WS), suggesting that vegetative growth, especially in young olive trees, is extremely sensitive to water deficit. The overall study leads to considering hydromulches as a good alternative to mulching in large pots, especially PW, which would be useful for nursery crops before their final establishment in the field.

1. Introduction

Hydromulch can be defined as a biodegradable mulch material that is applied to the substrate in a liquid form and that, once there, solidifies, creating a cover on the ground. Essentially, it consists of a mixture of water with a lignocellulosic organic material or polymers with a certain plasticity and, generally, agricultural waste materials or by-products, as well as other additives for greater durability and stability over time, all of them in a correct proportion [1,2,3].
Traditionally, the main uses of hydromulches have been focused on land rehabilitation, mainly to mitigate post-fire runoff and erosion, especially in sloping areas [1,2,4,5]. In agriculture, they were used for the first time in the USA in the 1990s on vegetable crops with little success, mainly due to their application difficulty [6]. In the following years, they were used experimentally in fruit orchards, with promising results for crop yield and fruit quality [7,8]. However, there are still few studies on the behavior of hydromulches with different compositions in agriculture, although they could well represent a more sustainable alternative to the widely used polyethylene. It was recently concluded that escarole plants grown over hydromulches based on a rice husk, cereal straw, and mushroom substrate exhibited significantly improved growth under water stress conditions [9]. In the same crop, it was also found that hydromulch composed of mushroom by-products combined with the inoculation of a type of mycorrhizae improved the growth of escarole [10]. Using the same mixtures to test perennial weed emergence, it was observed that these materials reduced the appearance of certain weed species, confirming their potential to be used as a non-chemical weed control method [3]. From an economic point of view, it was concluded that the use of hydromulches in artichoke crop cultivation is more sustainable and profitable, as well as environmentally friendly, than traditional polyethylene mulching, although the availability of plant waste in the area where hydromulching is used is important for its economic viability [11].
Despite these studies, and to the best of our knowledge, there is no work on how hydromulches affect certain aspects of soil in large pots located in the open air, among which the possible effect on soil moisture is crucial in arid or semi-arid areas, where practices addressing the optimization of the water use efficiency—and their possible effects on plant water relations and growth—are a priority. In the same way, studies dealing with the effect of hydromulches on soil temperature and CO2 flux would provide important information about their suitability and functioning by possible effects on microbial activity and organic matter mineralization rates under those conditions.
For this reason, the aim of the present study was to analyze the effects of six hydromulches with different compositions on different soil parameters (water content, temperature, and CO2 flux), plant–water relations, and the growth of young olive trees grown in large pots in the open air. This approach is motivated by the following considerations: (i) olive is one of the most widespread crops in Mediterranean countries, and is very resistant to stressful conditions; (ii) young trees compete poorly with weeds and are very sensitive to chemical herbicides, so the use of more eco-friendly alternatives needs to be explored; and (iii) cultivation in large pots would largely simulate field conditions to some extent, but at the same time, would allow the results to be extrapolated to nursery crops before their final planting in the field.

2. Materials and Methods

2.1. Trial Description

A field experiment was conducted from 2 May 2019 to 25 March 2021 in young olive (Olea europaea cv Picual) trees at the Agrarian Research Centre “El Chaparrillo” (39°0′ N–3°56′ W, altitude 640 m) (Regional Institute of Agri-Food and Forestry Research and Development, IRIAF), Ciudad Real, Spain. The climate of the study area is continental Mediterranean, with an average annual rainfall of 415 mm, mostly distributed outside a 4-month summer drought period. During the trial, the average mean, maximum, and minimum air temperatures were 14.9, 22.3, and 7.4 °C, respectively, and the total accumulated rainfall and reference evapotranspiration (ETo) were 587 and 2325 mm, respectively. Temperatures ranged from 43.2 °C to −7.8 °C, while ETo varied between 0.2 and 8.5 mm day−1. The highest daily rainfall was 25.6 mm. The evolution of these data throughout the trial period is shown in Figure 1 (data obtained from an automatic weather station around 100 m away from the experimental field).
In April 2018, 2-year-old olive plantlets were transplanted to a total of 35 round black pots (one olive tree in each), and were therefore 3 years old in 2019, at the beginning of the trial. The pots were of 700 L capacity, with an upper diameter of 110 cm and height of 75 cm, and were distributed in seven lines with five pots each, separated by 3 m. They were filled with a substrate based on a mixture of agricultural soil from the farm (≈60%), vegetable substrate (≈30%), and a layer of gravel at the bottom (≈20 cm, ≈10%) to favor drainage. The substrate was sandy loam (58.8% sand, 29.5% silt, and 11.7% clay), with pH 7.5, an electrical conductivity of 0.17 dS m−1, 2.8% organic matter, 16.2 meq 100 g−1 cationic exchange capacity, a bulk density of 1.38 g cm−3, and a volumetric water content (θ, %) of 52, 27, and 8% at the saturation point, field capacity, and permanent wilting point, respectively.
With the aim of avoiding any overheating of the root system due to their black color, the pots were externally coated with silver paper. Each of them was drip-irrigated with a 16 mm low-density polyethylene pipe, arranged in a circular shape and buried 20 cm deep. Anti-siphon emitters, separated by 75 cm and with 3.4 L h−1, were used.
As a result of previous tests, both in the laboratory and in the open air, six hydromulches, based on organic by-products derived from the agricultural sector, were applied: rice husk (RH), rice with linen oil (RHL), mushroom substrate (MS), wheat straw (WS), pistachio pruning wood chips (PW), and vineyard pruning wood chips (VW). The wheat straw and wood chips were milled with a 2.5 mm sieve. The by-products were mixed with different additives (in all the hydromulches: gypsum as a binder, recycled paper paste as a homogenizer, and Kraft fiber for greater consistency; in RHL: linen oil surface sprayed as waterproofing) and immediately applied in liquid form (with subsequent solidification) on the top of the pots in a 2 cm thick layer. Additionally, a non-mulched treatment (NM) with manual weeding was included as a control. Thus, a total of seven treatments, each with five pots distributed completely at random in the plot, were involved. This operation was performed on 2 May 2019, the date considered to be the beginning of the trial (0 days after mulching, DAM).
The doses of the different components for the mixtures can be found in a previous paper [3], with the exception of the pistachio and the vineyard pruning wood chips, which were 1060 g m−2 in both cases.
The appearance of the materials that constituted the hydromulches can be seen in Figure 2.
During the trial, the irrigation period extended from 6 May to 15 November in 2019 and from 18 May to 9 October in 2020. The irrigation doses, the same for all treatments, were calculated following the FAO methodology [12]. However, problems with the irrigation equipment during the irrigation periods forced reductions in the doses and the frequency, which finally totaled ≈1000 and 1200 L pot−1 throughout the irrigation seasons in 2019 and 2020, respectively. For fertilization and phytosanitary management, organic farming practices (current EC n.848/2018) were adopted, and the olive trees were pruned when necessary to keep the aerial and root systems balanced.

2.2. Soil Measurements

During the experiment, the soil water content was periodically measured in each profile pot with a Diviner 2000 probe from Sentek Pty. Ltd., Stepney, Australia, to a depth of 40 cm with 10 cm intervals. For this purpose, one access tube per pot was placed at approximately 2/3 of the distance from the olive tree and 1/3 from the pot wall.
The soil temperature was determined in each pot by 107 Campbell probes, installed at 5 cm depth and at a point equidistant from the olive tree and the wall of the pot. Measurements were recorded every 30 min in a CR1000 datalogger (Campbell Sci, Loughborough, UK). The soil temperature parameters considered were the average maximum temperature (STmax), average minimum temperature (STmin), average mean temperature (STmean), and temperature amplitude (STA), calculated as the average of daily maximum–daily minimum soil temperatures. These values were compared with the corresponding air temperature parameters registered in the automatic weather station located at the experimental farm.
Additionally, in order to evaluate the possible effect of the different hydromulches on soil respiration, the CO2 flux (expressed as g CO2 m−2 h−1) was measured on a number of dates (Table 1) with an EGM-4 portable soil respiration chamber (non-dispersive infrared gas analyzer) equipped with an SRC-1 chamber that was 150 mm high and 100 mm in diameter, PP System. All the measurements were taken between 12:00 and 14:00 (solar time) at the same point in each pot. At these points, hydromulch circles were cut with the perimeter of the SRC-1 chamber. At the time of taking the measurements, these portions of material were removed and the chamber was attached directly to the soil (previously covered by the hydromulch), placing the material back in place as a cover until the following inspection. The time of each measurement was approximately 120 s [13], depending on the rate of increase in the CO2 concentrations in the chamber. Just before CO2 flux measurements were taken, the soil temperature and humidity were recorded at the same points [13,14] at a depth of 5 cm. The soil temperature was measured using a needle soil digital thermometer (ThermoProbe, Pearl, MS, USA) and humidity with a Spectrum FieldScout TDR 300 soil moisture meter. The average air temperature for each sampling period was also recorded with a thermocouple linked to a data logger (model HI-141 GH, Hanna) located 1.5 m above the ground in the center of the plot.

2.3. Plant Measurements

Throughout the trial, measurements relative to the water relations and the growth of the olive trees were taken (sampling dates shown in Table 1).
The plant–water relations were determined by the stem water potential (Ψstem, MPa), leaf gas exchange, and leaf temperature (Tleaf, °C). Gas exchange included the net assimilation rate (An, μmol CO2 m−2 s−1), stomatal conductance to water vapor (gs, mmol H2O m−2 s−1), transpiration (E, mmol H2O m−2 s−1), and the intrinsic water use efficiency (iWUE), calculated as the ratio between the carbon assimilated through photosynthesis and the transpiration (An/E). All the measurements were performed at midday (12:00–14:00 h, solar time) on sunny days for healthy, sun-exposed, and fully developed leaves located approximately at the middle of the trees by height, with one leaf per tree for Ψstem and gas exchange and two leaves per tree for Tleaf. Ψstem was determined by covering the leaves in silver paper at least one hour before measurement by using the pressure chamber technique [15]. Leaf gas exchange was determined with an infrared gas analyzer (CIRAS 3, PP Systems, Amesbury, MA, USA), while Tleaf was measured with a hand-held infrared thermometer (mod. DVM8861) at an emissivity of 0.98 and a spectral response range of 8–14 µm. As Tleaf (or canopy temperature) can be interpretated not only in absolute terms, but also in comparison with the temperature of the surroundings, the average air temperature while measuring Tleaf was also recorded with the thermocouple previously described for soil CO2 flux. Then, ΔTleaf−air was also calculated.
Additionally, the growth of the olive trees was determined by periodic measurements of the trunk diameter (mm), taken with a digital caliper for all the trees at 30 cm from the ground.
The experiment extended until the end of March 2021 (693 DAM), when the hydromulches lost their physical properties.

2.4. Statistical Analysis

The data related to the observations of each of the variables studied were previously analyzed and refined through an exploratory descriptive analysis. For this purpose, the corresponding measures of centralization (mean and median) and dispersion (standard deviation, coefficient of variation, and percentiles) were obtained; box plots were also analyzed and the corresponding tests for normality (Shapiro–Wilk test) and homoscedasticity were performed in order to make the choice of inferential techniques of appropriate mean comparisons. Hence, analysis of variance (ANOVA), complemented by the Duncan Test, was used to compare the means of the different treatments at a significance level of α = 0.05.
For the parameters considered, the evolution and statistical differences at the various sampling dates are represented. Likewise, a comparison of the different parameters measured during the first 180 days from the beginning of the trial (days after mulching, DAM) was performed, averaging the values recorded in the different sampling dates during this period (Table 1). This period was chosen because the hydromulches remained practically intact during the first 180 days; therefore, the results obtained did not depend on the varying deterioration states of the materials.
In the correlation analyses, Pearson’s correlation coefficients at α = 0.05 were obtained.
Analysis of the data was carried out with Infostat v. 2020 professional.

3. Results

3.1. Effect of the Hydromulches on Soil Parameters

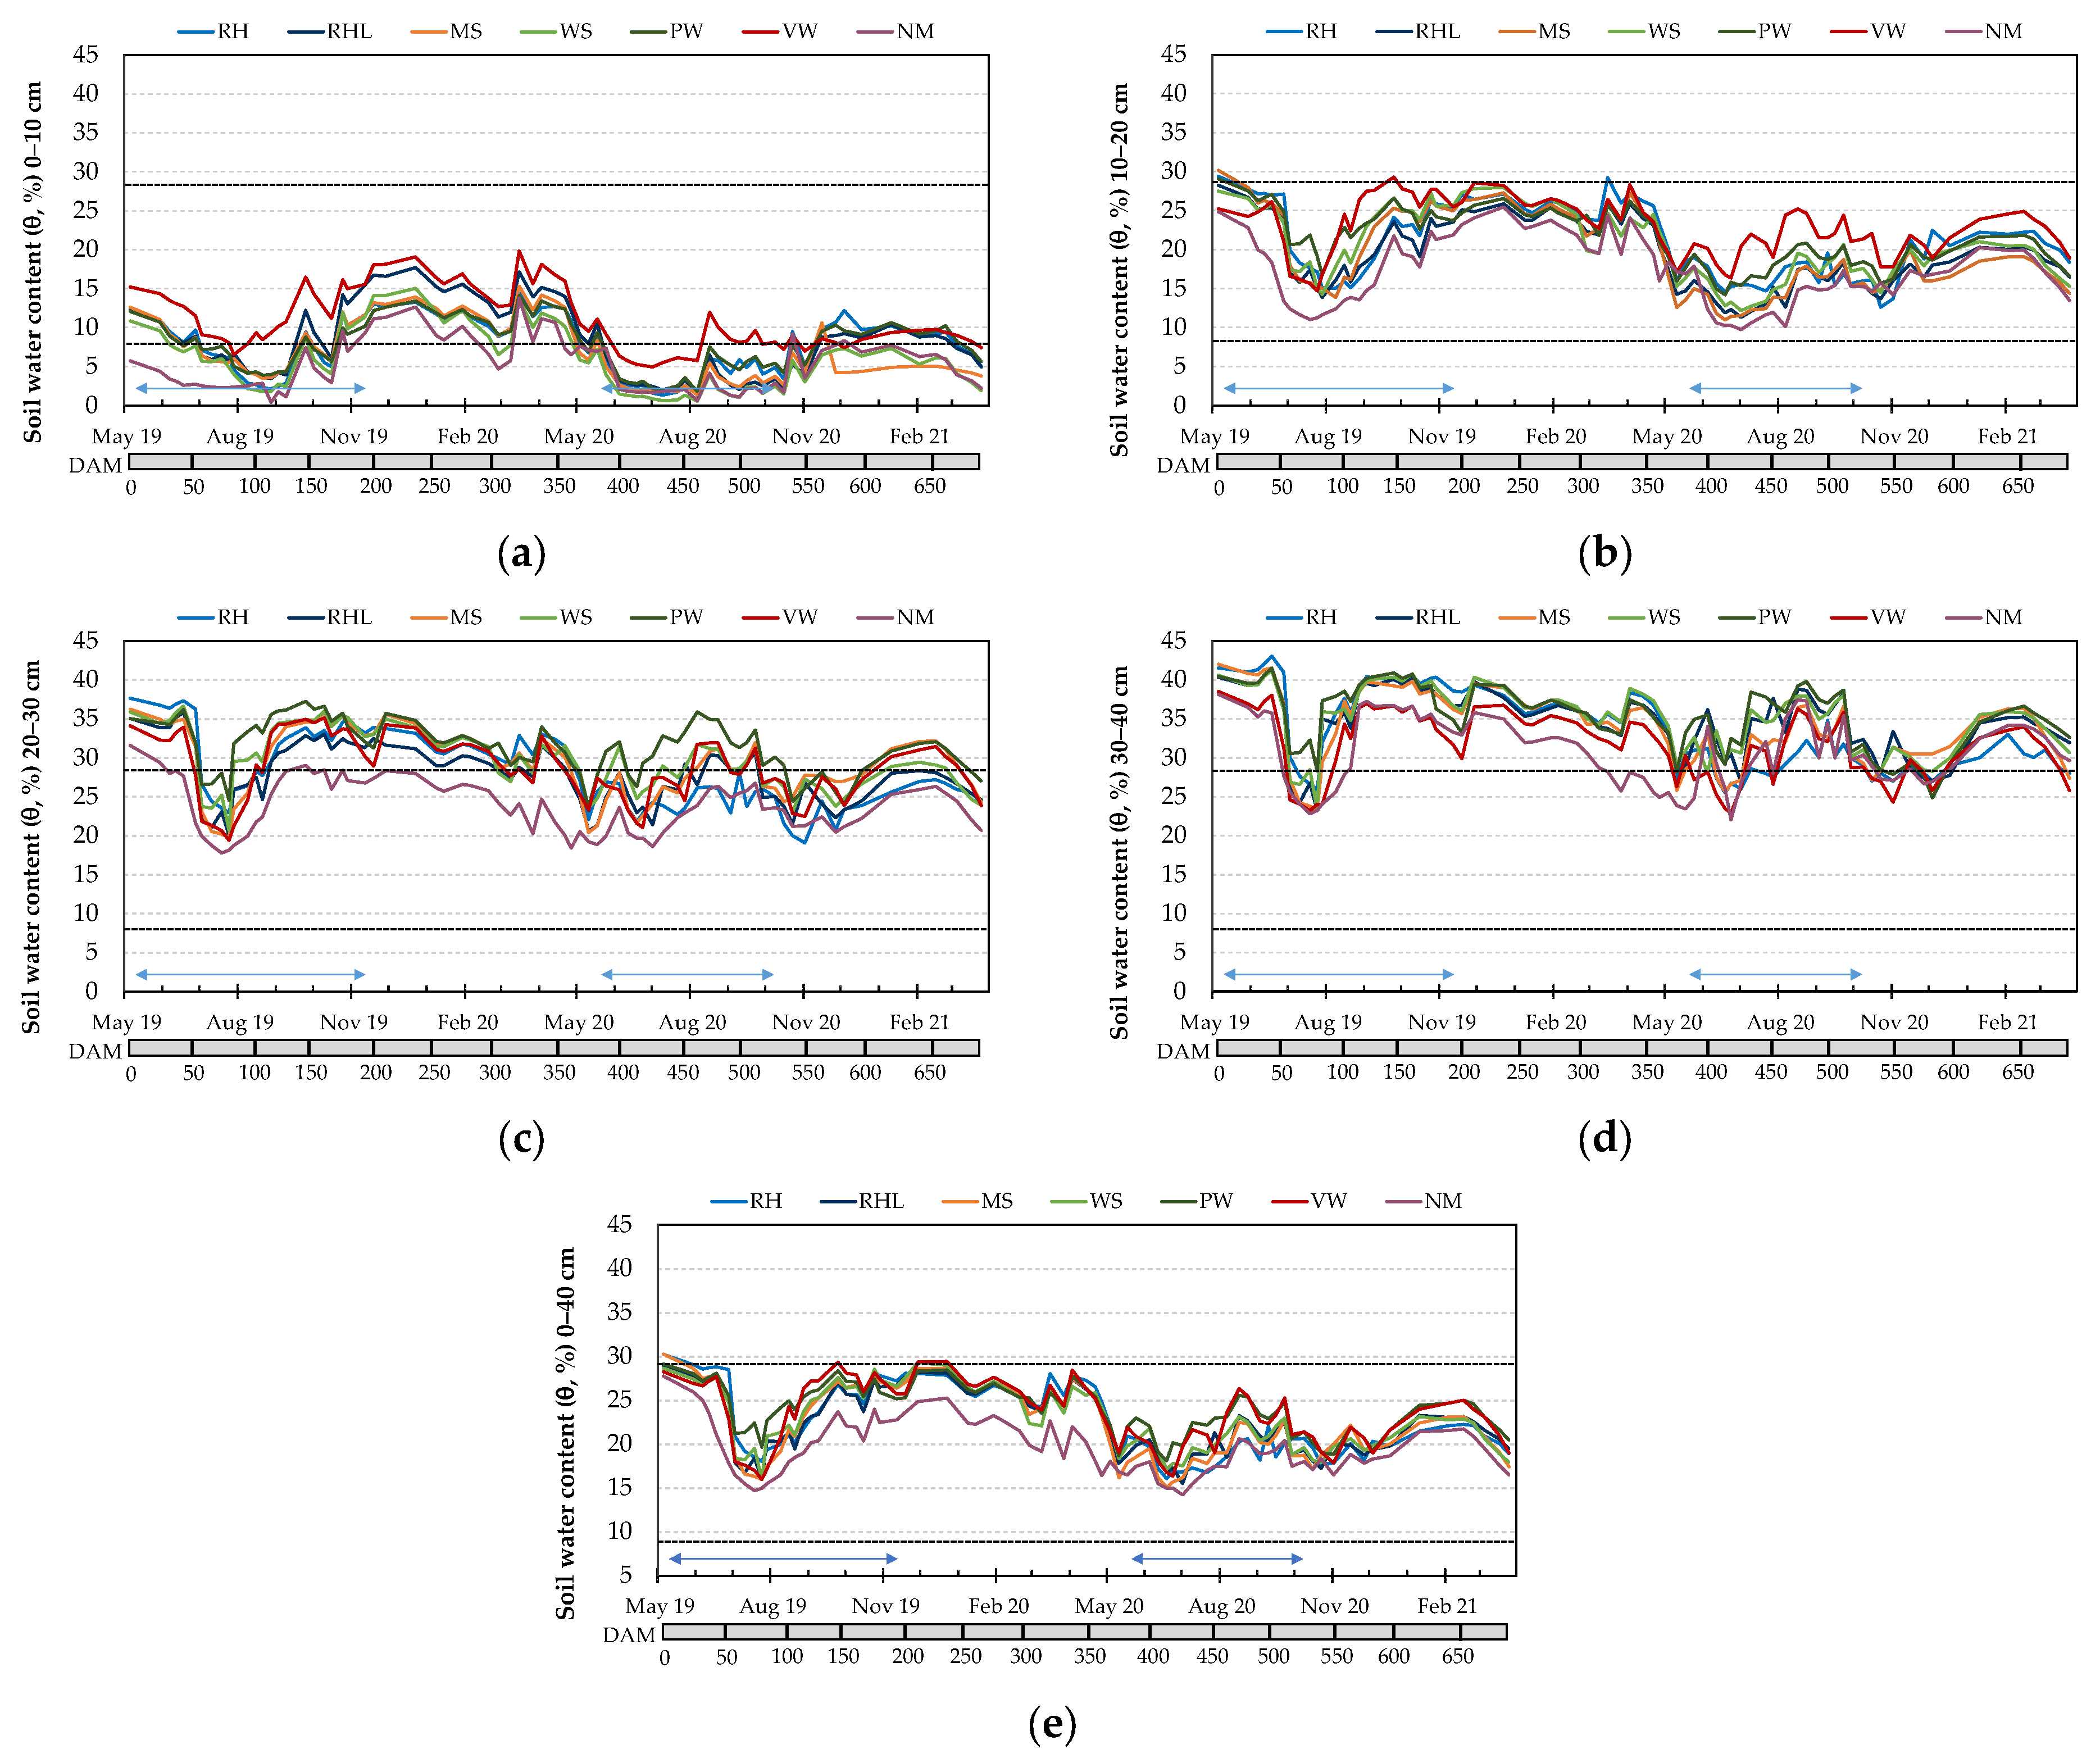
3.1.1. Soil Water Content

The volumetric soil water content (θ, %) reached during the trial is presented in Figure 3, including the data obtained in each 10 cm depth (Figure 3a–d) and the average throughout the soil profile (0–40 cm, Figure 3e). The seasonal pattern of θ was similar for all of the treatments, with maximum values at the beginning of the experiment and subsequent decreases in the summer seasons, accentuated by problems with the irrigation system. Soil moisture increased with depth in all the treatments. Up to 20 cm depth (Figure 3a,b), the highest θ corresponded to VW, while from 20 to 40 cm (Figure 3c,d), the highest was for PW. The lowest values corresponded to NW in all cases.
Considering the averaged profile (0–40 cm, Figure 3e), during some periods (0–50 DAM, 130–350 DAM), θ was maintained almost constant and around field capacity or even slightly higher (θ = 25–30%) in all hydromulches as a consequence of the rainfalls experienced during those periods. Once the second irrigation period ended (≈550 DAM), the soil water content increased in all treatments with respect to the previous values reached in the previous summer months, although it remained below field capacity (θ = 20–25%) and decreased at the end of the trial. The lower θ values reached during the second season, especially in autumn and winter, could be explained by the lower rainfalls in comparison with the previous year (Figure 1) and the higher mulch degradation. PW, throughout most of the trial, besides VW from about 100 DAM, reached θ values slightly higher than those of the other hydromulches on most of the dates. From the beginning of the study, NM registered the lowest θ value, reaching, in the period of greatest water deficit (≈80 DAM), water contents of around 15%.
Averaging the θ data corresponding to the first 180 DAM (Table 2), when the materials still remained practically intact, θ in NM was significantly lower than that in the hydromulches (lowercase letters), with a water content of 19.2% (equivalent to 76.8 mm in the upper 40 cm of the soil). However, no statistical differences among the hydromulches were found (capital letters), ranging from 23.6% in RHL to 25.4% in PW (24.4% on average, 97.4 mm). A similar trend was observed when considering the whole trial period (693 DAM, Table 3), ranging from 19.5% in NM to 23.9% in PW, although the differences among treatments were slightly lower.

3.1.2. Soil Temperature

The evolution of soil temperatures (STmax, STmin, and STmean) under the different treatments and the corresponding air temperatures, are shown in Figure 4.
During the trial, the soil temperature followed a similar pattern to the air temperature in all cases, reaching the lowest values in winter and the highest in summer.
The air temperature ranged widely, between −9.5 °C (January 2021) and 42.3 (June 2019). In relation to STmax (Figure 4a), it was, in general, lower than the air temperature, with differences up to 12 °C in RHL, PW, and VW, and greater than 10 °C in all the treatments. A different pattern was observed in STmin (Figure 4b), where soil temperature was markedly higher than the air temperature, especially in the warmer months, with occasional increases up to 14 °C in all treatments except for MS and VW; in the winter, however, these differences were not so pronounced, and even coincided on some dates. As a result, STmean (Figure 4c) evolved in general with higher values than the air temperature in the summer, with increases on some dates of up to 7–8 °C in all the hydromulches and 9.5 °C in the non-mulched control; in the winter, however, these increases were lower or even negative in some cases (i.e., mean air temperature higher than the mean soil temperature).
Analyzing the results of soil temperature obtained during the first 180 days of the study (Table 2), STmax in NM (28.80 °C) was significantly higher than that in the hydromulch treatments (25.85 °C on average, lowercase letters in Table 2). Among the mulches, WS and PW returned the lowest values, significantly lower than those of RHL and MS (capital letters). In comparison with air temperature, NM registered the lowest decrease (−0.91 °C), while for the mulches, the temperature reduction ranged between −3.24 °C for RHL and −4.50 °C for PW (−3.86 °C on average). Among the mulches, STmin differed significantly between MS (18.93 °C) and RH (20.46 °C) (capital letters), while NM showed an intermediate pattern (lowercase letters). On average, hydromulches increased the STmin by 7.93 °C with respect to the air temperature (range between 8.54 °C for RH to 6.83 °C for MS), with an increase of up to 8.35 °C in NM. In the case of STmean, it varied significantly between treatments, returning the lowest values in WS (22.31 °C) and the highest in NM (24.58 °C) (lowercase letters). Among mulches, significant differences were observed between RH, RHL, VW (23.09 °C on average), and WS (capital letters). The soils below the hydromulches registered a mean temperature 1.65 °C higher than the air (ranging from 1.13 °C in WS to 1.96 °C in RHL), while this increase was up to 3.40 °C in NM.
As a consequence, the soil temperature amplitude (STA, °C, Table 2) was highest in the non-mulched control (8.53 °C) in comparison with the hydromulches (6.00 °C on average). In contrast, among the materials, the greatest damping effect (lower STA) was found in PW and RH, while the highest STA was registered in MS.
Considering the averaged values obtained throughout the whole trial (Table 3), a similar trend to those obtained for the first 180 DAM (Table 2) was observed, although the differences among mulches and NM were not as pronounced. Thus, ST max was significantly higher in NM (19.95 °C) than in hydromulches (18.65 °C on average), with PW exhibiting the lowest values (18.27 °C). STmin was highest in RH (14.19 °C) and lowest in WS (13.02 °C) and MS (13.10 °C), while NM presented intermediate values (13.82 °C). Additionally, STmean was highest in NM (16.92 °C) and lowest in WS (15.65 °C). As a consequence, STA (°C, Table 3) was also higher in NM (6.13 °C) than in mulches (4.97 °C on average), with PW and RH presenting the highest damping effect among mulches (4.23 °C and 4.36 °C, respectively) and MS showing the lowest effect (5.94 °C).

3.1.3. Soil CO2 Flux

The soil CO2 flux ranged between 0.24 and 1.38 g CO2 m−2 h−1 over the sampling period (Figure 5a). Seasonal CO2 fluxes showed a similar trend for all the treatments, with low emissions during the winter months and an increase during the spring and summer. The low values in the winter would correspond to the low air temperatures, and consequently, low soil temperatures, which evolved in a very similar way on all dates (Figure 5b) and in the opposite way to soil humidity (Figure 5c).
The soil CO2 fluxes were significantly different between treatments in the measurements carried out in summer and autumn 2019, and in spring 2020, highlighting, in all cases, the lower values in the non-mulched control; among the hydromulches, however, a clear model was not observed, with VW, PW, WS, and MS achieving the highest values depending on the dates (Figure 5a). Regarding soil temperature (Figure 5b), the differences among treatments (α = 0.05) were observed at 80 DAM (significantly higher in NM), while the soil water content at 5 cm depth when measuring CO2 flux was clearly lower in NM and higher in VW on all the dates (Figure 5c).
According to the correlation analyses performed on these variables when considering all the treatments (Table 4(a)), the soil CO2 flux showed significant positive correlations with the soil temperature (Pearson’s linear correlation coefficient r = 0.61) and air temperature (r = 0.64) and negative correlations with the soil water content (r = −0.48), a consequence of the inverse relationship between the soil temperature and moisture (r = −0.82). However, excluding NM from the analyses (Table 4(b)), the correlation coefficients increased in absolute values, especially those corresponding to the relationship between CO2 flux and soil water content (r = −0.66). Analyzing the relationships between the soil CO2 flux and the other variables in NM individually, it was observed that the correlations were not significant.
Regarding the soil CO2 flux averaged across both the first 180 days of the trial (Table 2) and the whole sampling period (Table 3), no significant differences among the hydromulches were observed (capital letters), although it was slightly higher for VW, MS, and RH. However, those of hydromulches were significantly increased, by 0.47 and 0.32 g CO2 m−2 h−1, compared with the non-mulched control, with the differences being larger at the beginning of the trial, when the materials remained practically intact.

3.2. Effect of the Hydromulches on Plant Parameters

3.2.1. Plant–Water Relations

The midday Ψstem ranged over the sampling dates between −0.6 MPa (NM, 29 DAM, 27 May 2019) and −1.3 MPa (all treatments except for VW, 113 DAM, 23 August 2019) (Figure 6a). No statistical differences in Ψstem were found between treatments on any measurement date.
With regard to leaf gas exchange, gs ranged between 71 mmol H2O m−2 s−1 in NM (27 DAM) and 293 mmol H2O m−2 s−1 in RH (113 and 180 DAM, respectively) (Figure 6b). During the sampling period, gs increased from spring to mid-autumn, and then decreased. An, however, presented a slightly different pattern, reaching maximum values on different dates (summer–autumn) depending on the treatment and varying from 5.10 mmol CO2 m−2 s−1 in PW (280 DAM) to 17 in RHL (113 DAM) (Figure 6c). For transpiration (Figure 6d), E was highest at 113 DAM (23 August 2019) in all treatments (6–8 mmol H2O m−2 s−1). No statistical differences in the leaf gas exchange parameters considered were found between treatments on any sampling date.
Tleaf also evolved very similarly in the various treatments over the trial (Figure 6d), showing a similar pattern to the air temperature (maximum values in summer and minimum in winter). As in the previous plant water parameters, no statistical differences among treatments were observed on any date. When comparing this parameter with the air temperature, ΔTleaf−air was negative on all the sampling dates (Supplementary Table S1), with the exception of 197 DAM (15 November 2019), when the daily air temperatures experienced a sharp decrease and the plants would not have had enough time to adapt their physiology to that circumstance, and of 421 DAM (the beginning of the second summer of the trial, 26 June 2020), when ΔTleaf−air was, averaging all the treatments, 2.22 °C. These high increments could have been the result of stomatal closure (although we do not have the corresponding gas exchange data on that date to confirm this) caused by the high ETo values reached on those days (≈7.5 mm day−1, Figure 1). This increment was significantly pronounced in NM (4.46 °C, Table S1) by also registering the lowest soil water contents (about 50% of the available water, Figure 3).
The averaged results of the plant water status across the first 180 days of the trial are shown in Table 5. The intrinsic water-use efficiency (iWUE) of leaf gas exchange was also included. In none of the parameters considered (Ψstem, gs, An, E, iWUE, and Tleaf) did the averaged data show significant differences between treatments. This was the case both when including the non-mulched control (lowercase letters) and when comparing hydromulches (capital letters). It should be noted, however, that iWUE was 15% lower in NM (2.85) than in the averaged mulch treatments (3.34), mainly as a result of the lowest An obtained.

3.2.2. Plant Growth

Figure 7 shows the evolution of the trunk diameter until the end of the trial. At the beginning, the trunk diameter at 30 cm height averaged ≈18–20 mm The highest increases took place between 21 and 118 DAM for all the hydromulches (from 0.17 mm day−1 for both RH and VW to 0.24 mm day−1 for PW), while they took place between 118 and 180 DAM for NM (0.17 mm day−1). The lowest growths were, as expected, in the winter periods. With the exception of the first date, significant differences among treatments were obtained on all the measurement dates, with the highest values corresponding to PW and the lowest to NM in all cases.
At 180 DAM (measurements taken on 10 October 2019), the maximum growth was experienced in PW (51.77 mm, representing an increase of 33.50 mm from the beginning of the experiment) and the minimum in NM (37.14 mm, which represents an increase of 20.28 mm). Among the hydromulches, the poorest growths were obtained in RH and VW. Growth in NM was 22% lower than that for the averaged hydromulches, a decrease slightly greater than those previously observed for iWUE. At the end of the trial (663 DAM), the trunk diameter ranged from 58.73 mm in NM to 78.0 mm in PW. On the final date, treatments could be divided into three groups: (i) PW, MS, RHL, and WS (≈75–78 mm); (ii) VW and RH (≈70 mm); and (iii) NM (58.73 mm, ≈23% lower than the first group).

4. Discussion

In recent years, the search for eco-friendly alternatives to the widely used polyethylene mulch is of great importance, mainly for environmental and sustainable crop purposes. Therefore, research on hydromulches composed of agricultural waste materials or by-products is of increasing interest. In this context, the present study compared the effects of hydromulches with different compositions on soil and plant parameters in young olive trees grown in large pots.
This study revealed that the hydromulches reached the highest soil water content (θ, %) throughout the trial in comparison with the non-mulched control (Table 3) and especially during the first 180 DAM (Table 2), when mulches were still intact. Although the differences among mulches were not very pronounced, they were for VW and especially PW, highlighted by the highest water contents. The lack of significant water saving in RHL by using linen oil on the surface might be explained by the possible reduction in both water evaporation from the soil and water infiltration from the rain as it acted as a barrier, leading to some possible compensatory effects. The greatest water saving achieved with the covers, despite their generally porous matrix, is in agreement with previous works [2,9,16], although in those previous studies, MS was highlighted as the hydromulch with the greatest water soil moisture conservation by delaying the process by which the liquid water was converted into vapor and removed from the surface. In this sense, a meta-analysis focusing on the effect of film-mulching drip irrigation on water saving and based on a great number of studies around the world concluded that the practice increased this parameter significantly compared with no mulching [17]. When using organic mulches, it was also observed that pistachio shell mulch seemed to be more favorable for conserving soil water in an olive trial carried out in 10 L pots [18]. Similarly, it was found that maize straw increased water saving compared with the non-mulched control, and these differences were greater when plastic mulching was used [19]. A detailed review of the effect of mulching as a water-saving technique in dryland agriculture can be found in Kader et al. [20].
Hydromulches also affected the soil temperature (Figure 4, Table 2 and Table 3), showing a damping effect, especially in PW and RH, mainly by reducing STmax in comparison with NM. Consequently, the soil temperature amplitude (STA, °C) was the highest in NM as a result both of the small differences in STmin in relation to the mulches (leading to important increases with respect to air temperature), and the greater differences in STmax in comparison with the mulches (leading to decreases less pronounced in relation to air temperature). These differences among mulches and NM were more pronounced when the materials remained intact (Table 2), decreasing the differences when the data corresponding to the whole trial were considered (Table 3) as a result of their deterioration process. Although this trial was performed in large pots (coated with reflective paper) and the substrate was confined in a certain volume; these results are, in general, in agreement with previous studies conducted with conventional plastic and biodegradable mulching films [21,22]. Those previous studies also determined that mulches decreased the fluctuations in soil temperature, especially by increasing STmin, by acting as an insulator, reducing heat conduction from the atmosphere to the soil during the day and heat loss during the night [23,24]. However, in other previous research [19,25], when using organic mulches (mainly straw mulches), soil temperature tended to decrease in comparison with non-mulched soils.
The flux of CO2 from the soil, commonly considered as soil respiration, is a very important parameter for assessing the health of an ecosystem and is directly related to microbial activity, the decomposition of organic matter, and the respiration of the root system of plants and associated mycorrhizae [26,27,28]. Thus, high rates of CO2 flux indicate intense biological activity, while low rates are indicative of the opposite due to stresses induced by inadequate soil management, climate disturbances, or limitation of resources (substrate, water, and nutrients) for biological activity [29]. The effect of soil temperature and humidity on CO2 flux has been exhaustively studied in recent years. In general, these two abiotic factors are considered to be the most influential on soil CO2 emissions as they affect the microbial activity and diversity of the microorganism community [30,31,32,33,34]. Other factors, such as soil properties (texture and apparent density), vegetation cover, the composition of plant communities, dominant vegetal species, organic matter supplies, or changes in land use can, however, also have some effect on it, as summarized by Lopera [35]. Nonetheless, the conclusions drawn from previous research differ depending on the seasonal pattern of the study area (i.e., coincidence of the driest seasons with the coolest seasons or vice versa, uniformity/heterogeneity of temperature/precipitation, etc.), factors such as the type of soil/vegetation, altitude/orography, etc., or even the methodology used, including different measurement techniques or sampling designs [32,34,35,36,37]. In our study, the soil surface CO2 fluxes reached over the seasons (Figure 5a) were similar to those reported in other studies and followed a similar pattern [35,36,37,38]. Thus, the low temperatures registered in the winter could have limited the soil biological activity, with the release of CO2 from soil biological and microbial respiration being higher at moderately high soil temperatures [39,40]. The correlations obtained between the soil CO2 fluxes, temperature, and humidity (Table 4) were in agreement with those in previous studies [31,35]; however, the lack of significance in the correlations in NM could be explained by the low soil humidity found in the upper layer of this treatment, which could have limited CO2 emissions from the soil [41]. The higher soil CO2 flux rate in the mulched treatments in comparison with the non-mulched control, mainly explained by their effect on soil temperature and moisture (and possibly by organic contributions of the mulch components), would suggest greater microbial activity and organic matter mineralization rates, which are indicative of good soil functioning. However, this could have negative effects on soil carbon storage and the emission of greenhouse gases [42]. An increase in CO2 emissions was also found in soils mulched with black polyethylene compared with non-mulched soils [43]. However, Zhao et al. [44] obtained different results, registering lower rates of CO2 fluxes with plastic mulches and different seasonal patterns of both mulched and non-mulched treatments, depending on the soil temperature and moisture. In a similar study, other authors [25], comparing common plastic film, bio-degradable film, and hay straw with a non-covered control, observed that mulching films, especially plastic film, increased the topsoil temperature and, consequently, soil CO2 fluxes.
Among plant water parameters, Ψstem is widely considered to be a good indicator for estimating the water status of the crops, because it integrates the effects of soil water content, atmospheric conditions, and cultivar on crop water status [15,45]. Several researchers have suggested that Ψstem can be used to evaluate water deficit because it is sensitive to water deficit (more negative) and correlated with other physiological variables related to gas exchange through the plant stomata, such as gs, An, and E [45,46]. Stomatal control plays a key role in leaf photosynthesis and transpiration because it regulates both CO2 and water exchange, and, therefore, the water-use efficiency [47,48,49].
Many studies have focused on more appropriate Ψstem values to maintain an adequate olive oil yield and quality depending on the cultivar [45,50,51], or to achieve proper growth for young olive trees [52,53,54]. In those studies, the Ψstem thresholds suggested were based on the relationship between Ψstem and leaf gas exchange variables (gs, An, and E). In olives, the leaves close their stomata progressively when soil water availability decreases or the evaporative demand of the atmosphere increases to decrease water loss by transpiration (E) [55,56], and also decrease CO2 diffusion into the leaf. Therefore, stomatal closure would affect An and E [45,50,52,54] and, consequently, iWUE (An/E).
Under Mediterranean conditions, Moriana et al. [50] indicated a threshold Ψstem value of −1.2 MPa before the beginning of the massive pit hardening period and −1.4 MPa after this date, with values < −4.0 MPa representing severe water stress with practically complete stomatal closure. Ahumada-Orellana et al. [45] considered a threshold Ψstem of −2.0 MPa, corresponding to a threshold gs of 0.18 mol m−2 s−1, while for Sofo et al. [54], stress in young olive trees in small pots occurred with gs < 0.20 mol m−2 s−1. However, in young olive trees, Pérez-López et al. [52] did not observe any significant stomatal closure with Ψstem > −2 MPa. In our study, Ψstem evolved accordingly with the soil water content and the atmospheric evaporation [52]. Hence, during the first summer period, the decrease registered coincided with both the soil water decrease measured during those days (Figure 3) and the higher atmospheric evaporative demand (Figure 1), while in the autumn and winter, Ψstem increased in all the treatments as soil water deficits and evaporative demand decreased.
The stomatal conductance (gs) pattern was similar to those previously reported, [50,53,57], with the highest values occurring in the summer and autumn, while transpiration (E) was clearly highest in summer, as affected, in addition to the degree of stomatal opening and the supply of water to the leaves, by the evaporative demand of the atmosphere (ETo = 6.7 mm day−1) [56]. In no case was a pronounced stomatal closure leading to the avoidance water loss through transpiration observed.
Related to the previous parameters, another physiological trait commonly used for monitoring the plant water status is leaf temperature (Tleaf) [58]: water stress closes stomata, hence decreasing transpiration and increasing leaf temperature [59,60]. However, Tleaf is affected not only by the soil water content, but also by many variables, such as the radiation level, air temperature, vapor pressure deficit, relative humidity, or the angle of the radiation incident on the leaf surface [61]. ΔTleaf−air is also indicative of the plant water status [61]; this value is generally negative in non-stressed plants (plant temperature 1–4 °C lower than ambient air temperature), most probably because of the cooling effects of transpiration [62].
In our study, it is remarkable that Tleaf and E evolved in a parallel fashion, indicating that the temperatures reached in the plants were not a result of a lower transpiration rate caused by stomatal closure, but probably the result of the air temperatures. The fact that ΔTleaf−air was negative on almost all of the sampling dates would indicate that plants did not suffer any water stress [63,64].
Despite the lower soil water content reached in the non-mulched control in comparison with the hydromulches (Figure 3, Table 2 and Table 3), only small differences were found in the plant water parameters among treatments, being more closely related to time or season. This could be explained by the fact that the soil water contents were in the range of 70% of the available soil water, as reported by Fereres and Goldhamer [65], considered as a threshold soil moisture value to affect water relations.
When considering the practically intact materials (180 DAM), only iWUE was lower in NM than in the hydromulches, which would indicate that the hydromulches used could improve the intrinsic water use efficiency, to some extent. However, differences in the vegetative growth of the olives were detected among treatments since the beginning of the trial (Figure 7, Table 5), associating the maximum trunk diameters with hydromulches and the minimum with NM. These results would support previous research showing that vegetative growth is extremely sensitive to water deficit [66], and, especially in young olive trees, it is reduced, even when no clear differences in plant water relations have been reported [52,67,68]).
Farzi et al. [18], however, observed that organic mulches, especially those based on pistachio shell and de-oiled olive pomace, substantially improved the plant water relations both in fully and deficit-irrigated olives, mainly as a result of soil water conservation. Other authors [9], when using some of the hydromulches employed in this study (MS, RH, and WS) in escarole plants grown in small pots, observed few differences in the gas exchange parameters between mulched and non-mulched treatments in fully irrigated plants, although with deficit irrigation, the MS, RH, and polyethylene (PE) plants presented significantly higher gs than the plants grown in bare soil. In a recent study, Romero-Muñoz et al. [10] attributed the highest gas exchange-related parameters in PE-mulched plants to the physical properties of this material, arguing that the impermeability of PE blocked substrate evaporation, and, consequently, the plants had to increase stomatal opening to facilitate plant water (and gas) exchange, resulting in an increase in photosynthetic activity. In our study, the treatment most similar to PE with regard to physical properties would be RHL, although the previous argument did not result in a different behavior for this treatment.

5. Conclusions

Due to environmental factors, there is currently a growing need to develop sustainable crop practices in agriculture, and under this scenario, the use of hydromulches is considered. In this study, all six tested hydromulch blends were shown to save the soil water content (especially PW and WS), which is of particular importance in semi-arid and arid regions, where water scarcity is becoming crucial. Additionally, hydromulches decreased soil temperature fluctuations and increased soil CO2 fluxes (especially PW and RH), and increased soil CO2 fluxes in comparison with the non-mulched control, suggesting greater microbial activity and organic matter mineralization rates. All these differences with respect to the control were more pronounced during the first 180 days after applying the hydromulches, while the materials remained practically intact. Despite the higher soil water content obtained under the hydromulches, no effect on the plant water relations was shown, although growth was significantly improved by the use of the mulches (especially in PW, MS, RHL, and WS).
The overall study leads to the consideration that hydromulches are a good alternative for mulching in large pots, especially those based on pistachio pruning wood chips (PW), which would be useful for nursery crops before their final planting in the field. However, further research would be deserving of attention in order to provide complementary information to these findings.

Supplementary Materials

The following supporting information can be downloaded at: https://www.mdpi.com/article/10.3390/agriculture13122211/s1, Table S1: Differences between leaf and air temperature (ΔTleaf−air, °C) for the different treatments on each sampling date.

Author Contributions

Conceptualization, M.M.M. and C.M.; Software, C.M. and J.V.; Methodology, M.M.M., J.V. and C.M.; Formal analysis, J.V., C.M. and S.G.-M.; Investigation, M.M.M. and C.M.; Data curation, J.V. and S.G.-M.; Supervision, M.M.M.; Writing-original draft, M.M.M., S.G.-M., J.V. and C.M.; Writing—review and editing, M.M.M., S.G.-M., J.V. and C.M.; Funding acquisition, M.M.M. All authors have read and agreed to the published version of the manuscript.

Funding

This research was funded by the National Institute for Agricultural and Food Research and Technology (INIA), Spanish Ministry of Economy and Competitiveness (grant number: RTA2015-00047-C05-03), Spain.

Institutional Review Board Statement

Not applicable.

Data Availability Statement

Data will be made available on request.

Acknowledgments

We are grateful to the companies that supplied the raw materials used to develop the hydromulches.

Conflicts of Interest

The authors declare no conflict of interest.

References

  1. Warnick, J.P.; Chase, C.A.; Rosskopf, E.N.; Simonne, E.H.; Scholbert, J.M.; Koenig, R.L.; Roe, N.E. Weed suppression with hydromulch, a biodegradable liquid paper mulch in development. Renew. Agric. Food Syst. 2006, 21, 216–223. [Google Scholar] [CrossRef]
  2. Claramunt, J.; Mas, M.T.; Pardo, G.; Cirujeda, A.; Verdú, A.M.C. Mechanical characterization of blends containing recycled paper pulp and other lignocellulosic materials to develop hydromulches for weed control. Biosyst. Eng. 2020, 191, 35–47. [Google Scholar] [CrossRef]
  3. Mas, M.T.; Pardo, G.; Pueyo, J.; Verdú, A.M.C.; Cirujeda, A. Can Hydromulch Reduce the Emergence of Perennial Weeds? Agronomy 2021, 11, 393. [Google Scholar] [CrossRef]
  4. Fernández, C.; Vega, J.A.; Jimenez, E.; Fonturbel, T. Effectiveness of three post-fire treatments at reducing soil erosion in Galicia (NW Spain). Int. J. Wildland Fire 2011, 20, 104–114. [Google Scholar] [CrossRef]
  5. Prats, S.A.; Malvar, M.C.; Vieira, D.C.S.; MacDonald, L.H.; Keizer, J.J. Effectiveness of hydromulching to reduce runoff and erosion in a recently burnt pine plantation in Central Portugal. Land Degrad. Dev. 2016, 27, 1319–1333. [Google Scholar] [CrossRef]
  6. Russo, V.M. Effects of planting date and spray-on mulch on yield of eggplant cultivars. J. Sustain. Agric. 1992, 3, 41–50. [Google Scholar] [CrossRef]
  7. Hogue, E.; Cline, J.; Neilsen, G.; Neilsen, D. Growth and Yield Responses to Mulches and Cover Crops under Low Potassium Conditions in Drip-irrigated Apple Orchards on Coarse Soils. HortScience 2021, 45, 1866–1871. [Google Scholar] [CrossRef]
  8. Cline, J.; Neilsen, G.; Hogue, E.; Kuchta, S.; Neilsen, D. Spray-on-mulch technology for intensively grown irrigated apple orchards: Influence on tree establishment, early yields, and soil physical properties. HortTechnology 2011, 21, 398–411. [Google Scholar] [CrossRef]
  9. Romero-Muñoz, M.; Albacete, A.; Gálvez, A.; Piñero, M.C.; Amor, F.M.D.; López-Marín, J. The Use of Ecological Hydromulching Improves Growth in Escarole (Cichorium endivia L.) Plants Subjected to Drought Stress by Fine-Tuning Cytokinins and Abscisic Acid Balance. Agronomy 2022, 12, 459. [Google Scholar] [CrossRef]
  10. Romero-Muñoz, M.; Gálvez, A.; Martínez-Melgarejo, P.A.; Piñero, M.C.; del Amor, F.M.; Albacete, A.; López-Marín, J. The Interaction between Hydromulching and Arbuscular Mycorrhiza Improves Escarole Growth and Productivity by Regulating Nutrient Uptake and Hormonal Balance. Plants 2022, 11, 2795. [Google Scholar] [CrossRef]
  11. López-Marín, J.; Romero, M.; Gálvez, A.; del Amor, F.M.; Piñero, M.C.; Brotons-Martínez, J.M. The use of hydromulching as an alternative to plastic films in an artichoke (Cynara cardunculus cv Symphony) crop: A study of the economic viability. Sustainability 2021, 13, 5313. [Google Scholar] [CrossRef]
  12. Allen, R.G.; Pereira, L.S.; Raes, D.; Smith, M. Crop Evapotranspiration. Guidelines for Computing Crop Requirements; FAO—Food and Agriculture Organization: Rome, Italy, 2006. [Google Scholar]
  13. Sainju, U.M.; Caesar-TonThat, T.; Caesar, A. Comparison of soil carbon dioxide flux measurements by static and portable chambers in various management practices. Soil Till. Res. 2012, 118, 123–131. [Google Scholar] [CrossRef]
  14. Oyonarte, C.; Rey, A.; Raimundo, J.; Miralles, I.; Escribano, P. The Use of Soil Respiration as an Ecological Indicator in Arid Ecosystems of the SE of Spain: Spatial Variability and Controlling Factors. Ecol. Indic. 2012, 14, 40–49. [Google Scholar] [CrossRef]
  15. Scholander, P.F.; Hammel, H.T.; Bradstreet, E.D.; Hemmingsen, E.A. Sap pressure in vascular plants. Science 1965, 184, 339–346. [Google Scholar] [CrossRef] [PubMed]
  16. Verdú, A.M.C.; Mas, M.T.; Josa, R.; Ginovart, M. The Effect of a Prototype Hydromulch on Soil Water Evaporation under Controlled Laboratory Conditions. J. Hydrol. Hydromech. 2020, 68, 404–410. [Google Scholar] [CrossRef]
  17. Zhang, W.; Dong, A.; Liu, F.; Niu, W.; Siddique, K.H. Effect of film mulching on crop yield and water use efficiency in drip irrigation systems: A meta-analysis. Soil Tillage Res. 2022, 221, 105392. [Google Scholar] [CrossRef]
  18. Farzi, R.; Gholami, M.; Baninasab, B.; Gheysari, M. Evaluation of different mulch materials for reducing soil surface evaporation in semi-arid region. Soil Use Manag. 2017, 33, 120–128. [Google Scholar] [CrossRef]
  19. Li, F.; Zhang, G.; Chen, J.; Song, Y.; Geng, Z.; Li, K.; Siddique, K.H.M. Straw Mulching for Enhanced Water Use Efficiency and Economic Returns from Soybean Fields in the Loess Plateau China. Sci. Rep. 2022, 12, 17111. [Google Scholar] [CrossRef]
  20. Kader, M.A.; Singha, A.; Begum, M.A.; Jewel, A.; Khan, F.H.; Khan, N.I. Mulching as Water-Saving Technique in Dryland Agriculture: Review Article. Bull. Natl. Res. Cent. 2019, 43, 147. [Google Scholar] [CrossRef]
  21. Moreno, M.M.; Cirujeda, A.; Aibar, J.; Moreno, C. Soil thermal and productive response of biodegradable mulch materials in a processing tomato (Lycopersicon esculentum Mill.) crop. Research 2016, 54, 207–215. [Google Scholar] [CrossRef]
  22. Moreno, M.M.; Moreno, A. Effect of different biodegradable and polyethylene mulches on soil properties and production in a tomato crop. Sci. Hortic. 2008, 116, 256–263. [Google Scholar] [CrossRef]
  23. Liu, Y.; Wang, J.; Liu, D.; Li, Z.; Zhang, G.; Tao, Y.; Xie, J.; Pan, J.; Chen, F. Straw mulching reduces the harmful effects of extreme hydrological and temperature conditions in citrus orchards. PLoS ONE 2014, 9, e87094. [Google Scholar] [CrossRef] [PubMed]
  24. Zhao, Y.; Mao, X.M.; Shukla, M.K. A modified SWAP model for soil water and heat dynamics and seed–maize growth under film mulching. Agric. For. Meteorol. 2020, 292–293, 108127. [Google Scholar] [CrossRef]
  25. Fan, M.; Li, Q.; Zhang, E.; Liu, Q.; Wang, Q. Effects of mulching on soil CO2 fluxes, hay yield and nutritional yield in a forage maize field in Northwest China. Sci. Rep. 2019, 9, 14186. [Google Scholar] [CrossRef] [PubMed]
  26. Guerrero-Ortíz, P.L.; Quintero-Lizaola, R.; Espinoza-Hernández, V.; Benedicto-Valdés, G.S.; Sánchez-Colín, M.J. Respiration of CO2 as an indicator of microbial activity in organic fertilizers of Lupinus. Terra Latinoam. 2012, 30, 355–362. [Google Scholar]
  27. Yáñez-Díaz, M.I.; Cantú-Silva, I.; González-Rodríguez, H.; Marmolejo-Monsiváis, J.G.; Jurado, E.; Gómez-Meza, M.V. Soil respiration in four land use systems. Rev. Mex. Cienc. For. 2017, 8, 123–149. [Google Scholar]
  28. Ayala Niño, F.; Maya Delgado, Y.; Troyo Diéguez, E. Carbon storage and flux in arid soils as an environmental service: An example in northwestern Mexico. Terra Latinoam. 2018, 36, 93–104. [Google Scholar]
  29. Singh, B.K.; Bardgett, R.D.; Smith, P.; Reay, D.S. Microorganisms and climate change: Terrestrial feedbacks and mitigation options. Nat. Rev. Microbiol. 2010, 8, 779–790. [Google Scholar] [CrossRef]
  30. Frank, A.B.; Liebig, M.A.; Hanson, J.D. Soil carbon dioxide fluxes in northern semiarid grasslands. Soil Biol. Biochem. 2002, 34, 1235–1241. [Google Scholar] [CrossRef]
  31. Peng, Y.; Thomas, S.C. Soil CO2 efflux in uneven-aged managed forests: Temporal patterns following harvest and effects of edaphic heterogeneity. Plant Soil 2006, 289, 253–264. [Google Scholar] [CrossRef]
  32. Riveros-Iregui, D.A.; McGlynn, B.L.; Epstein, H.E.; Welsch, D.L. Interpretation and evaluation of combined measurement techniques for soil CO2 efflux: Discrete surface chambers and continuous soil CO2 concentration probes. J. Geophys. Res. Biogeosci. 2008, 113, G04027. [Google Scholar] [CrossRef]
  33. Maier, M.; Schack-Kirchner, H.; Hildebrand, E.E.; Schindler, D. Soil CO2 efflux vs. soil respiration: Implications for flux models. Agric. For. Meteorol. 2011, 151, 1723–1730. [Google Scholar] [CrossRef]
  34. Deb, S.; Bhadoria, P.B.S.; Mandal, B.; Rakshit, A.; Singh, A.B. Soil organic carbon: Towards better soil health, productivity and climate change mitigation. Clim. Chang. Environ. Sustain. 2015, 3, 26–34. [Google Scholar] [CrossRef]
  35. Lopera, M.C. Soil CO2 flux under different land-cover types in the Reserva Forestal Protectora Bosque Oriental of Bogotá. Rev. Acad. Colomb. Cienc. Exactas Fis. Nat. 2019, 43, 234–240. [Google Scholar] [CrossRef]
  36. Álvaro-Fuentes, J.; López, M.V.; Arrúe, J.L.; Cantero-Martínez, C. Management effects on soil carbondioxide fluxes under semiarid Mediterranean conditions. Soil Sci. Soc. Am. J. 2008, 72, 194–200. [Google Scholar] [CrossRef]
  37. Zheng, P.; Wang, D.; Yu, X.; Jia, G.; Liu, Z.; Wang, Y.; Zhang, Y. Effects of drought and rainfall events on soil autotrophic respiration and heterotrophic respiration. Agric. Ecosyst. Environ. 2021, 308, 107267. [Google Scholar] [CrossRef]
  38. Liu, Y.; Yang, J.; Ning, K.; Wang, A.; Wang, Q.; Wang, X.; Wang, S.; Lv, Z.; Zhao, Y.; Yu, J. Temperature sensitivity of anaerobic CO2 production in soils of Phragmites australis marshes with distinct hydrological characteristics in the Yellow River estuary. Ecol. Ind. 2021, 124, 107409. [Google Scholar] [CrossRef]
  39. Follett, R.F. CRP and microbial biomass dynamics in temperate climates. In Management of Carbon Sequestration in Soil, 1st ed.; Lal, R., Ed.; CRC Press: Boca Raton, FL, USA, 1997; pp. 305–322. [Google Scholar]
  40. Bijracharya, R.M.; Lal, R.; Kimble, J.M. Diurnal and seasonal CO2-C flux from soil as related to erosion phases in Central Ohio. Soil Sci. Soc. Am. J. 2000, 64, 286–293. [Google Scholar] [CrossRef]
  41. Luo, Y.; Zhou, X. Soil Respiration and the Environment; Academic Press—Elsevier, Inc.: Cambridge, MA, USA, 2006; 316p. [Google Scholar]
  42. Zhang, F.; Li, M.; Qi, J.H.; Li, F.M.; Sun, G.J. Plastic film mulching increases soil respiration in ridge-furrow maize management. Arid Land Res. Manag. 2015, 29, 432–453. [Google Scholar] [CrossRef]
  43. Yu, Y.; Zhao, C.; Stahr, K.; Zhao, X.; Jia, H. Plastic mulching increased soil CO2 concentration and emissions from an oasis cotton field in Central Asia. Soil Use Manag. 2016, 32, 230–239. [Google Scholar] [CrossRef]
  44. Zhao, Z.; Shi, F.; Guan, F. Effects of plastic mulching on soil CO2 efflux in a cotton field in northwestern China. Sci. Rep. 2022, 12, 4969. [Google Scholar] [CrossRef] [PubMed]
  45. Ahumada-Orellana, L.; Ortega-Farias, S.; Poblete-Echeverría, C.; Searles, P.S. Estimation of stomatal conductance and stem water potential threshold values for water stress in olive trees (cv Arbequina). Irrig. Sci. 2019, 37, 461–467. [Google Scholar] [CrossRef]
  46. Ben-Gal, A.; Kool, D.; Agam, N.; van Halsema, G.E.; Yermiyahu, U.; Yafe, A.; Presnov, E.; Erel, R.; Majdop, A.; Zipori, I.; et al. Whole-tree water balance and indicators for short-term drought stress in non-bearing “Barnea” olives. Agric. Water Manag. 2010, 98, 124–133. [Google Scholar] [CrossRef]
  47. Damour, G.; Simonneau, T.; Cochard, H.; Urban, L. An overview of models of stomatal conductance at the leaf level. Plant Cell Environ. 2010, 33, 1419–1438. [Google Scholar] [CrossRef] [PubMed]
  48. Urban, J.; Ingwers, M.; McGuire, M.A.; Teskey, R.O. Increase in leaf temperature opens stomata and decouples net photosynthesis from stomatal conductance in Pinus taeda and Populus deltoides × nigra. J. Exp. Bot. 2017, 68, 1757–1767. [Google Scholar] [CrossRef] [PubMed]
  49. Urban, J.; Ingwers, M.; McGuire, M.A.; Teskey, R.O. Stomatal conductance increases with rising temperature. Plant Signal. Behav. 2017, 12, e1356534. [Google Scholar] [CrossRef] [PubMed]
  50. Moriana, A.; Villalobos, F.J.; Fereres, E. Stomatal and photosynthetic responses of olive (Olea europaea L.) leaves to water deficits. Plant Cell Environ. 2002, 25, 395–405. [Google Scholar] [CrossRef]
  51. Sánchez-Piñero, M.; Corell, M.; Moriana, A.; Castro-Valdecantos, P.; Martin-Palomo, M.J. Managing Water stress in olive (Olea europaea L.) orchards using reference equations for midday stem water potential. Horticulturae 2023, 9, 563. [Google Scholar] [CrossRef]
  52. Pérez-López, D.; Ribas, F.; Moriana, A.; Olmedilla, N.; De Juan, A. The effect of irrigation schedules on the water relations and growth of a young olive (Olea europaea L.) orchard. Agric. Water Manag. 2007, 89, 297–304. [Google Scholar] [CrossRef]
  53. Gómez del Campo, M.; Leal, A.; Pezuela, C. Relationship of stem water potential and leaf conductance to vegetative growth of young olive trees in a hedgerow orchard. Aust. J. Agric. Res. 2008, 59, 270–279. [Google Scholar] [CrossRef]
  54. Sofo, A.; Dichio, B.; Montanaro, G.; Xiloyannis, C. Shade effect on photosynthesis and photoinhibition in olive during drought and rewatering. Agric. Water Manag. 2009, 96, 1201–1206. [Google Scholar] [CrossRef]
  55. Moriana, A.; Pérez-López, D.; Prieto, M.H.; Ramírez-Santa-Pau, M.; Pérez-Rodriguez, J.M. Midday stem water potential as a useful tool for estimating irrigation requirements in olive trees. Agric. Water Manag. 2012, 112, 43–54. [Google Scholar] [CrossRef]
  56. Hernandez-Santana, V.; Fernández, J.E.; Rodriguez-Dominguez, C.M.; Romero, R.; Diaz-Espejo, A. The dynamics of radial sap flux density reflects changes in stomatal conductance in response to soil and air water deficit. Agric. For. Meteorol. 2016, 218–219, 92–101. [Google Scholar] [CrossRef]
  57. Tuzet, A.J. Stomatal Conductance, Photosynthesis, and Transpiration, Modeling. In Encyclopedia of Agrophysics; Gliński, J., Horabik, J., Lipiec, J., Eds.; Encyclopedia of Earth Sciences Series; Springer: Dordrecht, The Netherlands, 2011; pp. 855–858. [Google Scholar]
  58. Jimenez-Bello, M.A.; Ballester, C.; Castel, J.R.; Intrigliolo, D.S. Development and validation of an automatic thermal imaging process for assessing plant water status. Agric. Water Manag. 2011, 98, 1497–1504. [Google Scholar] [CrossRef]
  59. Sdoodee, S.; Kaewkong, P. Use of an infrared thermometer for assessment of plant water stress in neck orange (Citrus reticulata Blanco). Songklanakarin J. Sci. Technol. 2006, 28, 1161–1167. [Google Scholar]
  60. Blonquist, J.M., Jr.; Norman, J.M.; Bugbee, B. Automated measurement of canopy stomatal conductance based on infrared temperature. Agric. For. Meteorol. 2009, 149, 1931–1945. [Google Scholar] [CrossRef]
  61. Jones, H.G.; Serraj, R.; Loveys, B.R.; Xiong, L.; Wheaton, A.; Price, A.H. Thermal infrared imaging of crop canopies for the remote diagnosis and quantification of plant responses to water stress in the field. Funct. Plant Biol. 2009, 36, 97. [Google Scholar] [CrossRef]
  62. Jackson, R.D. Canopy temperature and crop water stress. In Advances in Irrigation; Daniel, H., Ed.; Elsevier: New York, NY, USA, 1982; Volume 1, pp. 43–85. [Google Scholar]
  63. García-Tejero, I.F.; Hernández, A.; Padilla-Díaz, C.M.; Diaz-Espejo, A.; Fernández, J.E. Assessing plant water status in a hedgerow olive orchard from thermography at plant level. Agric. Water Manag. 2017, 188, 50–60. [Google Scholar] [CrossRef]
  64. Camoglu, G. The effects of water stress on evapotranspiration and leaf temperatures of two olive (Olea europaea L.) cultivars. Zemdirbyste 2013, 100, 91–98. [Google Scholar] [CrossRef]
  65. Fereres, E.; Goldhamer, D.A. Deciduous fruit and nut trees. In Irrigation of Agricultural Crops; Steward, B.A., Nielsen, D.R., Eds.; American Society of Agronomy: Madison, WI, USA, 1990; pp. 987–1017. [Google Scholar]
  66. Hsiao, T.C. Measurements of plant water status. In Irrigation of Agricultural Crops; Steward, B.A., Nielsen, D.R., Eds.; American Society of Agronomy: Madison, WI, USA, 1990; Volume 9, pp. 243–279. [Google Scholar]
  67. Moriana, A.; Orgaz, F.; Pastor, M.; Fereres, E. Yield responses of a mature olive orchard to water deficits. J. Am. Soc. Hortic. Sci. 2003, 128, 425–431. [Google Scholar] [CrossRef]
  68. Correa-Tedesco, G.; Rousseaux, M.C.; Searles, P.S. Plant growth and yield responses in olive (Olea europaea) to different irrigation levels in an arid region of Argentina. Agric. Water Manag. 2010, 97, 1829–1837. [Google Scholar] [CrossRef]
Figure 1. Evolution of air temperature (mean, Tmean; maximum, Tmax; minimum, Tmin), rainfall, and reference evapotranspiration (ETo) throughout the experimental trial in Ciudad Real (Spain).
Agriculture 13 02211 g001
Figure 2. Constituent materials of the hydromulches: (a) rice husk (RH); (b) mushroom substrate (MS); (c) wheat straw (WS); (d) pistachio pruning wood chips; (e) vineyard pruning wood chips; (f) recycled paper paste; (g) Kraft fiber; (h) gypsum; (i) linen oil.
Agriculture 13 02211 g002
Figure 3. Pattern of volumetric soil water content (θ, %) throughout the trial: (a) 0–10 cm; (b) 10–20 cm; (c) 20–30 cm; (d) 30–40 cm; (e) 0–40 cm. Treatments: rice husk (RH), rice with linen oil (RHL), mushroom substrate (MS), wheat straw (WS), pistachio pruning wood chip (PW), vineyard pruning wood chip (VW), and non-mulched control (NM). Each treatment corresponds to the average of five measurements. Horizontal lines represent the field capacity (upper) and permanent wilting point (lower) of the soil. Arrows indicate the irrigation periods. DAM: days after mulching.
Agriculture 13 02211 g003
Figure 4. Pattern of soil temperature (5 cm depth) and air temperature (°C) throughout the trial: (a) maximum (STmax); (b) minimum (STmin); (c) mean (STmean). Treatments: rice husk (RH), rice with linen oil (RHL), mushroom substrate (MS), wheat straw (WS), pistachio pruning wood chip (PW), vineyard pruning wood chip (VW), and non-mulched control (NM). Each treatment corresponds to the average of five measurements. DAM: days after mulching.
Agriculture 13 02211 g004
Figure 5. Pattern of soil parameters throughout the trial: (a) soil CO2 flux (g CO2 m−2 h−1); (b) soil temperature (°C) at 5 cm depth; (c) volumetric soil water content (%) at 5 cm depth. In all figures, the air temperature (°C) registered during the measurements is included. Treatments: rice husk (RH), rice with linen oil (RHL), mushroom substrate (MS), wheat straw (WS), pistachio pruning wood chip (PW), vineyard pruning wood chip (VW), and non-mulched control (NM). Each point corresponds to the average of five measurements. Vertical bars represent the standard deviation. * indicates significant differences among treatments (ANOVA and Duncan test, α = 0.05). DAM: Days after mulching.
Agriculture 13 02211 g005
Figure 6. Pattern of plant parameters throughout the trial: (a) midday stem water potential (Ψstem); (b) stomatal conductance to water vapor (gs); (c) net assimilation rate (An); (d) transpiration (E); (e) leaf temperature (Tleaf). Treatments: rice husk (RH), rice with linen oil (RHL), mushroom substrate (MS), wheat straw (WS), pistachio pruning wood chip (PW), vineyard pruning wood chip (VW), and non-mulched control (NM). Each point corresponds to the average of five measurements. Vertical bars represent the standard deviation. DAM: Days after mulching.
Agriculture 13 02211 g006
Figure 7. Pattern of trunk diameter (mm) over the course of the trial. Treatments: rice husk (RH), rice with linen oil (RHL), mushroom substrate (MS), wheat straw (WS), pistachio pruning wood chip (PW), vineyard pruning wood chip (VW), and non-mulched control (NM). Each point corresponds to the average of five measurements. Vertical bars represent the standard deviation. * indicates significant differences among treatments (ANOVA and Duncan test, α = 0.05). DAM: Days after mulching.
Agriculture 13 02211 g007
Table 1. Schedule of the controls carried out during the trial (dates and the corresponding days after mulching, DAM, between brackets).
ParameterDate (Days after Mulching, DAM)
Soil water content22 May 2019 (20) to 25 March 2021 (693), 75 measurement dates in total at intervals of 4 to 15 days, depending on the season
Soil temperature2 May 2019 (0) to 25 March 2021 (693), daily data
Soil CO2 flux4 June 2019 (33), 21 July 2019 (80), 23 August 2019 (113), 9 September 2019 (130), 11 November 2019 (193), 10 February 2020, (284), 29 May 2020 (393), 6 August 2020 (462)
Midday stem water potential (Ψstem)29 May 2019 (27), 23 August 2019 (113), 29 October 2019 (180), 6 February 2020 (280)
Gas exchange parameters29 May 2019 (27), 30 July 2019 (89), 23 August 2019 (113), 29 October 2019 (180), 6 February 2020 (280)
Leaf temperature (Tleaf)30 May 2019 (28), 28 June 2019 (57), 30 July 2019 (89), 23 August 2019 (113), 9 September 2019 (130), 29 October 2019 (180), 15 November 2019 (197), 6 February 2020 (280), 20 April 2020 (354), 26 June 2020 (421), 29 July 2020 (454), 28 August 2020 (484), 9 October 2020 (526)
Trunk diameter23 May 2019 (21), 28 August 2019 (118), 10 October 2019 (161), 4 February 2020 (278), 2 July 2020 (427), 20 November 2020 (568), 24 February 2021 (664)
Table 2. Effect of hydromulches and non-mulched control on soil parameters during the first 180 days after mulching: volumetric soil water content (θ); soil temperature: maximum (STmax), minimum (STmin), mean (STmean), and amplitude (STA); soil CO2 flux. Mean values ± standard deviation.
Treatment 1θ
(%)
STmax
(°C)
STmin
(°C)
STmean
(°C)
STA
(°C)
CO2 Flux
(g CO2 m−2 h−1)
RH24.4 ± 3.90 aA25.60 ± 0.58 bcAB20.46 ± 0.79 aA23.04 ± 0.25 abA5.14 ± 1.21 bB0.92 ± 0.29 aA
RHL23.6 ± 2.33 aA26.47 ± 0.90 bA20.05 ± 0.55 abAB23.14 ± 0.23 abA6.42 ± 1.49 abAB0.78 ± 0.17 aA
MS23.9 ± 1.84 aA26.43 ± 0.59 bA18.93 ± 0.89 cB22.69 ± 0.38 bcAB7.50 ± 1.75 abA0.94 ± 0.23 aA
WS24.3 ± 2.99 aA25.26 ± 0.40 cB19.42 ± 0.91 bcAB22.31 ± 0.27 cB5.85 ± 1.27 abAB0.88 ± 0.12 aA
PW25.4 ± 3.90 aA25.22 ± 0.18 cB20.22 ± 0.38 abAB22.72 ± 0.20 bcAB4.99 ± 1.24 bB0.89 ± 0.16 aA
VW24.5 ± 5.23 aA26.11 ± 0.91 bAB20.04 ± 1.03 abAB23.08 ± 0.69 abA6.07 ± 1.70 abAB0.94 ± 0.19 aA
NM19.2 ± 1.63 b28.80 ± 0.78 a20.28 ± 0.71 ab24.58 ± 0.10 a8.53 ± 1.48 a0.40 ± 0.12 b
Air Tmax (°C)
29.71
Air Tmin (°C)
11.93
Air Tmean (°C)
21.18
Air STA (°C)
17.79
1 Rice husk (RH), rice with linen oil (RHL), mushroom substrate (MS), wheat straw (WS), pistachio pruning wood chip (PW), vineyard pruning wood chip (VW), non-mulched control (NM). Different lowercase letters in the same column indicate significant differences between treatments (ANOVA and Duncan test, α = 0.05); capital letters, excluding NM.
Table 3. Effect of hydromulches and non-mulched control on soil parameters during the trial (693 days after mulching): volumetric soil water content (θ); soil temperature: maximum (STmax), minimum (STmin), mean (STmean), and amplitude (STA); soil CO2 flux. Mean values ± standard deviation.
Treatment 1θ
(%)
STmax
(°C)
STmin
(°C)
STmean
(°C)
STA
(°C)
CO2 flux
(g CO2 m−2 h−1)
RH22.5 ± 2.70 aA18.55 ± 0.60 bcAB14.19 ± 0.75 aA16.34 ± 0.35 abA4.36 ± 1.21 bB0.79 ± 0.25 aA
RHL22.4 ± 2.10 aA18.99 ± 50.8 bA13.86 ± 0.39 abAB16.32 ± 0.28 abA5.13 ± 1.49 abAB0.74 ± 0.23 aA
MS22.3 ± 1.75 aA19.03 ± 0.63 bA13.10 ± 0.78 bB16.06 ± 0.40 bcAB5.94 ± 1.75 abA0.84 ± 0.23 aA
WS22.8 ± 2.23 aA18.50 ± 0.45 bcAB13.02 ± 0.82 bB15.65 ± 0.25 cB5.48 ± 1.27 abAB0.82 ± 0.19 aA
PW23.9 ± 3.75 aA18.27 ± 0.28 cB14.04 ± 0.45 abAB16.10 ± 0.22 bcAB4.23 ± 1.24 bB0.80 ± 0.31 aA
VW23.5 ± 3.89 aA18.58 ± 0.83 bAB13.90 ± 1.08 abAB16.21 ± 0.55 abA4.68 ± 1.70 abAB0.82 ± 0.24 aA
NM19.5 ± 1.78 b19.95 ± 0.81 a13.82 ± 0.66 ab16.92 ± 0.12 a6.13 ± 1.48 a0.49 ± 0.16 b
Air Tmax (°C)
22.27
Air Tmin (°C)
7.44
Air Tmean (°C)
14.87
Air STA (°C)
14.83
1 Rice husk (RH), rice with linen oil (RHL), mushroom substrate (MS), wheat straw (WS), pistachio pruning wood chip (PW), vineyard pruning wood chip (VW), non-mulched control (NM). Different lowercase letters in the same column indicate significant differences between treatments (ANOVA and Duncan test, α = 0.05); capital letters, excluding NM.
Table 4. Correlations between the soil CO2 flux and the soil water content, soil temperature, and air temperature values registered during the CO2 flux measurements (Pearson’s correlation coefficients) (a) considering all treatments (n = 280); (b) excluding the non-mulched treatment (NM) (n = 240).
Soil CO2 Flux
(g CO2 m−2 h−1)
Soil Temperature
(°C)
Soil Water Content
(%)
Soil temperature (°C)0.61 *
(a)Soil water content (%)−0.48 *−0.82 *
Air temperature (°C)0.64 *0.99 *−0.84 *
Soil temperature (°C)0.72 *
(b)Soil water content (%)−0.66 *−0.83 *
Air temperature (°C)0.72 *0.99 *−0.87 *
* Correlations significant at α = 0.05.
Table 5. Effect of hydromulches and non-mulched control on plant–water relation variables during the first 180 days after mulching: midday stem water potential (Ψstem), stomatal conductance to water vapor (gs), net assimilation rate (An), transpiration (E), intrinsic water use efficiency (iWUE), and leaf temperature (Tleaf). Mean values ± standard deviation.
Treatment 1Midday Ψstem
(MPa)
gs
(mmol H2O m−2 s−1)
An
(µmol CO2 m−2 s−1)
E
(mmol H2O m−2 s−1)
iWUE
(An/E)
Tleaf
(°C)
RH−0.93 ± 0.18 aA233.16 ± 70.55 aA13.45 ± 4.71 aA4.95 ± 1.18 aA3.23 ± 1.01 aA22.31 ± 0.68 aA
RHL−0.94 ± 0.19 aA197.69 ± 44.80 aA13.30 ± 2.68 aA4.39 ± 0.72 aA3.32 ± 0.60 aA23.27 ± 1.06 aA
MS−0.87 ± 0.20 aA187.66 ± 69.47 aA13.49 ± 3.70 aA4.22 ± 1.16 aA3.58 ± 0.92 aA22.79 ± 0.86 aA
WS−0.92 ± 0.17 aA189.95 ± 48.21 aA13.41 ± 3.00 aA4.51 ± 0.82 aA3.36 ± 0.78 aA23.69 ± 0.87 aA
PW−0.94 ± 0.18 aA199.88 ± 35.27 aA13.08 ± 1.80 aA4.34 ± 0.48 aA3.46 ± 0.68 aA23.58 ± 0.75 aA
VW−0.91 ± 0.17 aA197.63 ± 238.65 aA12.98 ± 2.78 aA4.45 ± 0.57 aA3.10 ± 0.50 aA23.49 ± 0.59 aA
NM−0.91 ± 0.18 a189.71 ± 44.58 a11.10 ± 2.15 a4.27 ± 0.58 a2.85 ± 0.57 a23.20 ± 0.64 a
1 Rice husk (RH), rice with linen oil (RHL), mushroom substrate (MS), wheat straw (WS), pistachio pruning wood chip (PW), vineyard pruning wood chip (VW), and non-mulched control (NM). Different lowercase letters in the same column indicate significant differences between treatments (ANOVA and Duncan test, α = 0.05); capital letters, excluding NM.
Disclaimer/Publisher’s Note: The statements, opinions and data contained in all publications are solely those of the individual author(s) and contributor(s) and not of MDPI and/or the editor(s). MDPI and/or the editor(s) disclaim responsibility for any injury to people or property resulting from any ideas, methods, instructions or products referred to in the content.

