Article

Easily Pyrolyzable Biomass Components Significantly Affect the Physicochemical Properties and Water-Holding Capacity of the Pyrolyzed Biochar

1
State Key Laboratory of Desert and Oasis Ecology, Key Laboratory of Ecological Safety and Sustainable Development in Arid Lands, Xinjiang Institute of Ecology and Geography, Chinese Academy of Sciences, Urumqi 830011, China
2
Research Center for Ecology and Environment of Central Asia, Chinese Academy of Sciences, Urumqi 830011, China
3
University of Chinese Academy of Sciences, Beijing 100049, China
4
College of Ecology and Environment, Xinjiang University, Urumqi 830017, China
5
College of Resources and Environment, Xinjiang Agricultural University, Urumqi 830052, China
*
Author to whom correspondence should be addressed.
Agriculture 2023, 13(11), 2053; https://doi.org/10.3390/agriculture13112053
Submission received: 2 September 2023 / Revised: 13 October 2023 / Accepted: 23 October 2023 / Published: 26 October 2023
(This article belongs to the Special Issue Improved Sustainable Agriculture Using Biochar as a Soil Amendment)

Abstract

:
The influences of feedstocks on biochar properties are widely reported. However, the influence of the transformation of biomass components (mainly cellulose, hemicellulose, and lignin) during feedstock pyrolysis on the obtained biochar has not been clearly stated. Here, biochar was pyrolyzed from four biomass types with different fractions of the three main components, of which surface area, pore structure, functional group, and thermogravimetric analyses were conducted. Further, we investigated the links among the physicochemical properties and water-holding capacity (WHC) of the biochar by measuring the WHC of a biochar–silica-sand (SS) mixture. Cellulose and hemicellulose were considered the easily pyrolyzable components of the feedstock owing to their low thermal stabilities. Additionally, the thermal decomposition of the easily pyrolyzable components caused the disappearance of most functional groups from the biochar that was synthesized at >350 °C. Moreover, the WHC of the biochar–SS mixture correlated significantly with the surface area and pore volumes of the biochar. Notably, the thermal residual mass and the WHC of the biochar–SS mixture exhibited the strongest correlation. Poplar wood sawdust (PT), which accounted for the highest mesopore volume of the biochar sample, contained the highest amount (86.09%) of the easily pyrolyzable components. The PT-derived biochar exhibited superior WHC than other biochar types, indicating that the dehydration, deoxygenation, and condensation of the easily pyrolyzable components of biomasses promoted gradual pore formation, further contributing to the increased WHC of the mixture. Rather than high-temperature-pyrolyzed biochar, PT350 demonstrated the highest WHC (599 mg/g), revealing that attention should be drawn to the contribution of low-temperature-pyrolyzed biochar to soil water retention in future research.

Graphical Abstract

1. Introduction

Biochar is a sustainable soil amendment derived from agricultural and forestry waste [1,2,3]. As a recalcitrant carbon-rich material, biochar is obtained by biomass pyrolysis in the range of 250–700 °C in the presence of limited oxygen [4,5,6]. Biochar exhibits abundant surface functional groups and pore structures, which are conventionally used to improve soil nutrients, increase water retention, and enhance crop yield [7]. Owing to the abundant pores in biochar, it can be used to improve soil porosity, reduce soil compaction, and decrease soil bulk density [8]; moreover, the pores can store water and improve soil moisture [9]. Therefore, the development and utilization of biochar as a soil water-retaining agent is underway in agricultural management [10,11,12,13].
Biochar exhibits multiple advantages and application prospects in agricultural productivity and environmental protection. First, pore-rich biochar improves soil porosity by increasing the water-holding capacity (WHC) of soils [9,14]. As an important hydraulic property of the soil, soil WHC represents the quality of soil that is closely related to plant-available water that determines plant growth. Second, biochar accelerates the formation of soil aggregates, increasing the soil pore volume [8] and indirectly improving the hydrological properties of the soil. Compared with other water-retaining agents (e.g., potassium polyacrylate, polyaspartic acid hydrogel) [15], biochar is more stable owing to its aromatic structure [16]. Notably, the WHC of biochar is greatly affected by its pore structures and surface functional groups [17]. Generally, the higher the pore volume of biochar, the higher its water-adsorbing capacity [12]. With the same biochar pore volume, the water-absorption capacity of large-pore biochar is higher than that of small-pore biochar suggesting the pore size also affects the WHC of biochar [18]. Moreover, the functional groups in biochar account for the differences in its surface water-binding ability, which affects biochar WHC [12,19]. It was found that the number of carboxyl groups in biochar correlates positively with its water-adsorption capacity [19]. The hydroxyl groups of biochar attract water molecules by weak intermolecular forces to retain water [20], whereas its aliphatic groups affect its water-absorption capacity owing to its increased hydrophobicity [12]. As the pore structure and functional groups of biochar are associated with its WHC, most extant studies focus on investigating the feedstock and pyrolysis temperature affecting biochar physicochemical properties. An increase in the pyrolysis temperature increases the pore volume and surface area of biochar [21,22], and reduces its functional group abundance [23,24]. Additionally, a low-density feedstock would exhibit higher WHC than a high-density one. As a low-density feedstock exhibits a larger fiber diameter and thinner fiber wall, it gains more pores during pyrolysis [16]. Additionally, the functional groups of biochar also vary with different feedstocks. Gezahegn et al. (2019) observed that coniferous-derived biochar produced at <500 °C exhibited more carboxyl functional groups than angiosperm-derived biochar [25]. However, the molecular-level effects of the feedstock and pyrolysis temperature of biochar on its pore structure and functional groups still require clarification, as this would elucidate the relationship between the physicochemical properties and WHC of biochar.
Considering the complex molecular structures in biomass, cellulose, hemicellulose, and lignin represent the three main components of the agricultural and forestry waste [26], accounting for 10–25, 40–60, and 20–40 weight percent (wt.%) of biomass, respectively [27]. Cellulose is a linear polymer in which glucose molecules are bound by ether bonds. Hemicellulose is composed of various amorphous sugars (mainly xylose and mannose). Further, lignin is a three-dimensional complex that is formed by the disordered polymerization of hydroxy- or methoxy-substituted phenylpropane monomers. These three components exhibit the following thermal stabilities in ascending order: hemicellulose < cellulose < lignin [1]. The main decomposition temperature of hemicellulose during pyrolysis is in the 220–315 °C range, and its maximum mass loss occurs at 268 °C and a rate of 0.95 wt.%/°C. The decomposition of cellulose occurs at 315–400 °C, and its maximum loss (6.5 wt.%/°C) is at 355 °C. Although lignin can decompose gradually from room temperature to 900 °C, the mass loss rate is relatively low (<0.14 wt.%/°C) [27]. Thus, compared with lignin, cellulose and hemicellulose are considered the easily pyrolyzable components of biomasses. Generally, the volatile fractions of biomass are released during pyrolysis. For instance, gases and tar are released to form micropores due to the depolymerization of hemicellulose and cellulose during pyrolysis [28,29,30]. Therefore, the pyrolysis of hemicellulose and cellulose in a feedstock determines the pore structure of the resultant biochar [22,31]. In addition to the physical structure, the chemical properties of biochar (e.g., functional groups) are influenced by the pyrolysis of its easily pyrolyzable components [32]. Particularly, cellulose contains the most abundant functional groups, O–H and C–O; hemicellulose is dominated by C=O; and lignin contains an abundance of methoxyl–O–CH3, C–O–C, and C=C [1]. The pores and functional groups formed by the three components during pyrolysis may cause differences in the physicochemical properties of biochar, which may also determine the water retention of biochar. Thus, understanding the links between the biomass properties and WHC of biochar would ensure the selection of more suitable and effective biochar feedstocks for the different applications of biochar in soil water management. Moreover, such an understanding would maximize the applications of biochar in agriculture in arid and semi-arid regions, as it is easier to investigate the potential of biochar WHC by analyzing biomass properties.
Although the effect of biochar addition on soil WHC has been investigated, the mechanism of the effects of these components on biochar WHC still requires further investigation. Therefore, by focusing on the three main components of biochar (cellulose, hemicellulose, and lignin), particularly the easily pyrolyzable components (cellulose and hemicellulose), this study was aimed at comparing the chemical composition and structural characteristics of different-temperature-pyrolyzed biochar from a variety of feedstocks. Thereafter, the changes in the three components during the pyrolysis, which affect the pore structures and functional groups of biochar, were investigated. Overall, biochar–silica-sand (SS) mixtures were used to explore the possible relevance of the thermal transformations of the three components to biochar WHC. This would provide data for bridging the knowledge gap regarding the mechanism through which the pyrolysis temperature and feedstock determine the characteristics of biochar pores and functional groups.

2. Material and Methods

2.1. Preparation of the Biochar Sample

To distinguish the contents of the three main components (lignin, cellulose, and hemicellulose) of biochar, we selected the following four biomass types as the feedstocks for biochar preparation: poplar wood sawdust (PT), pinewood sawdust (PS), cotton stalk (CS), and wheat straw (WS). These biomasses were dried in an oven for 6 h at 65 °C and ground by passing through a 0.15 mm sieve. Each sieved biomass was added to a 50 mL crucible, which was compressed as much as possible to exclude the air in the crucible. The biomass-filled crucible was sealed by a lid, after which it was placed in a muffle furnace (Figure S1). The biomass was pyrolyzed in the muffle furnace at a laboratory scale using target temperatures of 250 °C, 350 °C, 450 °C, 550 °C, and 650 °C for 6 h at a heating rate of 5 °C/min [13]. The biochars were labeled based on the feedstock type and pyrolytic temperature (e.g., PT250). Further, the biochar yield (Equation (1)) was calculated by comparing the weight loss of biomass during pyrolysis:
Y = G 1 G 2 G 1 G × 100 %
where Y and G denote the biochar yield and crucible weight, respectively, and G1 and G2 are the total masses of the crucible and biomass before and after the pyrolysis, respectively.

2.2. Characterizations of the Biomass and Biochar

The cellulose, hemicellulose, and lignin contents of the biomasses were measured by a fiber analyzer (ANKOM-A2000i, Macedon, NY, USA) [33]. The ash content of the biochar was determined by weighing the residuals after pyrolyzing biochar at 800 °C for 4 h [13]. The thermogravimetric (TG) characterizations of the biomass and biochar were performed on a TG analyzer (NETZSCH STA 449 F3, Selbu, Germany) under an N2 purge from room temperature to 800 °C at a heating rate of 10 °C/s.
The surface structures of biochar were characterized by a surface area and pore size analyzer (QUANTACHROME NOVA2000e, Omaha, NE, USA) to measure the specific surface area (SA) as well as the mesopore and micropore pore volumes of the biochar. Following the IUPAC convention, the <2 and 2–50 nm pores of the biochar were classified as micropores and mesopores, respectively [34]. The elemental contents of the biochar, i.e., C, H, and N, were measured by an elemental analyzer (Elementar-vario micro cube, Halle, Germany), and the elemental content of O was determined by the differences and corrected by the ash content. The surface functional groups of biochar were measured by Fourier-transform infrared spectroscopy (FTIR) (Thermo Fisher Scientific-Nicolet 6700, Waltham, MA, USA) in a 400–4000 cm−1 wavelength range and at a scanning frequency of 2 cm−1.

2.3. Measurement of the Water-Holding Capacity of Biochar-SS Mixture

The WHC of the biochar–SS mixture was measured to investigate the links between the physicochemical properties and WHC of biochar [13]. Similar to biochar, SS also exhibits a porous structure, although the organo-mineral interaction at the SS surface is negligible [35]. Thus, the effects of the physical and chemical properties of different biochar types on its WHC can be considerably demonstrated. The biochar addition rates were set at 0.5%, 1%, 2%, and 5%. Each weighted biochar was mixed thoroughly with the SS. A known weight of distilled water was added to the biochar–SS mixture, after which the penetrated water was collected by a measuring cylinder. Each treatment was set with two replicates, and the WHC of the biochar–SS mixture was calculated using (Equation (2)):
WHC = T 0     ( T 1 T ) T 0 × 100 %
WHC denotes the water-holding capacity of the biochar–SS mixture, T0 is the mass of the distilled water added to the mixture, T is the mass of the measuring cylinder, and T1 is the mass of the measuring cylinder with penetrated water.

2.4. Statistical Analysis

Except for the dataset of the mesopore volume and aromaticity of biochar, the majority of datasets of biochar properties were not normally distributed. Thus, the correlations between the WHC of the biochar–SS mixture and the properties of the biochar were determined by Spearman’s analysis (IBM SPSS statistics 25).

3. Results and Discussion

3.1. Compositions of the Easily Pyrolyzable Components

Various types of feedstocks exhibit different cellulose, hemicellulose, and lignin contents. PT, WS, and PS accounted for the highest cellulose (66.13%), hemicellulose (34.51%), and lignin (38.39%) contents, respectively (Table 1). As cellulose and hemicellulose are relatively less thermally stable than lignin, the sum of both components represents the easily pyrolyzable components of biomass. Notably, the summed content of cellulose and hemicellulose in the biomass ranked from highest to lowest as PT, WS, CS, and PS. Therefore, PT and PS accounted for the most and least abundant easily pyrolyzable components, respectively.

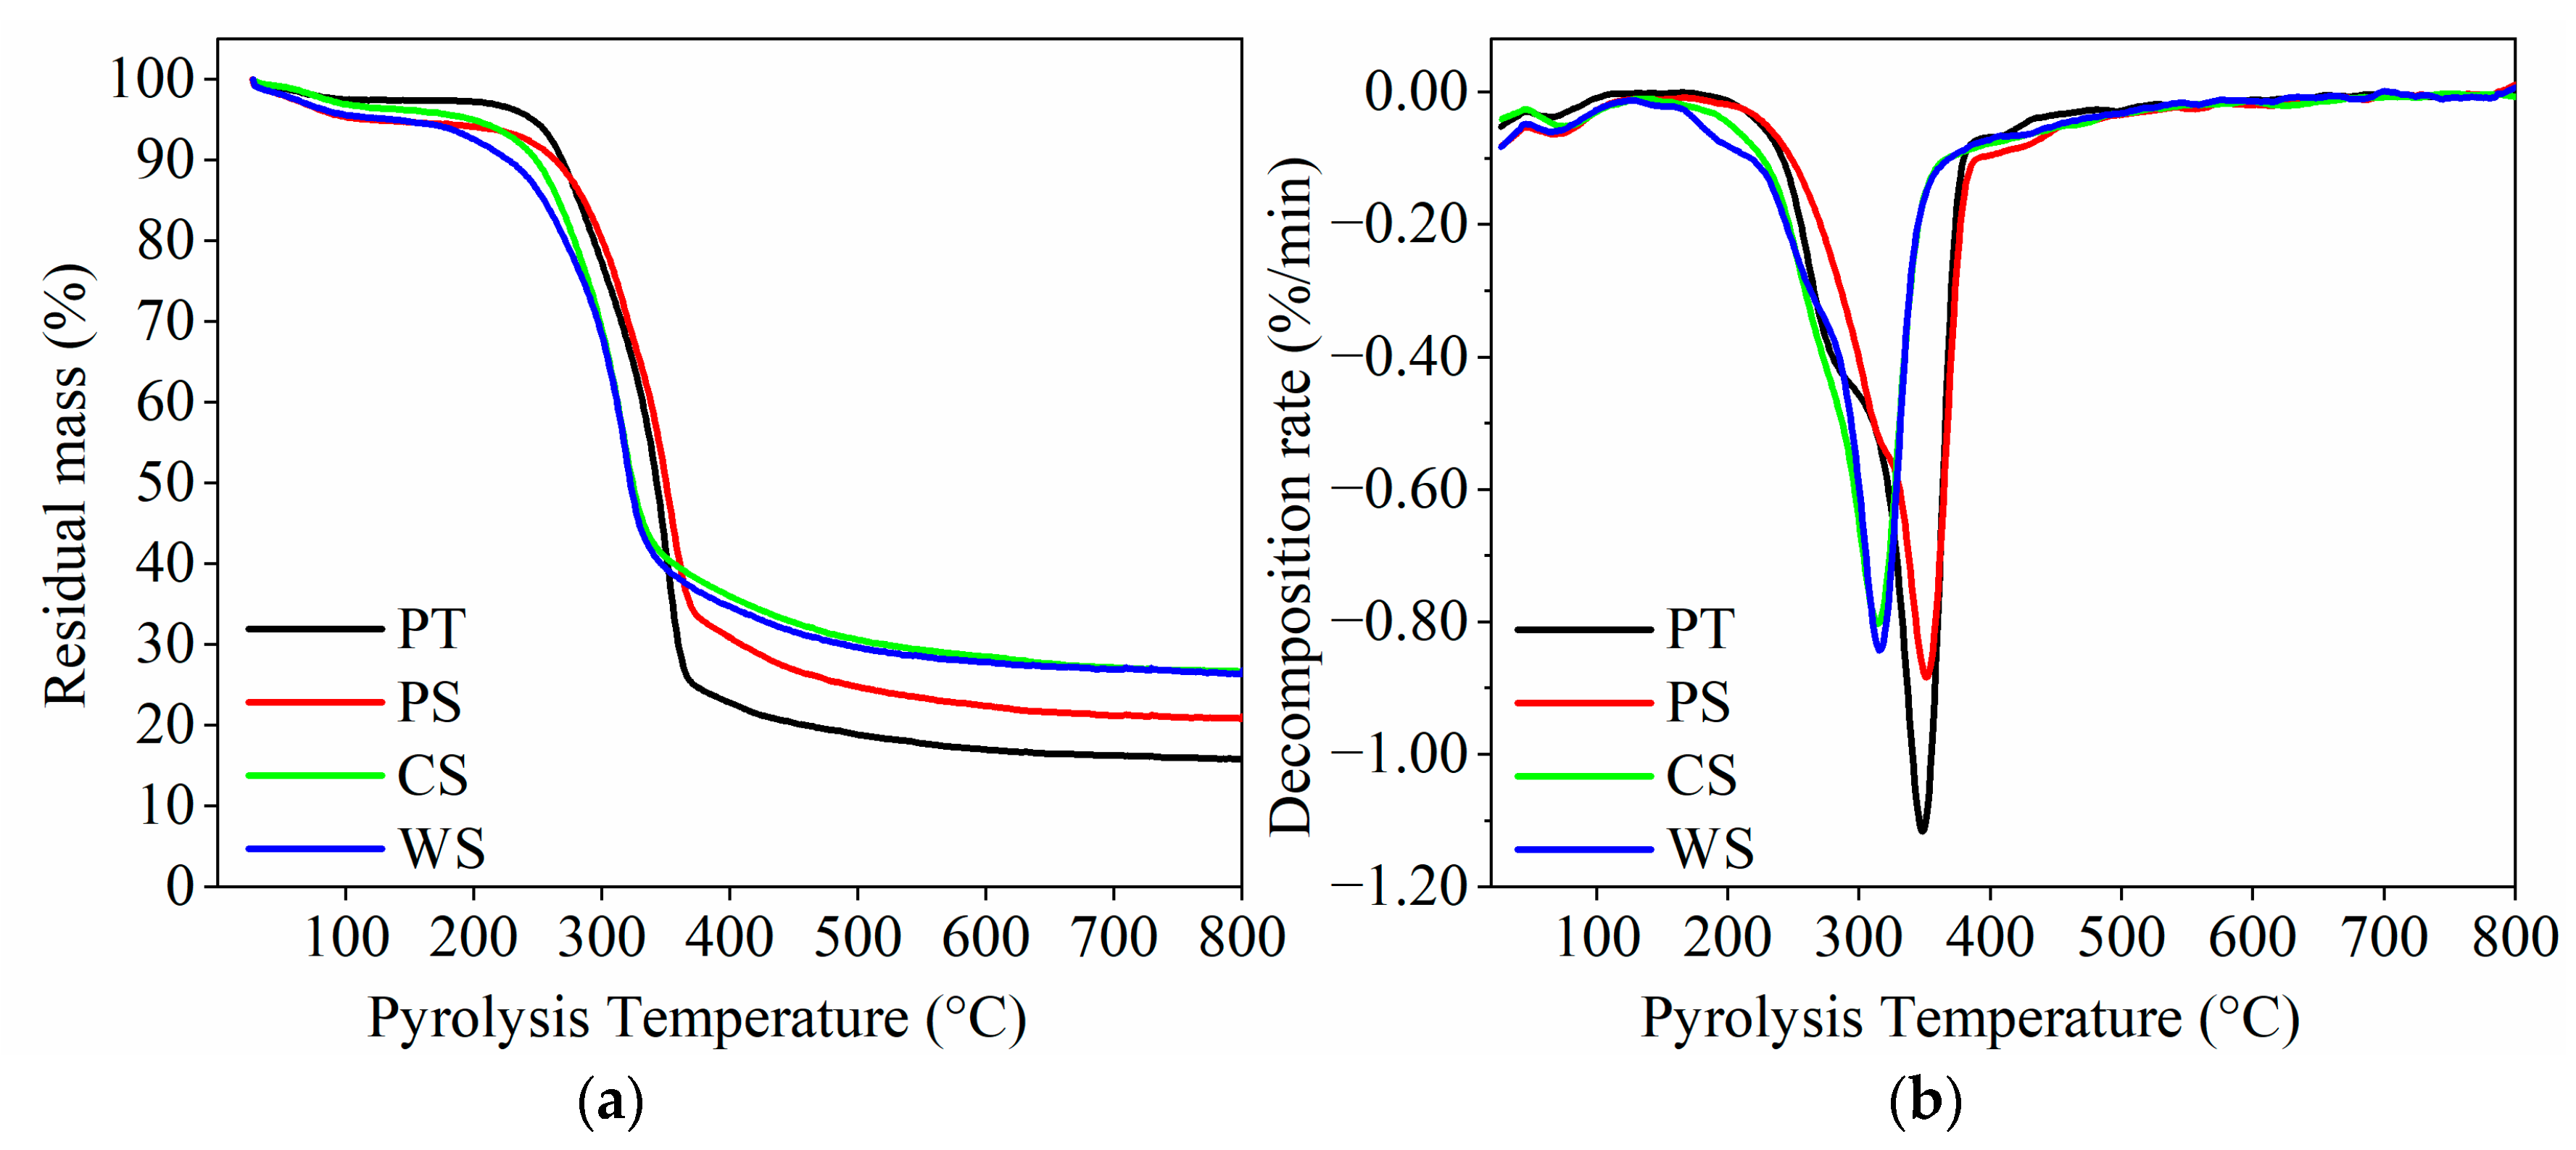
3.2. Thermogravimetric Characteristics of the Biomass

In the first stage (room temperature to 200 °C), the decrease in the TG mass of the biomass was relatively flat, with a mass loss of 2.72–7.39%. The mass loss in this stage was mainly due to moisture elution (Figure 1a). The second stage (200–375 °C) corresponds to the thermal decompositions of hemicellulose and cellulose; in this stage, the decomposition accelerates, whereas the residual mass (wt.%) and mass loss rate (wt.%/°C) decreased sharply. The pyrolysis-induced maximum mass loss rates of CS and WS were observed around 315 °C, whereas those of the sawdusts (PT and PS) were observed around 350 °C (Figure 1b). After the second stage (375 °C), the mass losses of the four biomass types followed a descending order: PT (75.31%) > PS (66.49%) > WS (63.38%) > CS (61.88%). Based on the TG characteristics of the biomass, PT exhibited the highest content of the easily pyrolyzable components. The third stage (375–800 °C) corresponded to the gradual thermal decomposition of lignin [22], where the TG mass curves and derivative TG (DTG) curves exhibited flat trends.

3.3. Yield and Elemental Analyses of the Biochars

The biochar yields decreased with the increasing temperatures (Table 2). The PT-biochar yield obtained at 350–650 °C was lower than that of other biochar types pyrolyzed at the same temperatures. This was attributed to the larger number of easily pyrolyzable components in PT decomposed at each temperature than those in other biomasses [27,36]. Additionally, the higher yields of PS biochar and straw-based biochar may be related to the uneasily pyrolyzable components, e.g., lignin and ash [37,38], and this was confirmed by the high lignin and ash contents of PS and WS, respectively.
As presented in Table 2, the ash content of most of the biochars increased with the temperature, with the WS and PT biochars exhibiting the highest and lowest ash contents, respectively. Their elemental contents of C and N exhibited the same trend, which increased with the temperatures. Contrarily, the H and O contents decreased with the increasing temperatures. Further, the H/C and O/C decrease among the biochars produced at 250 °C and 350 °C, particularly for the sawdust biochars exhibiting superior cellulose contents. This might be caused by the deoxygenation and dehydrogenation of the carbonyl and carboxyl groups in cellulose and hemicellulose [27,39], corresponding to the results of an extant study [40] in which the aromatic compounds were observed during the aromatization of cellulose in bamboo at 340 °C. Therefore, dehydration, deoxygenation, condensation, and dehydrogenation occurred in the easily pyrolyzable components of biomass during pyrolysis, increased the aromatization of the biochar, and determined the elemental content of the biochar [1,41,42,43].

3.4. Functional Groups in Biochar

Regarding the typical functional groups of the three main components of the feedstock, C=O, C–O, and C=C represent hemicellulose, cellulose, and lignin, respectively [2,24]. The peaks at 1460 and 890 cm−1 correspond to the bending vibrations of the benzene ring of lignin. The peaks at 1426, 1371, and 1160 cm−1 were attributed to methoxyl–O–CH3, aliphatic–CH3, and C–O–C stretching bonds in cellulose and hemicellulose, respectively. The peaks at 1320 and 1222 cm−1 correspond to the O–H bending deformation vibrations [44]. These are crucial indicators for identifying the three components [24].
Compared with the biochars pyrolyzed at high temperatures, the biochar pyrolyzed at low temperatures contained more abundant surface functional groups (Figure 2). The abundance of the O–H (3400 cm−1) and aliphatic C–H (2900 cm−1) bonds of biochar decreased with the increasing temperature, indicating the unstable compounds in biochar [45]. Compared with 250 °C-pyrolyzed biochar, the C–O and C–O–C bonds, which are the main functional groups of easily pyrolyzable components, were not clearly observed in the 350 °C-pyrolyzed biochar in the range of 900–1500 cm−1 [46,47].

3.5. Surface Characteristics of the Biochar

Figure 3 shows that the SSA and mesopore volume of the biochar generally increased with temperatures. Compared with the other biochars, the PT-biochar exhibited a relatively higher SSA (2.611–586.425 m2/g) and mesopore volume (0.005–0.228 cm3/g). Compared with the sawdust biochar, the straw biochar exhibited a lower mesopore volume and smaller SSA. This indicates that the pore characteristics of biochar vary with the feedstock type. Biochar comprises various proportions of thermogenic nanopores and mesopores [12], and its pore structure cannot be uniform because of the different biomass compositions and pyrolysis conditions [48]. The biochar pores were derived partially from the original structure of biomass and were obtained by pyrolysis at temperatures of <450 °C, whereas the pyrolytic nanopores were produced at higher temperatures [49] based on the feedstock components. The higher content of the easily pyrolyzable components in the sawdust biomass revealed that the PT and PS biochars might form mesopores compared with CS and WS biochar. Conversely, fewer pores formed in the CS and WS biochars owing to their lower content of easily pyrolyzable components and higher ash content, in which the ash might block the pores [50].

3.6. Water-Holding Capacity of the Biochar–SS Mixture

The additions of various types of biochar exert different effects on the WHC of the biochar–SS mixture (Figure 4). The biochar with a 5% addition rate increased the WHC of SS. Conversely, for the biochar derived from each feedstock type, the WHC of SS with a 5% biochar addition rate was much higher than those of other mixtures with lower biochar addition rates. This is attributable to the abundant pores in biochar, which increased the porosity of the biochar, thus enhancing the WHC of the biochar–SS mixtures [51]. For the PT and WS biochars, the addition of PT250 or WS250, at any rate, did not affect the WHC of the biochar–SS mixture. The biochar that was pyrolyzed at temperatures higher than 250 °C exhibited increased WHC at 2% and 5% biochar additions. Only the PT350 increased the WHC of the biochar–SS mixture at a 1% addition rate. All the PS biochars significantly improved the WHC of the biochar–SS mixture at a 5% addition. All the CS biochar increased WHC of the biochar–SS mixture at a 2% addition. The WHC of the CS biochar–SS mixture was higher than that of pure SS when the 5% CS biochar that was produced at >250 °C temperatures was added. Regarding the WS biochar, the WHC of the WS650–SS mixture only caused an increase at a 5% biochar addition. Compared with the 250 °C-prepared biochar, the WHC of the biochar prepared at a higher temperature was higher, However, the WHC of the biochar–SS mixtures did not exactly increase with the pyrolysis temperature. Additionally, the maximum WHC values of the PT-, WS-, CS-, and PS-derived biochars were 599 mg/g (PT350), 394 mg/g (PS350), 405 mg/g (CS650), and 487 mg/g (WS450), respectively. This is consistent with the amounts of the easily pyrolyzable components in each feedstock.
The surface area and volumes of mesopore and micropore of biochar positively correlated with the WHC of the biochar–SS mixture (Table 3). It indicated that the pore volume exerted a positive effect on the WHC of the biochar–SS mixture. The WHC of the biochar–SS mixture correlated significantly with H/C, demonstrating that the aromaticity of biochar might be related to WHC. Notably, the thermal residual mass and WHC of biochar–SS mixture exhibited a negative correlation, demonstrating that the easily pyrolyzable components of the biomasses exhibit a vital linkage with the WHC of the biochar–SS mixture. Thus, a higher proportion of these components in biochar would improve the water-retention capacities of porous materials in biochar application.
It is known that cellulose and hemicellulose significantly influence pore formation. Cellulose pyrolysis mainly contributes to mesopores [48], whereas hemicellulose decomposes rapidly at 350 °C to form pores [22]. Pore formation enhances the WHC of biochar-added porous media [52]. Although the pore volume and surface area of biochar increased with the pyrolytic temperature, WHC of the biochar–SS mixture did not exhibit a similar tendency. Rather than high-temperature-pyrolyzed biochar, the biochar pyrolyzed at 350 °C obtained the highest WHC among the biochar–SS mixtures. The straw-obtained biochars produce thermogenic nanopores at higher temperatures (>450 °C) probably because of the gradual pyrolysis of lignin at high temperatures [49]. Additionally, the low-temperature-produced biochar exhibited abundant hydrophilic functional groups due to carboxylic acids and phenolic substances produced from thermal decomposition of easily pyrolyzable components at a range of 200–300 °C [53]. The low-temperature biochar (≤350 °C) comprised more oxygen-containing functional groups compared with the high-temperature-produced biochar (600 °C) [54]. Furthermore, compared with the addition of the biochar produced at >350 °C, the addition of the low-temperature biochar (≤350 °C) to SS increased its WHC. This might be attributed to the relationship between WHC of biochar and the surface hydrophilic functional groups (–OH, –COOH, etc.) of biochar [12,17], where more abundant –OH and C=O groups exist in the low-temperature biochar (≤350 °C) than in those produced at >350 °C [55]. The proportion of hydrophilic functional groups of the –OH- and C=O-rich easily pyrolyzable components gradually decreased with the increasing temperatures during pyrolysis at >350 °C (Table S1). Briefly, the effect of the functional groups of biochar related to the main components (cellulose, hemicellulose, and lignin) on WHC of the biochar–SS mixtures still requires further quantitative research.

4. Conclusions

As the main components of biomasses, the relative contents of hemicellulose, cellulose, and lignin determined the differences among feedstocks, as the pyrolysis of these components affected the physicochemical properties of biochar, accordingly. Cellulose and hemicellulose were the easily pyrolyzable components in biomass owing to the low thermal stability. PT exhibited the highest amount of easily pyrolyzable components among the four biomasses. The functional groups, elemental contents, aromaticities, and polarities of the different biochar types exhibited significant differences, which were mainly due to the dehydration, deoxygenation, and dehydrogenation of the easily pyrolyzable components during pyrolysis. Additionally, the easily pyrolyzable components in the biomasses essentially influenced the surface characteristics of the biochar. Thus, compared with the straw-derived biochars, the sawdust-derived ones exhibited larger SSAs and pore volumes owing to pore formation during the consumption of easily pyrolyzable components. Further, the WHC of the biochar–SS mixture increased as the addition rate of the biochar increased. The PT-derived biochar exhibited a relatively higher WHC than the biochar derived from the three other biomasses owing to the extensive decomposition of its easily pyrolyzable components. The thermal residual mass of the biomass exhibited the strongest correlation with the WHC of the mixture, indicating that the biomass with a high content of the easily pyrolyzable components would produce biochar with higher WHC. Therefore, the consumption of the easily pyrolyzable components during pyrolysis would substantially determine the biochar pore volumes. This would potentially influence the hydrological properties of the biochar during application. Further studies should be conducted to explore the applications of biochar in practical fields to determine the interaction between the easily pyrolyzable components of biochar and WHC of the soil. The transformation of easily pyrolyzable components during pyrolysis should be considered in the development of biochar-based soil amendments.

Supplementary Materials

The following supporting information can be downloaded at: https://www.mdpi.com/article/10.3390/agriculture13112053/s1, Figure S1. Biochar preparation process, (a) the compression of the biomass into the crucible, (b) the crucible after compaction of the lid placed inside the muffle furnace, (c) the muffle furnace after placing the heat shield, (d) the muffle furnace in working condition; Figure S2. Difference in water-holding capacity (WHC) of biochar-SS mixtures with different types and additions of biochar pyrolyze ed at 250 °C (a), 350 °C (b), 450 °C (c), 550 °C (d), 650 °C (e). Table S1. Ratio of peak area of C=O (1700 cm−1) to C-H (1456 cm−1) of biochar pyrolyzed at different temperatures. Table S2. Spearman’s correlation between the PT biochar properties and the WHC of the biochar-silica sand mixture (5% biochar addition, n = 5); Table S3. Pearson’s correlation (Thermal residual mass of biomass is spearman’s correlation) between the PS biochar properties and the WHC of the biochar-silica sand mixture (5% biochar addition, n = 5); Table S4. Spearman’s correlation between the CS biochar properties and the WHC of the biochar-silica sand mixture (5% biochar addition, n = 5); Table S5. Pearson’s correlation (Surface area (BET-CO2), Micropore volume, Aromaticity (H/C), Polarity(O/C)) and spearman’s correlation (Surface area (BET-N2, Mesopore volume, Thermal residual mass of biomass) between the WS biochar properties and the WHC of the biochar-silica sand mixture (5% biochar addition, n = 5); Table S6. Pearson’s correlation between the 250 °C-pyrolyzed biochar properties and the WHC of the biochar-silica sand mixture (5% biochar addition, n = 4); Table S7. Spearman’s correlation between the 350 °C-pyrolyzed biochar properties and the WHC of the biochar-silica sand mixture (5% biochar addition, n = 4); Table S8. Pearson’s correlation between the 450 °C-pyrolyzed biochar properties and the WHC of the biochar-silica sand mixture (5% biochar addition, n = 4); Table S9 Pearson’s correlation between the 550 °C-pyrolyzed biochar properties and the WHC of the biochar-silica sand mixture (5% biochar addition, n = 4); Table S10. Pearson’s correlation (Surface area (BET-N2), Mesopore volume, Surface area (BET-CO2), Micropore volume, Polarity (O/C), Thermal residual mass of biomass) and spearman’s correlation (Aromaticity(H/C)) between the 650 °C-pyrolyzed biochar properties and the WHC of the biochar-silica sand mixture (5% biochar addition, n = 4).

Author Contributions

K.Z. (Kaizhao Zhang): Conceptualization, Formal analysis, Investigation, Data Curation, Writing—Original Draft. K.Z. (Kun Zhang): Methodology, Writing—Review and Editing, Funding acquisition. Y.L.: Supervision, Project administration, Writing—Review and Editing. Q.K.: Investigation. Y.W.: Writing—Review and Editing. J.W.: Investigation. K.Y.: Investigation. J.M.: Conceptualization, Methodology, Formal analysis, Data Curation, Writing—Original Draft, Writing—Review and Editing, Funding acquisition. All authors have read and agreed to the published version of the manuscript.

Funding

This work was supported by the Natural Science Foundation of Xinjiang Uygur Autonomous Region [grant number 2021D01C048]; the High-level Talents Project ‘Tianchi Plan’ of Xinjiang Uygur Autonomous Region [grant numbers E0310301, TCBR202101]. This research was also supported by the K.C. Wong Education Foundation [grant number GJTD-2020-14].

Institutional Review Board Statement

Not applicable.

Data Availability Statement

The datasets presented will be made available on request from Kaizhao Zhang.

Conflicts of Interest

The authors declare no conflict of interest.

References

  1. Zhao, C.; Jiang, E.; Chen, A. Volatile production from pyrolysis of cellulose, hemicellulose and lignin. J. Energy Inst. 2017, 90, 902–913. [Google Scholar] [CrossRef]
  2. Singh, C.; Tiwari, S.; Rai, P.K.; Singh, J.S. Sustainable management of paddy crop residues: Effects on methanotrophs diversity and value for soil health restoration. Land Degrad. Dev. 2021, 32, 4121–4131. [Google Scholar] [CrossRef]
  3. Fodah, A.E.M.; Ghosal, M.K.; Behera, D. Microwave-assisted pyrolysis of agricultural residues: Current scenario, challenges, and future direction. Int. J. Environ. Sci. Technol. 2022, 19, 2195–2220. [Google Scholar] [CrossRef]
  4. Zhang, J.; Liu, J.; Liu, R. Effects of pyrolysis temperature and heating time on biochar obtained from the pyrolysis of straw and lignosulfonate. Bioresour. Technol. 2015, 176, 288–291. [Google Scholar] [CrossRef]
  5. Yuan, J.-H.; Xu, R.-K.; Zhang, H. The forms of alkalis in the biochar produced from crop residues at different temperatures. Bioresour. Technol. 2011, 102, 3488–3497. [Google Scholar] [CrossRef]
  6. Shaaban, A.; Se, S.-M.; Dimin, M.; Juoi, J.M.; Husin, M.H.M.; Mitan, N.M.M. Influence of heating temperature and holding time on biochars derived from rubber wood sawdust via slow pyrolysis. J. Anal. Appl. Pyrolysis 2014, 107, 31–39. [Google Scholar] [CrossRef]
  7. Mukherjee, A.; Zimmerman, A.; Harris, W. Surface chemistry variations among a series of laboratory-produced biochars. Geoderma 2011, 163, 247–255. [Google Scholar] [CrossRef]
  8. Blanco-Canqui, H. Biochar and Soil Physical Properties. Soil Sci. Soc. Am. J. 2017, 81, 687–711. [Google Scholar] [CrossRef]
  9. Jindo, K.; Mizumoto, H.; Sawada, Y.; Sanchez-Monedero, M.A.; Sonoki, T. Physical and chemical characterization of biochars derived from different agricultural residues. Biogeosciences 2014, 11, 6613–6621. [Google Scholar] [CrossRef]
  10. Tag, A.T.; Duman, G.; Ucar, S.; Yanik, J. Effects of feedstock type and pyrolysis temperature on potential applications of biochar. J. Anal. Appl. Pyrolysis 2016, 120, 200–206. [Google Scholar] [CrossRef]
  11. Sohi, S.P.; Krull, E.; Lopez-Capel, E.; Bol, R. Chapter 2—A review of biochar and its use and function in soil. Adv. Agron. 2010, 105, 47–82. [Google Scholar] [CrossRef]
  12. Gray, M.; Johnson, M.G.; Dragila, M.I.; Kleber, M. Water uptake in biochars: The roles of porosity and hydrophobicity. Biomass Bioenergy 2014, 61, 196–205. [Google Scholar] [CrossRef]
  13. Mao, J.; Zhang, K.; Chen, B. Linking hydrophobicity of biochar to the water repellency and WHC of biochar-amended soil. Environ. Pollut. 2019, 253, 779–789. [Google Scholar] [CrossRef] [PubMed]
  14. Basso, A.S.; Miguez, F.E.; Laird, D.A.; Horton, R.; Westgate, M. Assessing potential of biochar for increasing water-holding capacity of sandy soils. GCB Bioenergy 2013, 5, 132–143. [Google Scholar] [CrossRef]
  15. Qin, C.-C.; Abdalkarim, S.Y.H.; Zhou, Y.; Yu, H.-Y.; He, X. Ultrahigh water-retention cellulose hydrogels as soil amendments for early seed germination under harsh conditions. J. Clean. Prod. 2022, 370. [Google Scholar] [CrossRef]
  16. Werdin, J.; Fletcher, T.D.; Rayner, J.P.; Williams, N.S.; Farrell, C. Biochar made from low density wood has greater plant available water than biochar made from high density wood. Sci. Total Environ. 2020, 705, 135856. [Google Scholar] [CrossRef]
  17. Li, H.; Tan, Z. Preparation of high water-retaining biochar and its mechanism of alleviating drought stress in the soil and plant system. Biochar 2021, 3, 579–590. [Google Scholar] [CrossRef]
  18. Zhang, J.; You, C. Water Holding Capacity and Absorption Properties of Wood Chars. Energy Fuels 2013, 27, 2643–2648. [Google Scholar] [CrossRef]
  19. Shoulaifar, T.K.; DeMartini, N.; Ivaska, A.; Fardim, P.; Hupa, M. Measuring the concentration of carboxylic acid groups in torrefied spruce wood. Bioresour. Technol. 2012, 123, 338–343. [Google Scholar] [CrossRef]
  20. Ciolkosz, D.; Wallace, R. A review of torrefaction for bioenergy feedstock production. Biofuels Bioprod. Biorefin. 2011, 5, 317–329. [Google Scholar] [CrossRef]
  21. Brewer, C.E.; Chuang, V.J.; Masiello, C.A.; Gonnermann, H.; Gao, X.; Dugan, B.; Driver, L.E.; Panzacchi, P.; Zygourakis, K.; Davies, C.A. New approaches to measuring biochar density and porosity. Biomass Bioenergy 2014, 66, 176–185. [Google Scholar] [CrossRef]
  22. Weber, K.; Quicker, P. Properties of biochar. Fuel 2018, 217, 240–261. [Google Scholar] [CrossRef]
  23. Chen, Y.; Zhang, X.; Chen, W.; Yang, H.; Chen, H. The structure evolution of biochar from biomass pyrolysis and its correlation with gas pollutant adsorption performance. Bioresour. Technol. 2017, 246, 101–109. [Google Scholar] [CrossRef] [PubMed]
  24. Zhu, Y.; Yi, B.; Hu, H.; Zong, Z.; Chen, M.; Yuan, Q. The relationship of structure and organic matter adsorption characteristics by magnetic cattle manure biochar prepared at different pyrolysis temperatures. J. Environ. Chem. Eng. 2020, 8, 104112. [Google Scholar] [CrossRef]
  25. Gezahegn, S.; Sain, M.; Thomas, S.C. Variation in Feedstock Wood Chemistry Strongly Influences Biochar Liming Potential. Soil Syst. 2019, 3, 26. [Google Scholar] [CrossRef]
  26. Berglund, J.; Mikkelsen, D.; Flanagan, B.M.; Dhital, S.; Gaunitz, S.; Henriksson, G.; Lindström, M.E.; Yakubov, G.E.; Gidley, M.J.; Vilaplana, F. Wood hemicelluloses exert distinct biomechanical contributions to cellulose fibrillar networks. Nat. Commun. 2020, 11, 4692. [Google Scholar] [CrossRef]
  27. Yang, H.; Yan, R.; Chen, H.; Lee, D.H.; Zheng, C. Characteristics of hemicellulose, cellulose and lignin pyrolysis. Fuel 2007, 86, 1781–1788. [Google Scholar] [CrossRef]
  28. van der Stelt, M.J.C.; Gerhauser, H.; Kiel, J.H.A.; Ptasinski, K.J. Biomass upgrading by torrefaction for the production of biofuels: A review. Biomass Bioenergy 2011, 35, 3748–3762. [Google Scholar] [CrossRef]
  29. Chen, W.-H.; Kuo, P.-C. Torrefaction and co-torrefaction characterization of hemicellulose, cellulose and lignin as well as torrefaction of some basic constituents in biomass. Energy 2011, 36, 803–811. [Google Scholar] [CrossRef]
  30. Zhang, K.; Chen, B.; Mao, J.; Zhu, L.; Xing, B. Water clusters contributed to molecular interactions of ionizable organic pollutants with aromatized biochar via π-PAHB: Sorption experiments and DFT calculations. Environ. Pollut. 2018, 240, 342–352. [Google Scholar] [CrossRef]
  31. Keiluweit, M.; Nico, P.S.; Johnson, M.G.; Kleber, M. Dynamic Molecular Structure of Plant Biomass-Derived Black Carbon (Biochar). Environ. Sci. Technol. 2010, 44, 1247–1253. [Google Scholar] [CrossRef] [PubMed]
  32. Ghani, W.A.W.A.K.; Mohd, A.; da Silva, G.; Bachmann, R.T.; Taufiq-Yap, Y.H.; Rashid, U.; Al-Muhtaseb, A.H. Biochar production from waste rubber-wood-sawdust and its potential use in C sequestration: Chemical and physical characterization. Ind. Crop. Prod. 2013, 44, 18–24. [Google Scholar] [CrossRef]
  33. Van Soest, P.J.; Wine, R.H. Use of Detergents in the Analysis of Fibrous Feeds. IV. Determination of Plant Cell-Wall Constituents. J. AOAC Int. 1967, 50, 50–55. [Google Scholar] [CrossRef]
  34. Rouquerol, J.G.; Baron, R.; Denoyel, H.; Giesche, J.; Groen, P.; Klobes, P.; Levitz, A.V.; Neimark, S.; Rigby, R.; Skudas, K.; et al. Liquid intrusion and alternative methods for the characterization of macroporous materials (IUPAC Technical Report). Pure Appl. Chem. 2012, 84, 107–136. [Google Scholar] [CrossRef]
  35. Torkzaban, S.; Tazehkand, S.S.; Walker, S.L.; Bradford, S.A. Transport and fate of bacteria in porous media: Coupled effects of chemical conditions and pore space geometry. Water Resour. Res. 2008, 44. [Google Scholar] [CrossRef]
  36. Wang, H.; Wang, X.; Cui, Y.; Xue, Z.; Ba, Y. Slow pyrolysis polygeneration of bamboo (Phyllostachys pubescens): Product yield prediction and biochar formation mechanism. Bioresour. Technol. 2018, 263, 444–449. [Google Scholar] [CrossRef]
  37. Tian, H.; Wei, Y.; Cheng, S.; Huang, Z.; Qing, M.; Chen, Y.; Yang, H.; Yang, Y. Optimizing the gasification reactivity of biochar: The composition, structure and kinetics of biochar derived from biomass lignocellulosic components and their interactions during gasification process. Fuel 2022, 324, 124709. [Google Scholar] [CrossRef]
  38. Grafmüller, J.; Böhm, A.; Zhuang, Y.; Spahr, S.; Müller, P.; Otto, T.N.; Bucheli, T.D.; Leifeld, J.; Giger, R.; Tobler, M.; et al. Wood Ash as an Additive in Biomass Pyrolysis: Effects on Biochar Yield, Properties, and Agricultural Performance. ACS Sustain. Chem. Eng. 2022, 10, 2720–2729. [Google Scholar] [CrossRef]
  39. Fan, M.; Li, C.; Shao, Y.; Zhang, S.; Gholizadeh, M.; Hu, X. Pyrolysis of cellulose: Correlation of hydrophilicity with evolution of functionality of biochar. Sci. Total Environ. 2022, 825, 153959. [Google Scholar] [CrossRef]
  40. Hu, J.; Song, Y.; Liu, J.; Evrendilek, F.; Buyukada, M.; Yan, Y. Synergistic effects, gaseous products, and evolutions of NOx precursors during (co-)pyrolysis of textile dyeing sludge and bamboo residues. J. Hazard. Mater. 2021, 401, 123331. [Google Scholar] [CrossRef]
  41. Xin, S.; Yang, H.; Chen, Y.; Yang, M.; Chen, L.; Wang, X.; Chen, H. Chemical structure evolution of char during the pyrolysis of cellulose. J. Anal. Appl. Pyrolysis 2015, 116, 263–271. [Google Scholar] [CrossRef]
  42. Zeng, K.; Wang, B.; Xia, S.; Cui, C.; Wang, C.; Zheng, A.; Zhao, K.; Zhao, Z.; Li, H. Isobaev Towards directional pyrolysis of xylan: Understanding the roles of alkali/alkaline earth metals and pyrolysis temperature. Energy 2022, 254, 124245. [Google Scholar] [CrossRef]
  43. Guo, D.; Wu, S.; Lyu, G.; Guo, H. Effect of molecular weight on the pyrolysis characteristics of alkali lignin. Fuel 2017, 193, 45–53. [Google Scholar] [CrossRef]
  44. Pei, Z.; Li, L.; Sun, L.; Zhang, S.; Shan, X.-Q.; Yang, S.; Wen, B. Adsorption characteristics of 1,2,4-trichlorobenzene, 2,4,6-trichlorophenol, 2-naphthol and naphthalene on graphene and graphene oxide. Carbon 2013, 51, 156–163. [Google Scholar] [CrossRef]
  45. Zhao, N.; Lv, Y.; Yang, X.; Huang, F.; Yang, J. Characterization and 2D structural model of corn straw and poplar leaf biochars. Environ. Sci. Pollut. Res. 2018, 25, 25789–25798. [Google Scholar] [CrossRef]
  46. Chen, D.; Cen, K.; Zhuang, X.; Gan, Z.; Zhou, J.; Zhang, Y.; Zhang, H. Insight into biomass pyrolysis mechanism based on cellulose, hemicellulose, and lignin: Evolution of volatiles and kinetics, elucidation of reaction pathways, and characterization of gas, biochar and bio-oil. Combust. Flame 2022, 242, 112142. [Google Scholar] [CrossRef]
  47. Mimmo, T.; Panzacchi, P.; Baratieri, M.; Davies, C.; Tonon, G. Effect of pyrolysis temperature on miscanthus (Miscanthus × giganteus) biochar physical, chemical and functional properties. Biomass Bioenergy 2014, 62, 149–157. [Google Scholar] [CrossRef]
  48. Lawal, A.A.; Hassan, M.A.; Zakaria, M.R.; Yusoff, M.Z.M.; Norrrahim, M.N.F.; Mokhtar, M.N.; Shirai, Y. Effect of oil palm biomass cellulosic content on nanopore structure and adsorption capacity of biochar. Bioresour. Technol. 2021, 332, 125070. [Google Scholar] [CrossRef]
  49. Das, O.; Sarmah, A.K. The love–hate relationship of pyrolysis biochar and water: A perspective. Sci. Total Environ. 2015, 512–513, 682–685. [Google Scholar] [CrossRef]
  50. Li, J.; Liang, N.; Jin, X.; Zhou, D.; Li, H.; Wu, M.; Pan, B. The role of ash content on bisphenol A sorption to biochars derived from different agricultural wastes. Chemosphere 2017, 171, 66–73. [Google Scholar] [CrossRef]
  51. Abel, S.; Peters, A.; Trinks, S.; Schonsky, H.; Facklam, M.; Wessolek, G. Impact of biochar and hydrochar addition on water retention and water repellency of sandy soil. Geoderma 2013, 202–203, 183–191. [Google Scholar] [CrossRef]
  52. Hardie, M.; Clothier, B.; Bound, S.; Oliver, G.; Close, D. Does biochar influence soil physical properties and soil water availability? Plant Soil 2014, 376, 347–361. [Google Scholar] [CrossRef]
  53. Cao, X.; Harris, W. Properties of dairy-manure-derived biochar pertinent to its potential use in remediation. Bioresour. Technol. 2010, 101, 5222–5228. [Google Scholar] [CrossRef] [PubMed]
  54. Suliman, W.; Harsh, J.B.; Abu-Lail, N.I.; Fortuna, A.-M.; Dallmeyer, I.; Garcia-Pérez, M. The role of biochar porosity and surface functionality in augmenting hydrologic properties of a sandy soil. Sci. Total Environ. 2017, 574, 139–147. [Google Scholar] [CrossRef] [PubMed]
  55. Li, D.; Li, C.; Fan, M.; Shao, Y.; Sun, Y.; Zhang, L.; Zhang, S.; Huang, Y.; Li, B.; Wang, S.; et al. Investigation of property of biochar in staged pyrolysis of cellulose. J. Anal. Appl. Pyrolysis 2023, 172, 105999. [Google Scholar] [CrossRef]
Figure 1. TG (a) and DTG (b) curves of the pyrolysis of PT, PS, CS, and WS.
Agriculture 13 02053 g001
Figure 2. FTIR spectra of the biochars produced from PT (a), PS (b), CS (c), and WS (d). The locations of the infrared peaks in the graph are marked with dash lines and arrows.
Agriculture 13 02053 g002
Figure 3. Surface area and pore volume of biochar prepared from PT (a,e), PS (b,f), CS (c,g), and WS (d,h), respectively.
Agriculture 13 02053 g003
Figure 4. Differences in water-holding capacity (WHC) of the biochar–silica sand (SS) mixtures, where the biochar was produced from PT (a), PS (b), CS (c), and WS (d).
Agriculture 13 02053 g004
Table 1. Composition of main components of the biomasses.
BiomassLabelCellulose (%)Hemicellulose (%)Lignin (%)Ash (%)
Poplar wood sawdustPT66.1319.9613.200.71
Pinewood sawdustPS48.8610.7038.392.05
Cotton stalkCS56.3119.7722.491.43
Wheat strawWS53.2434.518.843.42
Table 2. Chemical properties of biochar (the C, N, H, and O contents were corrected by the ash content).
BiocharYield (%)Ash Content (%)C (%)N (%)H (%)O (%)H/CO/C
PT25061.9052.0059.39 ± 0.050.30 ± 0.015.03 ± 0.0135.29 ± 0.060.0850.59
PT35029.381.6073.55 ± 0.040.35 ± 0.033.32 ± 0.0422.78 ± 0.100.0450.31
PT45020.9241.0578.79 ± 0.050.44 ± 0.012.96 ± 0.0317.81 ± 0.090.0380.23
PT55019.0791.9587.26 ± 0.050.57 ± 0.012.51 ± 0.059.66 ± 0.110.0290.11
PT65016.3741.6589.93 ± 0.040.67 ± 0.011.49 ± 0.037.90 ± 0.010.0170.09
PS25072.1272.7959.62 ± 0.030.31 ± 0.004.91 ± 0.0235.16 ± 0.010.0820.59
PS35037.7584.0473.83 ± 0.040.32 ± 0.013.90 ± 0.0321.95 ± 0.030.0530.30
PS45029.766.1981.20 ± 0.070.36 ± 0.013.22 ± 0.0215.22 ± 0.040.0400.19
PS55025.6636.3987.54 ± 0.050.50 ± 0.022.46 ± 0.049.50 ± 0.030.0280.11
PS65023.3586.2592.06 ± 0.070.58 ± 0.051.55 ± 0.035.81 ± 0.060.0170.06
CS25054.3645.8562.51 ± 0.041.32 ± 0.044.30 ± 0.0331.84 ± 0.100.0690.51
CS35035.09812.5073.06 ± 0.111.75 ± 0.023.98 ± 0.0321.18 ± 0.160.0540.29
CS45030.84815.3477.89 ± 0.061.88 ± 0.033.04 ± 0.0117.15 ± 0.100.0390.22
CS55027.29316.1380.99 ± 0.041.82 ± 0.032.05 ± 0.0415.07 ± 0.030.0250.19
CS65025.73716.3381.93 ± 0.022.33 ± 0.011.48 ± 0.0614.19 ± 0.060.0180.17
WS25059.83211.5960.23 ± 0.030.75 ± 0.064.22 ± 0.0434.77 ± 0.040.0700.58
WS35036.59919.0771.69 ± 0.030.94 ± 0.013.51 ± 0.0523.81 ± 0.100.0490.33
WS45030.95121.2877.95 ± 0.060.91 ± 0.032.85 ± 0.0518.22 ± 0.130.0370.23
WS55028.30422.9282.55 ± 0.060.99 ± 0.032.09 ± 0.0314.30 ± 0.050.0250.17
WS65024.23424.9487.73 ± 0.081.12 ± 0.041.52 ± 0.029.54 ± 0.090.0170.11
Table 3. Correlation between the biochar properties and WHC of the 5% biochar–SS mixture based on Spearman’s analysis (n = 20).
Biochar PropertiesCorrelation Coefficientp Value
Surface area (N2)0.6080.004
Mesopore volume0.6110.004
Surface area (CO2)0.5970.005
Micropore volume0.5660.009
Aromaticity (H/C)−0.4890.029
Polarity (O/C)−0.3900.089
Thermal residual mass of biomass−0.5470.012
Disclaimer/Publisher’s Note: The statements, opinions and data contained in all publications are solely those of the individual author(s) and contributor(s) and not of MDPI and/or the editor(s). MDPI and/or the editor(s) disclaim responsibility for any injury to people or property resulting from any ideas, methods, instructions or products referred to in the content.

