1. Introduction
Ear tags are widely used in large-scale farms as a crucial device for breeding pigs’ identification [
1]. Individual identification through ear tags is crucial for the development of the breeding industry, as it enables the management and tracking of breeding pigs throughout their entire life cycle; this practice supports the refinement, intensification, and intelligence of the industry and holds great significance for production management, genetic breeding, and lineage tracing [
2]. Ear tag loss is a frequent problem in the production environment, often caused by the breeding pigs’ natural activity, rubbing against farm facilities, and mutual aggression. Although measures can be taken to reduce the loss rate, such as improving the quality of ear tags and changing the marking position, it is impossible to eliminate the occurrence of ear tag loss. The loss of ear tags has significant consequences for breeding pigs’ identity information, resulting in the loss and confusion of production and genetic breeding data. Livestock caretakers rely primarily on direct observation or video surveillance methods to detect tag loss. However, direct observation poses the risk of zoonotic diseases and offers limited economic benefits. Video monitoring, although reducing contact with breeding pigs, is hindered by factors like overlapping breeding pig clusters and video contamination, making it time-consuming, inefficient, and prone to errors. Therefore, researching an automated, real-time, and accurate method for detecting breeding pigs’ lost ear tags is imperative.
In recent years, with the rapid development of artificial neural networks in computer vision, deep convolutional neural networks (DCNNs) based on computer vision have been widely applied in the field of animal husbandry [
3]. A DCNN offers several advantages in breeding pig production, including high recognition rates, non-invasiveness, minimal animal stress response, and easy deployment. It enables real-time, efficient, and continuous detection, making it suitable for tasks such as individual recognition [
4,
5,
6], pose detection [
7,
8,
9], target tracking [
10,
11], and count statistics [
12,
13]. Previous studies have primarily focused on learning the image feature representation of breeding pigs, extracting features, and using image-based classification and object recognition for practical applications. These advancements offer automated and intelligent solutions for farming management of breeding pigs. However, the existing research mainly focuses on individual breeding pigs, with limited investigations into detecting lost ear tags. Cascade Mask R-CNN [
14], an advanced target detection algorithm based on Mask R-CNN [
15], improves both detection accuracy and speed by introducing a cascade structure, utilizing shared convolutional feature maps and using smaller receptive fields. Additionally, it demonstrates robust generalization capabilities, making it suitable for various object detection scenarios. This paper presents an enhanced Cascade Mask R-CNN approach for visually detecting lost ear tags in a production environment.
To address the issue of insufficient feature extraction in complex pigsty environments within the Cascade Mask R-CNN, this study utilizes the ResNeXt [
16] network as the feature extractor. Additionally, this paper introduces online hard example mining (OHEM) to enhance the model’s ability to learn from challenging samples, effectively tackling the problems of imbalanced dataset categories and uneven distribution of complex and easy samples. Soft-NMS is utilized to enhance instance segmentation performance to mitigate issues caused by dense overlaps of breeding pigs, such as false merges and missed instances due to occlusion. The effectiveness of the algorithm improvements and their usability in a production environment are validated through sliding window detection experiments. The main contributions of this paper are as follows:
- (1)
The study applies instance segmentation to detect breeding pigs’ lost ear tags and demonstrates the feasibility of using deep learning instance segmentation algorithms.
- (2)
An improved algorithm based on Cascade Mask R-CNN is proposed. The algorithm integrates techniques such as the ResNeXt backbone network, online hard example mining (OHEM) [
17]), Soft-NMS [
18], and others to enhance the performance of breeding pig and ear tag instance segmentation.
- (3)
The proposed method effectively identified piglets with lost tags under production conditions.
2. Materials and Methods
2.1. Data Acquisition
The data used in this study were collected from a large-scale breeding pig farm located in Hohhot, Inner Mongolia Autonomous Region, China, between 24 December 2022 and 23 January 2023. Four breeding pig pens were selected as the data collection areas, each with dimensions of 5.3 × 2.7 m (see
Figure 1) and housing 28 breeding pigs aged 2 to 3 months; two breeding pigs had lost ear tags, while the remaining 26 had intact ear tags. A dome-shaped camera (Hikvision, Hangzhou, China) was installed 3.4 m above the feeding area. The camera model used was DS-2PT7D20IW-DE, which had a resolution of 1920 × 1080 pixels and a frame rate of 25 fps. The breeding pig pens were continuously monitored for 24 h. Color images were captured during well-lit conditions, and in darker conditions, the camera automatically switched to infrared illumination mode, capturing grayscale images. The recorded videos were stored in the local area network NVR of the farm and accessed remotely using NVR management software. The exported video files had the extension .asf and were encoded in H.264 format.
2.2. Establishment of the Sample Database
2.2.1. Data Filtering
Eighty-four video segments, each three minutes long, were manually selected from the collected video files. These video segments exclusively contained instances of breeding pigs with lost ear tags, making them suitable as validation data for assessing the effectiveness of ear tag detection in a production environment. Additionally, 37.9 h of usable video segments were selected from the remaining video files. The FFmpeg software extracted frames from these videos at one frame per second. This process resulted in the acquisition of 136,350 image files.
Due to the high similarity of images between neighboring frames, direct use for model training may result in longer training time, lower training efficiency, or even overfitting. In this study, the Structural Similarity (SSIM) [
19] algorithm was utilized to evaluate image similarity and eliminate highly similar images, thereby improving model training efficiency. The SSIM algorithm parameter ranges from −1 to 1, where 1 indicates that the two images are almost identical. After conducting a series of experimental attempts on the study data, the empirical threshold for SSIM was set to 0.78. This threshold eliminated approximately 92% of the data, resulting in the retention of 10,908 image files. The similarity between images
and
is calculated using Equation (
1):
where
,
represent the pixel averages of images
and
, respectively;
,
denote the pixel variance of images
,
;
are the pixel covariance between images
and
; and
and
are two constants used to avoid division by zero, with their values both set to 0.01.
In order to improve the efficiency of model training, the experiments manually eliminated images with defacement and without breeding pigs based on the filtering of the SSIM algorithm. As a result, 6271 images were retained. The images were cropped to focus on the feeding area of the breeding pigs, resulting in a resolution of 1438 × 973 pixels for the cropped images.
2.2.2. Image Annotation
The PaddleSeg [
20] open-source image annotation software (Version 2.7, licensed under the Apache License 2.0) was used to annotate the breeding pig and ear tag regions. The annotations were stored in the COCO dataset [
21] format. The original image is shown in
Figure 2a, while the annotated result is shown in
Figure 2b. In the annotated image, the semi-transparent red regions represent the breeding pigs, and the semi-transparent purple regions represent the ear tags. Specifically, there are two breeding pigs with ear tags in the image, while one breeding pig is missing the ear tag.
2.2.3. Data Enhancement
In this study, data augmentation was performed using the Python data augmentation library Albumentations [
22] and a single-sample data augmentation approach. The methods include random rotation (randomly generating a rotation angle within the range of −45 to 45 degrees), Gaussian blur (convolution kernel with a size of 5 × 5 and standard deviation of 3.0), contrast adjustment (randomly sampling adjustment factors within the range of 0 to 1), modification of pixel values (randomly modifying RGB channel values between −50 and 50), dropout (with a probability of 0.4 and a size of 7 × 7), and random fog (randomly generating fogging levels within the range of 0.3 to 1). After randomly extracting 15% of the data for data augmentation, the total number of samples expands to 7212 images. The augmented images are shown in
Figure 3.
2.2.4. Dataset Partition
The dataset was randomly split into a training set of 5770 images and a test set of 1442 images, using an 8:2 ratio. To further evaluate the model’s robustness under various lighting conditions and breeding pig activity levels, the test set was divided into six groups: daytime stationary, daytime active, daytime mixed, nighttime stationary, nighttime active, and nighttime mixed. The term ‘mixed’ indicates that the images in these groups contain stationary and active breeding pigs. The data presented in
Table 1 show the distribution of images in each group within the test set.
2.3. Design of Detection Model for Breeding Pigs’ Lost Ear Tags
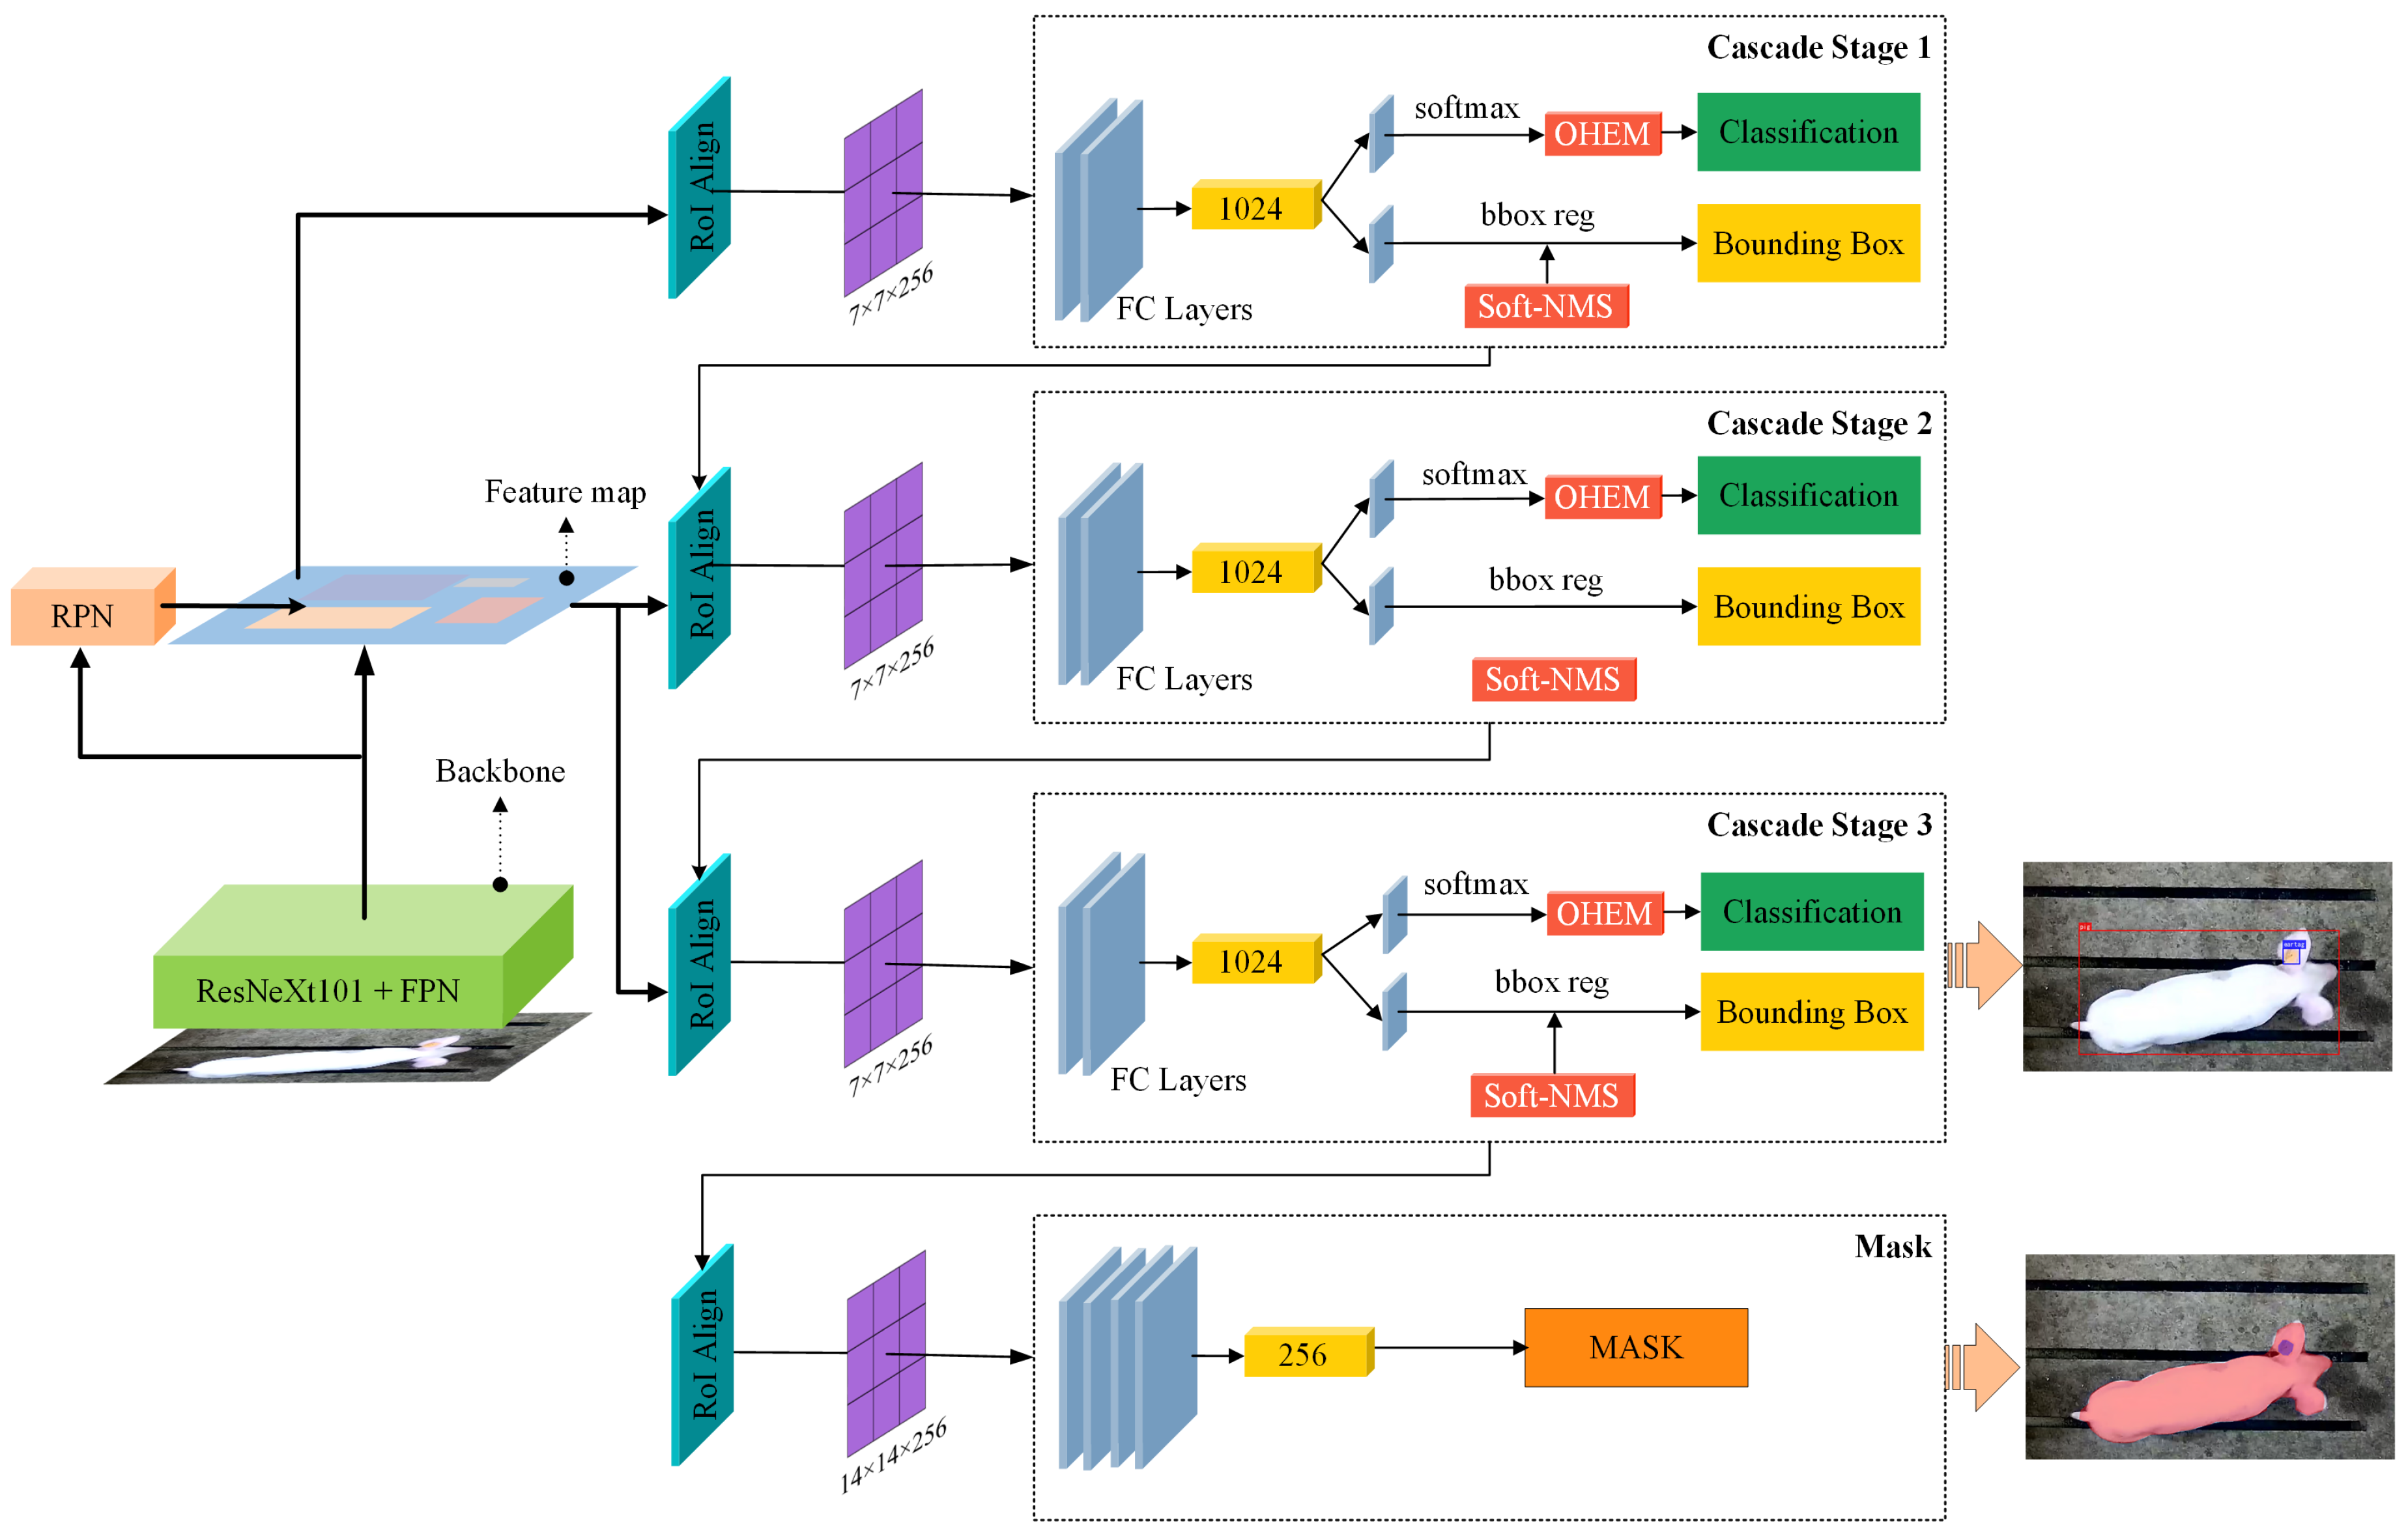
Cascade Mask R-CNN is a widely used deep learning method. It improves the performance of object detection and instance segmentation by incorporating a cascade structure into the Mask R-CNN framework. This study proposes an improved Cascade Mask R-CNN model for detecting breeding pigs’ lost ear tags. The model comprises three parts: the backbone network, the region proposal network, and the Cascade Detection Network, as illustrated in
Figure 4.
2.3.1. Backbone Network
In this study, the ResNeXt101 network is combined with the feature pyramid network as a feature extraction backbone network to accommodate the multi-scale feature extraction needs in complex breeding pig barn scenes. ResNeXt101 maintains the same number of network layers as ResNet101 but enhances the internal structure of the network blocks. It consists of four residual block groups connected in series, each containing 3, 4, 23, and 3 residual blocks, respectively. Inside the residual block, three convolution operations (1 × 1, 3 × 3, and 1 × 1) are utilized, and the second 3 × 3 convolution employs channel group convolution with 32 branches and 64 groups. Additionally, each convolution layer is followed by a group normalization (GN) [
23] operation, and each residual block is connected to the ReLU [
24] activation function after the last group normalization. The formulas for GN are provided in Equations (2)–(5), and the formula for the ReLU activation function is given in Equation (
6). The advantages of using the ResNeXt101 network are as follows: (1) the channel group convolution mechanism reduces the number of parameters and improves the speed of model training; and (2) the residual connection structure facilitates gradient back-propagation and enhances feature extraction ability.
In this paper, the outputs of the four residual block groups in ResNeXt101 are all input into the FPN [
25] network. The four residual block groups’ output channels are 256, 512, 1024, and 2048 channels, respectively. After upsampling, feature fusion, and generation of multi-scale feature pyramids, the FPN network outputs five 256-channel feature layers, which enables the network to perform target detection and image segmentation at different scales, thereby improving the model’s performance.
In Equations (2)–(5),
n is the number of images participating in the loss calculation,
represents the
i-th sample,
and
are the average value and variance of the samples in the same batch, and
represents the result of normalization based on the average value and variance.
is a small constant to avoid zero division, while
and
are the scaling and shift parameters. In Equation (
6),
represents the output value after the
l-th layer convolution operation, and
represents the output value of the activation function.
2.3.2. Region Proposal Network
The Region Proposal Network (RPN) [
26] is used to generate candidate regions and perform preliminary classification and position regression. To accomplish this, the RPN takes the outputs of five 256-channel feature layers from the FPN, and a set of anchors is placed on different feature map layers, each corresponding to a fixed receptive field size. These anchors are selected based on predefined scales and aspect ratios to cover targets of varying scales and aspect ratios. Multiple candidate boxes are generated for each anchor, with their center positions fixed at the center of the anchor and adjusted based on the predefined aspect ratios and scales. Specifically, in this paper, anchors with a scale of 8 are utilized, and three different aspect ratios of 1:2, 1:1, and 2:1 are generated based on these anchors. The strides of these anchors on the feature maps are predetermined to cover various regions while sliding over the input image. The paper employs five different strides, which are 4, 8, 16, 32, and 64. The RPN effectively covers targets of diverse scales and positions by placing anchors on different feature map layers and generating a range of candidate boxes. Once the anchor boxes are generated, the RPN maps the candidate boxes back to the original image space and performs classification and coordinate regression, ultimately outputting a set of 256-channel candidate boxes along with their respective categories.
2.3.3. Cascade Detection Network
This research employs a cascaded detection architecture to accomplish breeding pig and ear tag object detection and instance segmentation. The cascaded detection network is designed with multiple stages connected sequentially to enhance detection and segmentation accuracy. The number of cascade stages in this study is set to 3, and stage loss weights of 1, 0.5, and 0.25 are allocated to balance the contributions of each stage. Before the cascaded detection, the RoIAlign operation extracts Region of Interest (RoI) features. This operation maps RoI feature regions of varying sizes to a fixed-size 7 × 7 feature map with an output channel of 256. The feature map strides are set to 4, 8, 16, and 32 to maintain consistency with the backbone network. This design effectively extracts discriminative features and handles targets of different scales, improving overall performance.
The cascade detection network comprises two fully connected layers: a classification network and a bounding box regression network. Its purpose is to predict the bounding box coordinates and categories of the RoI. The cascade detection network’s input and output channels are set to 256. In order to address the issues of class imbalance and uneven distribution of complex and easy samples in the training set, this paper incorporates the online hard example mining (OHEM) technique into the cascade classification softmax layer. The technique calculates the loss value for each sample, sorts them in descending order, and selects the top 25% as hard examples, while the remaining samples are considered easy examples. The weight coefficients for back-propagation of hard and easy examples are 1 and 0.25, respectively. The loss function is then recalculated, as shown in Equation (
7), to enhance the detection capability for more challenging objects.
represents the cascaded classification loss of the i-th sample, is the weight coefficient for the backward propagation of the sample, and denotes the mean loss.
In the cascade regression, a resampling mechanism is used to predict the precise position of object bounding boxes, and each sub-regressor consists of a fully connected layer. The original algorithm utilizes the non-maximum suppression (NMS) algorithm, which sorts all detection boxes with confidence scores higher than a threshold and then iterates through each box. The box is removed if the overlap between the box and subsequent boxes exceeds a predefined threshold (0.5). However, NMS may need to correct some incorrect boxes. This paper employs an improved non-maximum suppression algorithm called Soft-NMS to address the issue of highly overlapping proposed regions. Soft-NMS introduces dynamic weight coefficients as attenuation factors for softening the suppression strategy. It helps to overcome the misclassification caused by overlapping instances of breeding pigs. This approach allows more overlapped boxes to be retained and reduces the risk of removing correct instances.
After completing the cascade instance detection of breeding pigs and ear tags, it is necessary to generate binary masks of the same size as the input to locate the position and shape of the target objects. Initially, features are extracted from the feature map using four different strides—4, 8, 16, and 32—capturing object information at multiple scales. Subsequently, the RoIAlign operation is applied to extract features for each candidate region and map them to a 14 × 14 feature map. Finally, these features are transformed into a 256-dimensional feature space and input into a fully convolutional network to predict the segmentation masks for each candidate region. The network comprises four convolutional layers, with the input and output channels set to 256. This design ensures sufficient expressive power to learn and predict complex object shapes. This research’s predicted target categories consist of breeding pigs and ear tags. As a result, segmentation masks are generated for each category in the last layer.
2.3.4. Lost Ear Tag Detection
Based on instance segmentation, this study determines whether a breeding pig is in a tagged state by calculating the intersection area of masks. Initially, the experiment obtained the sets of masks for breeding pigs and ear tags in the image, denoted as
B and
E, respectively, assuming there are
n breeding pigs and
m ear tags recognized in the image; thus,
and
. For each element
in
B, we calculate its intersection area
with each element
in
E, as shown in Equation (
8). If
is greater than 0, it indicates that
intersects with an element from the set
E, implying that breeding pig
is wearing an ear tag. Conversely, it signifies that pig
is untagged, as shown in Equation (
9).
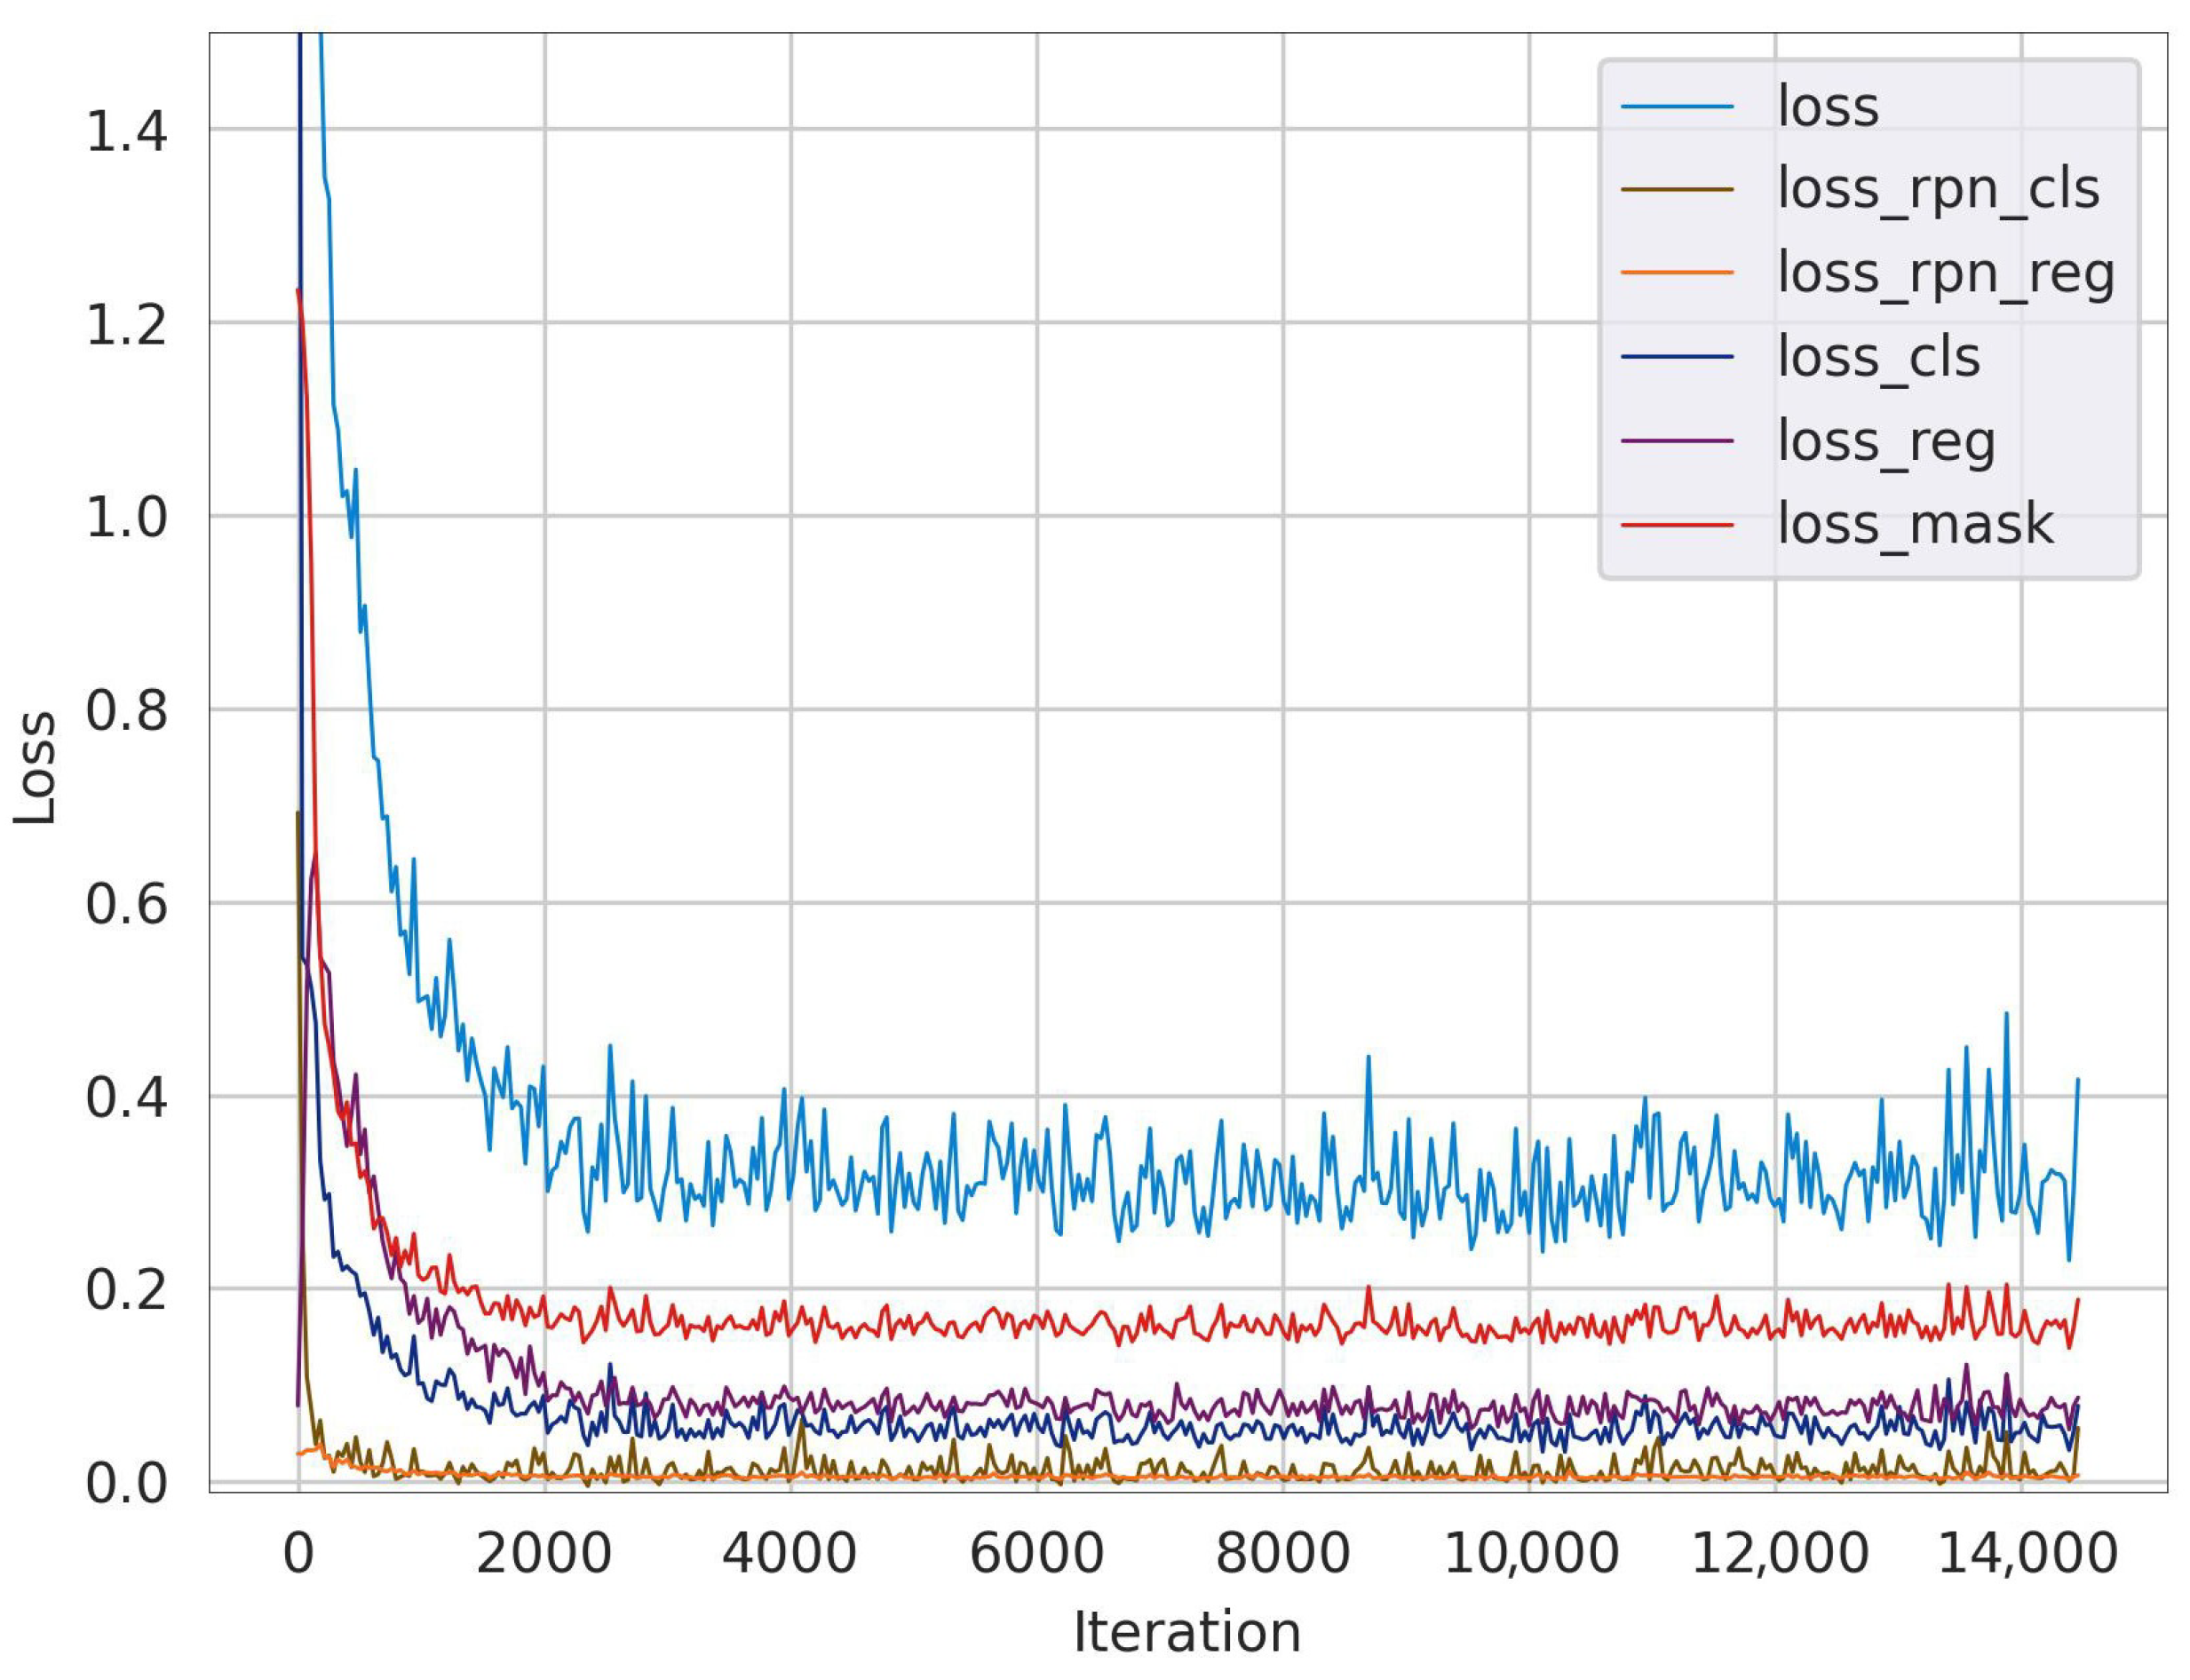
2.4. Design of Loss Function
The loss function is crucial in evaluating the model, as it measures the difference between predicted and actual values. In this study, the loss function consists of various components. Firstly, it includes the classification loss (
) and regression loss (
) of the Region Proposal Network. Additionally, it estimates the classification loss (
), mask loss (
), and regression loss (
) of the cascade detection. The calculation of
is made according to binary cross-entropy loss, while
is determined using smoothed L1 loss. Similarly,
and
are computed using pixel-level binary cross-entropy loss, and
is calculated using smoothed L1 loss. The overall loss is obtained by taking the weighted sum of these component losses, as shown in Equation (
10).
The weights for each cascade are set to 1, 0.5, and 0.25, respectively.
2.5. Evaluation Indicators of the Model
This study utilizes accuracy as the primary evaluation metric to assess the model’s performance. Additionally, bounding box detection mean accuracy (bbox mAP), instance segmentation mean accuracy (mask mAP), detection speed (fps), recall (R), and F1 score (
) are employed as auxiliary evaluation metrics. The mAP was calculated using the evaluation metric of the COCO dataset. Specifically, it calculates the average precision (AP) mean at different IoU thresholds ranging from 0.50 to 0.95 with an interval of 0.05. The AP at each IoU threshold is computed as the area under the precision-recall curve (IoU curve) bounded by the x-axis and the curve itself. Precision and recall are calculated using Equations (11) and (12), respectively; the mAP is then calculated using Equation (
13), and the F1 score is calculated using Equation (
14).
2.6. Experimental Platform and Parameter Settings
The experimental hardware platform used in this study was a server running the Ubuntu 20.04 operating system; it was equipped with two Intel(R) Xeon(R) Gold 6137 processors, 256 GB of RAM, and eight NVIDIA GeForce RTX 3090 graphics cards. The software environment included Miniconda3, Python 3.8.5, CUDA 11.7, Pytorch 2.0.0, and the MMDetection 2.28.2 deep learning framework. During the training process, stochastic gradient descent was employed as the optimizer with an initial learning rate of 0.02, a momentum coefficient of 0.9, and a weight decay coefficient of 0.0001. The input images were scaled to 1438 × 973 pixels, and the batch size was 24.
4. Discussion
Identifying breeding pigs through ear tag recognition is crucial for precise management of livestock farms; however, target identification based on machine vision still faces certain challenges. Previous researchers [
31,
32] have employed detectors for object recognition, but this approach is only suitable for low-density and limited-view scenarios. There are also studies [
33] that achieved high accuracy and efficiency in recognizing pigs from different perspectives using deep learning, but the detection accuracy decreases when dealing with heavily overlapping samples. Additionally, dust particles in the air of pigsties can deposit on camera lenses, affecting image quality and leading to false detections even when using models with higher precision and recall rates [
34]. In this study, the proposed method addresses issues such as misclassification of instances due to imbalanced distributions of pig and ear tag categories, as well as dense overlapping of pigs, by focusing on instance-level features, which enhances feature extraction capabilities and detection segmentation accuracy. Furthermore, image enhancement strategies are employed to mitigate the influence of environmental factors, resulting in improved detection performance of the model in real production environments.
According to the data presented in
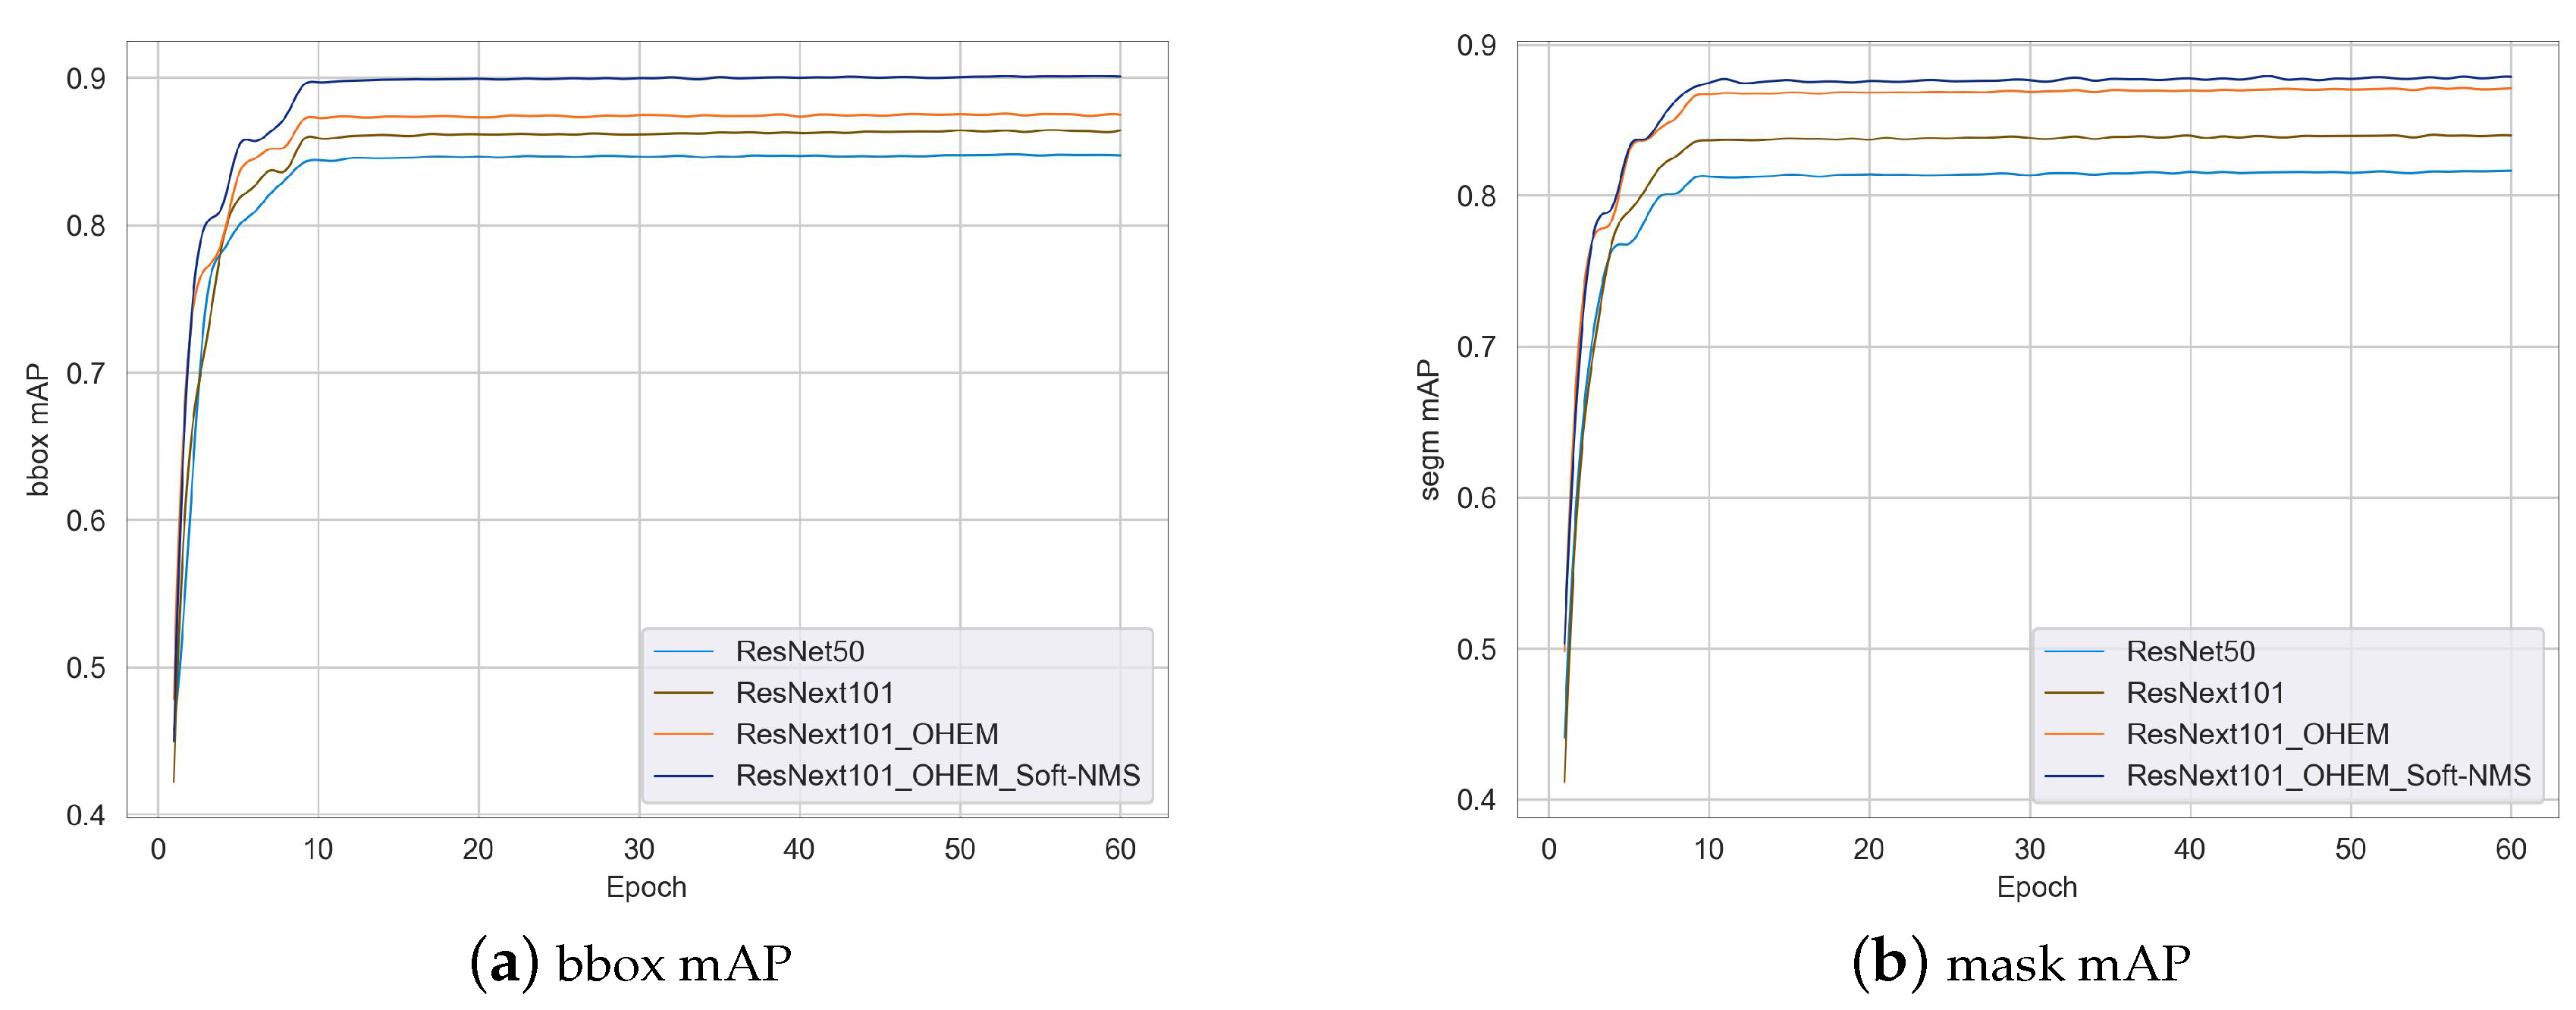
Table 2, it is clear that when VGG16 is used as the backbone network, the detection performance is noticeably lower than the other four backbone networks. This can be attributed to the fact that VGG16 has a shallower depth than the other networks, which limits its ability to extract features and capture deeper semantic information in complex environments. On the contrary, the ResNet network demonstrates the fastest detection speed thanks to its fewer convolutional layers while achieving the highest F1 score. When ResNeXt101 is used as the backbone network, it achieves a detection rate of 7.86 frames per second; it also shows improved bbox mAP, mask mAP, and R metrics compared to VGG16, with an increase of 8.55, 7.69, and 1.12 percentage points, respectively. The effectiveness of ResNeXt101 can be attributed to its deeper backbone network, which efficiently utilizes multi-scale information in the cascaded detection process, resulting in superior detection performance. Additionally, the 32-branch strategy employed in the residual blocks of ResNeXt101 effectively preserves fine-grained details. Therefore, using ResNeXt101 as the backbone network in Cascade Mask R-CNN is more suitable for detecting breeding pigs’ lost ear tags.
Table 3 shows that the improvement strategy significantly improves the bbox mAP and mask mAP, achieving a bbox mAP of 90.07% and a mask mAP of 87.84%. From
Table 4, it is evident that the model effectively detects and identifies breeding pigs and ear tags, significantly improving the detection accuracy of ear tags and indicating that the OHEM technique can optimize the detection accuracy of minority class samples caused by imbalanced dataset categories. However, it is worth noting that the introduced improvements result in increased computational requirements, leading to a larger model size of 143.85 MB and a decrease in fps to 6.79. With an average image processing time of 0.147 s, real-time detection of breeding pigs’ lost ear tag can still be achieved.
Table 5 shows that RGB three-channel images collected during the daytime contain more information than grayscale images collected at night; therefore, the overall detection accuracy is higher for the daytime data group. In breeding pig activity images, occlusion or blurring of ear tags often leads to incorrect detection or omission, resulting in the phenomenon that, within both the daytime and nighttime groups, the stationary group outperforms the mixed group, which is superior to the activity group.
Due to limitations in experimental conditions, this study focuses on 2- to 3-month-old pigs, taking into account the differences in ear morphology and ear-to-body proportion among different breeds and age groups of pigs; therefore, all conclusions drawn are solely based on the pigs involved in this experiment. Moving forward, the research will concentrate on three main areas: firstly, streamlining the network model to enhance detection efficiency; secondly, implementing a target tracking algorithm to enable real-time tracking and tagging of pigs with lost ear tags; lastly, developing a prediction model for lost ear tags that utilizes relevant features as input, which will facilitate lost ear tag monitoring and early warning throughout the entire business process of pig farming.


