Article

Different Response of Soil Microbial Carbon Use Efficiency in Compound of Feldspathic Sandstone and Sand

1
Key Laboratory of Degraded and Unused Land Consolidation Engineering, The Ministry of Natural Resources, Xi’an 710075, China
2
College of Urban and Environmental Sciences, Northwest University, Xi’an 710127, China
*
Authors to whom correspondence should be addressed.
These authors contributed equally to this work.
Agriculture 2023, 13(1), 58; https://doi.org/10.3390/agriculture13010058
Submission received: 20 November 2022 / Revised: 15 December 2022 / Accepted: 22 December 2022 / Published: 24 December 2022
(This article belongs to the Special Issue Agronomic Management of Crops in Arid and Semi-arid Environments)

Abstract

:
The stoichiometry of efficient soil microbial carbon use is a sensitive index for measuring changes in soil quality and plays a crucial role in research on ecological stoichiometry in the soil nutrient cycle. To further understand the effect of feldspathic sandstone and sand compound ratios on microbial carbon use efficiency (CUE), we simulated the field conditions of the feldspathic sandstone-sand compound layer in the Mu Us sandy land and analyzed the soil C:N:P ratio, microbial biomass, extracellular enzyme activity, and microbial carbon use efficiency in soils with different compound ratios. The results demonstrated that an increase in the feldspathic sandstone content had insignificant effects on the soil C:N:P ratio. The maximum values for microbial biomass nitrogen (MBN) and microbial biomass phosphorus (MBP) were observed at compound ratios of 1:5 and 1:2, respectively. Calculations of microbial carbon use efficiency and vector analysis revealed that the microbial carbon use efficiency increased as the feldspathic sandstone content increased, P limitation existed in all compound soils, and soil with a 1:1 compound ratio may be substantially less limited. In conclusion, our research indicated that adding feldspathic sandstone to sand improved soil quality, and the compound ratio affected soil microorganisms; nevertheless, it did not significantly change soil nutrient restriction. Our study provides a theoretical basis for the development and utilization of desert land resources.

1. Introduction

Mu Us Sandy Land spans a total area of 4.22 × 10⁴ km2 and is one of the four major sandy lands in China [1]. Soil degradation and water erosion render ecosystems in this area very fragile, and low energy and nutrient unavailability limit soil microbial activity and primary plant productivity, further restricting agriculture-forestry development in the region [2]. In this fragile area, sand and feldspathic sandstone exhibit an interphase distribution [3]. Sandy soil is loose with poor water and fertilizer retention, making it prone to erosion [2]. Compared to sand, feldspathic sandstone in this area is as hard as stone when dry, while it is as soft as mud when wet. It has been proposed that the compound of feldspathic sandstone and sand soil are somewhat complementary in nature, which compensates for the shortcomings of the structure of sandy soil that can be further used for planting [4,5]. Since 2009, soil formation by feldspathic sandstone and sand on the Mu Us sandy land has significantly improved the soil texture and physicochemical properties and has produced good ecological benefits [5]. However, studies on compound soils generally focus on soil physical and chemical constraints on biogeochemical processes, while constraints on soil microbial properties have received less attention [6,7].
Empirical evidence shows that soil microorganisms regulate the efficiency of nutrient conversion between plants and soil [8] and play an important role in plant–soil systems. Soil microorganisms convert absorbed nutrients into biomass [9] and release biomass carbon, nitrogen, or phosphorus into the rhizosphere after cell death, thereby making nutrients available for plant use [10].
The carbon use efficiency (CUE) represents the ability of microorganisms to convert absorbed C into biomass [9]. However, changes in nutrient levels, as well as environmental factors, can have a big effect on soil microbial CUE. According to a previous study, as soil nutrient availability improved, soil microbial CUE rose [11], and decreases with prolonged drought [12]. In addition, the actual growth of microorganisms is governed by their stoichiometric balance [9], which shows that microbial carbon use efficiency varies with variation in the stoichiometric ratio of essential elements C, N, and P [13]. For example, Widdig et al. [14] found that microbial CUE was mainly explained by the C:N ratio. Additionally, previous studies have clarified that the stoichiometric control of extracellular enzymes mediates microbial nutrient acquisition from environmental organic matter in an ecosystem [15,16].
It has been determined that a number of extracellular enzymes can serve as helpful indicators of nutritional deficiency and microbial nutrient demand [13], such as β-1,4-glucosidase (BG) as an indicator of carbon demand, β-1,4-N-acetylglucosaminidase (NAG) and leucine aminopeptidase (LAP) as indicators of nitrogen demand, and alkaline phosphatase (AKP) as an indicator of phosphorus demand. In barren soil, microorganisms acclimate to stress by reassigning key resources (energy, C, N, and P) for acquisition mechanisms rather than growth [13], meaning that extracellular enzymatic activities are indicators of microorganisms that meet their metabolic nutrient demands in response to environmental nutrient availability. In general, microbial reactions to multiple soil conditions for nutrient cycling are complex, especially under special soil conditions. Therefore, an assessment of how the microbial community invests their energy for C, N, and P acquisition in feldspathic sandstone and sand soil is a useful way to understand microbial CUE and microbial mechanisms in compound soils. Given that compound of feldspathic sandstone and sand soil demonstrated potential for enhancing physiochemical soil characteristics and crop yield in Mu Us Sandy Land, it deserves further research.
To illustrate the changes in the microbial CUE of feldspathic sandstone and sandy soil, we examined soil nutrient content, microbial biomass, extracellular enzyme activity, and microbial CUE in feldspathic sandstone and sandy soil at ratios of 1:1, 1:2, and 1:5. We hypothesized that soil nutrient contents, microbial biomass, and enzyme activities differ between different compound soils and further affect the stoichiometry of carbon use efficiency. The aim of this study was to (1) assess changes in the stoichiometry of soil nutrient content, microbial biomass, and microbial enzyme activities in compound soils; and (2) explore the differences in CUE changes in soils with different compound ratios.

2. Materials and Methods

2.1. Field Sites and Experimental Design

The long-term fixed experiments, initiated in 2009, were situated in the Shaanxi Provincial Land Engineering Construction Group Fuping pilot base (109°11′ E, 34°42′ N). To simulate the field conditions of the compound layer in the Mu Us sandy land and according to the usual thickness of the cultivated layer, three proportions of feldspathic sandstone-sand compound materials were filled at 0–30 cm, and all sand was filled at 30–70 cm. In this experiment, three treatments were designed, including volume ratios of feldspathic sandstone to the sand of 1:5 (C1), 1:2 (C2), and 1:1 (C3), with three replicates per treatment, and nine (2 m × 2 m) experimental plots were arranged. The test plot was arranged in a “one” shape from south to north according to the site conditions, light, micro-topography, and other factors.
The cropping pattern used in the experiment can be found in Guo and Shi [17]. Briefly, the rotation mode of wheat and maize was adopted at the experimental site. Corn was planted in June and harvested in October of each year. Wheat was planted in early November and harvested in late May of the next year. Meanwhile, the management mode used the traditional water and fertilizer management modes of local farmers, with the fertilizer applied each time N 255 kg/ha, P2O5 180 kg/ha, and K2O 90 kg/ha.

2.2. Soil Sampling

In May 2022, after harvesting wheat, feldspathic sandstone and sand compound soil samples were collected at a depth of 0–10 cm in the study area. In each plot, we used a soil drill to collect 10 soil cores with an “S” shape and then uniformly mixed them into one sample. Each sample was sieved through a 2 mm screen. The part of the sample was stored in a refrigerator at −20 °C for subsequent determination of soil extracellular enzyme activity and microbial biomass, and the rest was air-dried at room temperature to determine the basic soil physical and chemical properties.

2.3. Soil Physicochemical Properties, Microbial Biomass, and Extracellular Enzyme Activity Analysis

The soil pH was determined in a 1:2.5 soil-to-water suspension using a pH meter. The potassium dichromate external heating method was used to determine soil organic carbon (SOC) [18]. To determine soil total nitrogen (TN), samples were digested with sulfuric acid and analyzed using a Kjeldahl apparatus [19]. Soil total phosphorus (TP) content was determined using sulfuric acid-perchloric acid digestion and the molybdenum-antimony anti-colorimetric method [20]. Microbial biomass carbon (MBC), microbial biomass nitrogen (MBN), and microbial biomass phosphorus (MBP) were determined using the chloroform fumigation extraction method [21,22,23]. Fluorometric techniques were used to measure four soil extracellular enzyme activities: C-acquiring enzymes (β-1,4-glucosidase, BG), N-acquiring enzymes (β-N-acetylglucosaminidase, NAG; Leucine aminopeptidase, LAP), and P-acquiring enzymes (alkaline phosphatase, AKP) [24]. Briefly, the principle of enzyme activity determination is that enzymes hydrolyze artificial substrates and produce 4-Methylumbelliferone (MUB), which can be determined by fluorescence [25]. Enzyme C:N, C:P, and N:P ratios were calculated using ln (BG):ln (NAG + LAP), ln (BG):ln (AKP), and ln (NAG + LAP):ln (AKP), respectively.
We used vector analysis (vector length, VL; vector angle, VA) to quantify and visualize the relative C, N, and P controls on soil microbial communities. as follows [26]:
Vector   length = SQRT BG BG + AKP 2 + BG BG + NAG 2
Vector   angle = DEGREES   ATAN 2 BG BG + AKP , BG BG + NAG
When the vector length was longer, indicating the larger carbon limitation; angles >45° indicate P limitation, and angles <45° indicate N limitation. Then, to explore how microbes change their metabolic mechanisms in response to elemental constraints, we calculated CUE as follows [27,28]:
CUE C : X = CUE max × S C : X S C : X + K X
S C : X = 1 EEA C : X × MBC MBX × SOC TX
CUE geomean = CUE C : N × CUE C : P
where CUEmax is a constant (0.6) that indicates the upper limit of microbial growth efficiency. EEAC:X represents the ratio of different enzyme activities, including those of carbon and nitrogen enzymes, BG:(NAG+LAP), and carbon and phosphorus enzymes, BG:AKP. Kx is the half-saturation constant (0.5). MBX represents MBN or MBP, and TX represents TN or TP.

2.4. Statistical Analyses

Data analyses were completed using Microsoft Excel 2021 and R4.0.2 and visualized using R4.0.2 based on packages of “ggplot2”. We used one-way ANOVA to assess soil properties and stoichiometry based on the packages of “stats”. We calculated SOC:TN (C:N), SOC:YP (C:P), TN:TP (N:P), lnBG:ln(NAG+LAP), lnBG:lnAKP, ln (NAG+LAP):lnAKP, VL, and VA for all cases.

3. Results

3.1. Physicochemical Properties and Stoichiometry of Soil in Different Compound Ratios

Our results showed that soil pH in both soils was weakly alkaline, and pH, SOC, and MBC did not show significant changes in feldspathic sandstone and sandy soil (p > 0.05) (Table 1). Soil TN and TP were highest in C3 and lowest in C1, with TN ranging from 0.21 g/kg in C3 to 0.15 g/kg in C1 and TP from 0.31 g/kg in C3 to 0.25 g/kg in C1. Furthermore, our results showed that chemical stoichiometry (C:N, C:P, and N:P) did not significantly change among the different compound soils (p > 0.05) (Table 1). For the microbial biomass indicated, MBC did not show significant changes among different compound soils (p > 0.05), whereas MBN and MBP did (p < 0.01). MBN was highest in C1, and MBP was highest in C2 and lowest in C3 (Table 1).

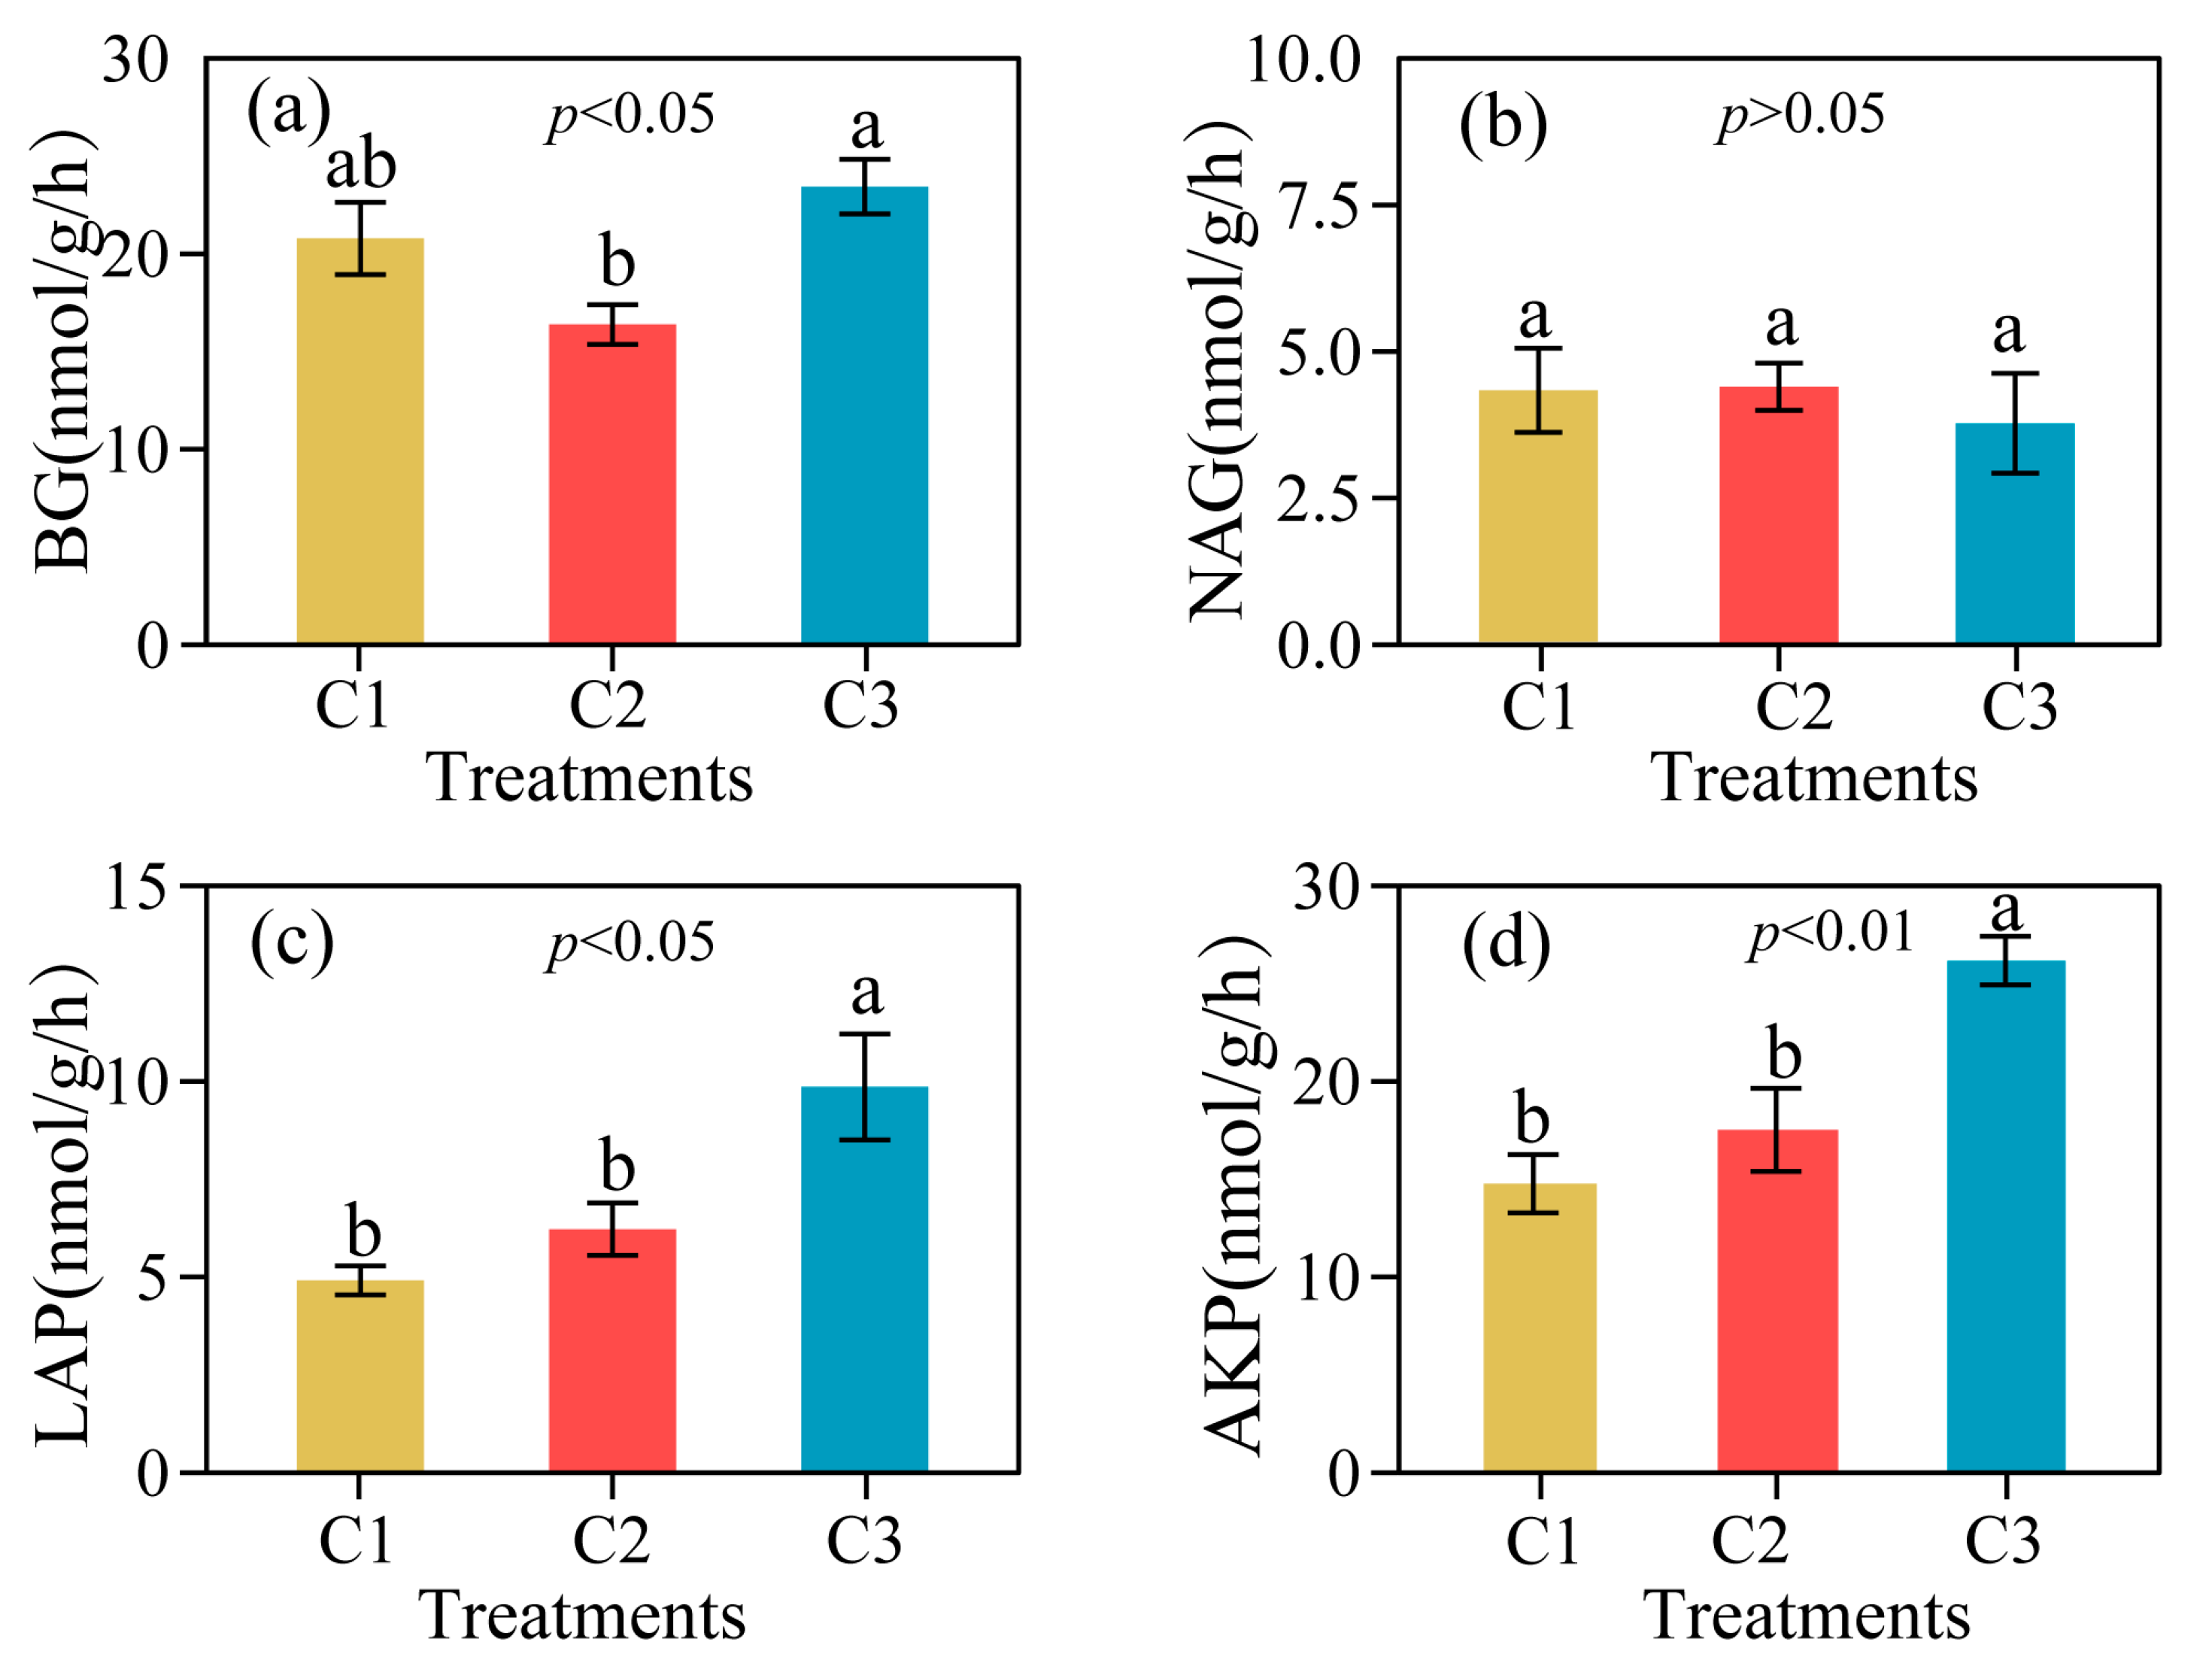
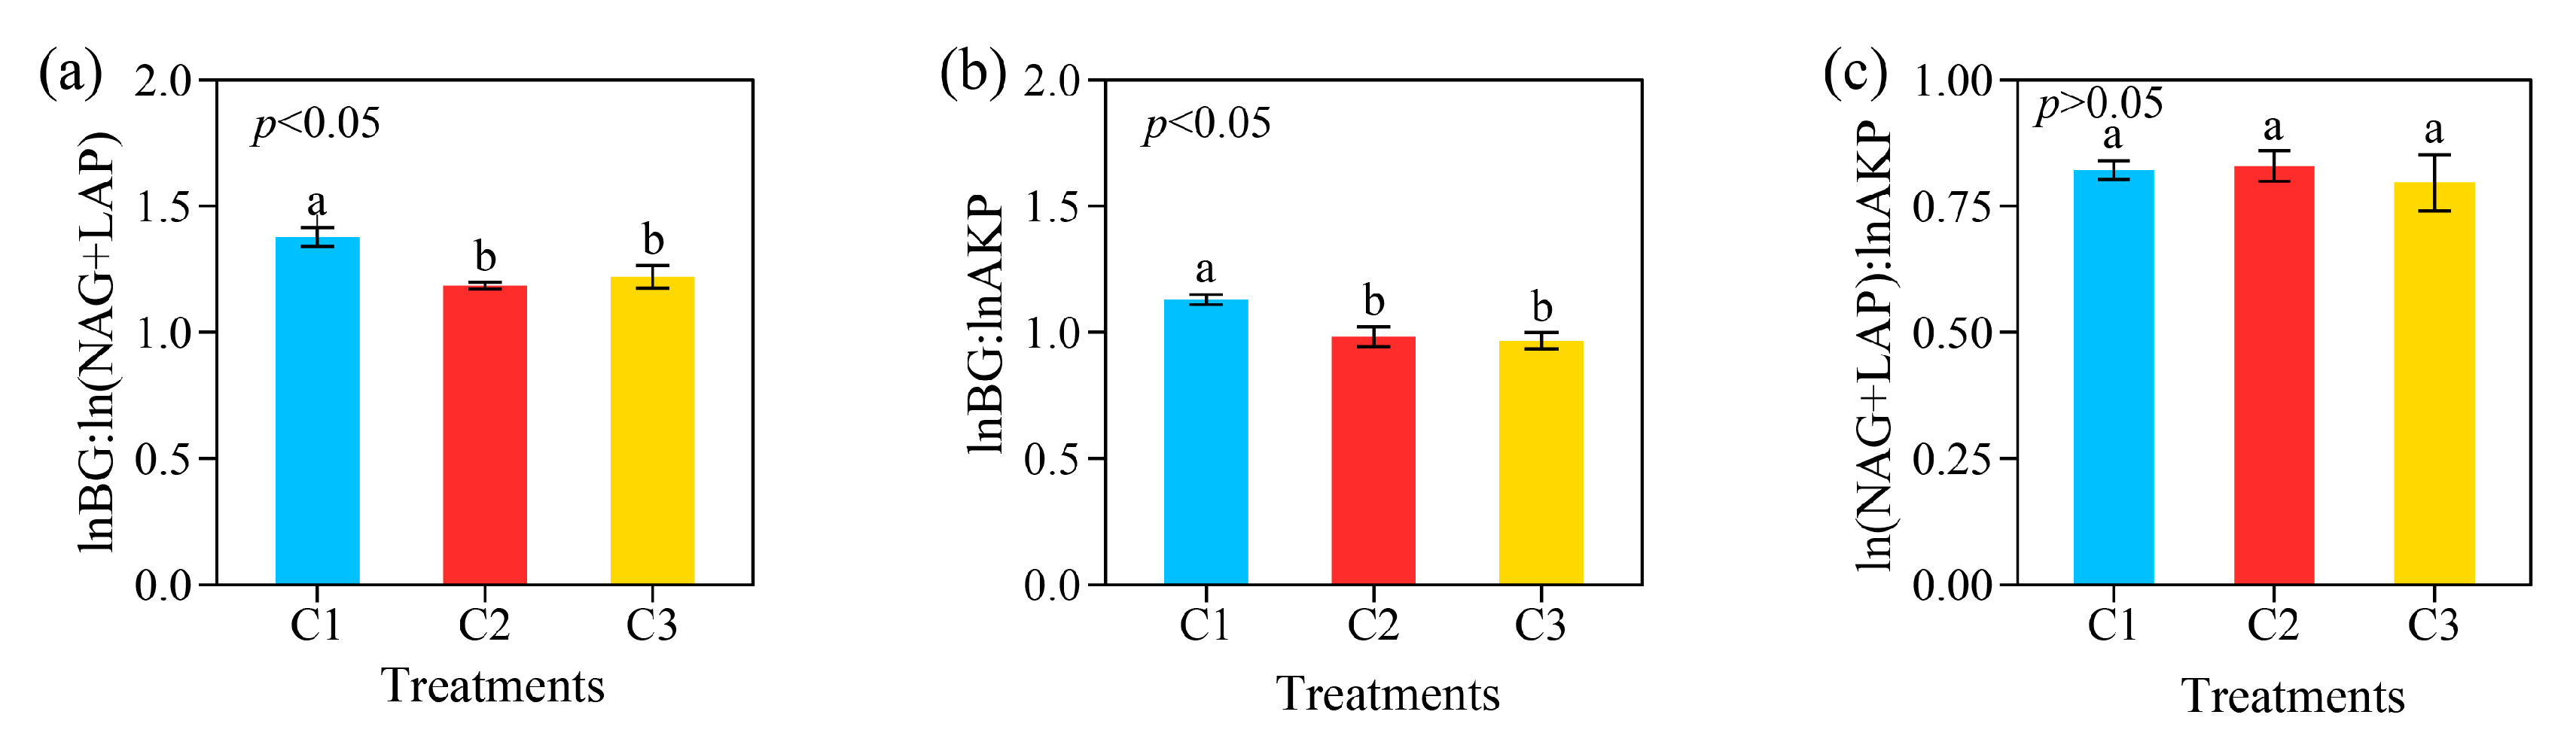
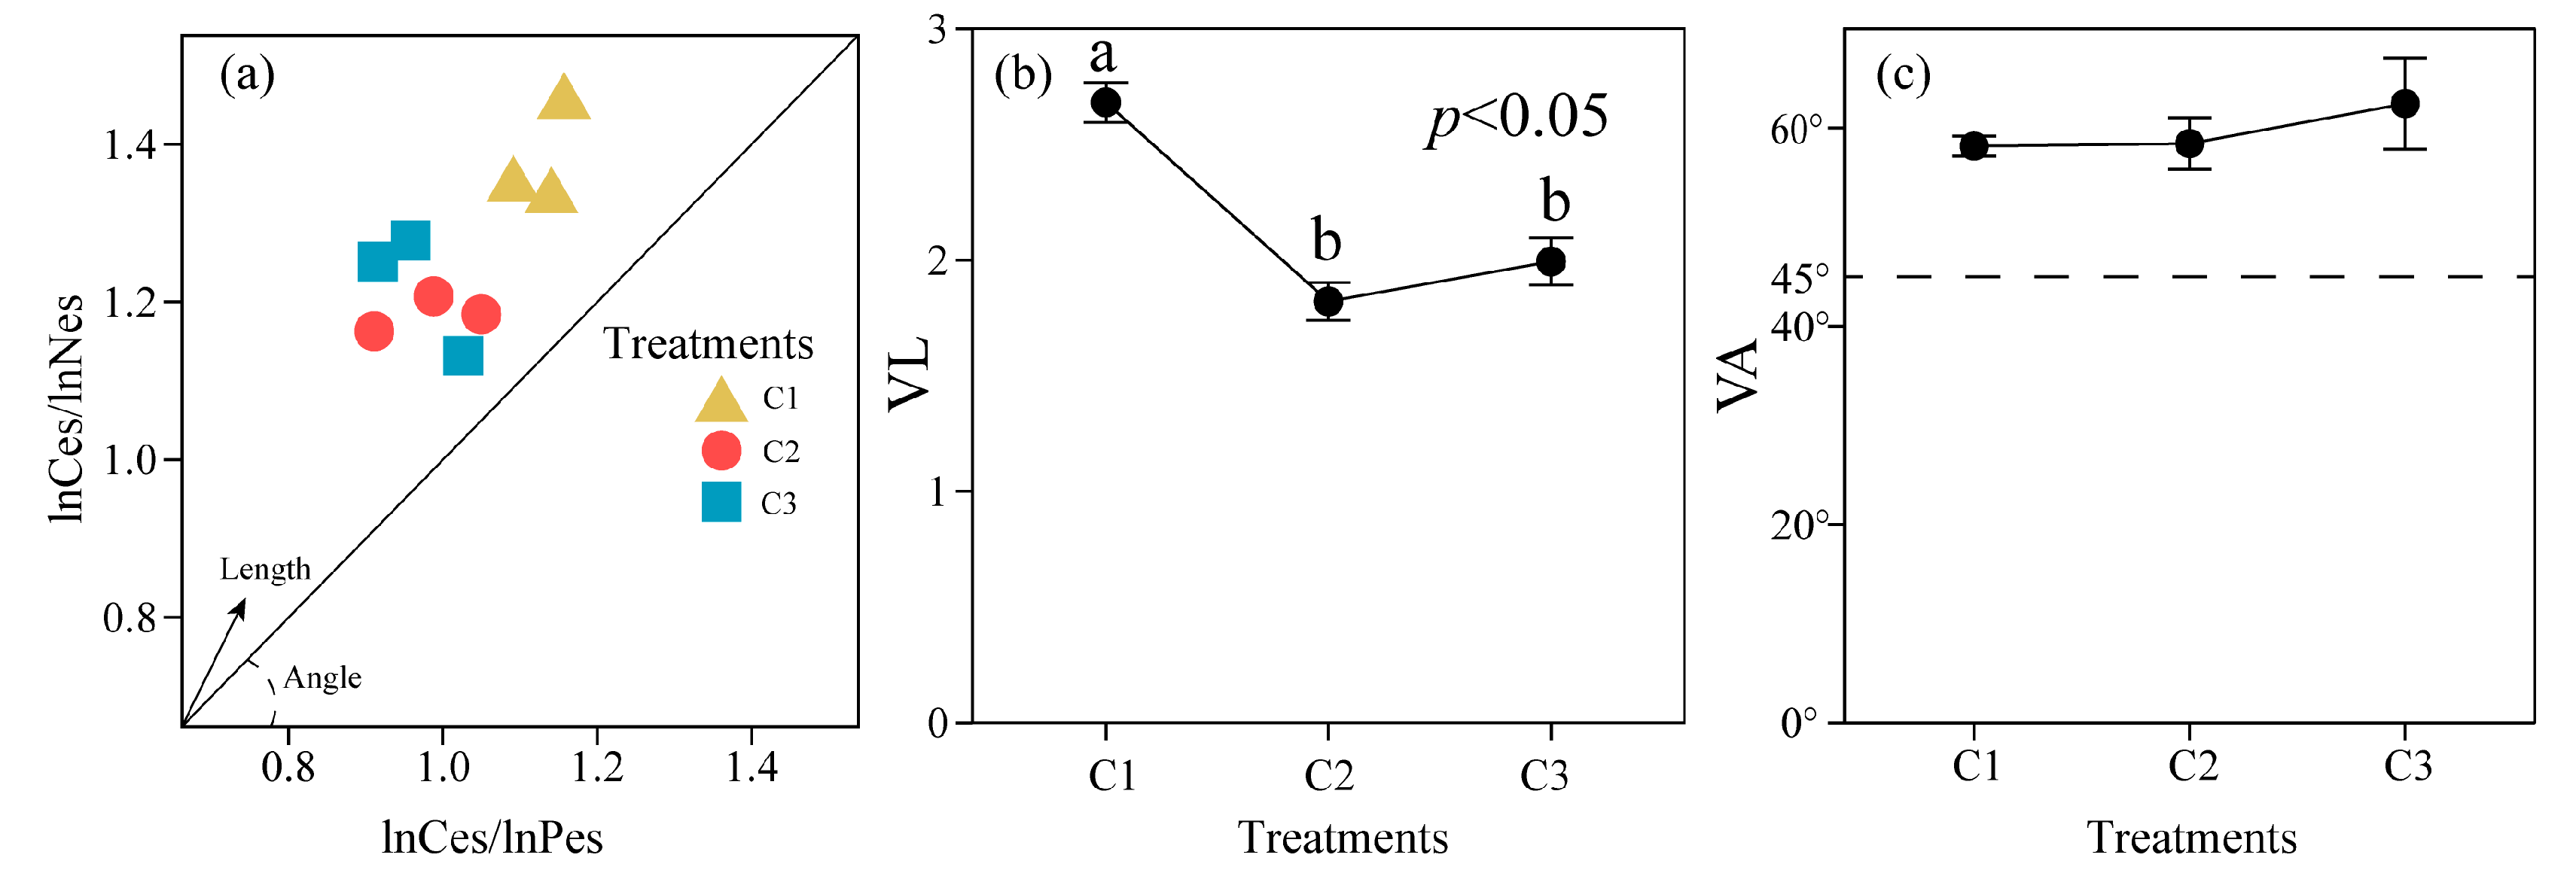
3.2. Extracellular Enzyme Activity and Its Soil Stoichiometry in Different Compound Ratios

Our results showed that most enzyme activities of C, N, and P demands were significantly different among the three feldspathic sandstone and sand compound soils (Figure 1). For the carbon-demand enzymes, BG was highest in C3 and lowest in C2 (Figure 1a). For N-demand enzymes, NAG did not show significant changes among the three compound ratios of soil, and LAP was highest in C3 and lowest in C1 (Figure 1b,c). For P-demand enzymes, AKP was highest in C3, compared with C2 and C1, which increased by 2.75 nmol/g/h and 8.66 nmol/g/h, respectively (Figure 1d). Additionally, the ln (BG):ln (LAP + NAG):ln (AKP) ratio was 1.13:0.82:1 in C1, 0.98:0.83:1 in C2, and 0.97:0.79:1 in C3.
Compared to C3, lnBG:ln (NAG+LAP) and lnBG:lnAKP were higher in C1 (Figure 2a,c). However, the ln (NAG+LAP):lnAKP ratios did not show significant trends with an increase in feldspathic sandstone (Figure 2c). The vector length (VL) was significantly different between the three treatments, with the highest length in C1 (Figure 3a,b). The vector angle (VA) was greater than 45°, indicating P limitation in the different compound soils (Figure 3a,c).

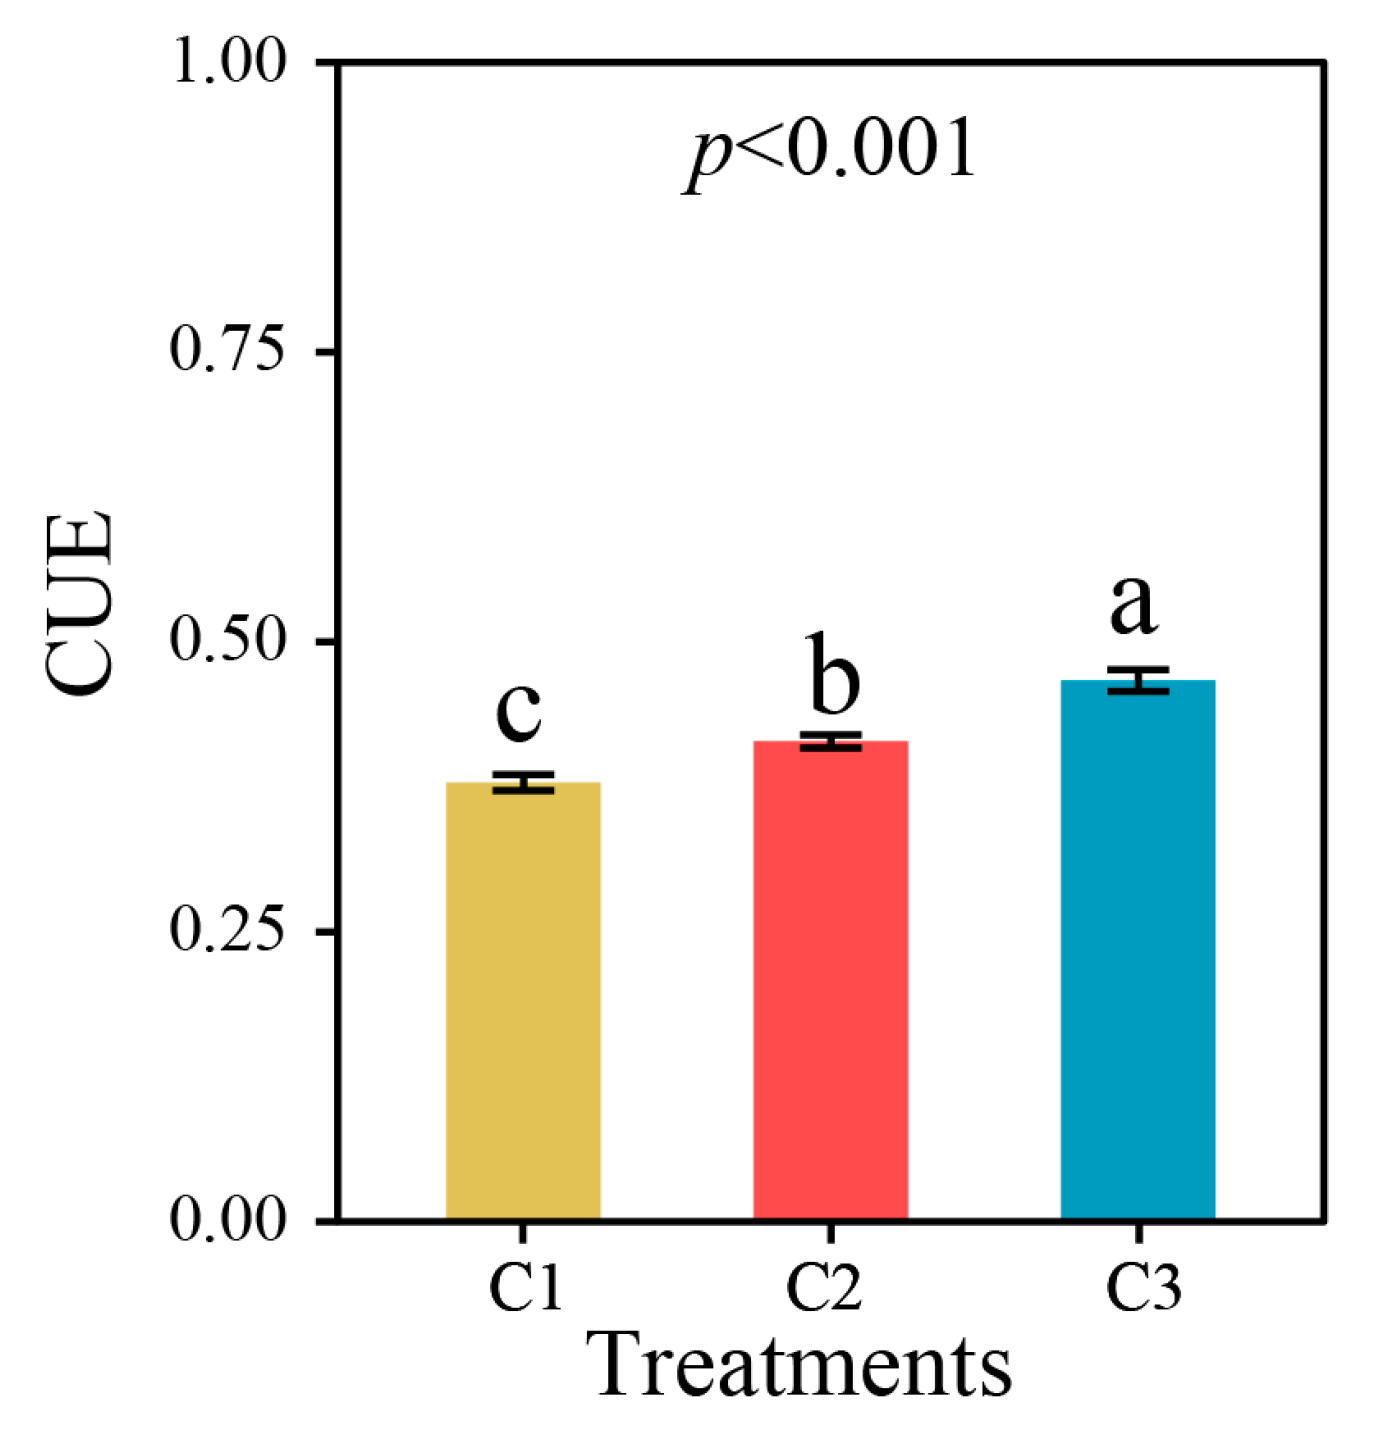
3.3. Microbial Carbon Use Efficiency of Soil in Different Compound Ratios

Our results showed that microbial carbon use efficiencies were significantly different among the compound ratios (Figure 4). CUE showed increasing trends in the three compound soils. The lowest value of CUE was 0.38 in C1, while the highest value of CUE was 0.47 in C3, which was significantly (p < 0.001) higher than C1 by 0.12 (Figure 4).

4. Discussion

4.1. Variation of the Stoichiometric Ratio in Different Compound Ratio Soils

Our results showed that TN and TP were higher in C3, and TN and TP showed a significant increase in soils with higher feldspathic sandstone-to-sand ratios. In line with our results, Guo et al. [29] revealed that after 11 years of mixed soil use, the compound soil with a mixing ratio of 1:1 had the highest TN content. This may be because as the feldspathic sandstone content gradually increases, the capacity of water holding in compound soil increases, which can promote an increase in soil nitrogen content [30]. Moreover, our results demonstrated that the C:N and C:P ratios in C3, C2, and C1 were all lower than the ratios on a global scale (16.8) [31]. Additionally, C:N, C:P, and N:P did not show significant changes in different compound soils (Table 1), indicating that these ratios did not change with changes in feldspathic sandstone-to-sand ratios.
One possible reason for the insignificant change in our results is that our experimental site had the same weather conditions and field management measures. Some studies have validated that soil C, N, and P stoichiometric ratios are affected by natural factors such as climate and soil physicochemical properties [32,33,34] and by human activities such as type of land use and field management measures [35]. Furthermore, our results showed that the range of soil C:N ratio in the three compound ratio soils was 9.41–10.15, which was in the range of Chinese cropland [36]. Therefore, we believe that the soil compounded by feldspathic sandstone and sand is suitable for the cropland under the corn-wheat rotation mode and fertilization.

4.2. Explanation of the Change in Microbe Biomass and Extracellular Enzyme Activity

In our study, MBN and MBP were significantly different in different compound soils, indicating that different feldspathic sandstone-to-sand ratios caused different microbial biomass. According to prior research that supports our findings, soil physical characteristics significantly influence soil MBN and MBP [37,38]. However, MBC did not show a significant difference, with the highest value observed in C3. Our results were consistent with those reported by Guo et al. [29]. A possible explanation is that adding different feldspathic sandstone amounts to sand changed the soil physiochemical properties, providing different nutrients such as C, N, and P for microbes to change the soil MBC, MBN, and MBP.
Wang et al. [39] supported this interpretation. The soil texture gradually changed from sandy to silty loam as the amount of feldspathic sandstone and clay, and silt particles increased. [1]. Changes in soil texture significantly increased the cumulative mineralization rate of SOC. As an energy source for microorganisms, the mineralization degree of SOC affects soil nutrients’ availability [40]. Thus, the improvement in nutrient availability promoted the reproduction of soil microorganisms and increased the soil microbial biomass C, N, and P.
Furthermore, lnBG:ln (LAP + NAG) decreased with more feldspathic sandstone, which suggests that the soil N was relatively sufficient in the 1:1 soil. The enzyme stoichiometries of ln (BG):ln (LAP + NAG):ln (AKP) were 1.13:0.82:1, 0.98:0.83:1, and 0.97:0.79:1, respectively. Contrary to our results, Sinsabaugh et al. [24] demonstrated that the mean enzyme stoichiometric C:N:P ratio at the global level is approximately 1:1:1. This may imply nutrient limitation in the compound soils, which can be explained by the resource allocation theory proposed by Zhong et al. [28]. Specifically, microbes are anticipated to best spend their available resources toward acquiring the most limiting resource [41,42,43]. Meanwhile, we found that enzyme activity and stoichiometry were not significantly correlated with pH. This is inconsistent with a previous study that revealed significant correlations between soil pH and enzyme activity and its stoichiometry but consistent with the results of Feng et al. [1], indicating that pH is not an important index for feldspathic sandstone and sand compound soils.

4.3. Variation of Microbial Carbon Use Efficiency in Different Compound Ratio Soils

Our results showed that CUE increased with an increase in feldspathic sandstone in compound soils (Figure 4), implying a gradual decrease in nutrient limitation. Meanwhile, we found that the vector length was shorter in C2 and C3 than that in C1 (Figure 3a), indicating that increasing the proportion of feldspathic sandstone in compound soil can reduce the carbon limitation. Previous studies demonstrated that adding feldspathic sandstone to sandy soil significantly changes its physical properties. A greater proportion of feldspathic sandstone leads to filled non-capillary pores between sand, promoting the formation of soil aggregate structures and the accumulation of potentially mineralizable organic carbon [29], which is accompanied by a decrease in soil C deficiency. However, a previous meta-analysis showed that increased clay content can lead to increased substrate adsorption, reducing substrate availability to microbes. [44]. Therefore, soil microorganisms improved CUE to cope with the reduced C availability.

5. Conclusions

Our research demonstrated that variations in the proportion of feldspathic sandstone in compound soils had an insignificant impact on the stoichiometry of the soil C, N, and P contents. The MBN and MBP levels were significantly different, indicating that the compound soil promoted their accumulation. Additionally, soil lnBG:ln (LAP + NAG) decreased with a greater feldspathic sandstone content in the sand; this suggests that soil N was relatively sufficient in the 1:1 soil. In addition, microbial carbon use efficiency increased as feldspathic sandstone content increased, implying that increasing feldspathic sandstone content alleviated compound soil nutrient limitations but increased carbon limitations to some extent. A 1:1 compound ratio resulted in moderate nutrient restriction. Overall, adding feldspathic sandstone to sandy soils improved the physicochemical properties and reduced soil nutrient limitations, which provides new light on the application of feldspathic sandstone in agriculture and allows a decrease application of industrially produced mineral fertilizers. Our study presented a reference for the utilization of desert land resources.

Author Contributions

Conceptualization, L.Z. and F.Z.; methodology, L.Z. and F.Z.; validation, S.Z. and Y.Z.; investigation, Y.Z., L.C. and J.W.; formal analysis, S.Z., Y.Z., L.C. and J.W.; writing—original draft preparation, S.Z., Y.Z., L.C. and J.W.; visualization, J.W.; writing—review and editing, L.Z. and F.Z.; supervision, F.Z. and L.Z. All authors have read and agreed to the published version of the manuscript.

Funding

This research was funded by the Key Laboratory of Degraded and Unused Land Consolidation Engineering, Ministry of Land and Resources (Grants: SXDJ2018-02).

Institutional Review Board Statement

Not applicable.

Data Availability Statement

Not applicable.

Conflicts of Interest

The authors declare no conflict of interest.

References

  1. Feng, X.; Zhang, L.; Zhao, F.; Bai, H.; Doughty, R. Effects of Mixing Feldspathic Sandstone and Sand on Soil Microbial Biomass and Extracellular Enzyme Activities-A Case Study in Mu Us Sandy Land in China. Appl. Sci. 2019, 9, 3963. [Google Scholar] [CrossRef] [Green Version]
  2. Zhang, R.Q.; Sun, Z.H.; Li, G.; Wang, H.Y.; Cheng, J.; Hao, M.D. Influences of water chemical property on infiltration into mixed soil consisting of feldspathic sandstone and aeolian sandy soil. Sci. Rep. 2020, 10, 19497. [Google Scholar] [CrossRef] [PubMed]
  3. Zhang, K.; Xu, M.Z.; Wang, Z.Y.; Duan, X.H.; Bi, C.F. Ecological Impacts of Seabuckthorn in the Pisha Sandstone Area. In Advances in Water Resources and Hydraulic Engineering; Springer: Berlin/Heidelberg, Germany, 2009; pp. 1102–1107. [Google Scholar]
  4. Wang, N.; Xie, J.C.; Han, J.C. A Sand Control and Development Model in Sandy Land Based on Mixed Experiments of Arsenic Sandstone and Sand: A Case Study in Mu Us Sandy Land in China. Chin. Geogr. Sci. 2013, 23, 700–707. [Google Scholar] [CrossRef] [Green Version]
  5. Zhang, W.; Han, J.; Wang, H.; Du, Y.; Tong, W. The improvement effects of softrock on sandy soil in Mu Us sandy land. J. Arid. Land Resour. Environ. 2015, 29, 122–127. [Google Scholar]
  6. Zhang, L.; Ban, J. Analyzing the Sand-fixing Effect of Feldspathic Sandstone from the Texture Characteristics. IOP Conf. Ser. Earth Environ. 2018, 108, 032039. [Google Scholar] [CrossRef]
  7. Li, J.; Tong, X.G.; Awasthi, M.K.; Wu, F.Y.; Ha, S.; Ma, J.Y.; Sun, X.H.; He, C. Dynamics of soil microbial biomass and enzyme activities along a chronosequence of desertified land revegetation. Ecol. Eng. 2018, 111, 22–30. [Google Scholar] [CrossRef]
  8. Xu, M.P.; Jian, J.N.; Wang, J.Y.; Zhang, Z.J.; Yang, G.H.; Han, X.H.; Ren, C.J. Response of root nutrient resorption strategies to rhizosphere soil microbial nutrient utilization along Robinia pseudoacacia plantation chronosequence. For. Ecol. 2021, 489, 119053. [Google Scholar] [CrossRef]
  9. Adingo, S.; Yu, J.R.; Liu, X.L.; Li, X.D.; Jing, S.; Xiaong, Z. Variation of soil microbial carbon use efficiency (CUE) and its Influence mechanism in the context of global environmental change: A review. PeerJ 2021, 9, e12131. [Google Scholar] [CrossRef]
  10. Richardson, A.E.; Simpson, R.J. Soil Microorganisms Mediating Phosphorus Availability. Plant Physiol. 2011, 156, 989–996. [Google Scholar] [CrossRef] [Green Version]
  11. Manzoni, S.; Taylor, P.; Richter, A.; Porporato, A.; Agren, G.I. Environmental and stoichiometric controls on microbial carbon-use efficiency in soils. New Phytol. 2012, 196, 79–91. [Google Scholar] [CrossRef]
  12. Siebielec, S.; Siebielec, G.; Klimkowicz-Pawlas, A.; Galazka, A.; Grzadziel, J.; Stuczynski, T. Impact of Water Stress on Microbial Community and Activity in Sandy and Loamy Soils. Agronomy 2020, 10, 1429. [Google Scholar] [CrossRef]
  13. Tapia-Torres, Y.; Elser, J.J.; Souza, V.; Garcia-Oliva, F. Ecoenzymatic stoichiometry at the extremes: How microbes cope in an ultra-oligotrophic desert soil. Soil Biol. Biochem. 2015, 87, 34–42. [Google Scholar] [CrossRef]
  14. Widdig, M.; Schleuss, P.M.; Biederman, L.A.; Borer, E.T.; Crawley, M.J.; Kirkman, K.P.; Seabloom, E.W.; Wragg, P.D.; Spohn, M. Microbial carbon use efficiency in grassland soils subjected to nitrogen and phosphorus additions. Soil Biol. Biochem. 2020, 146, 107815. [Google Scholar] [CrossRef]
  15. Sinsabaugh, R.L.; Shah, J.J.F. Ecoenzymatic Stoichiometry and Ecological Theory. Annu. Rev. Ecol. Evol. Syst. 2012, 43, 313–343. [Google Scholar] [CrossRef] [Green Version]
  16. Sinsabaugh, R.L.; Hill, B.H.; Shah, J.J.F. Ecoenzymatic stoichiometry of microbial organic nutrient acquisition in soil and sediment. Nature 2009, 462, 795-U117. [Google Scholar] [CrossRef] [PubMed]
  17. Guo, Z.; Shi, C. Prediction of Bacterial Community Structure and Function in Different Compound Ratio Soils. Environ. Sci. Technol. 2021, 44, 69–76. [Google Scholar]
  18. Neal, A.L.; Rossmann, M.; Brearley, C.; Akkari, E.; Guyomar, C.; Clark, I.M.; Allen, E.; Hirsch, P.R. Land-use influences phosphatase gene microdiversity in soils. Environ. Microbiol. 2017, 19, 2740–2753. [Google Scholar] [CrossRef] [Green Version]
  19. Zhao, F.Z.; Bai, L.; Wang, J.Y.; Deng, J.; Ren, C.J.; Han, X.H.; Yang, G.H.; Wang, J. Change in soil bacterial community during secondary succession depend on plant and soil characteristics. Catena 2019, 173, 246–252. [Google Scholar] [CrossRef]
  20. Ren, C.; Zhao, F.; Kang, D.; Yang, G.; Han, X.; Tong, X.; Feng, Y.; Ren, G. Linkages of C:N:P stoichiometry and bacterial community in soil following afforestation of former farmland. Forest Ecol. Manag. 2016, 376, 59–66. [Google Scholar] [CrossRef]
  21. Brookes, P.C.; Landman, A.; Pruden, G.; Jenkinson, D.S. Chloroform fumigation and the release of soil nitrogen: A rapid direct extraction method to measure microbial biomass nitrogen in soil. Soil Biol. Biochem. 1985, 17, 837–842. [Google Scholar] [CrossRef]
  22. Vance, E.D.; Brookes, P.C.; Jenkinson, D.S. An extraction method for measuring soil microbial biomass C. Soil Biol. Biochem. 1987, 19, 703–707. [Google Scholar] [CrossRef]
  23. Brookes, P.C.; Powlson, D.S.; Jenkinson, D.S. Measurement of microbial biomass phosphorus in soil. Soil Biol. Biochem. 1982, 14, 319–329. [Google Scholar] [CrossRef]
  24. Sinsabaugh, R.L.; Lauber, C.L.; Weintraub, M.N.; Ahmed, B.; Allison, S.D.; Crenshaw, C.; Contosta, A.R.; Cusack, D.; Frey, S.; Gallo, M.E.; et al. Stoichiometry of soil enzyme activity at global scale. Ecol. Lett. 2008, 11, 1252–1264. [Google Scholar] [CrossRef] [PubMed]
  25. Saiya-Cork, K.R.; Sinsabaugh, R.L.; Zak, D.R. The effects of long term nitrogen deposition on extracellular enzyme activity in an Acer saccharum forest soil. Soil Biol. Biochem. 2002, 34, 1309–1315. [Google Scholar] [CrossRef]
  26. Moorhead, D.L.; Sinsabaugh, R.L.; Hill, B.H.; Weintraub, M.N. Vector analysis of ecoenzyme activities reveal constraints on coupled C, N and P dynamics. Soil Biol. Biochem. 2016, 93, 1–7. [Google Scholar] [CrossRef]
  27. Sinsabaugh, R.L.; Turner, B.L.; Talbot, J.M.; Waring, B.G.; Powers, J.S.; Kuske, C.R.; Moorhead, D.L.; Shah, J.J.F. Stoichiometry of microbial carbon use efficiency in soils. Ecol. Monogr. 2016, 86, 172–189. [Google Scholar] [CrossRef] [Green Version]
  28. Zhong, Z.; Li, W.; Lu, X.; Gu, Y.; Wu, S.; Shen, Z.; Han, X.; Yang, G.; Ren, C. Adaptive pathways of soil microorganisms to stoichiometric imbalances regulate microbial respiration following afforestation in the Loess Plateau, China. Soil Biol. Biochem. 2020, 151, 108048. [Google Scholar] [CrossRef]
  29. Guo, Z.; Han, J.C.; Li, J. Response of organic carbon mineralization and bacterial communities to soft rock additions in sandy soils. PeerJ 2020, 8, e8948. [Google Scholar] [CrossRef] [Green Version]
  30. He, H.; Li, H.; Zhu, J.; Wei, Y.; Zhang, F.; Yang, Y.; Li, Y. The asymptotic response of soil water holding capacity along restorationduration of artificial grasslands from degraded alpine meadowsin the Three River Sources, Qinghai–Tibetan Plateau, China. Ecol. Res. 2018, 33, 1001–1010. [Google Scholar] [CrossRef]
  31. Xu, X.; Thornton, P.E.; Post, W.M. A global analysis of soil microbial biomass carbon, nitrogen and phosphorus in terrestrial ecosystems. Glob. Ecol. Biogeogr. 2013, 22, 737–749. [Google Scholar] [CrossRef]
  32. Brucker, E.; Kernchen, S.; Spohn, M. Release of phosphorus and silicon from minerals by soil microorganisms depends on the availability of organic carbon. Soil Biol. Biochem. 2020, 143, 107737. [Google Scholar] [CrossRef]
  33. Sariyildiz, T.; Anderson, J.M. Interactions between litter quality, decomposition and soil fertility: A laboratory study. Soil Biol. Biochem. 2003, 35, 391–399. [Google Scholar] [CrossRef]
  34. Sun, F.; Song, C.; Wang, M.; Lai, D.Y.F.; Tariq, A.; Zeng, F.; Zhong, Q.; Wang, F.; Li, Z.; Peng, C. Long-term increase in rainfall decreases soil organic phosphorus decomposition in tropical forests. Soil Biol. Biochem. 2020, 151, 108056. [Google Scholar] [CrossRef]
  35. Jiang, Y.; Guo, X. Stoichiometric patterns of soil carbon, nitrogen, and phosphorus in farmland of the Poyang Lake region in Southern China. J. Soils Sediments 2019, 19, 3476–3488. [Google Scholar] [CrossRef]
  36. Quan, X.U.; Wenyi, R.U.I.; Jialong, L.I.U.; Zhi, L.I.U.; Ling, Y.; Yujing, Y.I.N.; Weiian, Z. Spatial Variation of Coupling Characteristics of Soil Carbon and Nitrogen in Farmland of China. J. Ecol. Rural. Environ. 2006, 22, 57–60. [Google Scholar]
  37. Jiang, X.; Wright, A.L.; Wang, X.; Liang, F. Tillage-induced changes in fungal and bacterial biomass associated with soil aggregates: A long-term field study in a subtropical rice soil in China. Appl. Soil Ecol. 2011, 48, 168–173. [Google Scholar] [CrossRef]
  38. Wang, R.Z.; Lu, L.Y.; Creamer, C.A.; Dijkstra, F.A.; Liu, H.Y.; Feng, X.; Yu, G.Q.; Han, X.G.; Jiang, Y. Alteration of soil carbon and nitrogen pools and enzyme activities as affected by increased soil coarseness. Biogeosciences 2017, 14, 2155–2166. [Google Scholar] [CrossRef] [Green Version]
  39. Wang, Q.K.; Chen, L.C.; Yang, Q.P.; Sun, T.; Li, C.M. Different effects of single versus repeated additions of glucose on the soil organic carbon turnover in a temperate forest receiving long-term N addition. Geoderma 2019, 341, 59–67. [Google Scholar] [CrossRef]
  40. Gallardo, A.S.W. Carbon and nitrogen limitati on of soil microbial biomass in desert ecosystems. Biogeochemistry 1992, 18, 1–17. [Google Scholar] [CrossRef]
  41. Allison, S.D.; Vitousek, P.M. Responses of extracellular enzymes to simple and complex nutrient inputs. Soil Biol. Biochem. 2005, 37, 937–944. [Google Scholar] [CrossRef]
  42. Mooshammer, M.; Wanek, W.; Zechmeister-Boltenstern, S.; Richter, A. Stoichiometric imbalances between terrestrial decomposer communities and their resources: Mechanisms and implications of microbial adaptations to their resources. Front. Microbiol. 2014, 5, 22. [Google Scholar] [CrossRef] [PubMed] [Green Version]
  43. Yuan, X.; Niu, D.; Gherardi, L.A.; Liu, Y.; Wang, Y.; Elser, J.J.; Fu, H. Linkages of stoichiometric imbalances to soil microbial respiration with increasing nitrogen addition: Evidence from a long-term grassland experiment. Soil Biol. Biochem. 2019, 138, 107580. [Google Scholar] [CrossRef]
  44. Islam, M.R.; Singh, B.; Dijkstra, F.A. Microbial carbon use efficiency of glucose varies with soil clay content: A meta-analysis. Appl. Soil. Ecol. 2023, 181, 104636. [Google Scholar] [CrossRef]
Figure 1. The extracellular enzyme activity in compound soils with different feldspathic sandstone-to-sand ratios. (a) BG, β-1,4-glucosidase, (b) NAG, β-N-acetylglucosaminidase, (c) LAP, Leucine aminopeptidase, (d) AKP, alkaline phosphatase. C1, C2, and C3 represent ratios of feldspathic sandstone to sand of 1:5, 1:2, and 1:1. Different lowercase letters represent significant differences at the 0.05 level. Error bars are the standard errors (n = 3).
Agriculture 13 00058 g001
Figure 2. The ecoenzymatic stoichiometry in compound soils with different feldspathic sandstone-to-sand ratios. (a) Enzyme C:N rations, (b) enzyme C:P ratios, (c) enzyme N:P ratios. BG: β-1,4-glucosidase, NAG: β-N-acetylglucosaminidase, LAP: Leucine aminopeptidase, AKP: alkaline phosphatase. Different lowercase letters represent significant differences at the 0.05 level. C1, C2, and C3 represent ratios of feldspathic sandstone to sand of 1:5, 1:2, and 1:1. Error bars are the standard errors (n = 3).
Agriculture 13 00058 g002
Figure 3. The vector characteristics of enzyme activity in compound soils with different feldspathic sandstone-to-sand ratios. (a) Vector analysis, (b) vector length (VL), (c) vector angle (VA). Ces: C-acquiring enzymes activities; Nes: sum of N-acquiring enzymes activities; Pes: P-acquiring enzymes activities. C1, C2, and C3 represent ratios of feldspathic sandstone to sand of 1:5, 1:2, and 1:1. Different lowercase letters represent significant differences at the 0.05 level. Error bars are the standard errors (n = 3).
Agriculture 13 00058 g003
Figure 4. Soil microbial carbon use efficiency in compound soils with different feldspathic sandstone-to-sand ratios. C1, C2, and C3 represent ratios of feldspathic sandstone to sand of 1:5, 1:2, and 1:1. Different lowercase letters represent significant differences at the 0.05 level. Error bars are the standard errors (n = 3).
Agriculture 13 00058 g004
Table 1. The soil properties of compound soils with different feldspathic sandstone-to-sand ratios.
C1C2C3F(2,6)p
pH8.9 ± 0.04 a8.95 ± 0.03 a8.97 ± 0.01 a1.22-
SOC (g/kg) 1.52 ± 0.07 a1.53 ± 0.15 a1.95 ± 0.18 a3.03-
TN (g/kg)0.15 ± 0.01 b0.16 ± 0.01 b0.21 ± 0.01 a7.01<0.05
TP (g/kg)0.25 ± 0.01 b0.3 ± 0.02 a0.31 ± 0 a9.42<0.05
C:N10.15 ± 0.14 a9.66 ± 0.58 a9.41 ± 0.52 a0.68-
C:P6.14 ± 0.44 a5.19 ± 0.74 a6.23 ± 0.53 a0.96-
N:P0.61 ± 0.05 a0.54 ± 0.07 a0.66 ± 0.04 a1.35-
MBC (mg/kg)87.82 ± 2.67 a86.25 ± 3.39 a93.48 ± 6.75 a0.68-
MBN (mg/kg)7.05 ± 0.32 a5.48 ± 0.07 b5.42 ± 0.28 b13.76<0.01
MBP (mg/kg)6.21 ± 0.8 b15.33 ± 1.73 a3.92 ± 0.36 b28.98<0.001
MBC:MBN12.51 ± 0.69 b15.74 ± 0.46 a17.23 ± 0.62 a16.33<0.01
MBC:MBP14.81 ± 2.55 b5.74 ± 0.54 c24.1 ± 2.09 a22.6<0.01
MBN:MBP1.19 ± 0.22 a0.36 ± 0.04 b1.41 ± 0.14 a13.33<0.01
Values are represented as the mean value followed by standard error (n = 3). Different letters indicate significant differences (ANOVA, p < 0.05, Tukey’s LCBD posthoc analysis) among the different feldspathic sandstone and sand compound soils.
Disclaimer/Publisher’s Note: The statements, opinions and data contained in all publications are solely those of the individual author(s) and contributor(s) and not of MDPI and/or the editor(s). MDPI and/or the editor(s) disclaim responsibility for any injury to people or property resulting from any ideas, methods, instructions or products referred to in the content.

