Article

Prediction of Protein Content in Pea (Pisum sativum L.) Seeds Using Artificial Neural Networks

by
Patryk Hara
1,
Magdalena Piekutowska
2 and
Gniewko Niedbała
3,*
1
Agrotechnology, Jagiellonów 4, 73-150 Łobez, Poland
2
Department of Geoecology and Geoinformation, Institute of Biology and Earth Sciences, Pomeranian University in Słupsk, 27 Partyzantów St., 76-200 Słupsk, Poland
3
Department of Biosystems Engineering, Faculty of Environmental and Mechanical Engineering, Poznań University of Life Sciences, Wojska Polskiego 50, 60-627 Poznań, Poland
*
Author to whom correspondence should be addressed.
Agriculture 2023, 13(1), 29; https://doi.org/10.3390/agriculture13010029
Submission received: 6 November 2022 / Revised: 12 December 2022 / Accepted: 19 December 2022 / Published: 22 December 2022
(This article belongs to the Special Issue Digital Innovations in Agriculture)

Abstract

:
Pea (Pisum sativum L.) is a legume valued mainly for its high seed protein content. The protein content of pea is characterized by a high lysine content and low allergenicity. This has made consumers appreciate peas increasingly in recent years, not only for their taste, but also for their nutritional value. An important element of pea cultivation is the ability to predict protein content, even before harvest. The aim of this research was to develop a linear and a non-linear model for predicting the percentage of protein content in pea seeds and to perform a comparative analysis of the effectiveness of these models. The analysis also focused on identifying the variables with the greatest impact on protein content. The research included the method of machine learning (artificial neural networks) and multiple linear regression (MLR). The input parameters of the models were weather, agronomic and phytophenological data from 2016–2020. The predictive properties of the models were verified using six ex-post forecast measures. The neural model (N1) outperformed the multiple regression (RS) model. The N1 model had an RMS error magnitude of 0.838, while the RS model obtained an average error value of 2.696. The MAPE error for the N1 and RS models was 2.721 and 8.852, respectively. The sensitivity analysis performed for the best neural network showed that the independent variables most influencing the protein content of pea seeds were the soil abundance of magnesium, potassium and phosphorus. The results presented in this work can be useful for the study of pea crop management. In addition, they can help preserve the country’s protein security.

1. Introduction

In terms of cultivation, legumes are the world’s second largest crop after cereals. They constitute about 30% of the world’s plant production [1]. The crop residues of these plants are characterized by a positive organic matter (MO) balance, which makes them a very good forecrop for many crops such as cereals, potatoes and beets. In the years with an uneven distribution of precipitation (temperate climates) or a shortage of precipitation (southern European climatic conditions), when there is a poor uptake of mineral nitrogen, a particularly favorable after-effect of legumes is observed [2,3]. The decomposition of Fabaceae crop residues in the soil provides available forms of nitrogen to both successor plants and soil microorganisms.
This process contributes to the intensification of biological nitrogen sorption. The interaction between the legume residues and MO mineralization determines the amount of available N for the next plant [4]. The participation of legumes in crop rotation also contributes to the reduction of weed, pest and disease populations [5]. When grown in rotation with cereals, they counteract soil erosion and improve soil fertility [6] by changing physical and chemical properties. A properly developed root system of legumes is formed through loosening the soil, which increases soil aeration and becomes a source of a large amount of organic matter rich in nitrogen and other minerals [7]. A significant property of this group of plants is the ability to fix atmospheric nitrogen as a result of symbiosis with Rhizobium spp. bacteria. This trait plays an important role in argoecosystems and sustainable crop production, which seeks to reduce the use of mineral fertilizers [8,9]. The symbiosis of legumes with papillary bacteria also reduces inputs and resources by reducing the need for nitrogen fertilizers [10]. The importance of these plants is particularly important in an era of high and volatile mineral fertilizer prices. In many European countries, these fertilizers are periodically becoming a scarce commodity, so legumes are an important element in countering the fertilizer crisis and fitting in with the ideas of sustainable agriculture.
One of the most important plants in the Fabaceae family is the pea. More than half of its world production is in Canada, Russia, the United States of America and India [11]. In Poland, peas are the most widely grown legume right after yellow lupin. In 2022, the area of pea cultivation in Poland was more than 105 thousand hectares. For example, the cultivation of soybeans and beans in the same year amounted to 48.20 and 30.70 thousand hectares, respectively. In 2022, peas accounted for 0.68% of the total area in the structure of national sowings [12].
Peas are most valued for their high seed protein content, which can be as high as 31% [13,14]. Pea protein has high nutritional value due to its relatively high content of lysine, an amino acid that limits the nutritional value of cereals. In addition, it is characterized by low allergenicity [15,16]. Despite its significant and obvious advantages, the area under cultivation for this crop is relatively low due to poor profitability as a result of biotic-abiotic factors [17]. However, there is growing interest in plant-based proteins as a substitute for animal-based proteins [18],. The reason for this phenomenon is greater awareness of nutrition, environmental concerns and ethical issues [11]. Therefore, it can be assumed that peas will become increasingly popular among farmers over the next few years, which will be reflected in the increasing area under cultivation.
The demand for protein will continue to grow in the coming years due to the world’s expanding human population [1]. This makes it likely that interest in legumes, including peas as a valuable source of protein, will be greater than before. In addition, peas are a very good component in feed production. As a protein-raw material with a satisfactory amino acid composition, it is used in the feeding of slaughter, dairy and laying animals without adversely affecting production and fattening performance [19]. For many years, efforts have been made in European countries, including Poland, to increase the production and use of domestic protein raw materials to replace, or at least supplement, expensive imported post-extraction soybean meal. These measures are also aimed at preserving the country’s protein security, as the feed market is largely dependent on imported protein raw materials. Therefore, there is a risk (for now only theoretical) of a shortage of protein feed for animals, and consequently a shortage of food for the population [20]. Therefore, the ability to predict the protein content of pea seeds is very important for the possibility of ongoing decision support, management of national protein resources and risk management [21]. However, prediction of crop quality traits is a very difficult task. During the growing season, plants are exposed to a number of factors that limit both yield and quality, and predicting many of these factors is often an impossible task [22]. The non-uniform course of weather conditions, soil variability or pest pressure causes the growth and development of agricultural crops to proceed differently in each growing season [23]. In addition, the non-linear interaction between environmental factors and plant growth can result in a low-precision predictive model with a large prediction error [24,25]. The large number of factors influencing the quality of yield poses a significant difficulty in the selection of independent variables. Therefore, the construction of predictive models should be supported by very good knowledge of the research object [22]. This knowledge will allow the selection of those input variables that significantly affect yield quality. Among the most commonly used independent variables in the prediction of yield and its chemical and biochemical characteristics are weather data [26,27,28,29]. Average air temperature, total precipitation or total sunshine provide valuable information on plant development conditions. Data on soil mineral abundance, fertilizer application rates, and the course of plant phenological traits are commonly used to build predictive models [30,31,32].
One effective method for yield quality prediction is machine learning, among which artificial neural networks (ANNs) are of great interest [33,34,35,36,37]. The prototypes of ANNs are the nerve cells that build the human brain, so the operation of artificial neural networks is similar to that of the human brain [38,39]. Each neural network is made up of many simultaneously working and jointly processing elements called neurons. Neurons, due to their function, can be divided into three basic groups: input neurons (they are responsible for inputting the signal into the network), information processing neurons and output neurons (“producing” the results of the network to the outside world) [38,40]. Each of these groups of neurons forms a separate layer, the function of which is the same as the function of the elements from which it is built. Thus, the first is the input layer, which contains a number of neurons equal to the number of independent variables. Its task is to separate the input data into a number of neurons contained in the hidden layer. The hidden layer is built from the n-th number of neurons, the number of which depends on the complexity of the problem being solved by the network. In the structure of a neural network, there can be a different number of hidden layers. The decision on how many hidden layers to use is made by the network developer and is generally an arbitrary decision. The last third layer usually contains only one neuron, responsible for transmitting the result. A neural network, as a layered structure, works by connecting adjacent layers on an “each to each” basis [36,41].
This paper presents the possibility of using ANN to predict the protein content of pea seeds. An extensive analysis of the literature revealed a lack of scientific work of a similar nature. There are no reports on the possibility of predicting the protein content of peas under Polish weather and habitat conditions. In this study, three hypotheses are put forward for verification: (i) artificial neural networks are an effective tool for predicting the protein content of pea seeds 20 days before harvest; (ii) it is possible to create a model predicting the protein content of pea seeds based on five-year field trials; and (iii) the ANN model predicts the protein content of pea seeds with greater accuracy compared to the MLR model.

2. Materials and Methods

Experimental data were obtained from a 5-year cycle of field experiments with peas which were conducted in Poland. The results of the experiments were obtained from the field books of the system of the Research Center for Cultivar Testing (COBORU) [42]. Among other things, this institution is engaged in research on distinctiveness, uniformity and durability (DUS) of crop varieties. It is also within the scope of COBORU to conduct field trials for cultivation and use value (VCU). Obtaining positive results from these experiments allows a given variety to be included in the National Variety List. In addition, COBORU supervises the legal protection of varieties entered in the National Register [43]. The field books were created based on data from the official results of experiments under the Program of Registered Varietal Testing (PRVT; in Polish, PDO). PRVT is a system of permanent or periodic testing on the economic value of crop species listed in the National Register or included in the Community Catalogs of Agricultural/Vegetable Varieties (CCA/CCV). PRVT covers both varietal and varietal-agronomic experiments [44].
Field experiments were conducted at the Stations and Experimental Plants for Variety Testing of COBORU located in: Bezek (51°12′6.722″ N 23°16′7.656″ E), Głębokie (52°38′33.18″ N 18°26′16.26″ E), Kawęczyn (52°10′15.157″ N 20°20′49.328″ E), Krzyżewo (53°1′33.535″ N 22°45′28.438″ E), Pawłowice (50°27′14.049″ N 18°29′28.912″ E), Radostowo (53°59′20.566″ N 18°44′41.429″ E) and Sulejów (51°21′8.03″ N 19°52′7.517″ E) (Figure 1). These localities were chosen for their optimal conditions for pea cultivation. These locations are dominated by clay soils of class II-IIIb (polish classification). The experiments were conducted in accordance with COBORU methodology, which includes a number of agrotechnical recommendations. All studies on selected pea varieties were conducted on plots of 13.86 m2. The experiments were conducted in an arrangement with variety groups for species in which different morphological types are studied (e.g., traditional and self-terminating varieties, tall, medium-high and low varieties, etc.). In a system with groups of varieties, first the place in repetitions is drawn or determined, and then the order of varieties in groups. The number of repetitions for each variety in each year of the study was 3. A model based on artificial neural networks (N1) and multiple linear regression (RS) was developed for 11 general-purpose pea varieties: Arwena, Astronaute, Batuta, Mecenas, Medyk, Mentor, Olympus, Spot, Starski, Tarchalska and Tytus. These varieties are widely recommended for cultivation in Poland due to their relatively high yield levels and relatively high resistance to biotic factors.

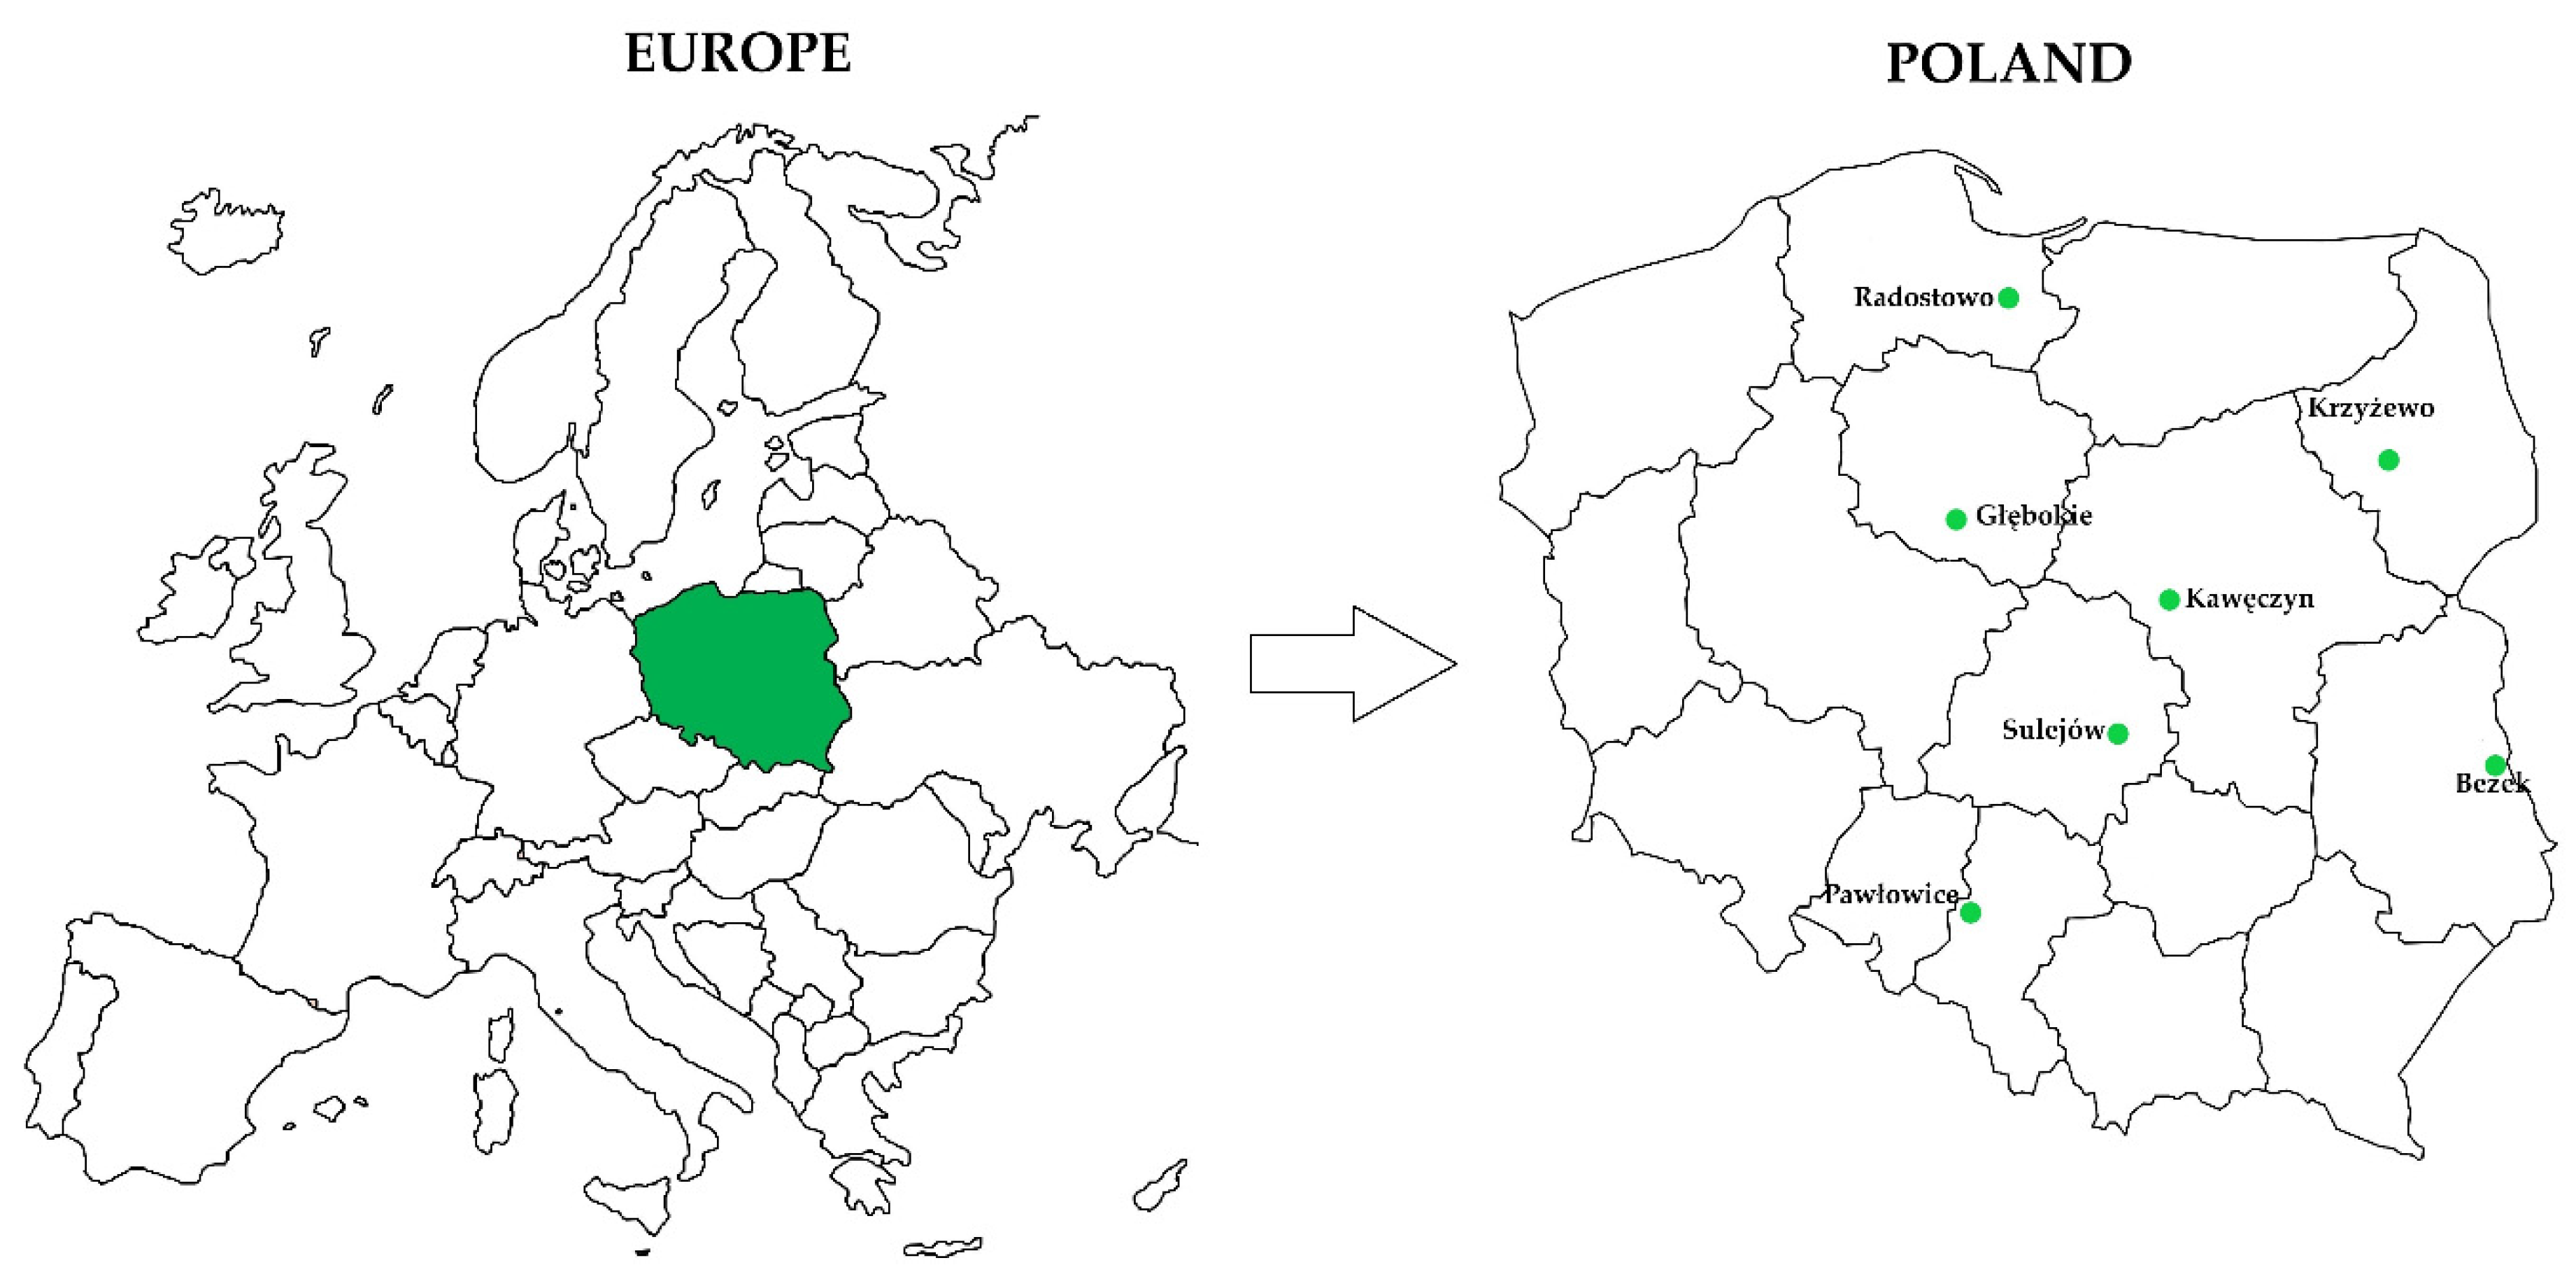
2.1. Data for Model Construction

Two categories of variables were used during the creation of the N1 and RS model. The first group was agronomic data, phytophenological data and results of protein content of pea seeds, all of which came from COBORU field books. The second category of variables was meteorological data, which came from a dataset of meteorological phenomena and observations recorded at each COBORU Variety Testing Station and Department. Missing data, such as sunshine totals, were supplemented using historical data from meteorological stations of the Institute of Meteorology and Water Management–National Research Institute. Measurements from meteorological stations that were located closest to the experimental facilities were used [25]. This information was obtained from a public archival database, available electronically [45].

2.2. Construction of the Database

Nineteen independent variables were used to construct the N1 and RS models, as shown in Table 1. The dependent variable was the percentage protein content of pea seeds. Data from a total of 1155 plots were used to construct and verify the N1 and RS model. Each of the analyzed plots constituted one separate case for model construction. The information was grouped into two sets A and B. Set A contained data from 1040 plots and was used to build a neural and regression model. Set B, on the other hand, contained cases from 115 plots and was used to validate the models. Therefore, this set was not used to build the neural network and regression model. It should be noted that the data of set B was selected randomly. However, the determinant representing each case was the variety. The percentage of protein in the seeds was the dependent variable for the predictive models created.
The construction of the ANN model was performed on the basis of the predicted date for the calendar year, i.e., 14 July. Based on the analysis of data from all five years of the study (2016–2020), it was shown that pea harvesting was most often performed on 3 August, and the latest on 10 August. The date of 14 July, which is the date of prediction, is the dominant beginning of maturity of the analyzed varieties. This approach to predicting the protein content of pea seeds makes it possible to make predictions 20 days before harvest (based on the dominant harvest date) in the same calendar year.

2.3. Determination of Protein Content in Pea Seeds

Protein determination using the Kjeldahl method is a standard method for determining proteins in plant raw materials [46]. It involves the conversion of protein nitrogen into ammonium sulfate with concentrated sulfuric acid. In the first step, the ground and dried sample is mineralized with sulfuric acid (VI) in the presence of K2SO4 and CuSO4 catalysts. To the mineralized and cooled sample, 75 mL of distilled water and 2 of receiving solution are added. The solution thus prepared is distilled for about 4 min. In the final step, the resulting distillate is titrated with standard hydrochloric acid (0.1 mol·L−1) until a gray-green color appears. The amount of hydrochloric acid used for titration is the basis for calculating the total protein content of the sample [47].

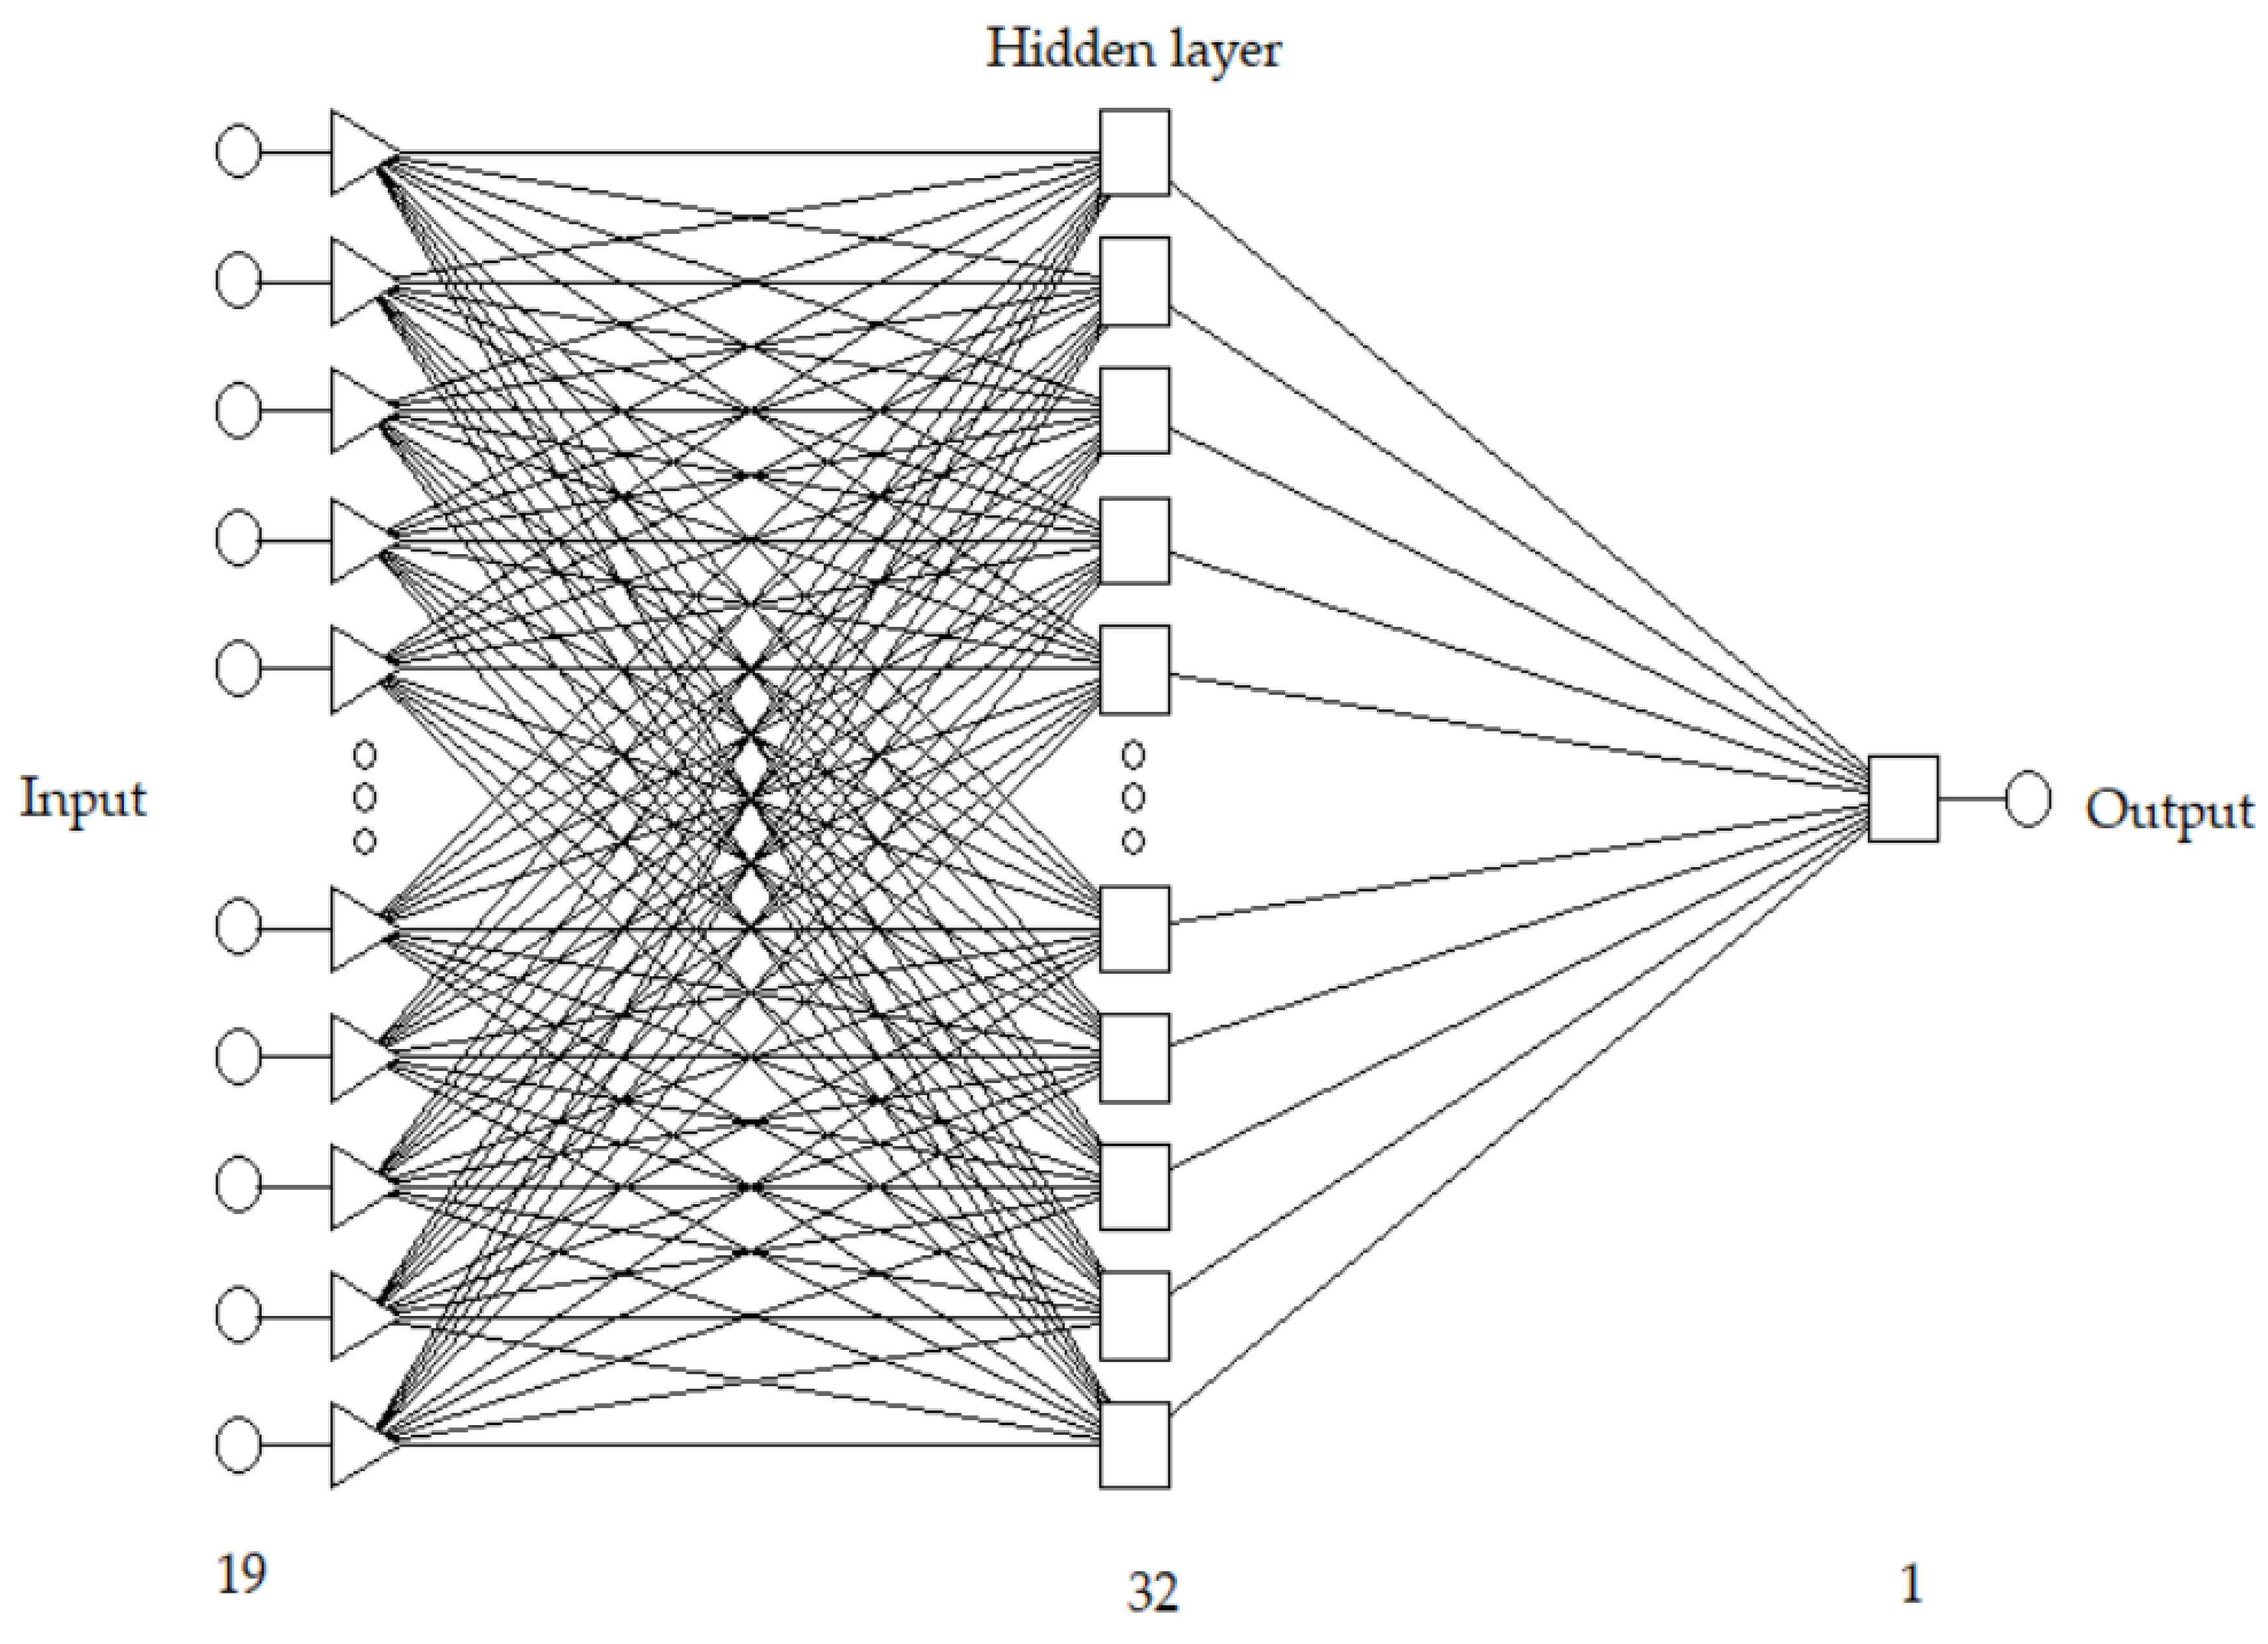
2.4. ANN Model Development

The construction of the N1 model was performed on the basis of the predicted date for the calendar year, i.e., 14 July. Based on the analysis of data from all five years of the study (2016–2020), it was shown that pea harvesting was most often performed on 3 August, and the latest on 10 August. The date of 14 July, which is the date of prediction, is the dominant beginning of maturity of the analyzed varieties. This approach to predicting the protein content of pea seeds makes it possible to make predictions 20 days before harvest (based on the dominant harvest date) in the same calendar year.
The choice of network type was made by repeatedly building neural networks using an automatic network designer, as well as by reviewing the available literature [21,48,49,50,51]. A total of 10,000 networks were tested, which allowed the selection of a multilayer perceptron type network with the following architecture: MLP 19:19-32-1:1 (Figure 2). The selection of the network architecture was guided using the size of the error of the validation, test and learning sets, as well as key network quality parameters, which are shown in Table 2. Achieving the smallest error values by these sets leads to an ANN with high prediction accuracy [52]. An important element in the construction of the prediction model was the division of set A (1040 fields) into three subsets: learning, test and validation. These subsets consisted of 520, 260 and 260 cases (50%–25%–25%), respectively. The entire procedure was performed in the Statistica v7.1 software (TIBCO Software Inc., Palo Alto, CA, USA).
Due to the coding of the variable P2O5_C, K2O_C and MGO_C, Table 2 presents an assessment of the abundance of Polish soils in phosphorus, potassium and magnesium. Very low abundance of soils in these elements was not recorded in the localities where field experiments were conducted.

2.5. MLR Model Development

Multiple linear regression (MLR) is a statistical tool for detecting interdependencies between independent characteristics and the dependent variable. It makes it possible to determine the strength and type of the detected dependence and to build a functional model that makes it possible to forecast the direction of change in one characteristic on the basis of others [53]. In addition, this method allows you to identify significant and non-significant variables at a given level of probability. This knowledge is particularly important in the further stages of modeling and allows you to identify those invariant variables that do not affect the dependent variable [54]. The general regression formula is shown in Equation (1).
Y = b0 + b1·X1 + b2·X2 + … + bp·Xp + ε,
where: Y-dependent variable (explained variable), X1, X2…Xp-independent variables (explanatory variable), b0, b1, b2…bp-equation parameters, ε-random component (rest of the model).
In this study, a model developed using multiple linear regression (stepwise progressive) was used to predict the percentage protein content of pea seeds. For its construction, the independent variables shown in Table 1 were used. The model was built to compare the effectiveness of the prediction of protein content in peas and was contrasted with a nonlinear model (ANN).
The RS model, like N1, was created based on 1040 cases. The analysis continued through 17 steps, and of the 19 explanatory variables, two of them (number of growing days and number of days from the beginning of the year to emergence) were removed using the model. 115 random observations (set B) were used to predict protein content. Multivariate linear regression analysis was performed using Statistica v7.1 software, and the results are presented graphically and in tabular form.

2.6. Verification of the N1 and RS Models

The obtained N1 and RS models were verified on the basis of measures of predictive properties (Equations (2)–(7)). To calculate them, a set B (115 fields) was used on the basis of which the difference between actual and predicted values was determined. This is example 2 of an equation [22,55]:
RAE = i = 1 n ( y i y i ) 2 i = 1 n ( y i ) 2   ,
RMS = i = 1 n ( y i y i ) 2 n  
MAE = 1 n i = 1 n | y i y i |
MAPE = 1 n   i = 1 n | y i y i y i |   ·   100 %
MAX = max i   | y i y i |
MAXP = max i   | y i y i y i |   · 100 %
where: n-number of observations, yi-actual values, yi-predictive values, obtained with the model.

2.7. Sensitivity Analysis of the Neural Network

The final step in creating the N1 model was to identify the independent variables that most influenced the variable explained by the model. To do this, a sensitivity analysis of the network was performed, which allows the rank of each feature to be quantified. The ranks are determined by the size of the deviation quotient, which is the ratio of the error to the error received by all independent variables. The importance of a given feature is greater the higher the deviation quotient achieved by it.

3. Results

3.1. Neural Network Learning and Quality Assessment of Models Predicting Protein Content in Pea Seeds

The obtained multilayer perceptron-type neural network was learned using two methods. The first method of learning-backward error propagation took 100 epochs. The best learning result was obtained by continuing this process with the coupled gradients method and the best result was achieved at 55 epochs. This approach is common in creating predictive models using ANNs [25,28,56,57,58]. The error for the network did not exceed 0.6 for each of the sets-i.e., learning, validation and test. The results of the N1 predictive model and its basic features are shown in Table 3 and Table 4.
The N1 model had a high correlation coefficient (r = 0.920). Satisfactory values were also obtained for the mean error and mean absolute error, which were 0.008 and 0.574, respectively. Low error values and a high correlation coefficient were among the many parameters that determined the selection of the N1 model for further analysis.
An analysis using multiple linear regression showed that the explanatory variables statistically insignificant at the α = 0.05 level were the number of days from 1 January to the beginning of flowering (FLOWE), variety (GEN), soil potassium and phosphorus abundance (K2O_C and P2O5_C, respectively) and soil pH (PH).
Based on the results shown in Table 5, the multiple linear regression equation is of the form:
PROT = 40.445 + 0.576 · MGO_C − 0.005 · RAIN − 0.021 · K2O_F − 0.028 · N_F − 0.065 · HAR + 0.027 · P_HIGH − 0.214 · TECH_M + 0.152 · INI_A + 0.020 · P2O5_F − 0.416 · TEMP + 0.061 · SOWI + 0.001 · SUN

3.2. Sensitivity Analysis of Neural Networks

Verification of the predictive model based on artificial neural networks was carried out using 115 cases (plots). The N1 model with a structure of 19:19-32-1:1 was prepared based on 19 independent variables. The dependent variable was the percentage protein content of pea seeds. The sensitivity analysis performed on crop A showed that the factor with the greatest effect on the protein content of pea seeds was soil magnesium abundance (Table 6). This trait received a rank of one, and removing this variable from the N1 model would result in an increase in the cumulative error value by 2.366 times. The independent variables that received a rank of two and three were the potassium and phosphorus content in the soil. Not including these variables in the model would have increased the error by 1546 and 1413 times, respectively. Average daily air temperature received a rank of four and, of all the weather variables, had the greatest effect on the protein content of the eleven pea seed varieties.
The protein content of pea seeds predicted using the N1 model was compared with actual values (Figure 3). A coefficient of determination was obtained at a relatively high level (R2 = 0.7979), which means that the model’s response is very close to the observed values, and that the network has the ability to correctly represent the relationships that are characteristic of the issue being modeled. This procedure was also performed for the RS model (Figure 4). The obtained coefficient of determination of the studied characteristics was 0.3357, so the model has much weaker predictive properties compared to the N1 model.
From Figure 5, it can be observed that the protein content of pea seeds changed with the increasing soil magnesium and potassium abundance. An increase in the concentration of magnesium in the soil causes an increase in the percentage of protein content in the analyzed plant. A similar trend is observed for potassium. However, this increase is not as high as in the case of magnesium.
Figure 6 shows the relationship of the independent variables (TEPM and P2O5_C) from the sensitivity analysis of the artificial neural network in relation to the dependent variable. From it, it can be observed that an increase in average daily temperatures during the pea growing season promotes the accumulation of protein in its seeds. This relationship also applies to the amount of phosphorus available in the soil. However, as the average daily temperature decreases, the high abundance of phosphorus in the soil does not result in the accumulation of protein in pea seeds.
Changes in protein content as influenced by changes in average daily air temperature (TEMP) and soil magnesium abundance (MGO_C) are shown in Figure 7. An increase in the value of the independent variable TEMP at a low soil magnesium concentration caused the protein content of pea seeds to be less than 21%. A high MgO content in the soil promotes protein synthesis in seeds only when there are sufficiently high average daily air temperatures during the pea growing season.

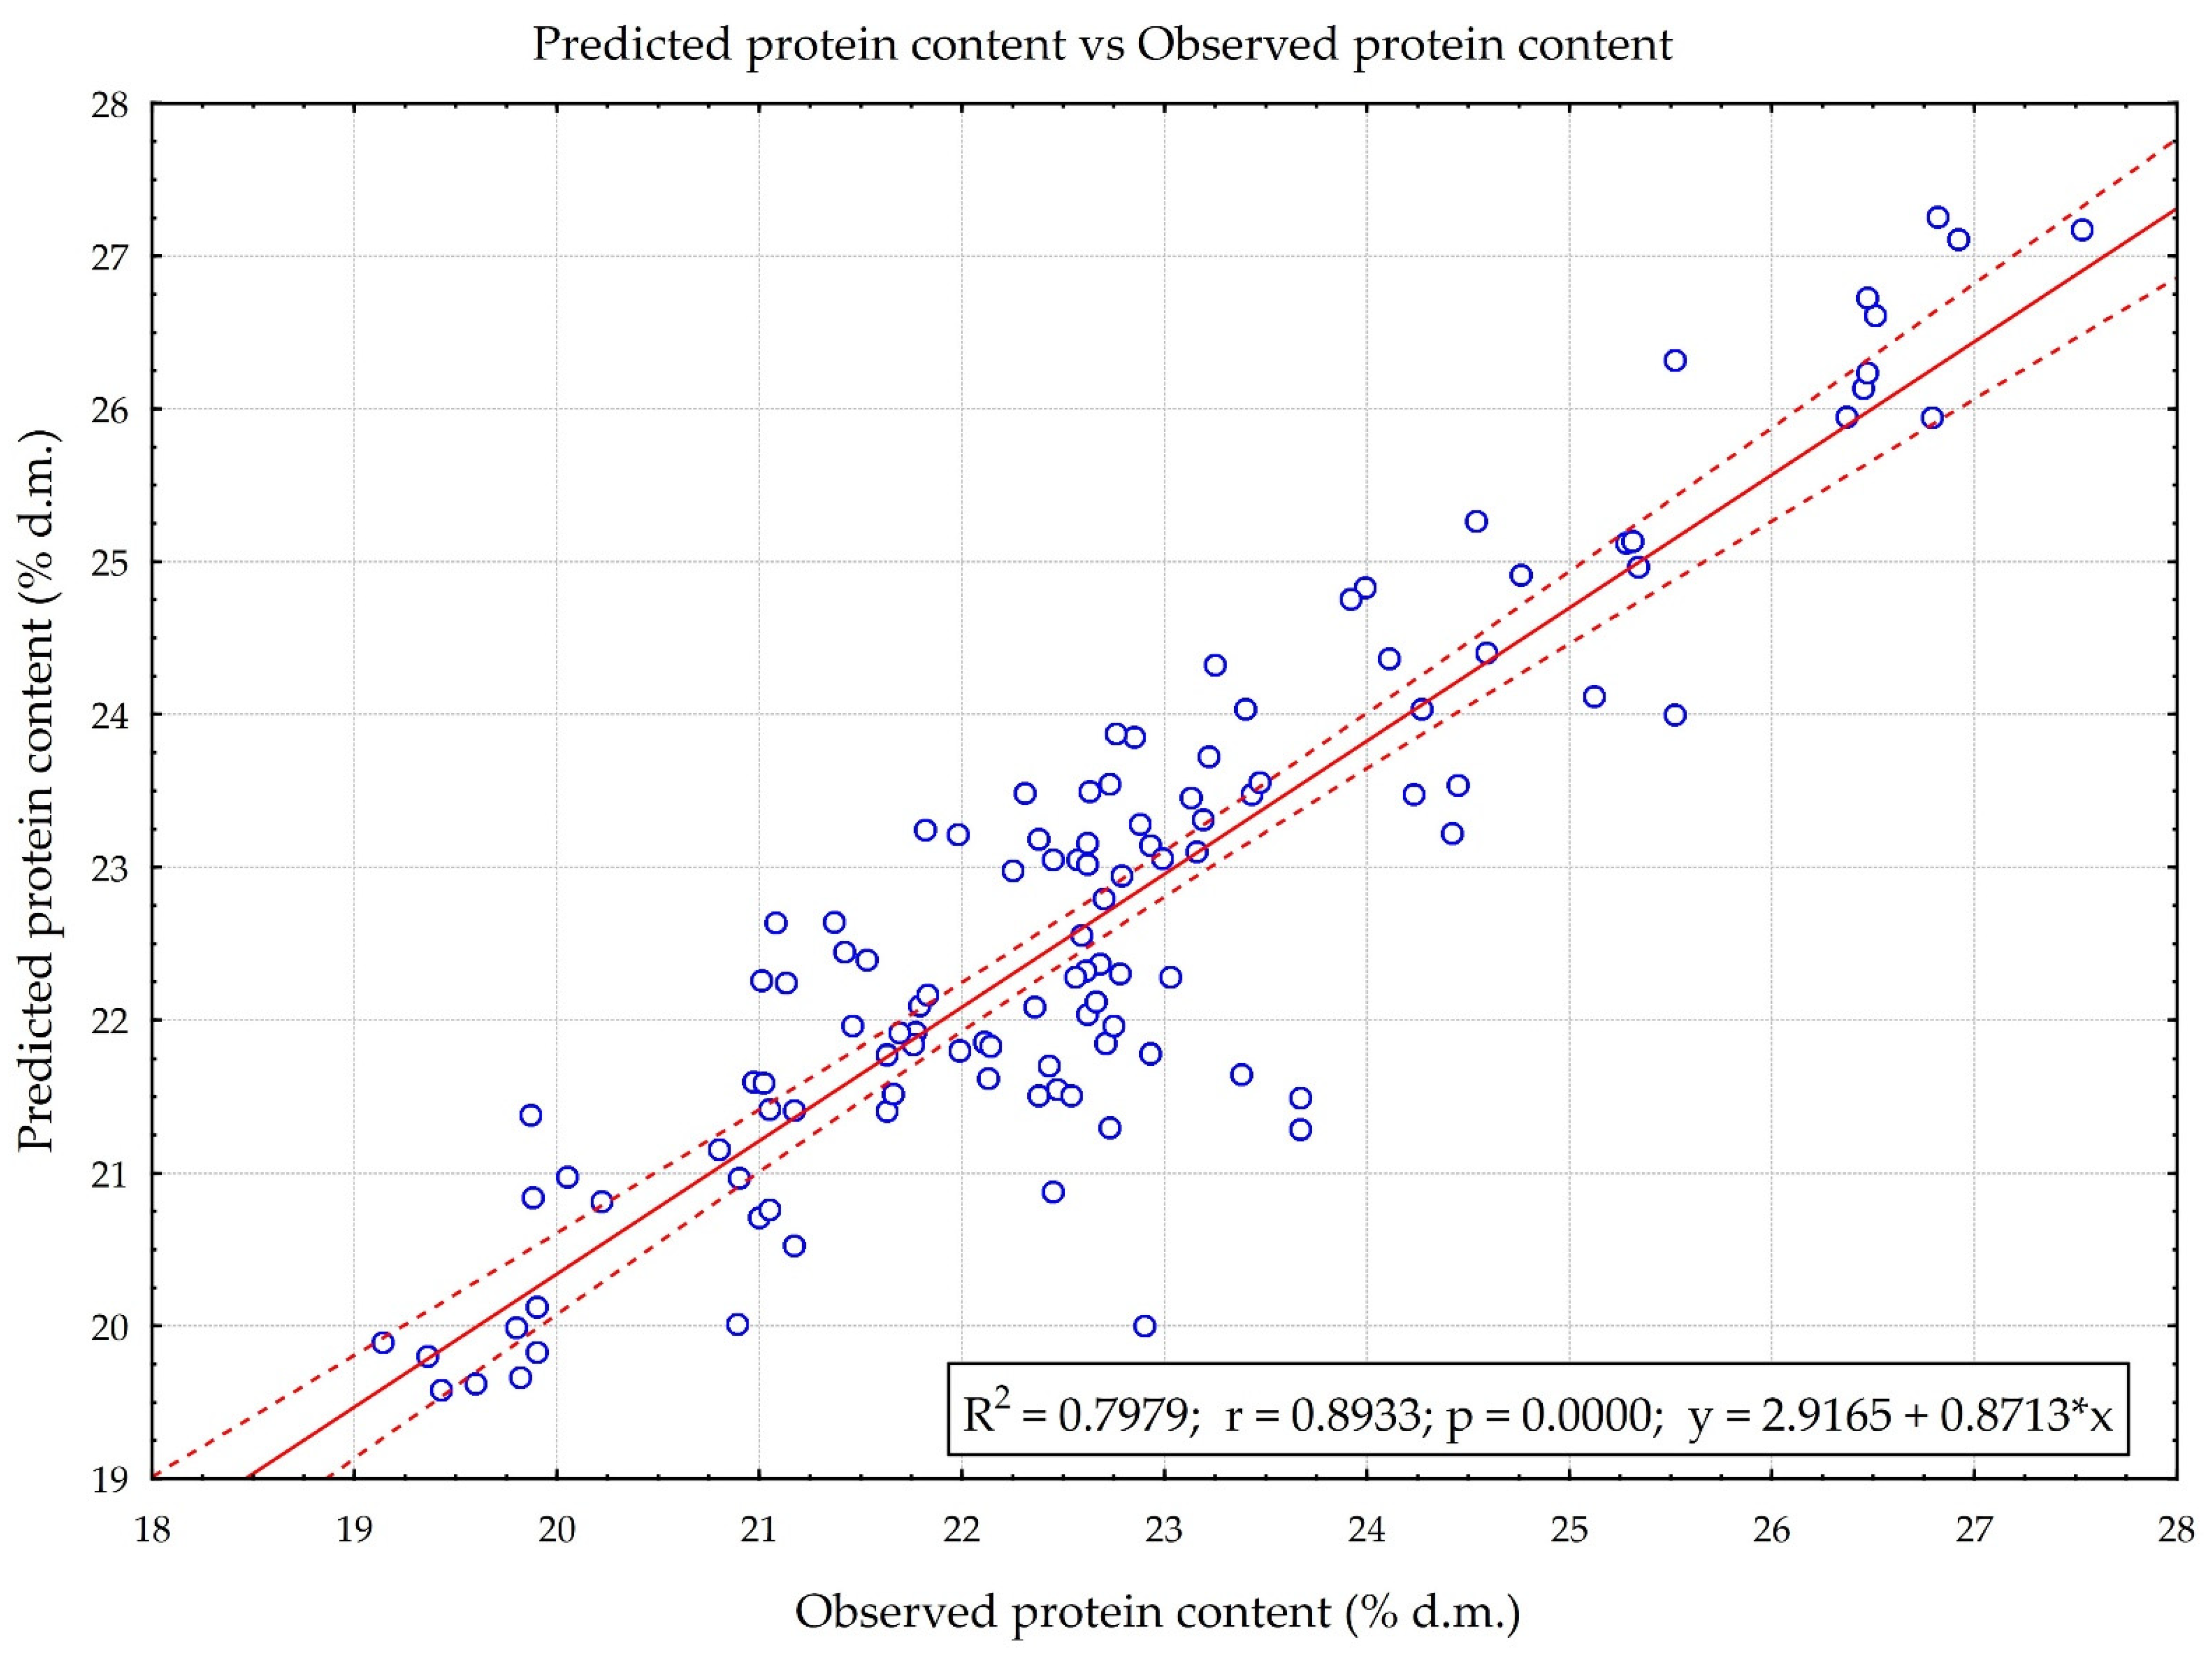
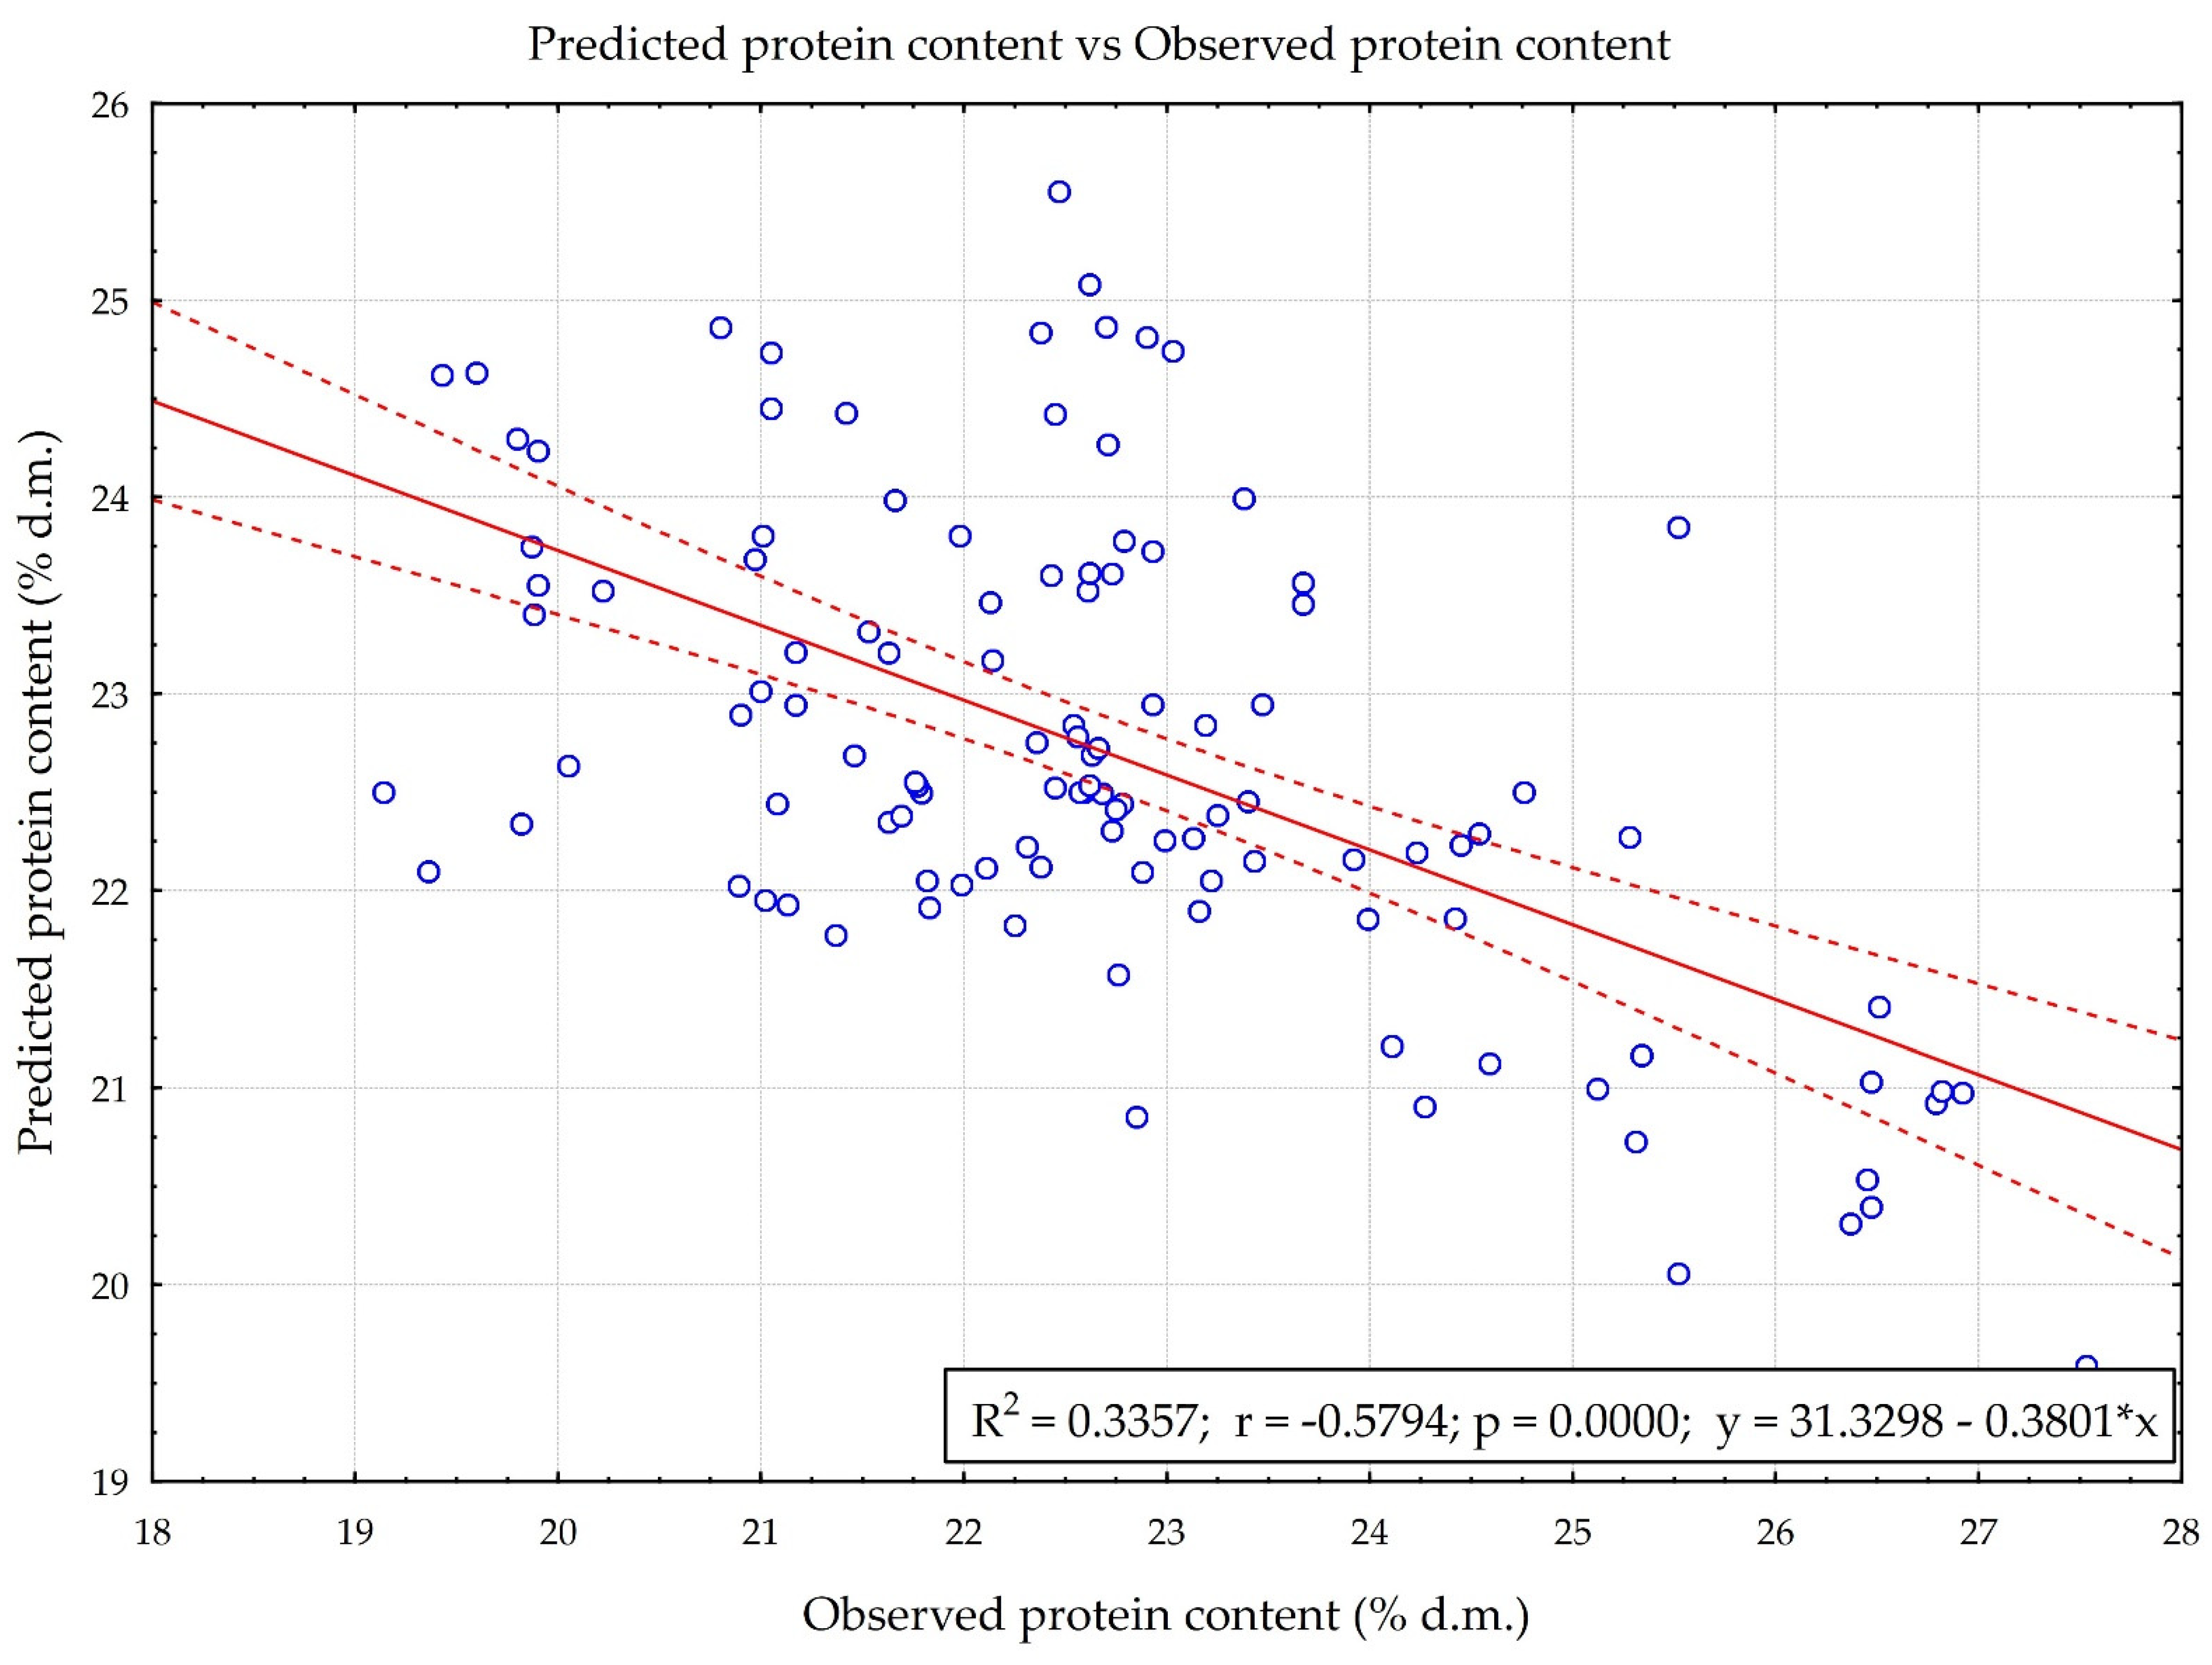
3.3. Predictive Properties of the N1 and RS Model

Verification of the correctness of the N1 model and RS model was carried out based on six quality measures: RAE (global relative error of model approximation), RMS (root mean square error), MAE (mean absolute error), MAPE (mean absolute percentage error), MAX (maximum error determined for the whole model) and MAXP (maximum percentage error). Ex-post analysis (Table 7) showed that the N1 model had smaller error values compared to the RS model. The RS model achieved an RMS error of more than three times that of the N1 model. There were similarly large disparities in MAE and MAPE error. The N1 model was also characterized by a more-than-two-times smaller maximum percentage error.

4. Discussion

An important advantage of artificial neural networks is their ability to model the complex non-linear relationships that occur in agricultural crops [59]. A network with MLP (multi-layer perceptron) topology was used to predict cotton yield. The network was built from four categories of variables: weather data, drought indices, crop vegetation indices and yield. The resulting model had a MAPE error of 1.35%, and the R2 value was 0.88 [60]. In contrast, Abrougui et al. [32] predicted the yield of potato grown in Chott Meriem (Tunisia). The analysis showed that the best measures of prediction quality (MSE = 0.006, % error = 1.116%) were characterized by a model with a topology of two hidden layers, which consisted of eight neurons in each layer. ANNs have also been successfully used to predict the quality characteristics of plant products such as essential oil content [61], ferulic acid concentration including mycotoxins in wheat grains [62], changes in protein, gluten and water content of stored wheat grains [63] and free radical content of sunflower, palm and rapeseed oil [64]. Niedbała [65] predicted the yield of winter rapeseed (Brassica napus L.) using ANN as of 30 June. The study covered fields located in Poland, in the southern part of the Opole Province. The neural network with a MLP topology predicted the explained variable with a MAPE error of 9.43%. The obtained N1 model in the in-house work was also characterized by low prediction errors. For example, the MAPE error was 2.721, which, according to Peng et al. [66] testifies to the model’s excellent degree of fit, as the error does not exceed 10%. When MAPE is in the range of 10–20%, the degree of model fit is good. A forecasting model that achieves a MAPE error of more than 30% should be rejected due to poor mapping of predicted values with actual values. A low MAPE error (7.203%) was also obtained in a study by Piekutowska et al. [25], where a neural network with a MLP topology was built to predict the yield of very early potato varieties 40 days before harvest. Prediction of yield and its quality traits before harvesting gains importance in the era of changing climatic conditions. The unstable course of weather during the growing season of crops makes the quality of the crop variable each year. Obtaining models to accurately forecast food production is crucial for policy making and managing national food security plans [67]. Artificial neural networks were also successfully used in wheat yield prediction. The MLP model obtained had an RMS error of 0.4237 [68].
Niazian et al. [30] predicted the essential oil content of ajowan (Carum copticum L.) using ANN and MLR. Field studies were conducted from 2014–2015 in central Tehran. Four phenological traits were used as input data. The selection of independent variables was preceded by simple correlation analysis. The study showed that the ANN model with two latent layers predicted essential oil content with a mean squared error of 0.23% and a mean absolute error of 0.14%. In addition, the authors’ research showed higher performance of the ANN model compared to the MLR, which had an RMS error of 0.26% and an MAE error of 0.18%. The artificial neural network model also had a higher coefficient of determination value (R2 = 0.88) compared to the multiple regression model (R2 = 0.74). The results of our own study also showed the superiority of neural networks over MLR in predicting the protein content of pea seeds. These results are consistent with another study [36], where the performance of MLP and stepwise regression networks was compared in predicting the essential oil content of fennel (Foeniculum vulgare Mill.). A total of 11 independent variables were used to build the neural network. The resulting MLP model with a topology of 11:11-9-7-1:1 was characterized by a coefficient of determination of 0.953 and 0.929 for the training and test set, respectively. The stepwise regression model, on the other hand, was characterized by an R2 magnitude of 0.553. The neural network was additionally characterized by lower prediction errors compared to the MLR. The RMS and MAE error for the ANN were 0.544 and 0.385, respectively, while for the stepwise regression, the magnitudes of these errors were obtained at the level of 0.819 and 0.624. As can be seen from the data in Table 5, the N1 model predicted the protein content of peas with an RMS error of 0.838 and an MAE error of 0.617. The values of these errors are smaller than those obtained using the RS model, demonstrating the greater effectiveness of artificial neural networks over multiple regression in predicting the issue under analysis. The advantage of artificial neural networks over classical regression modeling is due to the ability of ANNs to approximate non-linear functions [33]. In agricultural crops, many relationships between the analyzed variables have a complex and non-linear course, and MLR models are capable of predicting linear phenomena. Therefore, MLR cannot explain complex nonlinear relationships between independent variables and the dependent variable [69]. In addition to artificial neural networks, random forest regression (RFR) has also been used in agricultural science. Machine learning tools were built to predict the yield of winter rapeseed. The results obtained showed better predictive ability of the RFR model compared to the ANN model [33].
The sensitivity analysis performed for the ANN model showed that the protein content of peas was most affected by soil minerals (Mg, K, P). These variables received rankings one, two and three, respectively (Table 6). Interestingly, the response of pea plants, in terms of protein content, was greater for soil richness in these components than for mineral fertilization. Soil micronutrient and macronutrient abundance critically affects plant growth and development, as well as the quality of the yield obtained [70]. Plants respond less to current mineral fertilization than to high soil nutrient abundance [71]. Yano and Kume [72] noted, in pot experiments, an increased growth of corn root length on soil with a locally elevated phosphorus content. Low root mass increased the efficiency of phosphorus uptake per unit root weight with a low consumption of photosynthetic products.
Magnesium (Mg) received a rank of one in the neural network sensitivity analysis conducted. This means that this element had the greatest impact on the protein content of pea seeds. Mg is one of nine key plant nutrients. It is used in large quantities by plants for proper growth, development and reproduction [73]. Mg has many important physiological functions. It is an essential component of chlorophyll [74], and is involved in CO2 assimilation reactions in the chloroplast [75]. Magnesium, like potassium (K), is essential for protein biosynthesis and significantly affects the absorption, utilization and metabolism of nitrogen (N) in plant roots [76]. For example, in soybean (Glycine max (L.) Merr.), nitrate uptake by the root system was influenced by Mg2+ and K+ ions through the regulation of the NRT2 transporters [77]. In a study conducted by Geng et al. [78], it was shown that rapeseed fertilized with magnesium exhibited increased nitrogen uptake at all fertilization levels (from 0 to 45 kg Mg·ha−1). Much of the Mg contained in leaves appears to be directly or indirectly related to protein synthesis, due to its role in nitrogen metabolism and in the structure and function of ribosomes [76,79,80]. Ribosomes are macromolecular structures that are responsible for protein biosynthesis [81].
A four-year field study conducted in Croatia on six soybean varieties showed that foliar application of magnesium resulted in an increase in protein content in addition to an increase in seed yield. These differences, relative to the control, were statistically significant at the significance level of α = 0.05 [82]. In contrast, a study by Sawan et al. [83] investigated the effect of potassium fertilization on cotton protein yield. The study was conducted in Giza, Egypt and covered two growing seasons. The results showed that protein yield significantly increased in plots where potassium was applied (47.4 kg·ha−1) compared to the control, where plants were not fertilized with this element. Similar results were obtained in the present study. A higher Mg content in the soil caused an increase in the protein concentration in pea seeds (Figure 3). A similar relationship was observed for potassium (this variable received a rank of two in the network sensitivity analysis). However, the increase in protein content as a result of higher soil abundance of this element was not as great as in the case of magnesium.
Soil phosphorus content and average daily air temperature were the variables that received ranks three and four, respectively, in the sensitivity analysis (Table 6). Interestingly, TEMP received the highest rank among the weather variables. However, in order for this development not to be disturbed, air temperatures should remain at optimal levels throughout the growing season. Each species has an optimal temperature range for its development, while an excessive decrease or increase can contribute to plant damage [84]. Research conducted by Walter et al. [85] from 2016–2018 show that air temperature was positively correlated with the protein content of pea and bean (Vicia faba L.) seeds grown in Germany. Higher temperatures were associated with higher protein concentrations in both pea and broad bean seeds. These results correlate with the data presented in this paper (Figure 4), where higher protein concentrations were recorded in peas as the average daily temperature increased. The increase in seed protein content was also associated with a higher soil phosphorus content. However, this effect was smaller the lower the daily temperatures were. Low temperatures result in reduced P uptake by plants. When the air temperature is less than 12 °C, the uptake of this element by the root system is largely blocked [86].
Phosphorus is an integral part of cell membranes and nucleic acids and is directly involved in protein synthesis [87]. Therefore, a close relationship between plant P nutrition and various physiological and biochemical traits is frequently and widely reported in the literature [88,89,90,91]. The proper nutrition of plants with this component leads to an increase in protein nitrogen and nitrogen of essential amino acids. However, the expected effect can be variable: positive (increase in protein content), neutral or negative (decrease in protein content following the so-called dilution effect). The negative effect results from an increase in usable yield, but in quantitative terms (e.g., for protein yield) it is positive [92].
The results concerning the significance of independent traits generated by using the models do not always coincide. The network sensitivity analysis showed that nitrogen fertilization of pea plants had a negligible effect on seed protein content. However, stepwise regression showed that this variable had a statistically significant effect on the dependent variable under study. Nitrogen is a macronutrient that significantly affects protein synthesis by plants [93]. However, according to a study conducted by Faligowska et al. [17], nitrogen in pea seeds grown in Brody (Poland) was accumulated from three main sources: soil, atmosphere and fertilizers. The largest amount of accumulated nitrogen came from the soil (57.9%), followed by the atmosphere (35.2%) and fertilizers (6.8%). The analysis of the multiple regression results confirmed the well-known state of knowledge about the relationship between nitrogen fertilization and protein content. However, the resulting neural network highlighted less well-known and much more interesting aspects of certain relationships. Relationships between given factors in agricultural production are determined mainly by weather conditions prevailing in a given growing season, habitat conditions and genotypes of crops grown.

5. Conclusions

The developed MLP-type artificial neural network model successfully predicted the protein content of pea seeds 20 days before the harvest date. The model had higher prediction accuracy and lower ex-post error values with respect to the stepwise regression model. The accuracy of MLP networks is mainly dependent on the accuracy of the data at one’s disposal and the amount of information fed into the model. In the case of artificial neural networks, an important task is to maintain a balance between the model’s ability to approximate and generalize. The analysis conducted showed that the network accurately predicted the dependent variable based on a five-year field study. The results obtained did not allow the rejection of the null hypotheses, thus confirming the validity of the assumptions made at the outset. The N1 model, due to its lower error values and higher R2 value, more accurately predicted the protein content of peas. For this reason, this model seems to be better in practical application.
This work can serve as a strand for future research on the prediction of pea seed quality such as the content of fat, nitrogen-free compounds, the largest part of which in pea seeds is starch and anti-nutritional compounds. A continuation of the present research will be the optimization of NPK fertilization taking into account the liming needs of general-purpose pea varieties.

Author Contributions

Conceptualization, P.H., M.P. and G.N.; methodology, P.H., M.P. and G.N.; validation, M.P. and G.N.; formal analysis, M.P.; investigation, P.H.; resources, P.H.; data curation, P.H.; writing—original draft preparation, P.H.; writing—review and editing, P.H., M.P. and G.N.; supervision, G.N.; project administration, M.P. All authors have read and agreed to the published version of the manuscript.

Funding

This research received no external funding.

Institutional Review Board Statement

Not applicable.

Informed Consent Statement

Not applicable.

Data Availability Statement

Not applicable.

Conflicts of Interest

The authors declare no conflict of interest.

Abbreviations

ANN-artificial neural networks; CCA-Community Catalogs of Agricultural; CCV-Community Catalogs of Varieties of Vegetable; COBORU-Research Center for Cultivar Testing; DUS-distinctiveness, uniformity and durability; FLOWE-number of days from 1 January to the beginning of flowering; GEN-general variety of peas; HAR-number of days from 1 January to the date of harvesting; INI_MA-number of days from 1 January to onset of maturity; K20_C-K2O content in the soil; K2O-potassium oxide; K2O_F-Total potassium from mineral fertilizers; kg-kilogram; MAE-mean absolute error; MAPE-mean absolute percentage error; MAX-maximum error determined for the whole model; MAXP-maximum percentage error; mg-miligram; MgO-magnesium oxide; MGO_C-MgO content in the soil; MLP-multilayer perceptron; MLR-multiple linear regression; MO-organic matter; n-number of observations; N_F-total nitrogen from mineral fertilizers; N1-built its own neural network model; P_EMER-number of days from 1 January to the beginning of plant emergence; P_HIG-plant height; P2O5-phosphorus(V) oxide; P2O5_C-P2O5 content in the soil; P2O5_F-total phosphorus from mineral fertilizers; PH-Soil pH; PROT-Percentage of protein in pea seeds; PRVT-Program of Registered Varietal Experimentation; RAE-global relative error of model approximation; RAIN-total rainfall from sowing date to 14 July; RMS-root mean square error; RS-built its own linear regression model; SOWI-number of days from 1 January to sowing date; SUN-total sunshine from sowing date to 14 July; TECH_M-number of days from 1 January to technical maturity; TEMP-average air temperature from sowing date to 14 July; VCU-trials for cultivation and use value; WEGW-number of plant growing days; y′i-predictive values, obtained with the model; yi-actual values.

References

  1. Khatun, M.; Sarkar, S.; Era, F.M.; Islam, A.K.M.M.; Anwar, M.P.; Fahad, S.; Datta, R.; Islam, A.K.M.A. Drought Stress in Grain Legumes: Effects, Tolerance Mechanisms and Management. Agronomy 2021, 11, 2374. [Google Scholar] [CrossRef]
  2. Atnaf, M.; Tesfaye, K.; Dagne, K. The Importance of Legumes in the Ethiopian Farming System and Overall Economy: An Overview. Am. J. Exp. Agric. 2015, 7, 347–358. [Google Scholar] [CrossRef]
  3. Graham, P.H.; Vance, C.P. Legumes: Importance and Constraints to Greater Use. Plant Physiol. 2003, 131, 872–877. [Google Scholar] [CrossRef] [PubMed] [Green Version]
  4. Kalembasa, S.; Szukała, J.; Faligowska, A.; Kalembasa, D.; Symanowicz, B.; Becher, M.; Gebus-Czupyt, B. Quantification of Biologically Fixed Nitrogen by White Lupin (Lupins albus L.) and Its Subsequent Uptake by Winter Wheat Using the 15N Isotope Dilution Method. Agronomy 2020, 10, 1392. [Google Scholar] [CrossRef]
  5. Putra, R.; Powell, J.R.; Hartley, S.E.; Johnson, S.N. Is it time to include legumes in plant silicon research? Funct. Ecol. 2020, 34, 1142–1157. [Google Scholar] [CrossRef] [Green Version]
  6. Daryanto, S.; Wang, L.; Jacinthe, P.-A. Global Synthesis of Drought Effects on Food Legume Production. PLoS ONE 2015, 10, e0127401. [Google Scholar] [CrossRef] [Green Version]
  7. Torabian, S.; Farhangi-Abriz, S.; Denton, M.D. Do tillage systems influence nitrogen fixation in legumes? A review. Soil Tillage Res. 2019, 185, 113–121. [Google Scholar] [CrossRef]
  8. Gentzbittel, L.; Andersen, S.U.; Ben, C.; Rickauer, M.; Stougaard, J.; Young, N.D. Naturally occurring diversity helps to reveal genes of adaptive importance in legumes. Front. Plant Sci. 2015, 6, 269. [Google Scholar] [CrossRef] [Green Version]
  9. Wang, X.; Yang, Y.; Pei, K.; Zhou, J.; Peixoto, L.; Gunina, A.; Zeng, Z.; Zang, H.; Rasmussen, J.; Kuzyakov, Y. Nitrogen rhizodeposition by legumes and its fate in agroecosystems: A field study and literature review. Land Degrad. Dev. 2021, 32, 410–419. [Google Scholar] [CrossRef]
  10. Neugschwandtner, R.W.; Bernhuber, A.; Kammlander, S.; Wagentristl, H.; Klimek-Kopyra, A.; Lošák, T.; Zholamanov, K.K.; Kaul, H.-P. Nitrogen Yields and Biological Nitrogen Fixation of Winter Grain Legumes. Agronomy 2021, 11, 681. [Google Scholar] [CrossRef]
  11. Boukid, F.; Rosell, C.M.; Castellari, M. Pea protein ingredients: A mainstream ingredient to (re)formulate innovative foods and beverages. Trends Food Sci. Technol. 2021, 110, 729–742. [Google Scholar] [CrossRef]
  12. Powierzchnia Upraw w Gminach. Available online: https://rejestrupraw.arimr.gov.pl/ (accessed on 26 June 2022).
  13. Bogahawaththa, D.; Bao Chau, N.H.; Trivedi, J.; Dissanayake, M.; Vasiljevic, T. Impact of selected process parameters on solubility and heat stability of pea protein isolate. LWT 2019, 102, 246–253. [Google Scholar] [CrossRef]
  14. Pratap, A.; Das, A.; Kumar, S.; Gupta, S. Current Perspectives on Introgression Breeding in Food Legumes. Front. Plant Sci. 2021, 11, 589189. [Google Scholar] [CrossRef]
  15. Gao, Z.; Shen, P.; Lan, Y.; Cui, L.; Ohm, J.-B.; Chen, B.; Rao, J. Effect of alkaline extraction pH on structure properties, solubility, and beany flavor of yellow pea protein isolate. Food Res. Int. 2020, 131, 109045. [Google Scholar] [CrossRef]
  16. Chaudhary, A.; Marinangeli, C.; Tremorin, D.; Mathys, A. Nutritional Combined Greenhouse Gas Life Cycle Analysis for Incorporating Canadian Yellow Pea into Cereal-Based Food Products. Nutrients 2018, 10, 490. [Google Scholar] [CrossRef] [PubMed] [Green Version]
  17. Faligowska, A.; Kalembasa, S.; Kalembasa, D.; Panasiewicz, K.; Szymańska, G.; Ratajczak, K.; Skrzypczak, G. The Nitrogen Fixation and Yielding of Pea in Different Soil Tillage Systems. Agronomy 2022, 12, 352. [Google Scholar] [CrossRef]
  18. Kornet, C.; Venema, P.; Nijsse, J.; van der Linden, E.; van der Goot, A.J.; Meinders, M. Yellow pea aqueous fractionation increases the specific volume fraction and viscosity of its dispersions. Food Hydrocoll. 2020, 99, 105332. [Google Scholar] [CrossRef]
  19. Röhe, I.; Göbel, T.W.; Goodarzi Boroojeni, F.; Zentek, J. Effect of feeding soybean meal and differently processed peas on the gut mucosal immune system of broilers. Poult. Sci. 2017, 96, 2064–2073. [Google Scholar] [CrossRef]
  20. Florek, J. Potential utilization of legumes in feed production in Poland. Ann. Polish Assoc. Agric. Agribus. Econ. 2017, XIX, 40–45. [Google Scholar] [CrossRef]
  21. Niedbała, G. Application of artificial neural networks for multi-criteria yield prediction of winter rapeseed. Sustainability 2019, 11, 533. [Google Scholar] [CrossRef]
  22. Hara, P.; Piekutowska, M.; Niedbała, G. Selection of Independent Variables for Crop Yield Prediction Using Artificial Neural Network Models with Remote Sensing Data. Land 2021, 10, 609. [Google Scholar] [CrossRef]
  23. Chipanshi, A.; Zhang, Y.; Kouadio, L.; Newlands, N.; Davidson, A.; Hill, H.; Warren, R.; Qian, B.; Daneshfar, B.; Bedard, F.; et al. Evaluation of the Integrated Canadian Crop Yield Forecaster (ICCYF) model for in-season prediction of crop yield across the Canadian agricultural landscape. Agric. For. Meteorol. 2015, 206, 137–150. [Google Scholar] [CrossRef] [Green Version]
  24. Nazir, A.; Ullah, S.; Saqib, Z.A.; Abbas, A.; Ali, A.; Iqbal, M.S.; Hussain, K.; Shakir, M.; Shah, M.; Butt, M.U. Estimation and Forecasting of Rice Yield Using Phenology-Based Algorithm and Linear Regression Model on Sentinel-II Satellite Data. Agriculture 2021, 11, 1026. [Google Scholar] [CrossRef]
  25. Piekutowska, M.; Niedbała, G.; Piskier, T.; Lenartowicz, T.; Pilarski, K.; Wojciechowski, T.; Pilarska, A.A.; Czechowska-Kosacka, A. The Application of Multiple Linear Regression and Artificial Neural Network Models for Yield Prediction of Very Early Potato Cultivars before Harvest. Agronomy 2021, 11, 885. [Google Scholar] [CrossRef]
  26. Niedbała, G.; Wróbel, B.; Piekutowska, M.; Zielewicz, W.; Paszkiewicz-Jasińska, A.; Wojciechowski, T.; Niazian, M. Application of Artificial Neural Networks Sensitivity Analysis for the Pre-Identification of Highly Significant Factors Influencing the Yield and Digestibility of Grassland Sward in the Climatic Conditions of Central Poland. Agronomy 2022, 12, 1133. [Google Scholar] [CrossRef]
  27. Shahhosseini, M.; Hu, G.; Archontoulis, S.V. Forecasting Corn Yield with Machine Learning Ensembles. Front. Plant Sci. 2020, 11, 1120. [Google Scholar] [CrossRef]
  28. Kakati, N.; Deka, R.L.; Das, P.; Goswami, J.; Khanikar, P.G.; Saikia, H. Forecasting yield of rapeseed and mustard using multiple linear regression and ANN techniques in the Brahmaputra valley of Assam, North East India. Theor. Appl. Climatol. 2022, 150, 1201–1215. [Google Scholar] [CrossRef]
  29. Pentoś, K.; Mbah, J.T.; Pieczarka, K.; Niedbała, G.; Wojciechowski, T. Evaluation of Multiple Linear Regression and Machine Learning Approaches to Predict Soil Compaction and Shear Stress Based on Electrical Parameters. Appl. Sci. 2022, 12, 8791. [Google Scholar] [CrossRef]
  30. Niazian, M.; Sadat-Noori, S.A.; Abdipour, M. Artificial neural network and multiple regression analysis models to predict essential oil content of ajowan (Carum copticum L.). J. Appl. Res. Med. Aromat. Plants 2018, 9, 124–131. [Google Scholar] [CrossRef]
  31. van Klompenburg, T.; Kassahun, A.; Catal, C. Crop yield prediction using machine learning: A systematic literature review. Comput. Electron. Agric. 2020, 177, 105709. [Google Scholar] [CrossRef]
  32. Abrougui, K.; Gabsi, K.; Mercatoris, B.; Khemis, C.; Amami, R.; Chehaibi, S. Prediction of organic potato yield using tillage systems and soil properties by artificial neural network (ANN) and multiple linear regressions (MLR). Soil Tillage Res. 2019, 190, 202–208. [Google Scholar] [CrossRef]
  33. Rajković, D.; Marjanović Jeromela, A.; Pezo, L.; Lončar, B.; Zanetti, F.; Monti, A.; Kondić Špika, A. Yield and Quality Prediction of Winter Rapeseed—Artificial Neural Network and Random Forest Models. Agronomy 2021, 12, 58. [Google Scholar] [CrossRef]
  34. Abraham, E.R.; Mendes dos Reis, J.G.; Vendrametto, O.; de Oliveira Costa Neto, P.L.; Carlo Toloi, R.; de Souza, A.E.; Oliveira Morais, M. de Time Series Prediction with Artificial Neural Networks: An Analysis Using Brazilian Soybean Production. Agriculture 2020, 10, 475. [Google Scholar] [CrossRef]
  35. Rathod, S.; Yerram, S.; Arya, P.; Katti, G.; Rani, J.; Padmakumari, A.P.; Somasekhar, N.; Padmavathi, C.; Ondrasek, G.; Amudan, S.; et al. Climate-Based Modeling and Prediction of Rice Gall Midge Populations Using Count Time Series and Machine Learning Approaches. Agronomy 2021, 12, 22. [Google Scholar] [CrossRef]
  36. Sabzi-Nojadeh, M.; Niedbała, G.; Younessi-Hamzekhanlu, M.; Aharizad, S.; Esmaeilpour, M.; Abdipour, M.; Kujawa, S.; Niazian, M. Modeling the Essential Oil and Trans-Anethole Yield of Fennel (Foeniculum vulgare Mill. var. vulgare) by Application Artificial Neural Network and Multiple Linear Regression Methods. Agriculture 2021, 11, 1191. [Google Scholar] [CrossRef]
  37. Kujawa, S.; Dach, J.; Kozłowski, R.J.; Przybył, K.; Niedbała, G.; Mueller, W.; Tomczak, R.J.; Zaborowicz, M.; Koszela, K. Maturity classification for sewage sludge composted with rapeseed straw using neural image analysis. In Proceedings of the SPIE—The International Society for Optical Engineering, Chengu, China, 29 August 2016; Falco, C.M., Jiang, X., Eds.; SPIE: Bellingham, WA, USA, 2016; p. 100332H. [Google Scholar] [CrossRef]
  38. Maya Gopal, P.S.; Bhargavi, R. A novel approach for efficient crop yield prediction. Comput. Electron. Agric. 2019, 165, 104968. [Google Scholar] [CrossRef]
  39. Cieniawska, B.; Pentoś, K.; Łuczycka, D. Neural modeling and optimization of the coverage of the sprayed surface. Bull. Pol. Acad. Sci. Tech. Sci. 2020, 68, 601–608. [Google Scholar] [CrossRef]
  40. Marchant, J.; Onyango, C. Comparison of a Bayesian classifier with a multilayer feed-forward neural network using the example of plant/weed/soil discrimination. Comput. Electron. Agric. 2003, 39, 3–22. [Google Scholar] [CrossRef]
  41. Pentoś, K.; Łuczycka, D.; Kapłon, T. The identification of relationships between selected honey parameters by extracting the contribution of independent variables in a neural network model. Eur. Food Res. Technol. 2015, 241, 793–801. [Google Scholar] [CrossRef]
  42. Research Centre for Cultivar Testing (COBORU). Available online: https://coboru.gov.pl/ (accessed on 20 October 2022).
  43. Niedbała, G.; Tratwal, A.; Piekutowska, M.; Wojciechowski, T.; Uglis, J. A Framework for Financing Post-Registration Variety Testing System: A Case Study from Poland. Agronomy 2022, 12, 325. [Google Scholar] [CrossRef]
  44. Porejestrowe Doświadczalnictwo Odmianowe (PDO). Available online: https://coboru.gov.pl/pdo/pdo (accessed on 20 October 2022).
  45. Dane Publiczne IMGW. Available online: https://danepubliczne.imgw.pl/ (accessed on 20 October 2022).
  46. Mádlíková, M.; Krausová, I.; Mizera, J.; Táborský, J.; Faměra, O.; Chvátil, D. Nitrogen assay in winter wheat by short-time instrumental photon activation analysis and its comparison with the Kjeldahl method. J. Radioanal. Nucl. Chem. 2018, 317, 479–486. [Google Scholar] [CrossRef]
  47. Simonne, A.H.; Simonne, E.H.; Eitenmiller, R.R.; Mills, H.A.; Cresman, C.P. Could the Dumas Method Replace the Kjeldahl Digestion for Nitrogen and Crude Protein Determinations in Foods? J. Sci. Food Agric. 1997, 73, 39–45. [Google Scholar] [CrossRef]
  48. Ma, Y.; Zhang, Z.; Kang, Y.; Özdoğan, M. Corn yield prediction and uncertainty analysis based on remotely sensed variables using a Bayesian neural network approach. Remote Sens. Environ. 2021, 259, 112408. [Google Scholar] [CrossRef]
  49. Roy Choudhury, M.; Das, S.; Christopher, J.; Apan, A.; Chapman, S.; Menzies, N.W.; Dang, Y.P. Improving Biomass and Grain Yield Prediction of Wheat Genotypes on Sodic Soil Using Integrated High-Resolution Multispectral, Hyperspectral, 3D Point Cloud, and Machine Learning Techniques. Remote Sens. 2021, 13, 3482. [Google Scholar] [CrossRef]
  50. Priya, P.K.; Yuvaraj, N. An IoT Based Gradient Descent Approach for Precision Crop Suggestion using MLP. J. Phys. Conf. Ser. 2019, 1362, 012038. [Google Scholar] [CrossRef]
  51. Bhojani, S.H.; Bhatt, N. Wheat crop yield prediction using new activation functions in neural network. Neural Comput. Appl. 2020, 32, 13941–13951. [Google Scholar] [CrossRef]
  52. Niedbała, G.; Piekutowska, M.; Weres, J.; Korzeniewicz, R.; Witaszek, K.; Adamski, M.; Pilarski, K.; Czechowska-Kosacka, A.; Krysztofiak-Kaniewska, A. Application of artificial neural networks for yield modeling of winter rapeseed based on combined quantitative and qualitative data. Agronomy 2019, 9, 781. [Google Scholar] [CrossRef] [Green Version]
  53. Pazhanivelan, S.; Geethalakshmi, V.; Tamilmounika, R.; Sudarmanian, N.S.; Kaliaperumal, R.; Ramalingam, K.; Sivamurugan, A.P.; Mrunalini, K.; Yadav, M.K.; Quicho, E.D. Spatial Rice Yield Estimation Using Multiple Linear Regression Analysis, Semi-Physical Approach and Assimilating SAR Satellite Derived Products with DSSAT Crop Simulation Model. Agronomy 2022, 12, 2008. [Google Scholar] [CrossRef]
  54. Niedbała, G.; Kurek, J.; Świderski, B.; Wojciechowski, T.; Antoniuk, I.; Bobran, K. Prediction of Blueberry (Vaccinium corymbosum L.) Yield Based on Artificial Intelligence Methods. Agriculture 2022, 12, 2089. [Google Scholar] [CrossRef]
  55. Schwalbert, R.A.; Amado, T.; Corassa, G.; Pott, L.P.; Prasad, P.V.V.; Ciampitti, I.A. Satellite-based soybean yield forecast: Integrating machine learning and weather data for improving crop yield prediction in southern Brazil. Agric. For. Meteorol. 2020, 284, 107886. [Google Scholar] [CrossRef]
  56. Shankar, T.; Malik, G.C.; Banerjee, M.; Dutta, S.; Praharaj, S.; Lalichetti, S.; Mohanty, S.; Bhattacharyay, D.; Maitra, S.; Gaber, A.; et al. Prediction of the Effect of Nutrients on Plant Parameters of Rice by Artificial Neural Network. Agronomy 2022, 12, 2123. [Google Scholar] [CrossRef]
  57. Niedbała, G.; Kurasiak-Popowska, D.; Piekutowska, M.; Wojciechowski, T.; Kwiatek, M.; Nawracała, J. Application of Artificial Neural Network Sensitivity Analysis to Identify Key Determinants of Harvesting Date and Yield of Soybean (Glycine max [L.] Merrill) Cultivar Augusta. Agriculture 2022, 12, 754. [Google Scholar] [CrossRef]
  58. Wojciechowski, T.; Niedbala, G.; Czechlowski, M.; Nawrocka, J.R.; Piechnik, L.; Niemann, J. Rapeseed seeds quality classification with usage of VIS-NIR fiber optic probe and artificial neural networks. In Proceedings of the 2016 International Conference on Optoelectronics and Image Processing (ICOIP), Warsaw, Poland, 10–12 June 2016; IEEE: Warsaw, Poland, 2016; pp. 44–48. [Google Scholar] [CrossRef]
  59. Manish Lad, A.; Mani Bharathi, K.; Akash Saravanan, B.; Karthik, R. Factors affecting agriculture and estimation of crop yield using supervised learning algorithms. Mater. Today Proc. 2022, 62, 4629–4634. [Google Scholar] [CrossRef]
  60. Yildirim, T.; Moriasi, D.N.; Starks, P.J.; Chakraborty, D. Using Artificial Neural Network (ANN) for Short-Range Prediction of Cotton Yield in Data-Scarce Regions. Agronomy 2022, 12, 828. [Google Scholar] [CrossRef]
  61. Akbar, A.; Kuanar, A.; Patnaik, J.; Mishra, A.; Nayak, S. Application of Artificial Neural Network modeling for optimization and prediction of essential oil yield in turmeric (Curcuma longa L.). Comput. Electron. Agric. 2018, 148, 160–178. [Google Scholar] [CrossRef]
  62. Niedbała, G.; Kurasiak-Popowska, D.; Stuper-Szablewska, K.; Nawracała, J. Application of Artificial Neural Networks to Analyze the Concentration of Ferulic Acid, Deoxynivalenol, and Nivalenol in Winter Wheat Grain. Agriculture 2020, 10, 127. [Google Scholar] [CrossRef] [Green Version]
  63. Szwedziak, K.; Polańczyk, E.; Grzywacz, Ż.; Niedbała, G.; Wojtkiewicz, W. Neural Modeling of the Distribution of Protein, Water and Gluten in Wheat Grains during Storage. Sustainability 2020, 12, 5050. [Google Scholar] [CrossRef]
  64. Huang, S.; Liu, Y.; Sun, X.; Li, J. Application of Artificial Neural Network Based on Traditional Detection and GC-MS in Prediction of Free Radicals in Thermal Oxidation of Vegetable Oil. Molecules 2021, 26, 6717. [Google Scholar] [CrossRef]
  65. Niedbała, G. Simple model based on artificial neural network for early prediction and simulation winter rapeseed yield. J. Integr. Agric. 2019, 18, 54–61. [Google Scholar] [CrossRef] [Green Version]
  66. Peng, J.; Kim, M.; Kim, Y.; Jo, M.; Kim, B.; Sung, K.; Lv, S. Constructing Italian ryegrass yield prediction model based on climatic data by locations in South Korea. Grassl. Sci. 2017, 63, 184–195. [Google Scholar] [CrossRef]
  67. Nosratabadi, S.; Ardabili, S.; Lakner, Z.; Mako, C.; Mosavi, A. Prediction of Food Production Using Machine Learning Algorithms of Multilayer Perceptron and ANFIS. Agriculture 2021, 11, 408. [Google Scholar] [CrossRef]
  68. Ahmed, M.U.; Hussain, I. Prediction of Wheat Production Using Machine Learning Algorithms in northern areas of Pakistan. Telecomm. Policy 2022, 46, 102370. [Google Scholar] [CrossRef]
  69. Meerasri, J.; Sothornvit, R. Artificial neural networks (ANNs) and multiple linear regression (MLR) for prediction of moisture content for coated pineapple cubes. Case Stud. Therm. Eng. 2022, 33, 101942. [Google Scholar] [CrossRef]
  70. Saba, T.; Liu, W.; Wang, J.; Saleem, F.; Kang, X.; Hui, W.; Gong, W.; Li, H. Effects of organic supplementation to reduced rates of chemical fertilization on soil fertility of Zanthoxylum armatum. Dendrobiology 2022, 87, 123–136. [Google Scholar] [CrossRef]
  71. Dincă, L.C.; Grenni, P.; Onet, C.; Onet, A. Fertilization and Soil Microbial Community: A Review. Appl. Sci. 2022, 12, 1198. [Google Scholar] [CrossRef]
  72. Yano, K.; Kume, T. Root Morphological Plasticity for Heterogeneous Phosphorus Supply in Zea mays L. Plant Prod. Sci. 2005, 8, 427–432. [Google Scholar] [CrossRef]
  73. Gransee, A.; Führs, H. Magnesium mobility in soils as a challenge for soil and plant analysis, magnesium fertilization and root uptake under adverse growth conditions. Plant Soil 2013, 368, 5–21. [Google Scholar] [CrossRef] [Green Version]
  74. Wei, Q.; Guo, Y.; Kuai, B. Isolation and characterization of a chlorophyll degradation regulatory gene from tall fescue. Plant Cell Rep. 2011, 30, 1201–1207. [Google Scholar] [CrossRef]
  75. Xu, X.-F.; Wang, B.; Lou, Y.; Han, W.-J.; Lu, J.-Y.; Li, D.-D.; Li, L.-G.; Zhu, J.; Yang, Z.-N. Magnesium Transporter 5 plays an important role in Mg transport for male gametophyte development in Arabidopsis. Plant J. 2015, 84, 925–936. [Google Scholar] [CrossRef] [Green Version]
  76. Xie, K.; Cakmak, I.; Wang, S.; Zhang, F.; Guo, S. Synergistic and antagonistic interactions between potassium and magnesium in higher plants. Crop J. 2021, 9, 249–256. [Google Scholar] [CrossRef]
  77. Peng, W.T.; Qi, W.L.; Nie, M.M.; Xiao, Y.B.; Liao, H.; Chen, Z.C. Magnesium supports nitrogen uptake through regulating NRT2.1/2.2 in soybean. Plant Soil 2020, 457, 97–111. [Google Scholar] [CrossRef]
  78. Geng, G.; Cakmak, I.; Ren, T.; Lu, Z.; Lu, J. Effect of magnesium fertilization on seed yield, seed quality, carbon assimilation and nutrient uptake of rapeseed plants. F. Crop. Res. 2021, 264, 108082. [Google Scholar] [CrossRef]
  79. Chaudhry, A.H.; Nayab, S.; Hussain, S.B.; Ali, M.; Pan, Z. Current Understandings on Magnesium Deficiency and Future Outlooks for Sustainable Agriculture. Int. J. Mol. Sci. 2021, 22, 1819. [Google Scholar] [CrossRef] [PubMed]
  80. Wang, Z.; Hassan, M.U.; Nadeem, F.; Wu, L.; Zhang, F.; Li, X. Magnesium Fertilization Improves Crop Yield in Most Production Systems: A Meta-Analysis. Front. Plant Sci. 2020, 10, 1727. [Google Scholar] [CrossRef] [Green Version]
  81. Fischer, E.S.; Lohaus, G.; Heineke, D.; Heldt, H.W. Magnesium deficiency results in accumulation of carbohydrates and amino acids in source and sink leaves of spinach. Physiol. Plant. 1998, 102, 16–20. [Google Scholar] [CrossRef] [PubMed]
  82. Vrataric, M.; Sudaric, A.; Kovacevic, V.; Duvnjak, T.; Krizmanic, M.; Mijic, A. Response of soybean to foliar fertilization with magnesium sulfate (epsom salt). Cereal Res. Commun. 2006, 34, 709–712. [Google Scholar] [CrossRef]
  83. Sawan, Z.M.; Hafezb, S.A.; Basyony, A.E.; Alkassas, A.-E.-E.R. Cottonseed: Protein, oil yields, and oil properties as influenced by potassium fertilization and foliar application of zinc and phosphorus. Grasas Aceites 2007, 58, 40–48. [Google Scholar] [CrossRef] [Green Version]
  84. Skrzyczyńska, J.; Gąsiorowska, B. Uprawa Roślin; UPW: Wrocław, Poland, 2020; pp. 49–210. [Google Scholar]
  85. Walter, S.; Zehring, J.; Mink, K.; Quendt, U.; Zocher, K.; Rohn, S. Protein content of peas (Pisum sativum) and beans (Vicia faba)—Influence of cultivation conditions. J. Food Compos. Anal. 2022, 105, 104257. [Google Scholar] [CrossRef]
  86. Grzebisz, W. Nawożenie Roślin Uprawnych 2; Powszechne Wydawnictwo Rolnicze i Leśne: Poznań, Poland, 2009. [Google Scholar]
  87. Singh, S.K.; Reddy, V.R.; Fleisher, D.H.; Timlin, D.J. Phosphorus Nutrition Affects Temperature Response of Soybean Growth and Canopy Photosynthesis. Front. Plant Sci. 2018, 9, 1116. [Google Scholar] [CrossRef]
  88. Singh, S.K.; Reddy, V.R. Combined effects of phosphorus nutrition and elevated carbon dioxide concentration on chlorophyll fluorescence, photosynthesis, and nutrient efficiency of cotton. J. Plant Nutr. Soil Sci. 2014, 177, 892–902. [Google Scholar] [CrossRef] [Green Version]
  89. Singh, S.K.; Reddy, V.R. Response of carbon assimilation and chlorophyll fluorescence to soybean leaf phosphorus across CO2: Alternative electron sink, nutrient efficiency and critical concentration. J. Photochem. Photobiol. B Biol. 2015, 151, 276–284. [Google Scholar] [CrossRef] [PubMed]
  90. Taliman, N.A.; Dong, Q.; Echigo, K.; Raboy, V.; Saneoka, H. Effect of Phosphorus Fertilization on the Growth, Photosynthesis, Nitrogen Fixation, Mineral Accumulation, Seed Yield, and Seed Quality of a Soybean Low-Phytate Line. Plants 2019, 8, 119. [Google Scholar] [CrossRef] [PubMed] [Green Version]
  91. Jin, J.; Wang, G.; Liu, X.; Pan, X.; Herbert, S.J.; Tang, C. Interaction between Phosphorus Nutrition and Drought on Grain Yield, and Assimilation of Phosphorus and Nitrogen in Two Soybean Cultivars Differing in Protein Concentration in Grains. J. Plant Nutr. 2006, 29, 1433–1449. [Google Scholar] [CrossRef]
  92. Niedbała, G.; Kozłowski, R.J. Application of Artificial Neural Networks for Multi-Criteria Yield Prediction of Winter Wheat. J. Agric. Sci. Technol. 2019, 21, 51–61. [Google Scholar]
  93. Wu, W.; Ma, B.-L.; Fan, J.-J.; Sun, M.; Yi, Y.; Guo, W.-S.; Voldeng, H.D. Management of nitrogen fertilization to balance reducing lodging risk and increasing yield and protein content in spring wheat. Field Crop. Res. 2019, 241, 107584. [Google Scholar] [CrossRef]
Figure 1. Location of field experiments conducted.
Agriculture 13 00029 g001
Figure 2. Architecture of neural network with MLP topology.
Agriculture 13 00029 g002
Figure 3. Scatter plot of observed and predicted values for the N1 model.
Agriculture 13 00029 g003
Figure 4. Scatter plot of observed and predicted values for the RS model.
Agriculture 13 00029 g004
Figure 5. Response surface of the N1 model for percent protein and two dependent variables MGO_C and K2O_C.
Agriculture 13 00029 g005
Figure 6. Response surface of model N1 for percent protein and two dependent variables TEMP and P2O5_C.
Agriculture 13 00029 g006
Figure 7. Response surface of the N1 model for protein percentage and two dependent variables TEMP and MGO_C.
Agriculture 13 00029 g007
Table 1. Variables used to build the N1 and RS model.
SymbolUnit of MeasureVariable DescriptionData Range
Independent Variables
RAINmmTotal rainfall from sowing date to 14 July96.9–312.4
SUNhTotal sunshine from sowing date to 14 July630.5–1051.5
TEMP°CAverage air temperature from sowing date to 14 July11.0–17.5
N_Fkg·ha−1Total nitrogen from mineral fertilizers10–90
P2O5_Fkg·ha−1Total phosphorus from mineral fertilizers0–80
K2O_Fkg·ha−1Total potassium from mineral fertilizers0–119
SOWIdaysNumber of days from 1 January to sowing date83–102
P_EMERdaysNumber of days from 1 January to the beginning of plant emergence96–133
HARdaysNumber of days from 1 January to the date of harvesting184–221
FLOWEdaysNumber of days from 1 January to the beginning of flowering 126–169
INI_MAdaysNumber of days from 1 January to onset of maturity167–211
TECH_MdaysNumber of days from 1 January to technical maturity171–216
P_HIGcmPlant height43–156
WEGWdays Number of plant growing days87–137
PH-Soil pH 5.5–7.5
P2O5_CScale from 0 to 4 *P2O5 content in the soil 0–4
K2O_CScale from 0 to 4 *K2O content in the soil0–4
MGO_CScale from 0 to 4 *MgO content in the soil0–4
GENfeature coded 101 to 111General variety of peas-
Dependent variable
PROT%Percentage of protein in pea seeds18.56–29.22
* The scale from 0 to 4 refers to the abundance of macronutrients in the soil and is determined as follows: 0—very low, 1—low, 2—medium, 3—high, 4—very high.
Table 2. Assessment of the abundance of soils in Poland.
ResourcesPhosphorus, mg P2O5·kg−1 SoilPotassium, mg K2O·kg−1 SoilMagnesium, mg MgO·kg−1 Soil
Soil Agronomic CategorySoil Agronomic Category
LightMediumHeavyLightMediumHeavy
very lowup to 50up to 100up to 105up to 170up to 80up to 105up to 120
low51–80101–160106–170171–26081–135106–160121–220
average81–115161–275171–310261–350136–200161–265221–330
high116–185276–380311–420351–510201–285266–330331–460
very high>185>380>420>510>285>330>460
Table 3. Subset error size and number of learning epochs of neural networks.
SubsetsTeachingValidationTesting
Size of error0.05510.05350.0595
Quality0.36420.41450.0551
Epochs of learning
Back propagation method of error100
Coupled gradients method55b *
* b (best)-the best result in the indicated learning epoch.
Table 4. Quality parameters of the N1 model.
Quality MeasuresValue
Average22.857
Standard deviation1.895
Average error0.008
Error deviation0.744
Average absolute error0.574
Deviation quotient0.393
Correlation coefficient r0.920
Table 5. MLR analysis results.
FactorMLR: r = 0.6949
R2 = 0.4829
Standard Error of Estimate = 1.374
BetaStandard Error BetabStandard Error bpSignificance
Free Term --40.4450.8590.000000+
MGO_C0.3230.0350.5760.0620.000000+
RAIN−0.1540.034−0.0050.0010.000007+
K2O_F−0.2980.041−0.0210.0030.000000+
N_F−0.1870.031−0.0280.0050.000000+
HAR−0.3160.041−0.0650.0090.000000+
P_HIG0.2340.0330.0270.0040.000000+
FLOWE0.0620.0420.0210.0150.146017
TECH_M−1.0630.127−0.2140.0260.000000+
INI_A0.7450.1380.1520.0280.000000+
P2O5_F0.1950.0430.0200.0040.000006+
TEMP−0.3400.086−0.4160.1040.000077+
SOWI0.1820.0710.0610.0240.009821+
GEN0.04390.0230.0260.0140.056315
K2O_C−0.0550.031−0.1020.0630.083382
SUN0.0670.0320.0010.00060.036298+
P2O5_C−0.0360.029−0.0740.0600.211476
PH0.0400.0320.1580.1280.219669
Determination of the level of statistical significance: − non-significant. + significant for α = 0.05.
Table 6. Quality parameters of the N1 model.
VariableQuotientRank
GEN1.08218
RAIN1.15812
SUN1.11016
TEMP1.3964
N_F1.11015
P2O5_F1.09517
K2O_F1.1948
SOWI1.3645
P_EMER1.16011
WEGE1.2577
HAR1.1799
FLOWE1.04919
INI_MA1.2656
TECH_M1.13113
P_HIG1.13613
PH1.17510
P2O5_C1.4133
K2O_C1.5462
MGO_C2.3661
Table 7. Quality assessment of the N1 and RS model.
Error TypeN1 ModelRS Model
RAE0.0370.118
RMS0.8382.696
MAE0.6172.032
MAPE2.7218.852
MAX2.9777.943
MAXP13.00128.853
Disclaimer/Publisher’s Note: The statements, opinions and data contained in all publications are solely those of the individual author(s) and contributor(s) and not of MDPI and/or the editor(s). MDPI and/or the editor(s) disclaim responsibility for any injury to people or property resulting from any ideas, methods, instructions or products referred to in the content.

