
Prediction of Single Disc Seeding System Forces, Using a Semi-Analytical and Discrete Element Method (DEM) Considering Rotation Effects
 and
and
Abstract
:1. Introduction
2. Materials and Methods
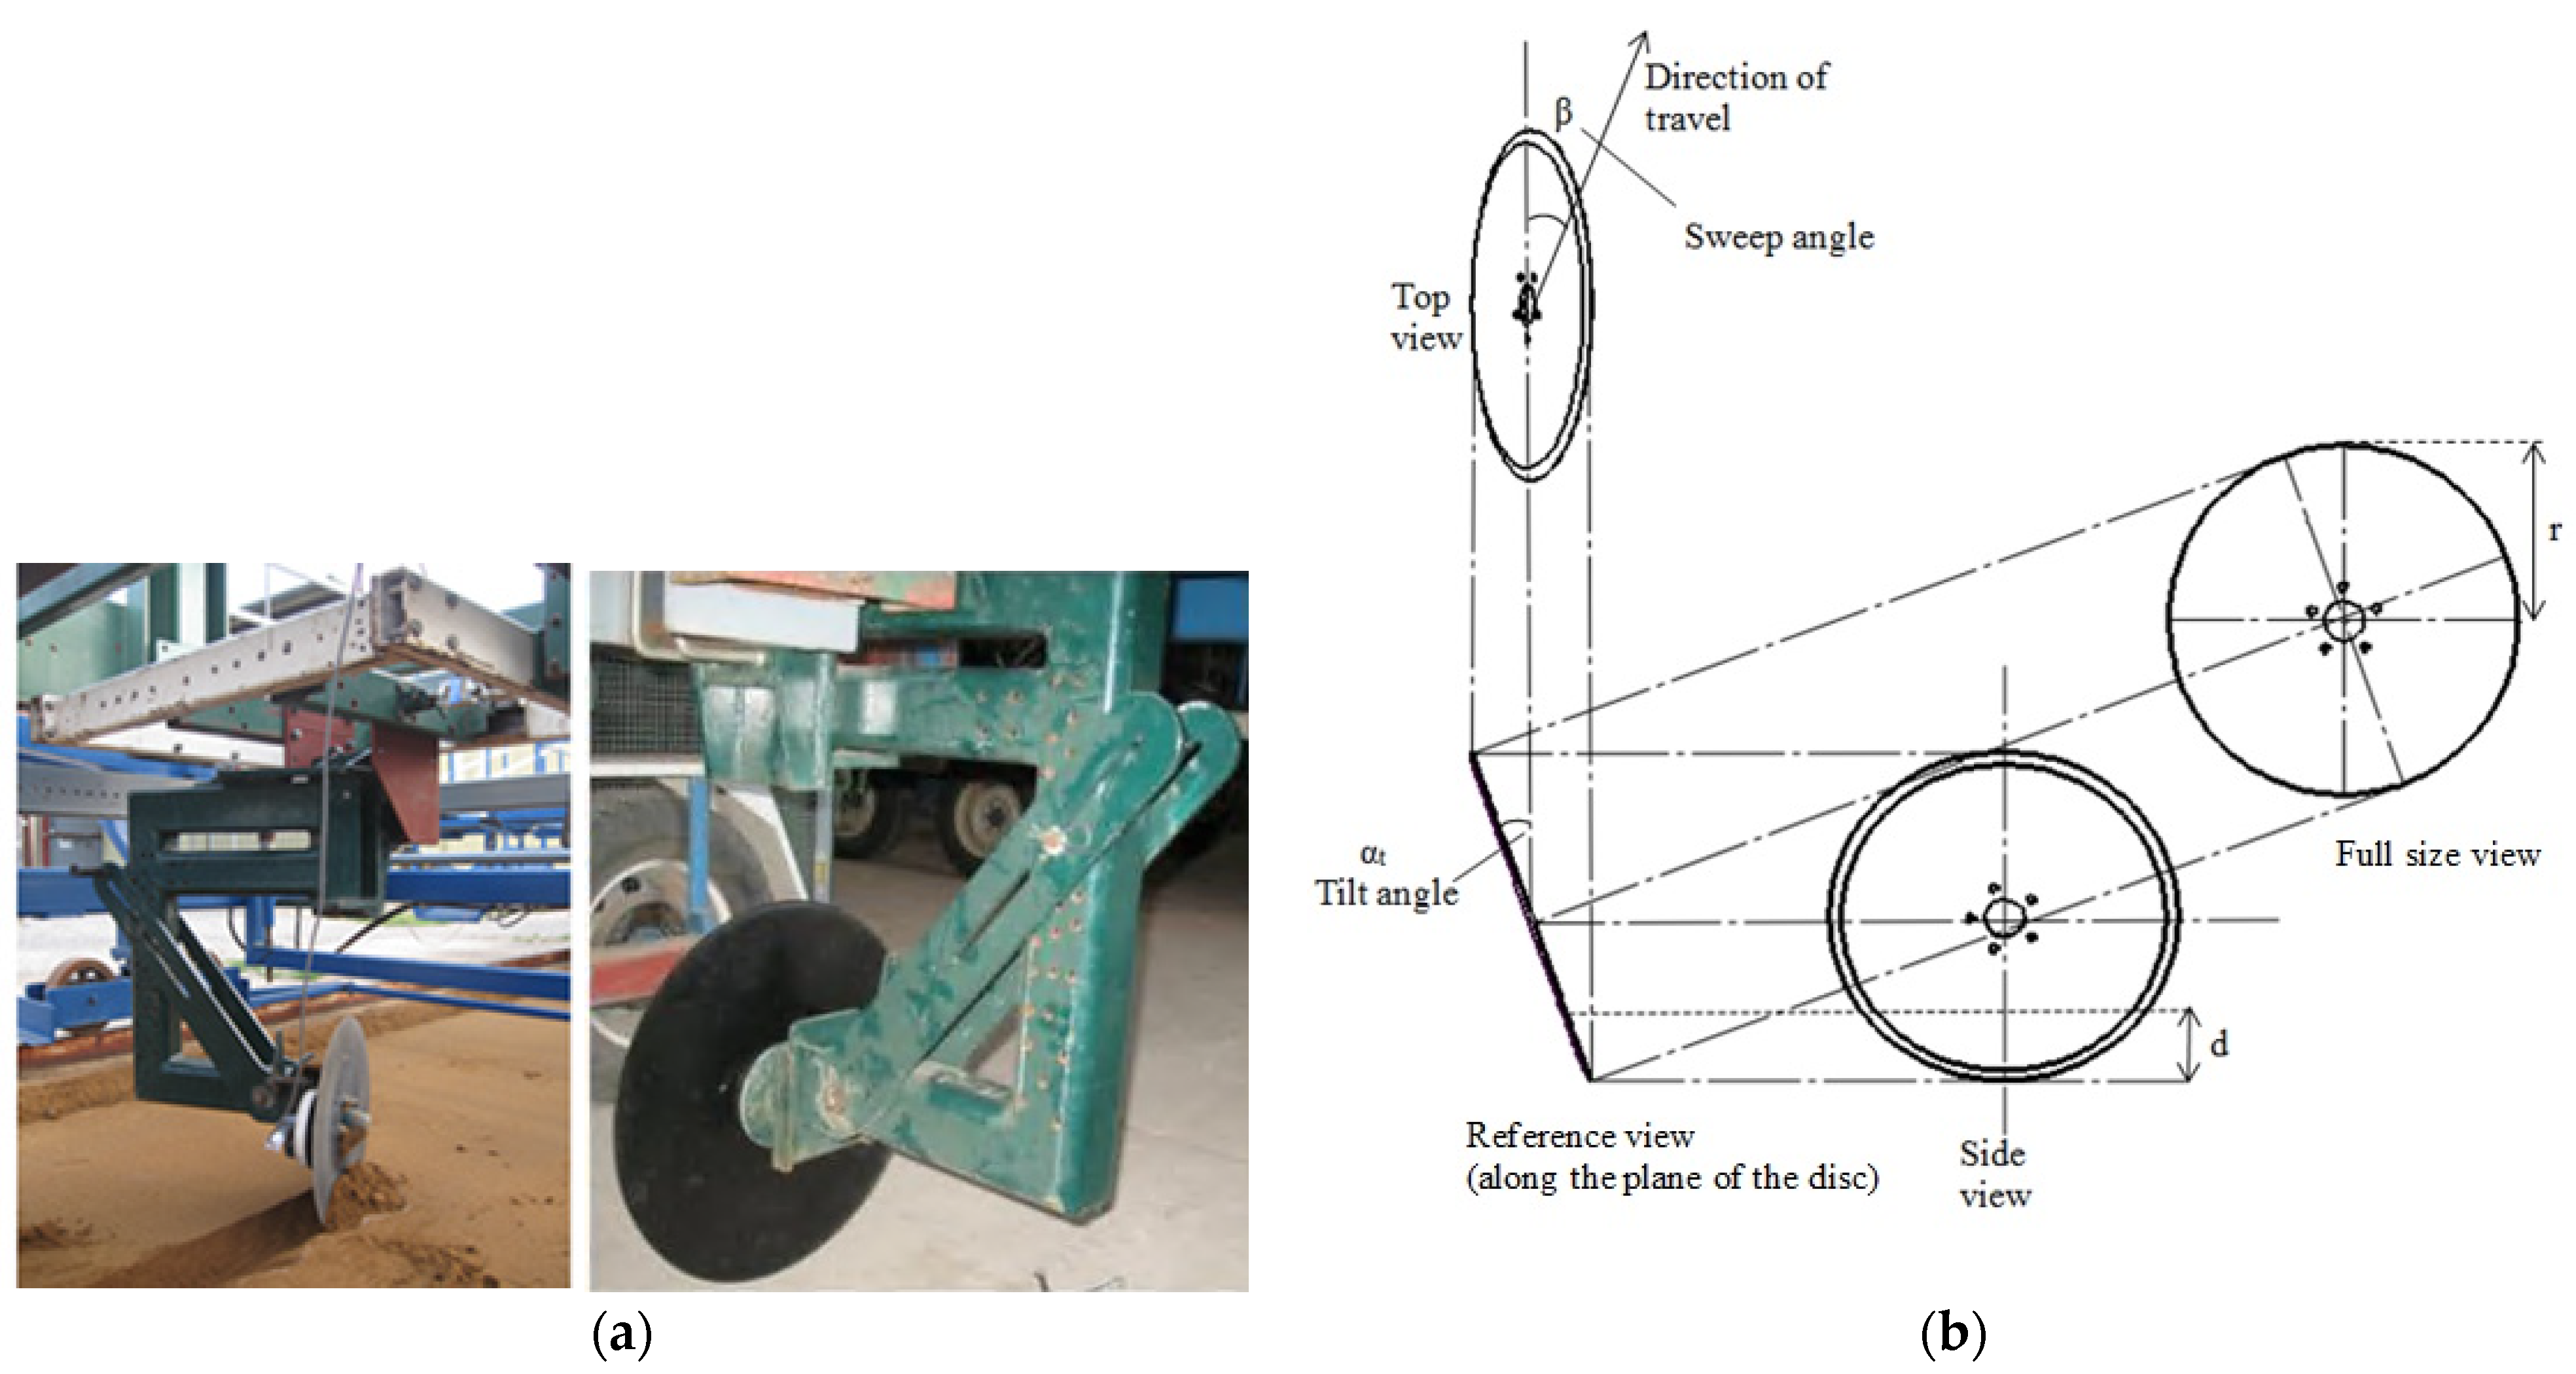
2.1. Experimental Work
2.2. Analytical Model Development
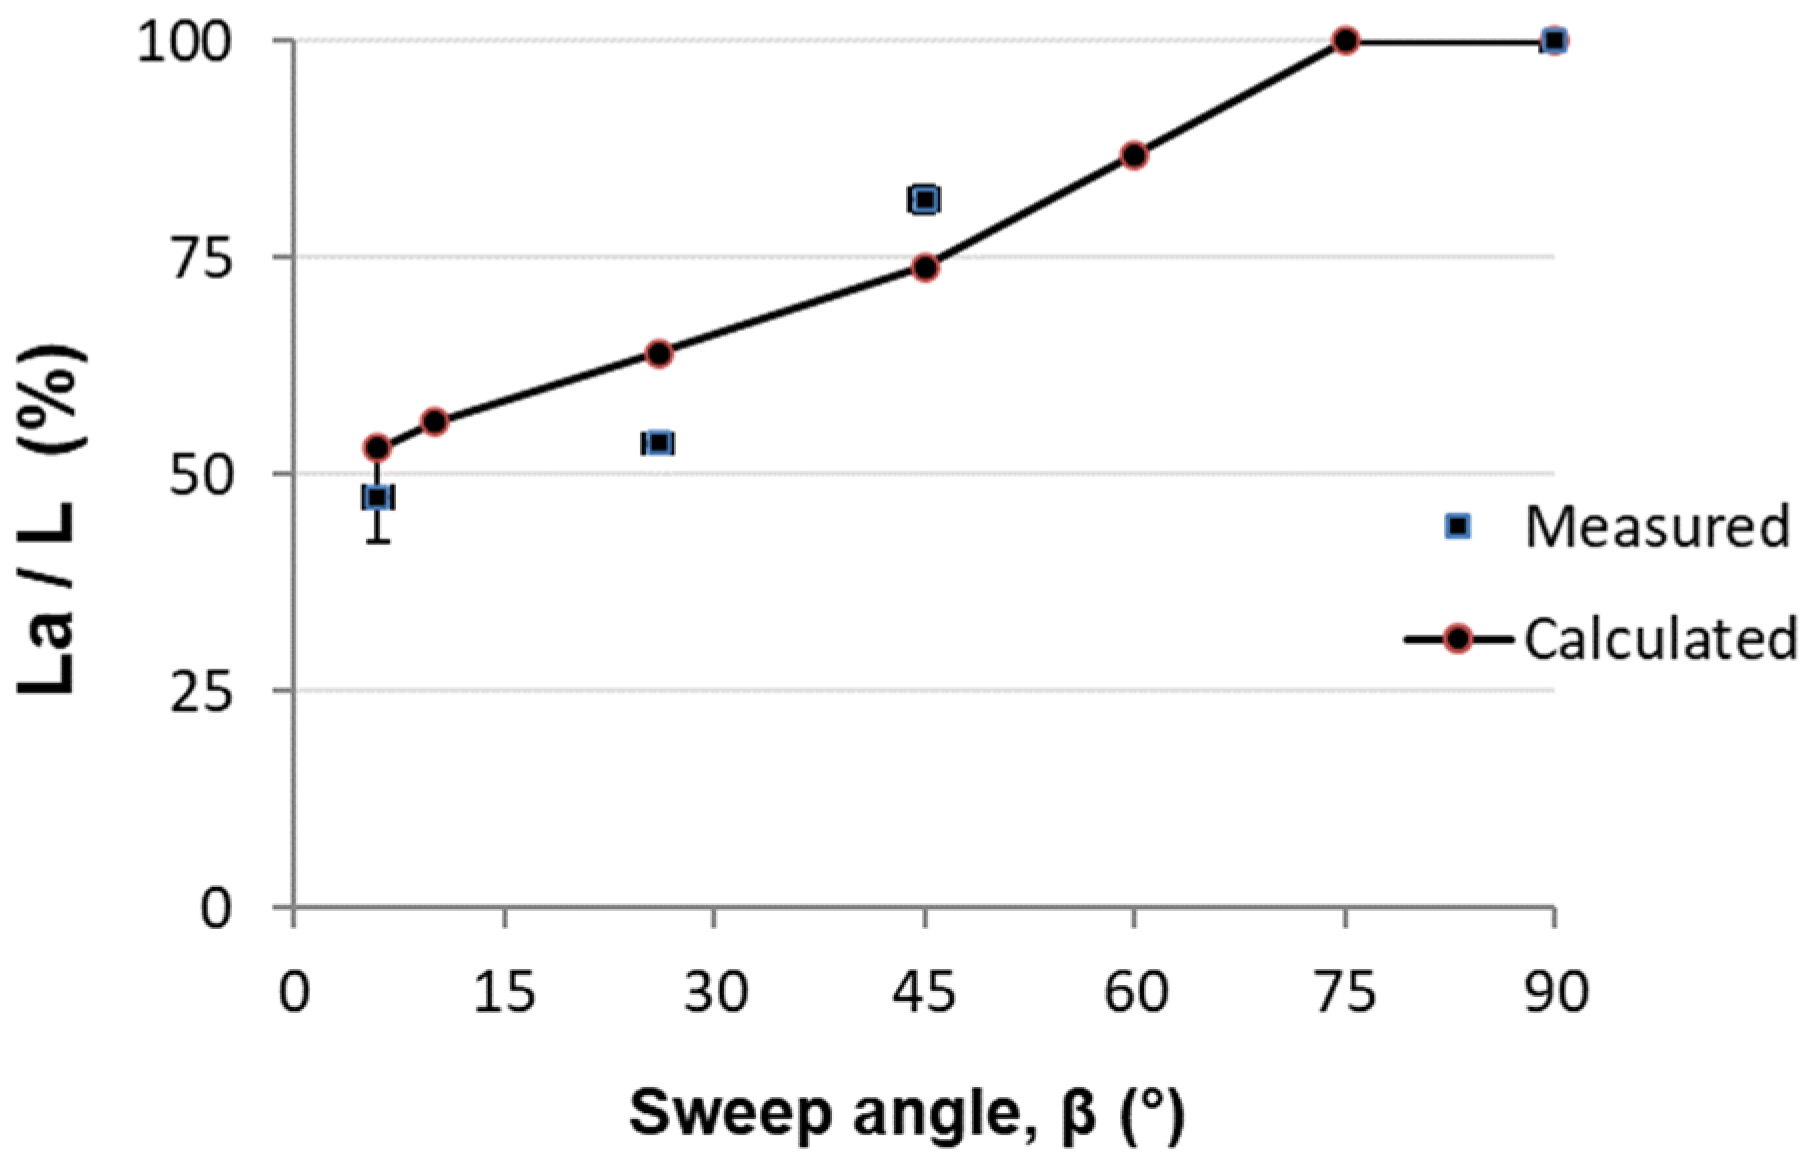
2.2.1. To Determine the Active Part of the Disc
2.2.2. Calculation of the Force
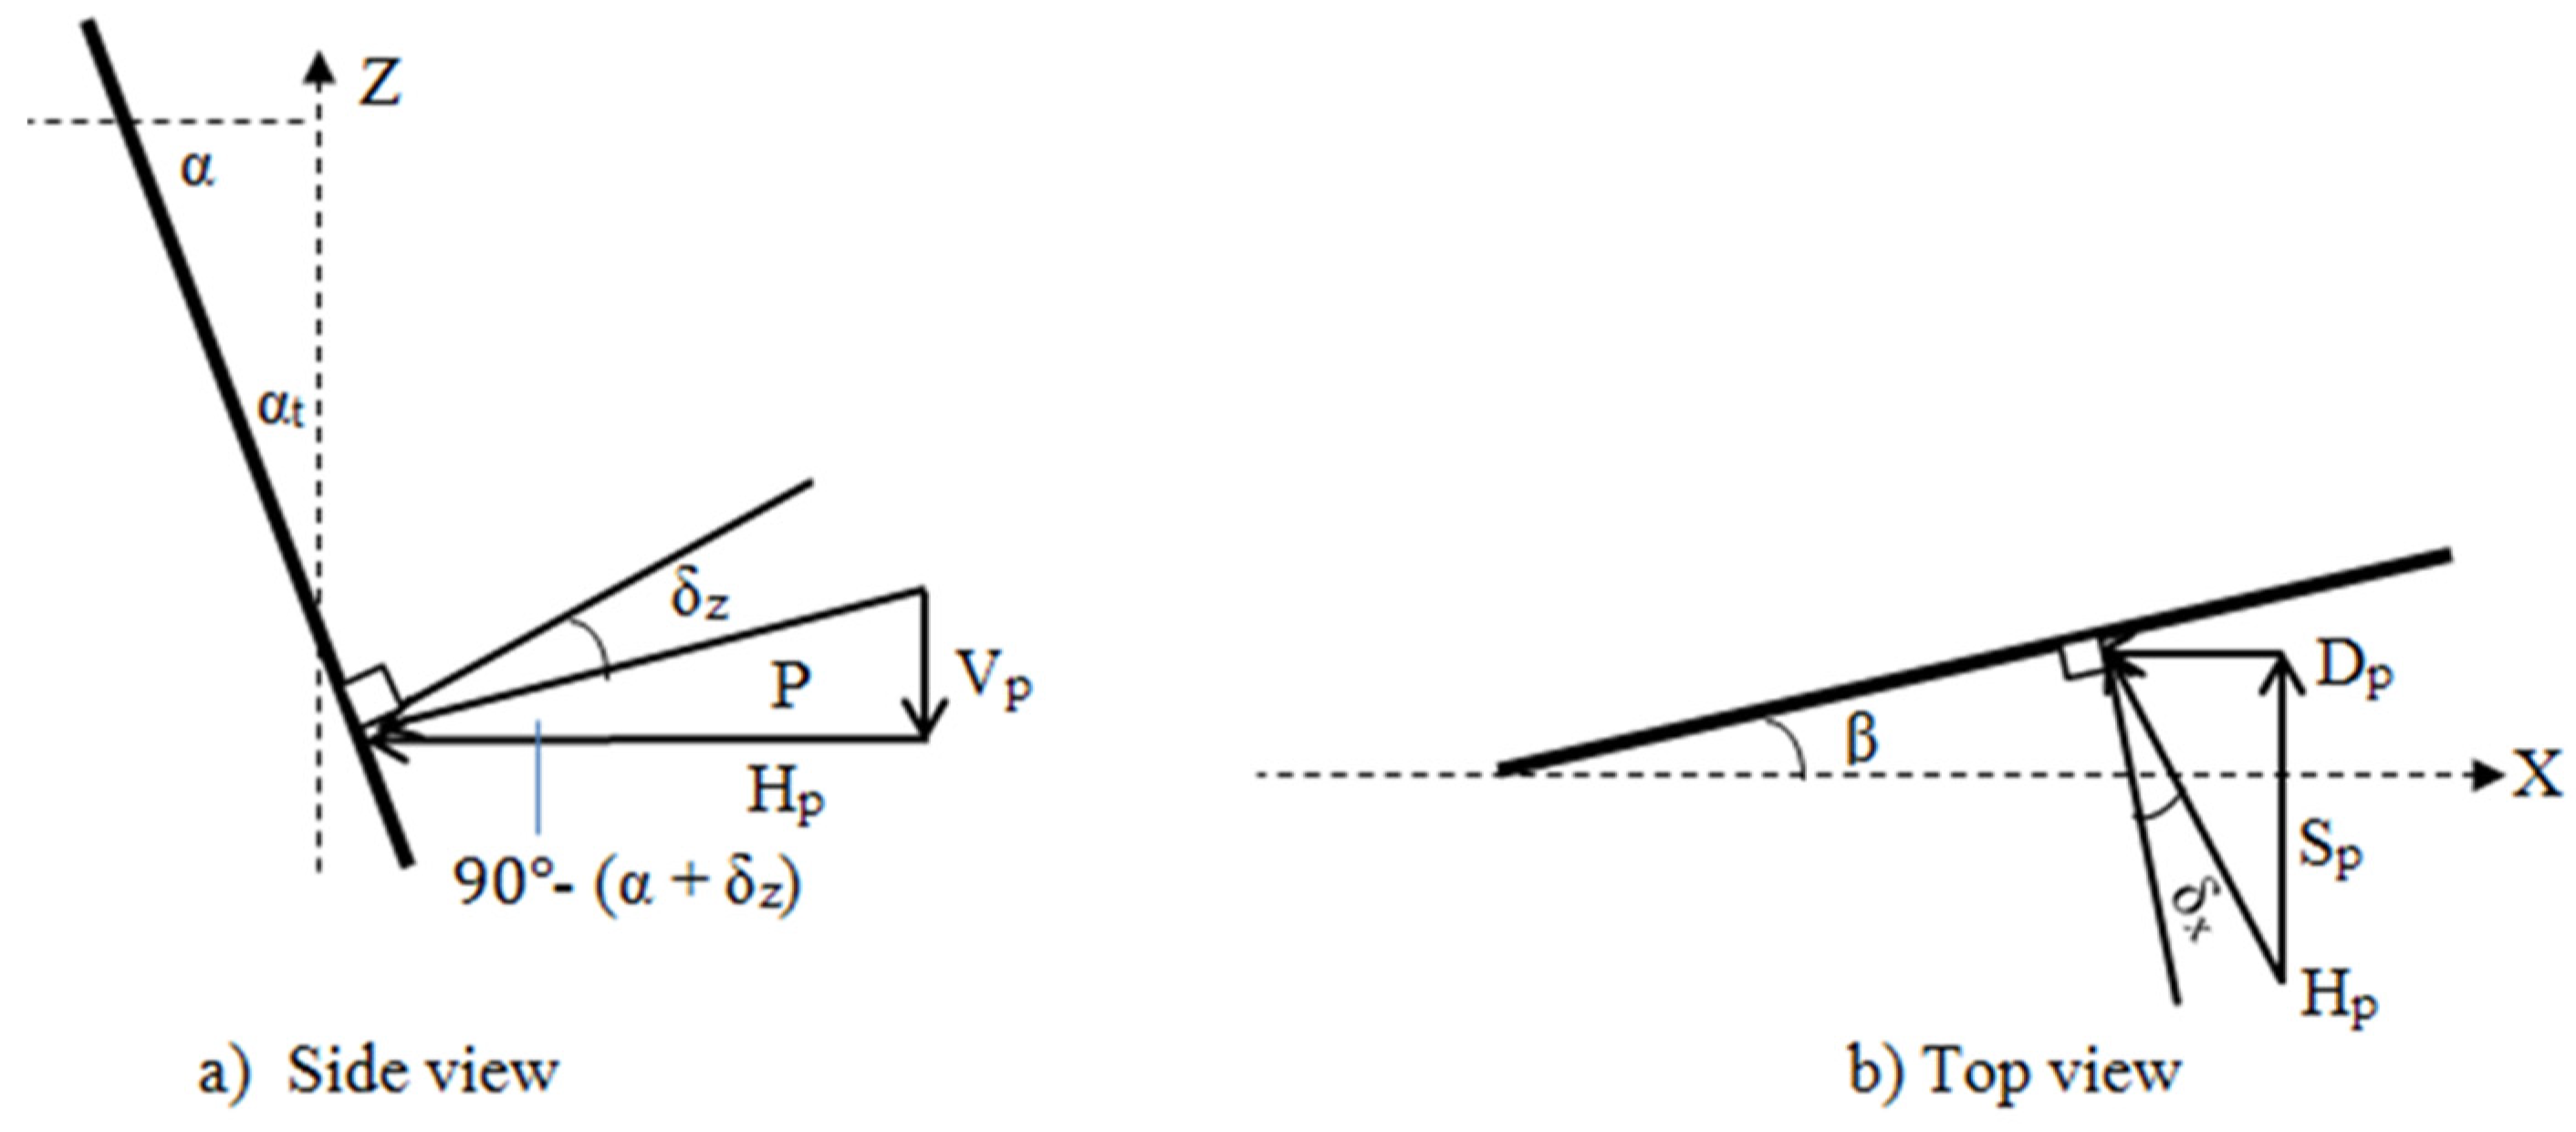
2.2.3. Effect of Disc Rotation on the Direction of Soil Reaction Forces
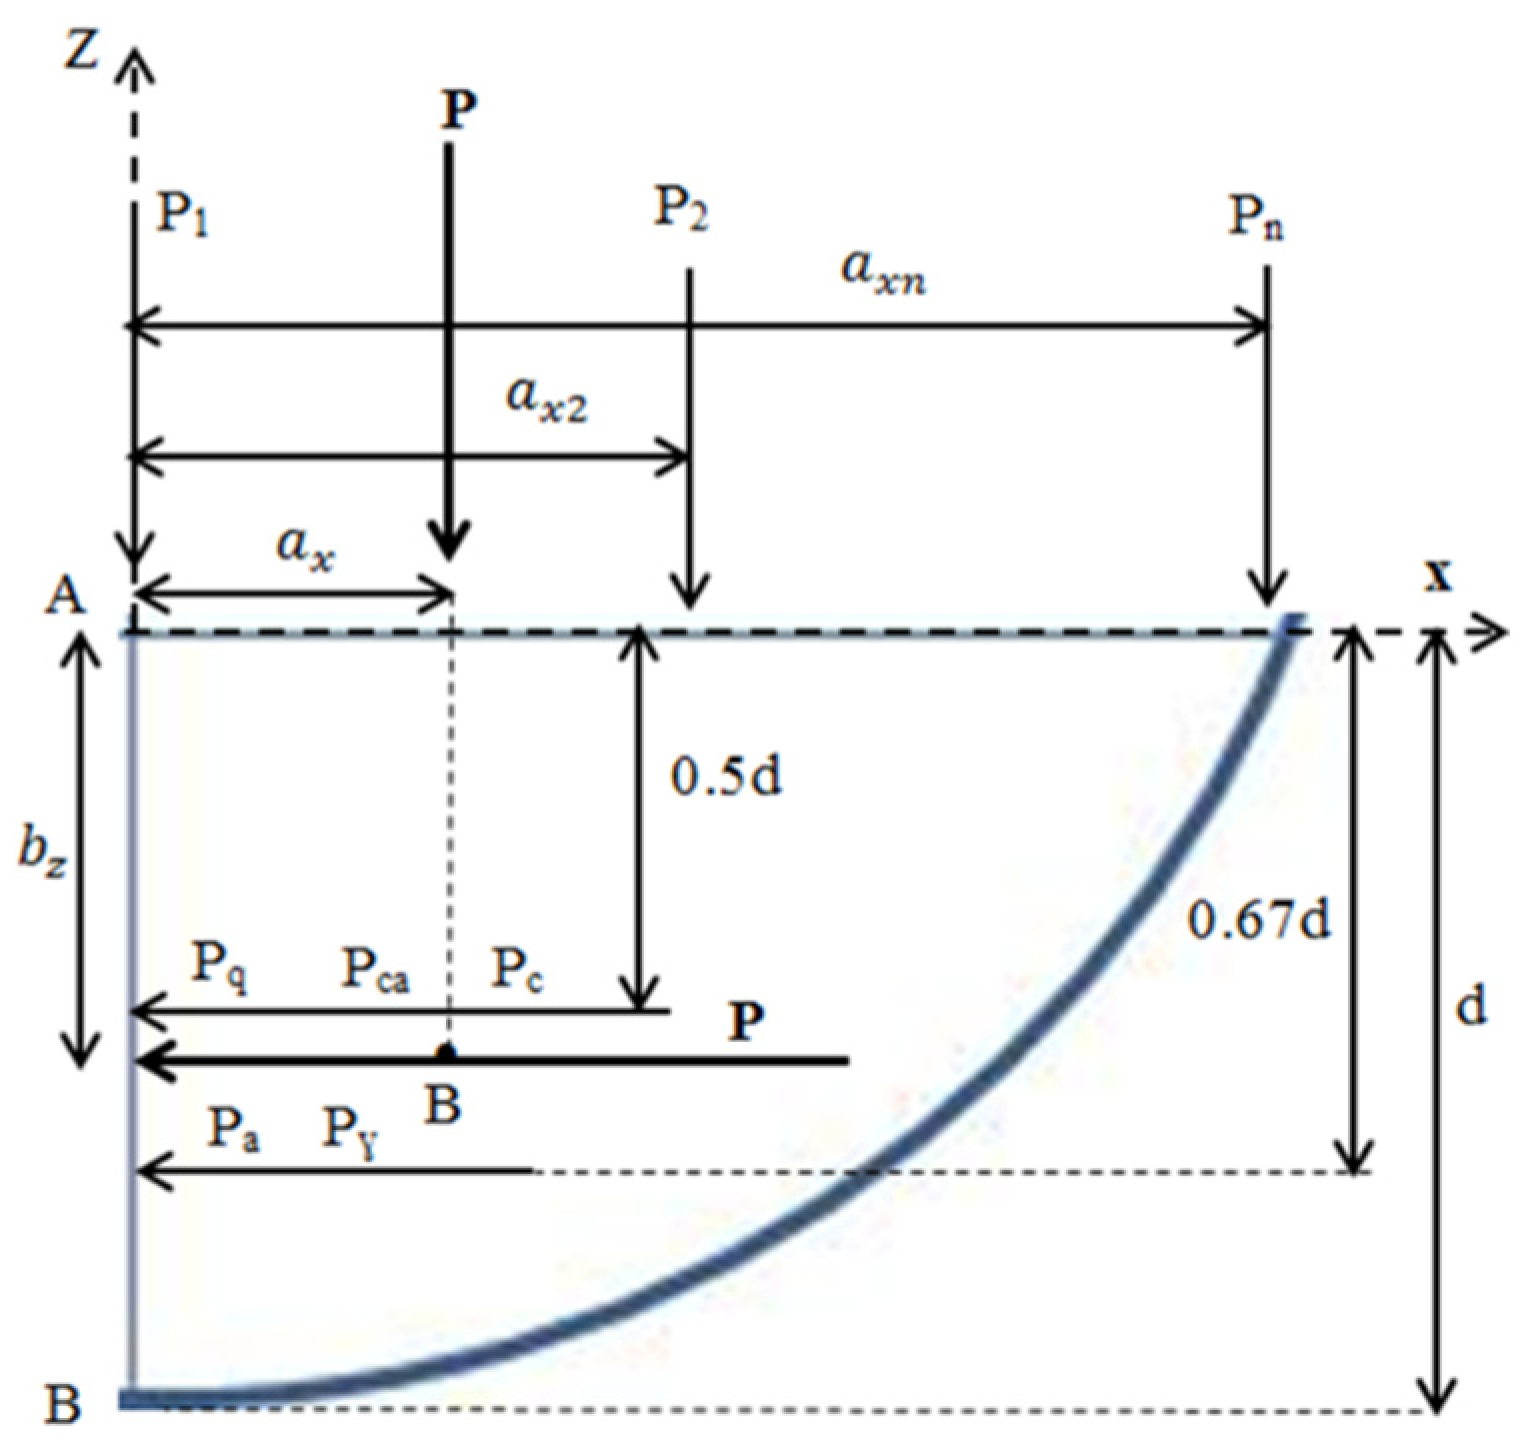
2.2.4. Method to Determine the Point of Action of force P on the Soil-Disc Contact Zone
Method to Determine the Point of Action of Force P on a Vertical Plane
To Determine the Point of Action of Force P on a Horizontal Plane
2.2.5. Method to Determine the Direction of Friction
2.2.6. Method to Determine the 3D Force Component of the Free-Rolling Disc
2.3. DEM Simulations
3. Results
4. Conclusions
Author Contributions
Funding
Institutional Review Board Statement
Data Availability Statement
Acknowledgments
Conflicts of Interest
Nomenclature
| a | Indices for sphere or implement |
| Ac | Contact area, (m2) |
| b | Indices for sphere or implement |
| c | Cohesion (kPa) |
| ca | Adhesion (kPa) |
| d | Blade working depth (m) |
| Dp | Draught component of passive soil failure force (kN) |
| e | Coefficient of restitution |
| f | Forward rupture distance |
| Fc | Cohesion force, (N) |
| Fdn | Normal damping force, (N) |
| Fdt | Tangential damping force, (N) |
| Fn | Normal total contact force, (N) |
| Fsn | Normal contact force, (N) |
| Fst | Tangential contact force, (N) |
| Ft | Tangential total contact force, (N) |
| I | Moment of inertia, (kg m2) |
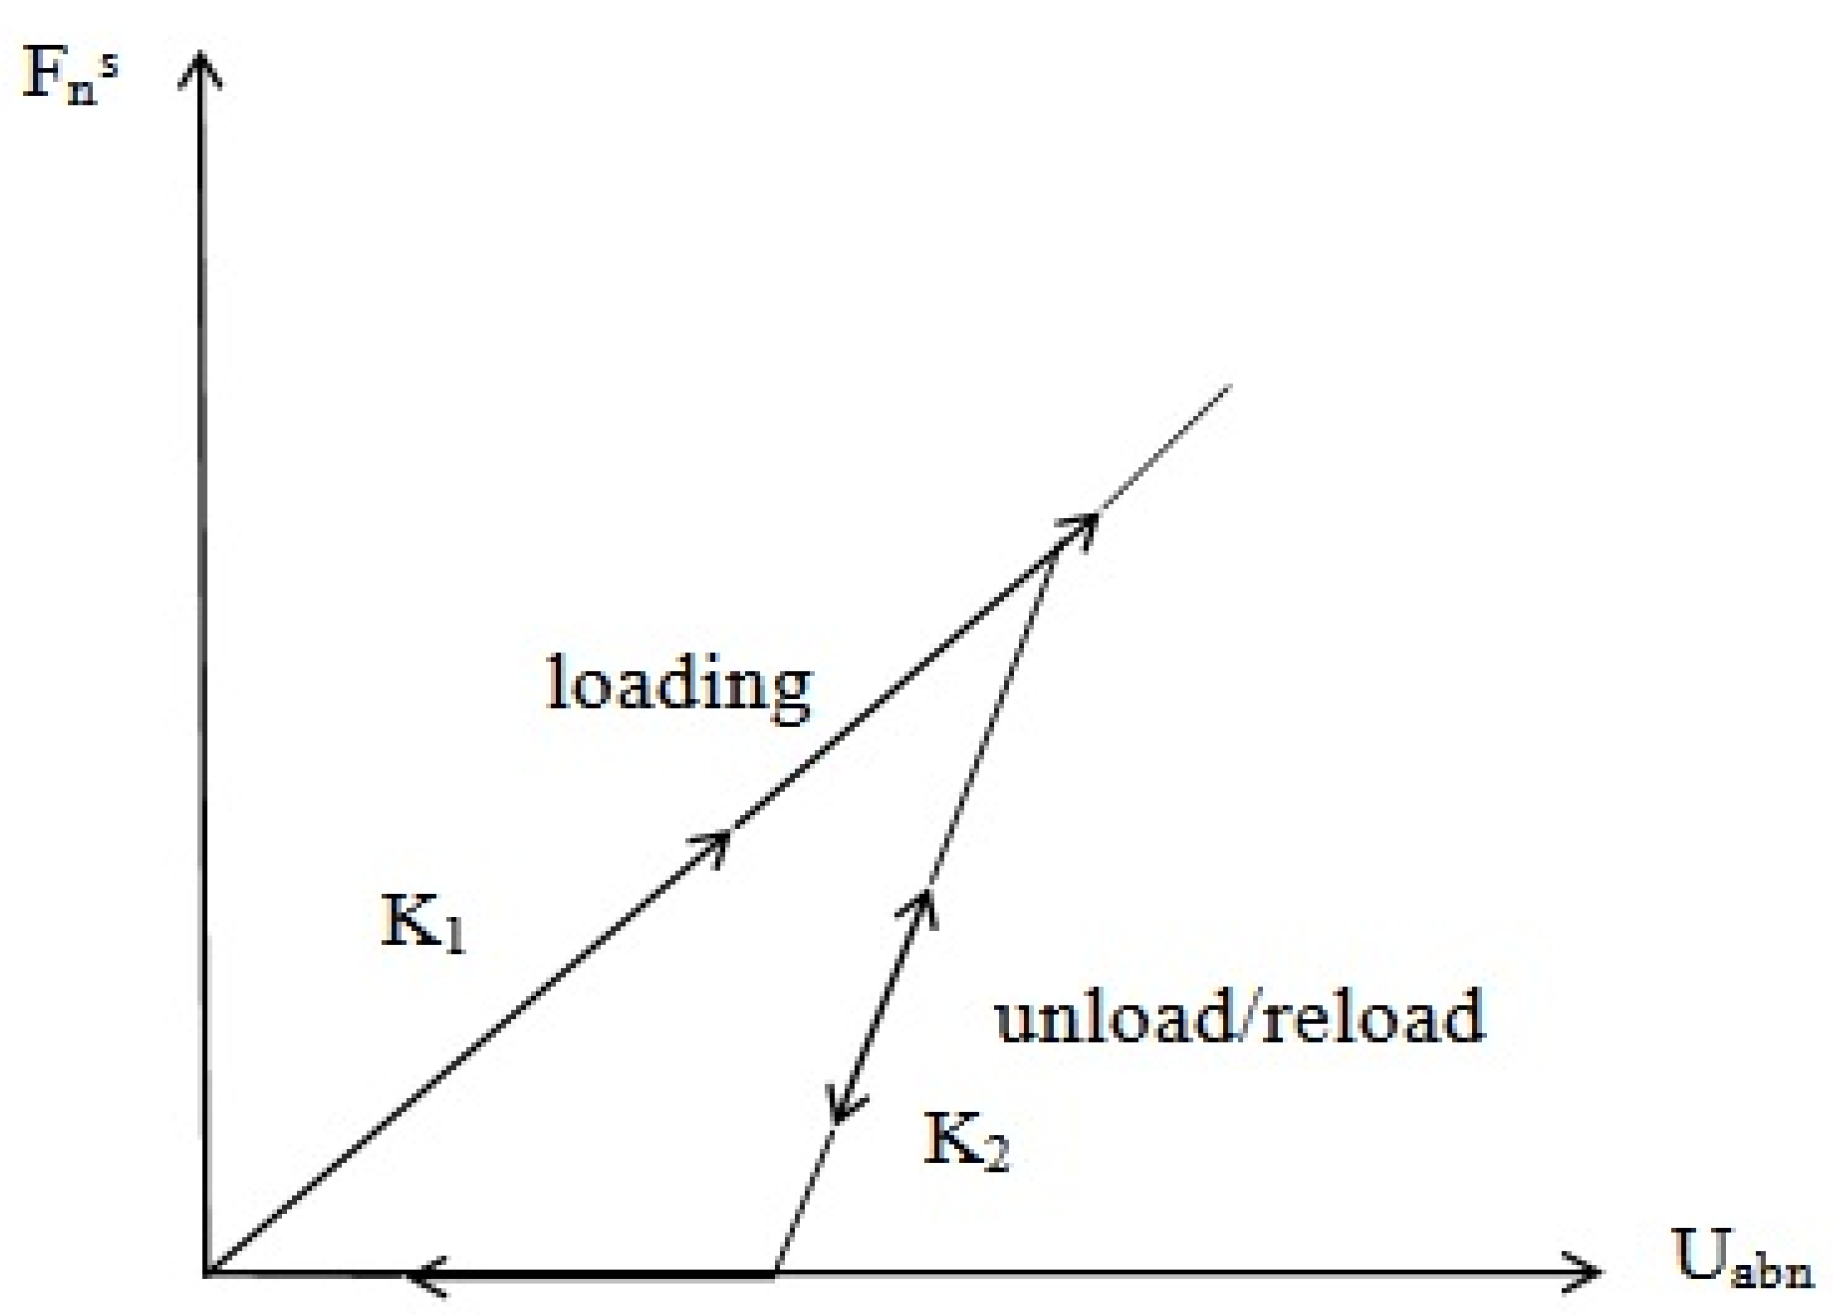
| K1 | Stiffness for loading, (N m−1) |
| K2 | Stiffness for unloading/reloading, (N m−1) |
| L | Disc chord length measured at the soil surface (m) |
| La | The active part of the disc chord that contributes to generating soil failure (m) |
| M | Moment, (Nm) |
| Mr | Moment due to rolling friction, (Nm) |
| m | The ratio of forward rupture distance to the operating depth |
| m* | Mass, (kg) |
| meq | Equivalent mass (kg) |
| n | Number of replications |
| nc | Damping factor |
| nk | Stiffness factor |
| pi | Elemental passive force (kN) |
| Nγ, Nc, Nca, Nq | Dimensionless numbers associated with gravitational, cohesion, adhesion and surcharge effects (as per Hettiaratchi et al. (1966)) |
| P | Passive cutting reaction force (kN) |
| q | Total surcharge pressure acting on the soil failure area (kPa) |
| r | Disc radius (m) |
| r* | Radius (m) |
| req | Equivalent radius, (m) |
| rcon | Perpendicular distance of contact point from the centre of mass, (m) |
| R | Rotational acceleration, (rad s−2) |
| Sp | Side force component of passive force (kN) |
| Uabn | Normal component of the relative displacement, (m) |
| Uabt | Tangential component of the relative displacement, (m) |
| Ůabn | Normal component of the relative velocity, (m s−1) |
| Ůabt | Tangential component of the relative velocity, (m s−1) |
| U0 | Residual overlap, (m) |
| Ü | Translational acceleration, (m s−2) |
| ν | Forward speed (ms−1) |
| vp | Passive soil failure velocity (m s−1) |
| Vp | Vertical component of passive force (kN) |
| Furrow width(m) | |
| w | Tool width (m) |
| Y | Yield strength (MPa) |
| Greek letters | |
| αt | Tilt angle (deg) |
| α | Rake angle (deg) |
| β | Sweep angle (deg) |
| βcr | Critical sweep angle (deg) |
| γi | Initial soil bulk density (kNm−3) |
| µ | Coefficient of friction |
| μr | Coefficient of rolling friction |
| λθ | Unit vector of angular velocity |
| δ | Angle of soil-metal friction (deg) |
| δx | Angle of soil-metal friction component projected on a horizontal plane (deg) |
| δz | Angle of soil-metal friction component projected on a vertical plane (deg) |
| ξ | Cohesion energy density (J m−3) |
References
- Ashworth, M.; Desbiolles, J.; Tola, E. Disc Seeding in Zero-Till Farming Systems—A Review of Technology and Paddock Issues; Western Australia No-Tillage Farmers Association: Northam, WA, Australia, 2010. [Google Scholar]
- Desbiolles, J.; Saunders, C.; Barr, B.; Riethmuller, G.; Northover, G.; Tullberg, J.; Antille, D. Machinery evolution for conservation agriculture—In (Eds J Pratley and J Kirkegaard) “Australian Agriculture in 2020: From Conservation to Automation”, 2020, pp. 81–105. Available online: www.csu.edu.au/research/grahamcentre/publications/e-books/australian-agriculture-in-2020 (accessed on 14 December 2022).
- Godwin, R.J.; Seig, D.A.; Allott, M. Soil failure and force prediction for soil engaging discs. Soil Use Manag. 1987, 3, 106–114. [Google Scholar] [CrossRef]
- Godwin, R.J.; O’Dogherty, M.J. Integrated soil tillage force prediction models. Soil React. 2007, 44, 3–14. [Google Scholar] [CrossRef]
- Hettiaratchi, D.R.P. Prediction of soil forces acting on concave agricultural discs. J. Agric. Eng. Res. 1997, 68, 51–62. [Google Scholar] [CrossRef]
- Alam, M.M. Soil Reaction Forces on Agricultural Disc Implements. Ph.D. Thesis, Newcastle University, Newcastle upon Tyne, UK, 1989; 129p. [Google Scholar]
- Al-Ghazal, A.A. An Investigation into the Mechanics of Agricultural Discs. Ph.D. Thesis, Silsoe College, Cranfield Institute of Technology, Bedfordshire, UK, 1989; 299p. [Google Scholar]
- Sadek, M.A.; Chen, Y.; Zeng, Z. Draft force prediction for a high-speed disc implement using discrete element modelling. Biosyst. Eng. 2021, 202, 133–141. [Google Scholar] [CrossRef]
- Murray, S.E.; Chen, Y. Soil Bin Tests and Discrete Element Modeling of a Disc Opener. Can. Biosyst. Eng. 2018, 60, 1–10. [Google Scholar] [CrossRef] [Green Version]
- Khosravani, A.; Desbiolles, J.; Fielke, J.M.; Ucgul, M.; Saunders, C. Prediction of single disc seeding system forces, using a semi-analytical and discrete element method (DEM). Agriculture, 2022; Accepted for publication. [Google Scholar]
- Hettiaratchi, D.R.P.; Witney, B.D.; Reece, A.R. The calculation of passive pressure in two-dimensional soil failure. J. Agric. Eng. Res. 1966, 11, 89–107. [Google Scholar] [CrossRef]
- Hettiaratchi, D.R.P.; Reece, A.R. The calculation of passive soil resistance. Geotechnique 1974, 24, 289–310. [Google Scholar] [CrossRef]
- Khosravani, A. A Semi-Analytical Force Prediction Model for a Rotating Flat Disc Blade Opener. Ph.D. Thesis, University of South Australia, Magil, Australia, 2014; 246p. [Google Scholar]
- Khosravani, A.; Desbiolles, J.; Fielke, J.M. Circular disc blade considerations in soil force prediction modelling. J. Agric. Sci. Technol. A 2014, 4, 371–383. [Google Scholar]
- Tamás, K.; Jóri, I.J.; Mouazen, A.M. Modelling soil–sweep interaction with discrete element method. Soil Till. Res. 2013, 134, 223–231. [Google Scholar] [CrossRef] [Green Version]
- Fielke, J.M.; Ucgul, M. Saunders. In Discrete Element Modelling of Soil-Implement Interaction Considering Soil Plasticity, Cohesion and Adhesion. In 2013 Kansas City, Missouri, 21–24 July; American Society of Agricultural and Biological Engineers: St. Joeseph, MI, USA, 2013; p. 1. [Google Scholar]
- Tekeste, M.Z.; Balvanz, L.R.; Hatfield, J.L.; Ghorbani, S. Discrete element modelling of cultivator sweep-to-soil interaction: Worn and hardened edges effects on soil-tool forces and soil flow. J. Terramechanics 2019, 82, 1–11. [Google Scholar] [CrossRef] [Green Version]
- Aikins, K.A.; Barr, J.B.; Antille, D.L.; Ucgul, M.; Jensen, T.A.; Desbiolles, J.M. Analysis of effect of bentleg opener geometry on performance in cohesive soil using the discrete element method. Biosyst. Eng. 2021, 209, 106–124. [Google Scholar] [CrossRef]
- Aikins, K.A.; Ucgul, M.; Barr, J.B.; Jensen, T.A.; Antille, D.L.; Desbiolles, J.M. Determination of discrete element model parameters for a cohesive soil and validation through narrow point opener performance analysis. Soil Till. Res. 2021, 213, 105123. [Google Scholar] [CrossRef]
- Fielke, J.M. Interactions of the Cutting Edge of Tillage Implements with Soil. Ph.D. Thesis, The University of Adelaide, Adelaide, Australia, 1994. [Google Scholar]
- Nartov, P.S. Disc, Soil-Working Implements; Amerind Publishing: New Delhi, India, 1984; 148p. [Google Scholar]
- EDEM. EDEM Theory Reference Guide; DEM Solutions: Edinburgh, UK, 2011. [Google Scholar]
- Walton, O. Elastic-Plastic Contact Model. Company Report; DEM Solutions: Edinburgh, UK, 2006. [Google Scholar]
- Walton, O.R.; Braun, R.L. Stress calculations for assemblies of inelastic spheres in uniform shear. Acta Mech. 1986, 63, 73–86. [Google Scholar] [CrossRef]
- Raji, A.O. Discrete Element Modelling of the Deformation of Bulk Agricultural Particles. Ph.D. Thesis, Newcastle University, Newcastle upon Tyne, UK, 1999. [Google Scholar]
- Huser, A.; Kvernvold, O. Prediction of sand erosion in process and pipe components. In Proceedings of the BHR Group Conference Series Publication, Banff, AB, Canada, 1 July 1998; Brill, J.P., Gregory, G.A., Eds.; Mechanical Engineering Publications: London, UK, 1998; Volume 31, pp. 217–227. [Google Scholar]
- Hudson Tool Steel. P20 Mold steel. 2016. Available online: http://www.hudsontoolsteel.com/technical-data/steelP0 (accessed on 10 October 2020).
- Academia. Some Useful Numbers for Rocks and Soils. Available online: http://www.academia.edu/4056287/Some_Useful_Numbers_for_rocks_and_soils2015 (accessed on 10 October 2020).
- Asaf, Z.; Rubinstein, D.; Shmulevich, I. Determination of discrete element model parameters required for soil tillage. Soil Till. Res. 2007, 92, 227–242. [Google Scholar] [CrossRef]
- Budynas, R.G.; Nisbett, K.J. Shigley’s Mechanical Engineering Design; McGraw-Hill Education: New York, NY, USA, 2012. [Google Scholar]
- Ucgul, M.; Saunders, C.; Fielke, J.M. Discrete element modelling of top soil burial using a full scale mouldboard plough under field conditions. Biosyst. Eng. 2017, 160, 140–153. [Google Scholar] [CrossRef]


| Sweep Angle β (°) | Force Difference with Rake Angle α = 70° | Force Difference with Rake Angle α = 90° |
|---|---|---|
| 6 | 41.2% | 28.3% |
| 26 | 2.4% | 14.6% |
| 45 | 6.3% | 5.9% |
| 90 | 3.9% | 1.0% |
| Property | Value | Source |
|---|---|---|
| Density of sand particles (kg m−3) | 2600 | [26] |
| Density of steel (kg m−3) | 7861 | [27] |
| Shear modulus of soil (Pa) | 5 × 10⁷ | [28] |
| Shear modulus of steel (Pa) | 7.9 × 10¹⁰ | [27] |
| Poisson’s ratio of soil | 0.3 | [29] |
| Poisson’s ratio of steel | 0.3 | [30] |
| Coefficient of restitution of soil-soil | 0.1 | Calibrated |
| Coefficient of friction of soil-soil | 0.7 | [31] |
| Coefficient of friction of soil-steel | 0.5 | [31] |
| Coefficient of rolling friction of soil-soil | 0.28 | Calibrated |
| Coefficient of rolling friction of soil-steel | 0.05 | [31] |
| Cohesive energy density between soil-soil (N m−2) | 9000 | Measured using DST * |
| Adhesive energy density between soil-tool (N m−2) | 3700 | Measured using DST * |
| Coefficient of Restitution | Coefficient of Rolling Friction | Angle of Repose (deg) |
|---|---|---|
| 0.3 | 0.3 | 30.1 |
| 0.1 | 0.3 | 29.9 |
| 0.1 | 0.32 | 31.4 |
| 0.1 | 0.28 | 28.2 * |
| 0.1 | 0.26 | 27.5 |
| 0.1 | 0.24 | 25.2 |
| Sweep Angle (°) | Rotational Speed with Tilt Angle = 0° (rpm) | Rotational Speed with Tilt Angle = 20° (rpm) |
|---|---|---|
| 6 | 24.22 | 21.98 |
| 26 | 22.6 | 19.38 |
| 45 | 18.45 | 17.07 |
| 90 | 0 | 0 |
Disclaimer/Publisher’s Note: The statements, opinions and data contained in all publications are solely those of the individual author(s) and contributor(s) and not of MDPI and/or the editor(s). MDPI and/or the editor(s) disclaim responsibility for any injury to people or property resulting from any ideas, methods, instructions or products referred to in the content. |
© 2023 by the authors. Licensee MDPI, Basel, Switzerland. This article is an open access article distributed under the terms and conditions of the Creative Commons Attribution (CC BY) license (https://creativecommons.org/licenses/by/4.0/).
Share and Cite
Khosravani, A.; Desbiolles, J.M.A.; Saunders, C.; Ucgul, M.; Fielke, J.M. Prediction of Single Disc Seeding System Forces, Using a Semi-Analytical and Discrete Element Method (DEM) Considering Rotation Effects. Agriculture 2023, 13, 202. https://doi.org/10.3390/agriculture13010202
Khosravani A, Desbiolles JMA, Saunders C, Ucgul M, Fielke JM. Prediction of Single Disc Seeding System Forces, Using a Semi-Analytical and Discrete Element Method (DEM) Considering Rotation Effects. Agriculture. 2023; 13(1):202. https://doi.org/10.3390/agriculture13010202
Chicago/Turabian StyleKhosravani, Ali, Jacky M. A. Desbiolles, Chris Saunders, Mustafa Ucgul, and John M. Fielke. 2023. "Prediction of Single Disc Seeding System Forces, Using a Semi-Analytical and Discrete Element Method (DEM) Considering Rotation Effects" Agriculture 13, no. 1: 202. https://doi.org/10.3390/agriculture13010202