Article

Impact of Temperature on Age–Stage, Two-Sex Life Table Analysis of a Chinese Population of Bean Bug, Riptortus pedestris (Hemiptera: Alydidae)

1
Key Laboratory of Soybean Disease and Pest Control (Ministry of Agriculture and Rural Affairs), College of Plant Protection, Jilin Agricultural University, Changchun 130118, China
2
MARA-CABI Joint Laboratory for Biosafety, Institute of Plant Protection, Chinese Academy of Agricultural Sciences, Beijing 100193, China
3
College of Biological Resource and Food Engineering, Qujing Normal University, Qujing 655011, China
4
Jiamusi Branch of Heilongjiang Academy of Agricultural Sciences, Jiamusi 154007, China
*
Authors to whom correspondence should be addressed.
Agriculture 2022, 12(9), 1505; https://doi.org/10.3390/agriculture12091505
Submission received: 7 September 2022 / Revised: 15 September 2022 / Accepted: 16 September 2022 / Published: 19 September 2022
(This article belongs to the Special Issue Integrated Pest Management of Field Crops: Series II)

Abstract

:
Riptortus pedestris Fabricius (Hemiptera: Alydidae) is an economically important pest of soybean that causes serious damage in the Huang-Huai-Hai region of China, which is the main soybean-producing area. However, the basic biological and ecological attributes of the Chinese populations of R. pedestris are still unknown. Temperature is a critical factor influencing insect population dynamics; therefore, understanding the effects of temperature on individual development and population growth of R. pedestris is helpful to forecast the pest’s phenology as part of its control. In this study, we determined age–stage, two-sex life table parameters of R. pedestris at five constant temperatures (19, 22, 25, 28, and 31 °C) under laboratory conditions. The results demonstrated that the developmental period, preadult time, adult longevity, adult preoviposition period (APOP), and total preoviposition period (TPOP) were all significantly shortened when the temperature increased from 19 to 31 °C. The developmental time from egg to adult was 55.00 d at 19 °C but decreased to 24.43 d at 31 °C. The developmental threshold temperatures of the egg, nymph, female adult, male adult, and total generation (from egg to adult death) were 13.31, 10.91, 16.21, 17.13, and 13.44 °C, respectively, and the corresponding stage-specific day degree totals were 95.91, 260.51, 114.22, 147.35, and 582.04. The net reproductive rate (R0 = 2.36 offspring), fecundity (58.00 ± 28.59 eggs), and population trend index (I) (7.89) were found to be optimal at 25 °C. These results could be useful for predicting the population dynamics of R. pedestris and improving the management of this pest in field crops.

1. Introduction

The bean bug, Riptortus pedestris Fabricius (Hemiptera: Alydidae), is a serious pest worldwide that is mainly distributed in East and Southeast Asia, including China [1], Korea [2], Japan [3], and India [4]. The nymphs and adults of R. pedestris use their piercing sucking mouth parts to suck sap from pods of host plants, resulting in stunted, weak, deflated, or deformed pods [5]. Riptortus pedestris has a wide host range, mainly feeding on Chinese milk vetch, Astragalus sinicus L. (Fabales: Fabaceae); cowpea, Vigna unguiculata L. (Fabales: Fabaceae); hairy vetch, Vicia villosa Roth (Fabales: Fabaceae); kidney bean, Phaseolus vulgaris L. (Fabales: Fabaceae); mung bean, Vigna. radiata L. (Fabales: Fabaceae); red clover, Trifolium pretense L. (Fabales: Fabaceae); sesame, Sesamum indicum L. (Scrophulariales: Pedaliaceae); soybean, Glycine max L. (Fabales: Fabaceae); and certain other plants of the Fabaceae, Pedaliaceae, Poaceae, and Cucurbitaceae [6]. In addition, it can damage fruit trees such as apples, Malus pumila Miller (Rosales: Rosaceae) and sweet persimmon, Diospyros kaki L.f. (Ebenales: Ebenaceae). The damage caused by R. pedestris in soybean is most severe from middle pod-elongation to early seed-thickening. When damage occurs as this stage, the proportion of empty pods or pods with undeveloped seeds increases. In addition, the feeding of this bug can transmit pathogens to soybean, causing severe losses [5].
In China, bean bug damages soybean in more than 20 provinces [7], including a recent outbreak in the Huang-Huai-Hai region, which is the main soybean-production area in [8], it is the alluvial plain of the Yellow River, Huai River, and Hai River. In 2010, in China, more than half of all soybean fields suffered some degree of damage from R. pedestris. Feeding of R. pedestris results in pod abortion and feeding in the soybean harvest period on leaves and stems causes the leaves of soybean to remain green (called the “stay green” syndrome) [9]. The “stay green” syndrome has been observed on many soybean cultivars [10], including Zhoudou 16, which was severely damaged in the Huang-Huai-Hai region (Leihe city, Henan Province) in 2010, with a yield reduction of 50–100%, while on other cultivars, the yield reduction was about 20% [10]. Similar damage levels have been reported by Hua et al. [11], with light infestations causing 20% to 40% reduction in yield, while in heavy infestations, losses may be up to 50% or even total crop loss. Besides such direct impacts on soybean production, summer soybean breeding fields in the Huang-Huai-Hai region were also destroyed by R. pedestris [9], harming the plant breeding program.
Many studies have demonstrated that examining the effects of abiotic factors, such as temperature, can improve our understanding of the population dynamics of pest insects [12,13]. Temperature is a critical factor influencing the rate of insect growth and development [14], and temperatures lower or higher than the optimum can have adverse effects [14,15]. High temperatures reduce the development, survival, longevity, and fecundity of insects [15]. Various genes are mobilized under high temperatures (38 °C) as a defense against heat stress [16]. Low temperatures hinder insect population growth because each life stage requires a minimal threshold temperature for development, and an entire generation requires sufficient effective accumulated heat, commonly measured as degree-days [17], to complete development. Ahn et al. reported that the Korean R. pedestris population can develop successfully (egg-to-adult female) over a range from 17.9 °C to 36.1 °C [18]. Chen et al. reported that the Chinese population failed to complete its development at 16 °C and could not lay eggs at 32 °C [19]. These studies suggest that temperatures above 16 °C and below 32 °C are potentially suitable for the development and fecundity of R. pedestris and should be assessed to determine the exact developmental lower threshold temperature and the number of degree-days required for complete development. This information will contribute to risk analyses, as well as forecasting and management strategies for managing pest levels [20].
Life tables are a useful tool for better understanding and analyzing insect population dynamics, making predictions and formulating integrated pest management plans [21]. Two-sex life tables incorporate differences between the sexes and account for variation in the developmental rates among individuals and life stages in a given population of an insect species [22]. Although a Korean population of R. pedestris has been studied and a lifetable constructed based on fluctuating temperatures [23], this has not been done for the Chinese populations. In this study, age–stage, two-sex life tables were constructed based on biological parameters of R. pedestris in China under five constant temperatures (19, 22, 25, 28, and 31 °C).

2. Materials and Methods

2.1. Host Plant Production and Insect Rearing

Adults of R. pedestris were collected from Cangzhou, Hebei province, China (43°48′47″ N, 125°25′4″ E) in 2019 and reared on soybean (var. Jinong 38) plants having six fully developed leaves. Plants were grown in flowerpots (diameter = 28 cm; depth = 20 cm) filled with soil, which was collected at teaching station of Jilin Agricultural University (43°48′47″ N, 125°25′4″ E), and they were watered as needed. The R. pedestris cultures and soybean plants were held at 25 ± 1 °C, 80 ± 5% r.h. and 16 h:8 h L:D photoperiod. Approximately 5 generations of the bean bug had been reared before the beginning of this experiment on temperature. All experiments and rearing of the material was done at Jilin Agricultural University, Changchun, China.

2.2. Experimental Setup

Single, newly laid eggs of R. pedestris were placed individually in Petri dishes (dia = 5 cm) on moistened filter paper, and the dishes were held in artificial climate chambers at one of five constant temperatures (19, 22, 25, 28, and 31 °C). Eggs were checked daily until hatched. One hundred eggs were tested per temperature. After emerging from the egg, first instar nymphs were transferred individually to 50 mL centrifuge tubes where they were observed daily for molting, based on presence of exuviae. Bugs were reared on moistened soybean seeds, which soaked in water for 48 h before use, and then transferred into bottomless tubes (5 mL, one soybean seed per tube), along with a moistened plug of cotton to maintain humidity. These hydroponic seed holders were then placed inside the tubes and used to feed the nymphs during the experimental time period (Figure 1). The rearing tubes and their seed-holding apparatus were replaced every 24 h. We checked for molting events every day until the bug reached the adult stage. Same-day, newly emerged male and female adults were paired and transferred into the same test tubes as used in the above-mentioned nymphal development test. For each female, the number of eggs laid was recorded daily until the female died.

2.3. Estimation of Developmental Threshold Temperature and Effective Accumulated Temperature

The developmental threshold temperature (C) and the effective accumulated temperature (K) required for the total development of each developmental stage were calculated by the method adapted by Li and Wang [24] as follows:
C = i = 1 n T i D i 2 D ¯ i = 1 n T i D i i = 1 n D i 2 n D ¯ 2
K = 1 n i = 1 1 K i
where Ti = exposure temperature; Di = development rate at Ti; D ¯ = development rate at Ti; Ki = effective accumulative temperature at the developmental threshold temperature.

2.4. Estimation of Population Trend Index

The population trend index (I) was determined based on the data derived from the life table using following equation [25].
Population trend index (I) = N1/N0
where N1 = the number of eggs after one generation; N0 = the number of eggs at contemporary initiation.
When I > 1, the size of the next generation is higher than that of the previous one, while I <1 means the next generation will be smaller than the previous one, and when I = 1, it means that the population density remains the same number between generations.
Number of eggs expected in the following generation = Adult × Proportion female × Number of eggs laid per female

2.5. Statistical Analysis

The developmental period, longevity, fecundity, developmental threshold, effective accumulated temperature, population parameters, and life table parameters of R. pedestris reared at different temperatures were analyzed by one-way ANOVA. All statistical analyses were carried out with the SPSS 21.0 software package.
All life table data for R. pedestris were analyzed using the TWOSEX—MSChart program [26]. Given that bootstrap analysis uses random resampling, it was necessary to reduce the error values. Therefore, a paired bootstrap test (100,000 runs) was employed to assess the variances and standard errors [27]. Sigmaplot v. 12.0 software was used to make the figures and graphs.
Only eggs that successfully hatched were used to calculate and analyze the life table parameters when calculating the developmental period of each stage, survival rate, and female fertility [28]. The age–stage-specific survival rate (sxj, where x = age and j = stage), age-specific survival rate (lx), age–stage-specific fecundity (fxj), and age-specific fecundity (mx), as well as the population parameters including net reproductive rate (R0), intrinsic rate of increase (r), finite rate of increase (λ), and mean generation time (T) were calculated according to Chi and Liu [29] and Chi [30] using the following equations:
l x = j = 1 β s x j
m x = j = 1 β S x j f x j j = 1 β S x j
R 0 = x = 0 l x m x
x = 0 e r ( x + 1 ) l x m x = 1
Λ = er
T = ln ( R 0 ) r
where β is the number of life stages. The survival rate (sxj) is defined as the probability that a newly laid egg will survive to age x and stage j, and fecundity (fxj) is the number of hatched eggs produced by a female adult at age x. Age-specific fecundity (mx) is calculated using data from individuals of different stages at age x. The net reproductive rate (R0) is defined as the total number of offspring that an individual can produce during its lifetime, whereas the intrinsic rate of increase (r) is calculated using the Euler–Lotka formula with age indexed from day “0” [31]. The mean generation time (T) represents the period that a population requires to undergo an R0-fold increase of its original size as time approaches infinity and the population growth rate stabilizes at the intrinsic rate of increase. Owing to the variable development rates in many insect populations, the overlapping of stages in their life history occurs in which individuals of the same age occur in different developmental stages [29]. The age–stage-specific life expectancy (exj), which is the length of time an individual of age x and stage j is expected to live, was calculated as follows:
e x j = i = x n j = y m s i j
where exj is the probability that an individual of age x and stage y will survive to age i and stage j, which is calculated by assuming siy = 1. The age–stage reproductive value (vxj) is the contribution of an individual of age x and stage y to the future population, and is calculated as follows [32]:
υ x j = e r ( x + 1 ) S x j i = x e r ( i + 1 ) y = j k S i y f i y

3. Results

3.1. Developmental Period, Longevity and Fecundity of R. pedestris on Different Temperature

Egg, nymph, and adult developmental periods were significantly reduced as the temperature increased (all p value < 0.05). The development time (from egg to adult) was longest (55.00 ± 3.66 d) at 19 °C and shortest (24.43 ± 0.98 d) at 31 °C. As temperatures increased from 19 °C to 31 °C, longevity of both males and females decreased (females: from 95.50 ± 24.50 to ~27.50 ± 4.50; males: from 114.50 ± 5.50 to ~31.80 ± 2.44). Likewise, both the adult preoviposition period (APOP: the time period from adult emerged to first reproduction) and the total preoviposition period (TPOP: the time period from birth to first reproduction) decreased as temperature increased. The longest APOP and TPOP periods were at 19 °C (32.00 ± 0.09 d and 80.00 ± 0.29 d), while the shortest values for these parameters were at 31 °C (4.00 ± 0.34 d and 24.00 ± 0.82 d). Fecundity was highest at 25 °C (58.00 ± 28.59 eggs), followed by 22 °C (45.00 ± 15.36 eggs) (Table 1).

3.2. Developmental Threshold and Effective Accumulated Temperature

The developmental threshold temperature (C) and effective accumulated temperature (K) of R. pedestris for one generation were 13.44 ± 0.05 °C and 582.04 ± 0.05 degree-days, respectively. The developmental threshold temperatures of the life stages were significantly different (F = 626.53, df = 9, p < 0.05), and were 13.31 ± 0.00, 10.91 ± 0.35, 16.21 ± 0.13, and 17.13 ± 0.42 °C, for the egg, nymph, female adult, and male adult stages, respectively. The effective accumulated temperature was significantly different among life stages (F = 546.33, df = 9, p < 0.05). The effective accumulated temperatures (= number of day degrees required for complete development) of the egg, nymph, female, and male adult stages were 95.91 ± 0.07, 260.51 ± 1.83, 114.22 ± 2.35, and 147.35 ± 5.79 degree-days, respectively. The effective accumulated temperature was lowest for the first instar (29.78 ± 0.44 degree-days), while it was highest for the adult male (147.35 ± 5.79 degree-days) (Table 2).

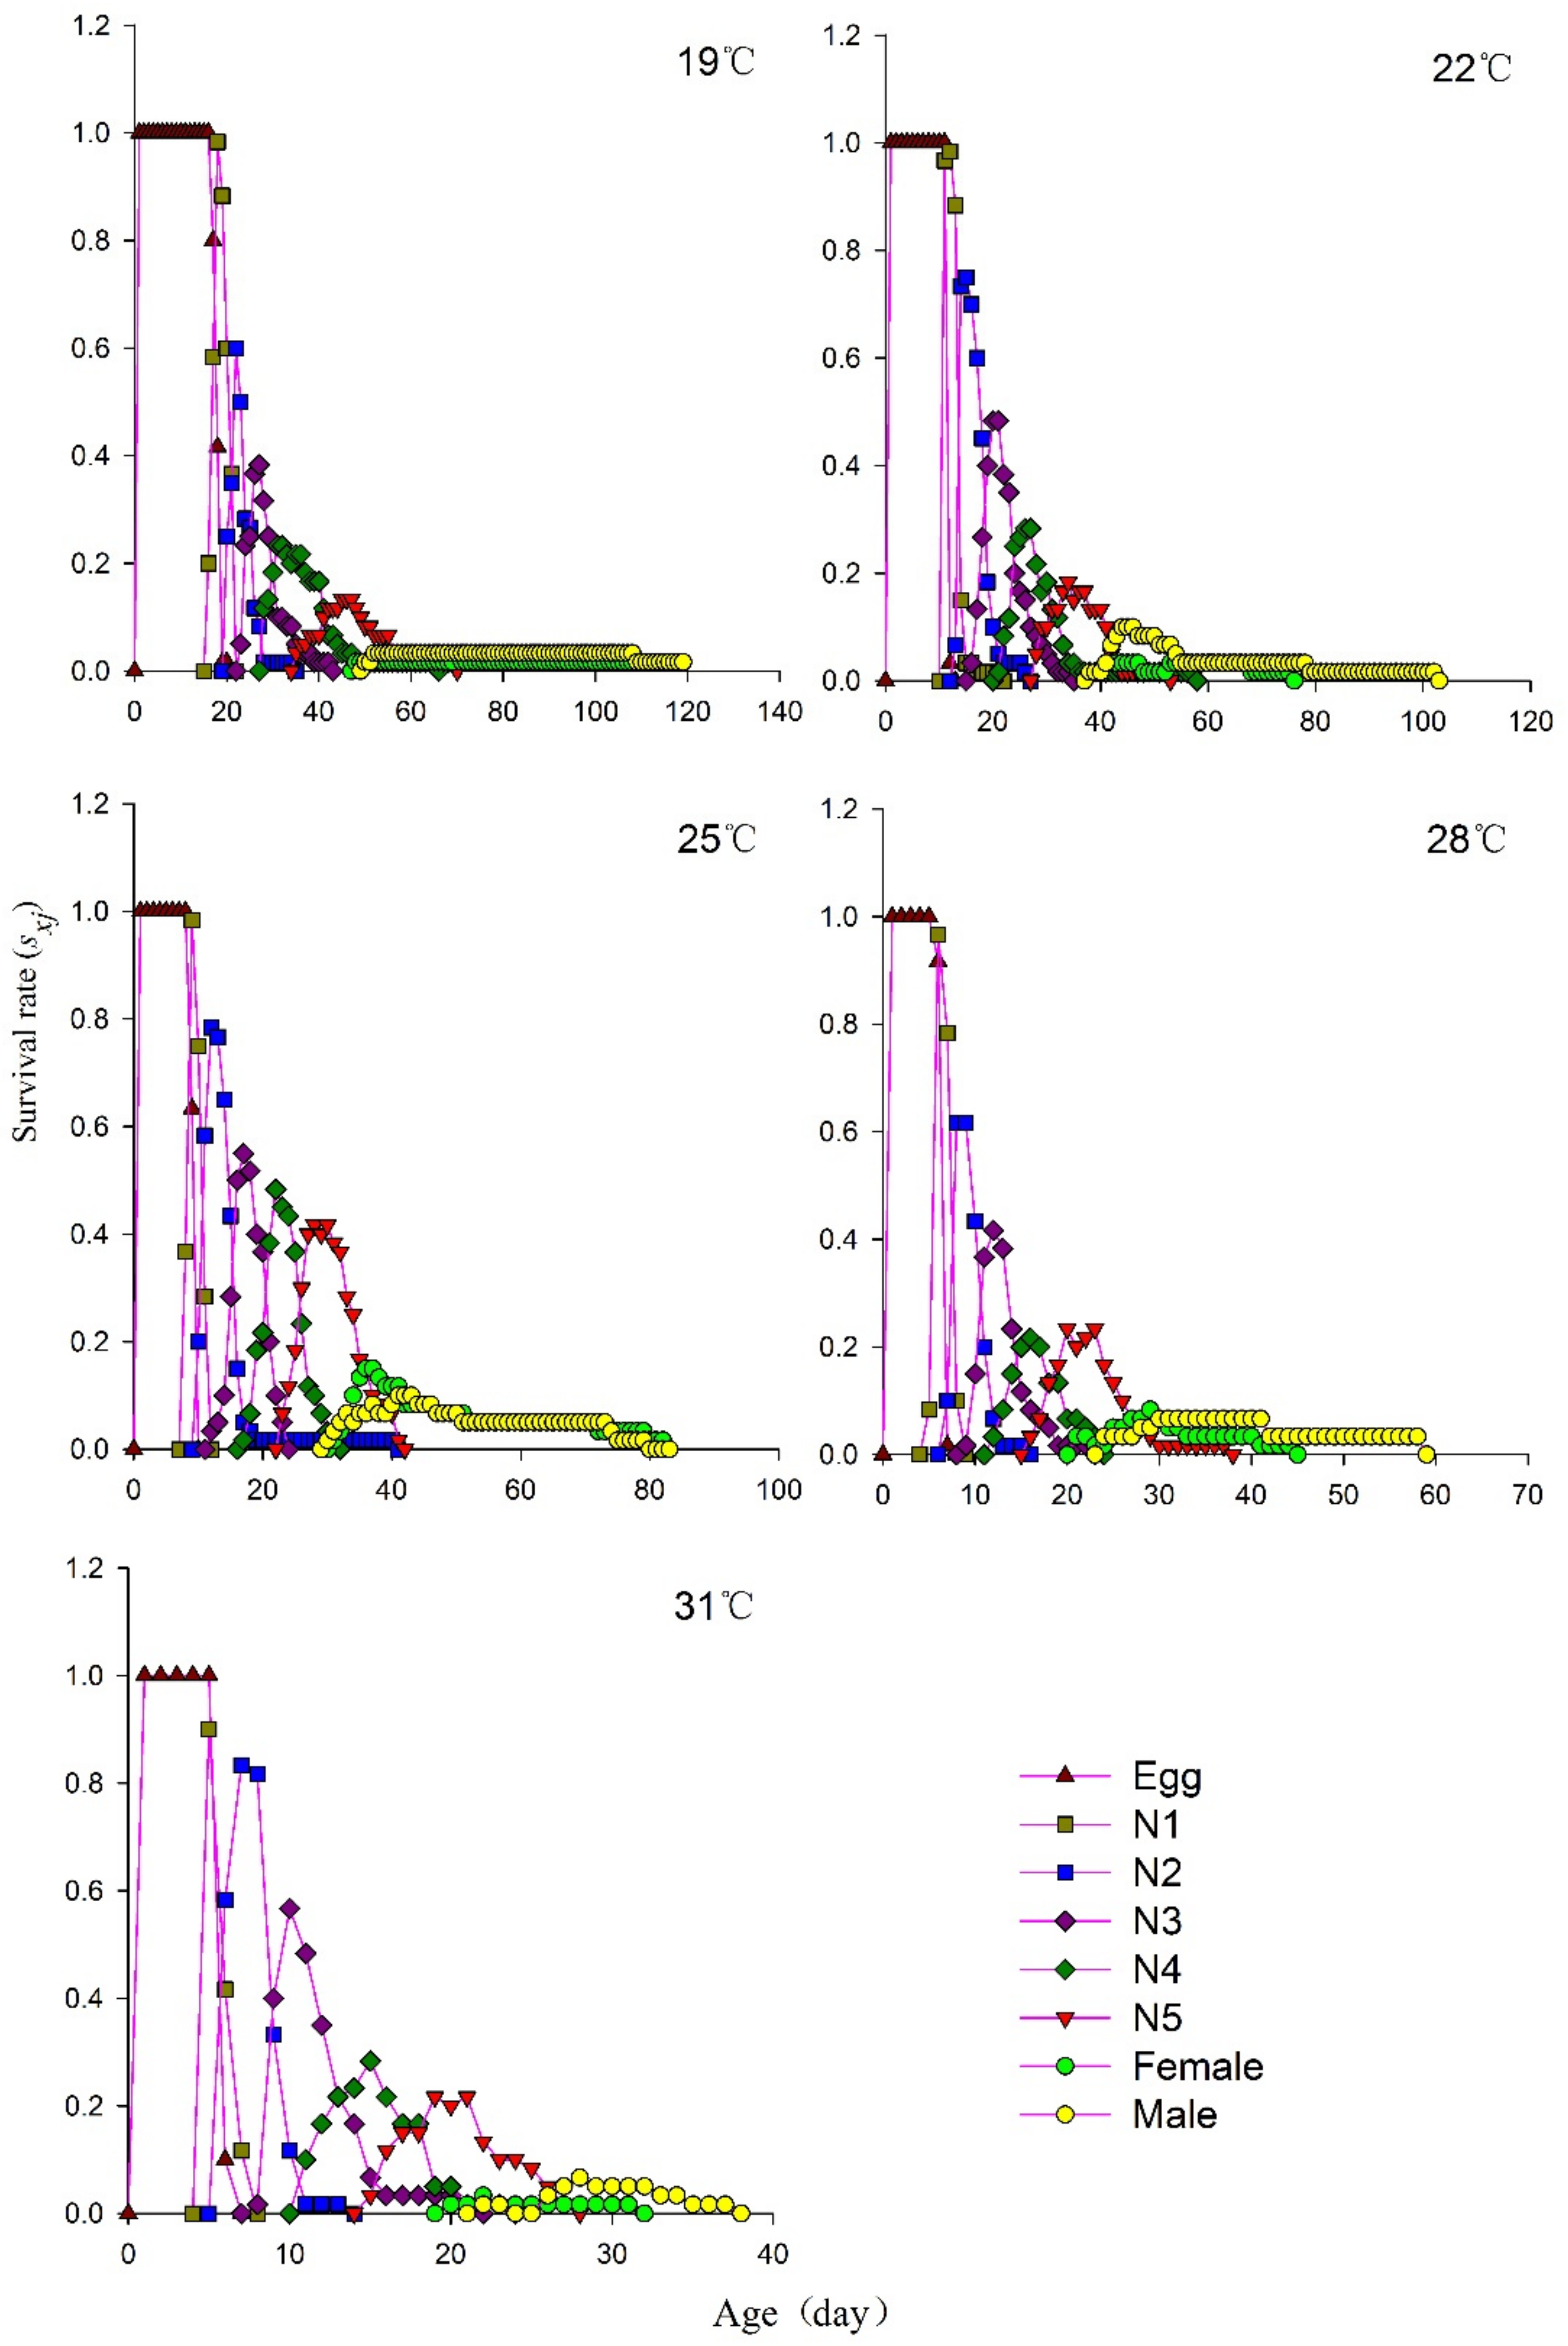
3.3. Age–Stage-Specific Survival Rate

Riptortus pedestris successfully developed from the egg to the adult stage at all tested temperatures (19~31 °C). The developmental period of female bugs was shorter than for males at all tested temperatures (from 19 and 31 °C; female: 95.50 ± 24.50 and 27.50 ± 4.50; males: 114.50 ± 5.50 and 31.80 ± 2.44). Survival rates of each life stage first increased and then decreased as temperature increased from 19 to 31 °C. The survival rates were highest at 25 °C, being 98.33, 78.33, 55.00, 48.33, and 41.67% for development to first, second, third, fourth, and fifth instars, respectively (Figure 2). An obvious overlap in the age–stage survival curves was observed due to the individual differences in mortality under different temperatures.

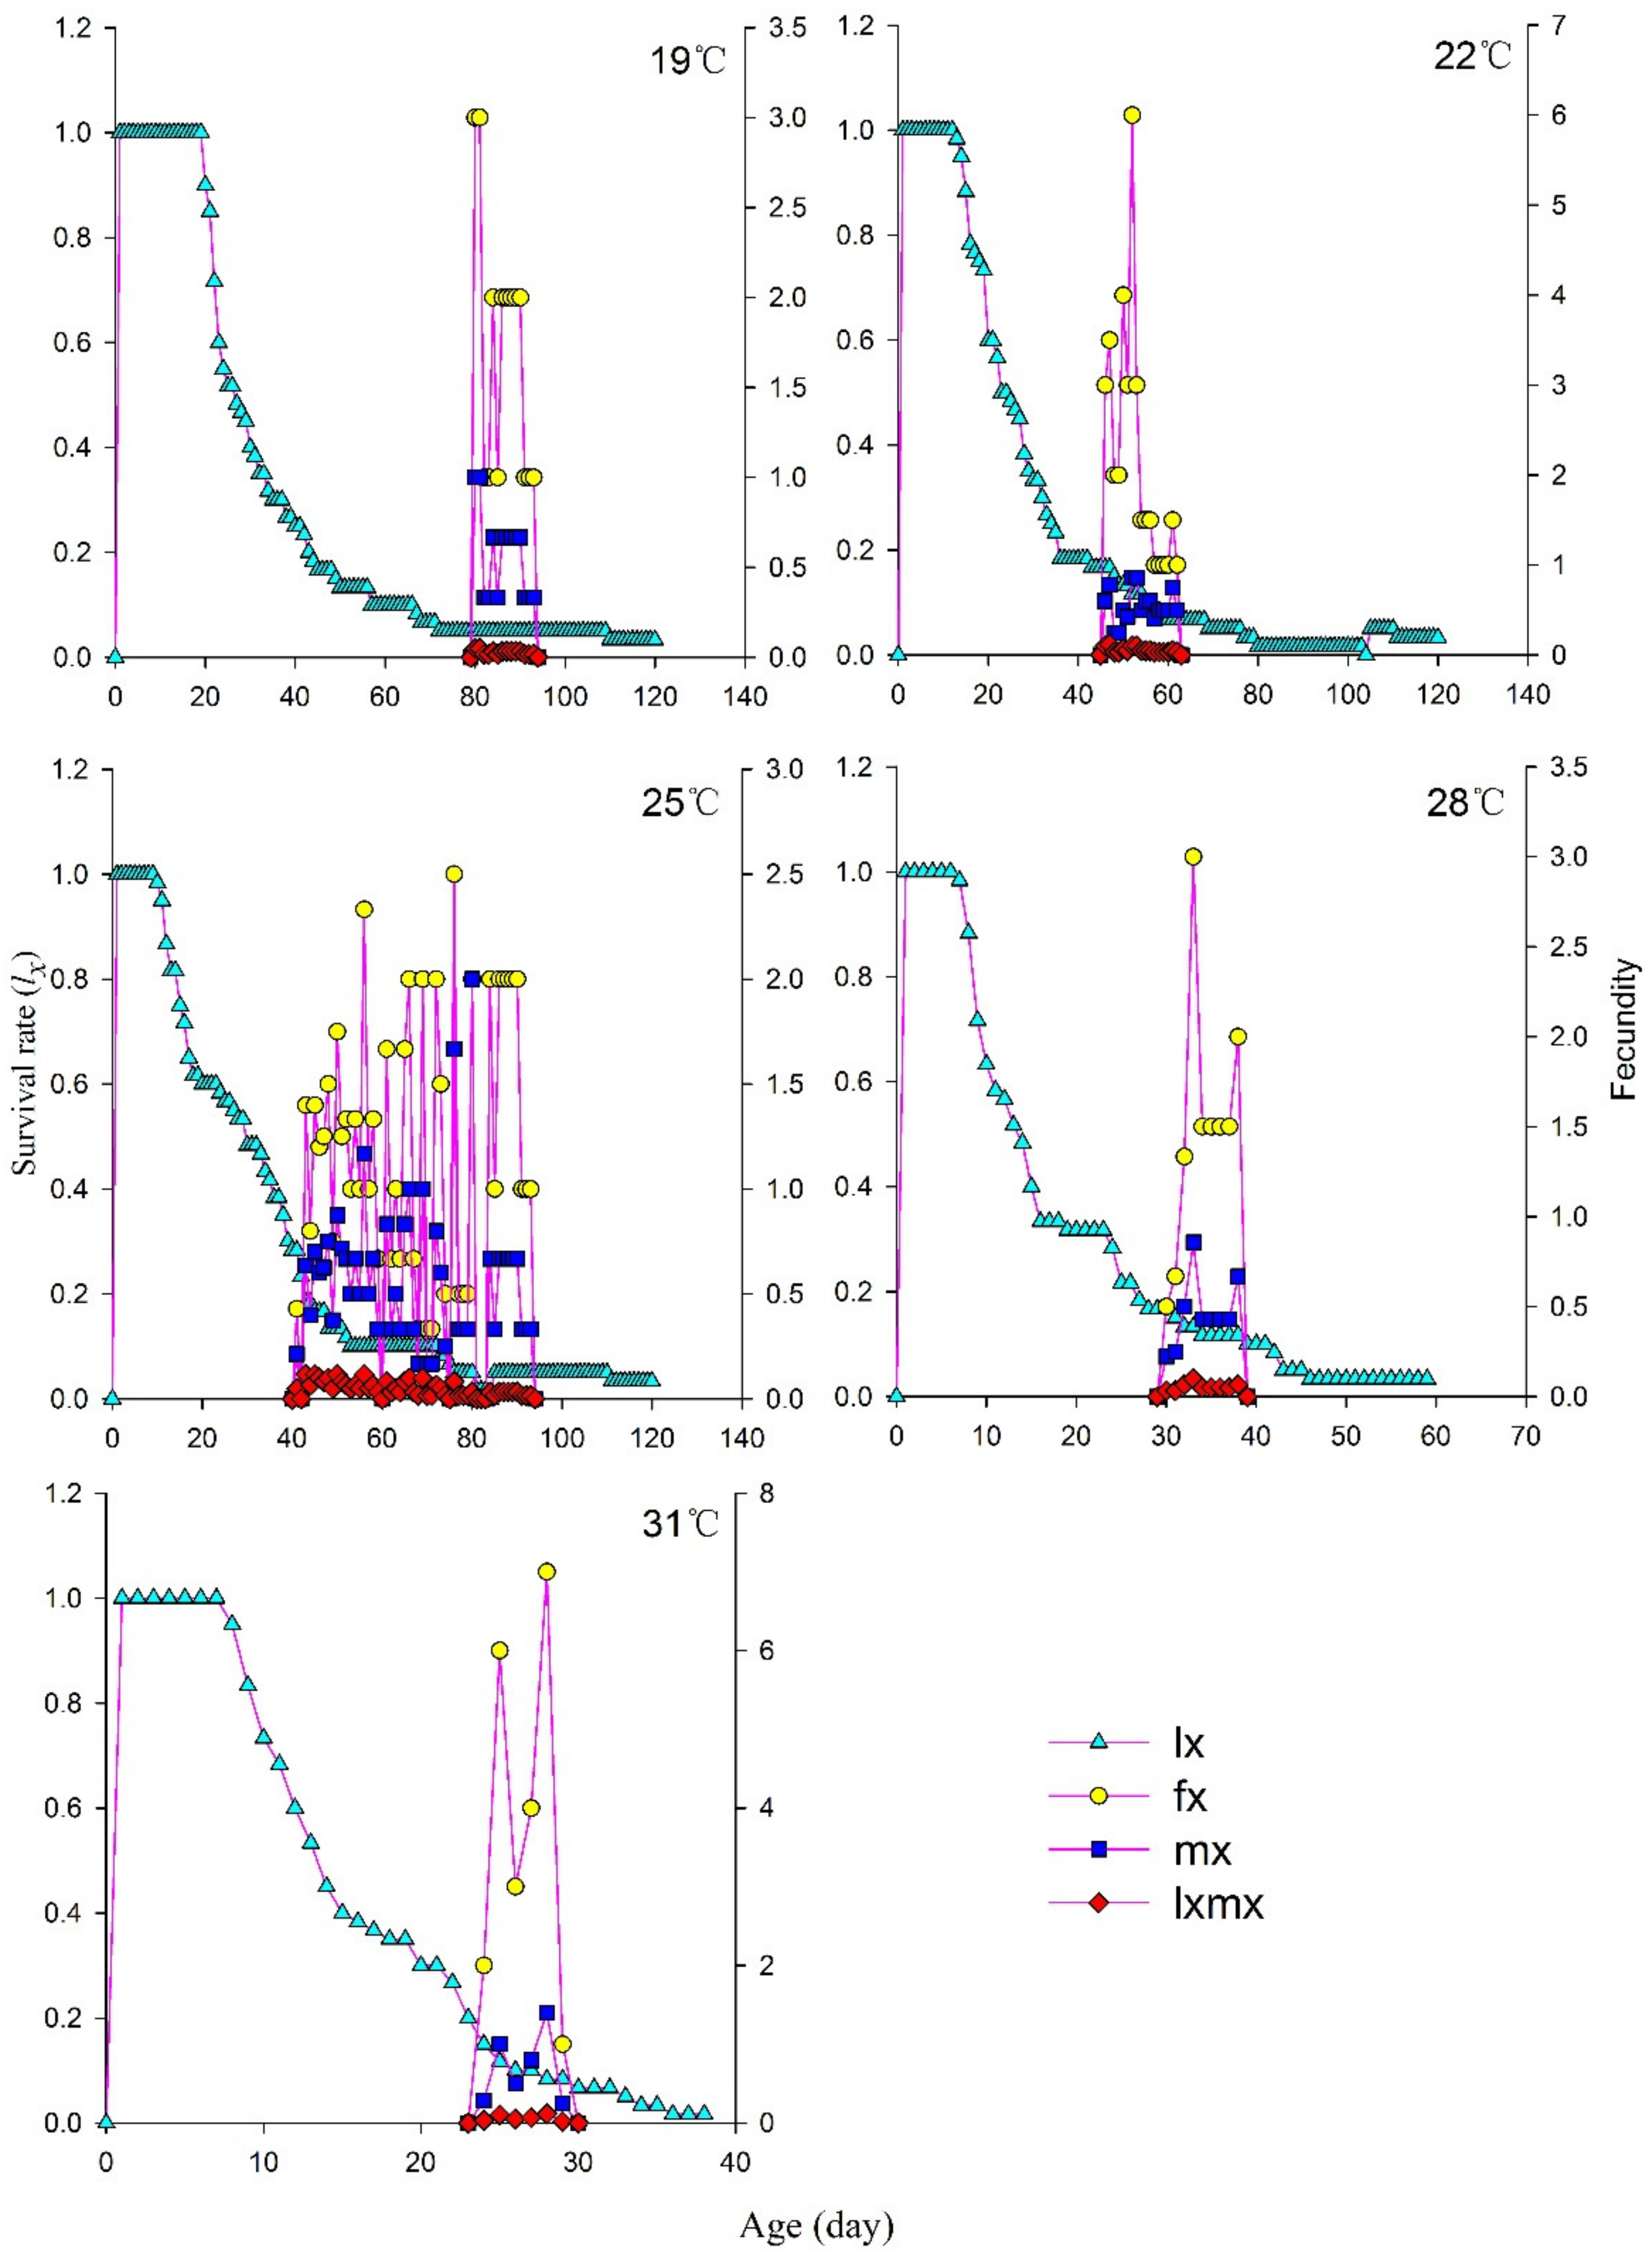
3.4. Age-Specific Survival and Age–Stage-Specific Fecundity

Age-specific survival rates (lx) decreased sharply as age of test insects increased within each temperature tested, from 19 to 31 °C (Figure 3). Fecundity (mx) ended (no further oviposition) at ages (d) 95.00, 64.00, 95.00, 40.00, and 31.00 at 19, 22, 25, 28, and 31 °C, respectively. The total preoviposition period (TPOP) under the five different temperatures ranged from 24.00 d (31 °C) to 95.00 d (19 °C and 25 °C), whereas the highest age-specific fecundities were 3.00 (81.00 d, 19 °C), 6.00 (53.00 d, 22 °C), 2.50 (77.00 d, 25 °C), 3.00 (34.00 d, 28 °C), and 7.00 (29.00 d, 31 °C) eggs.

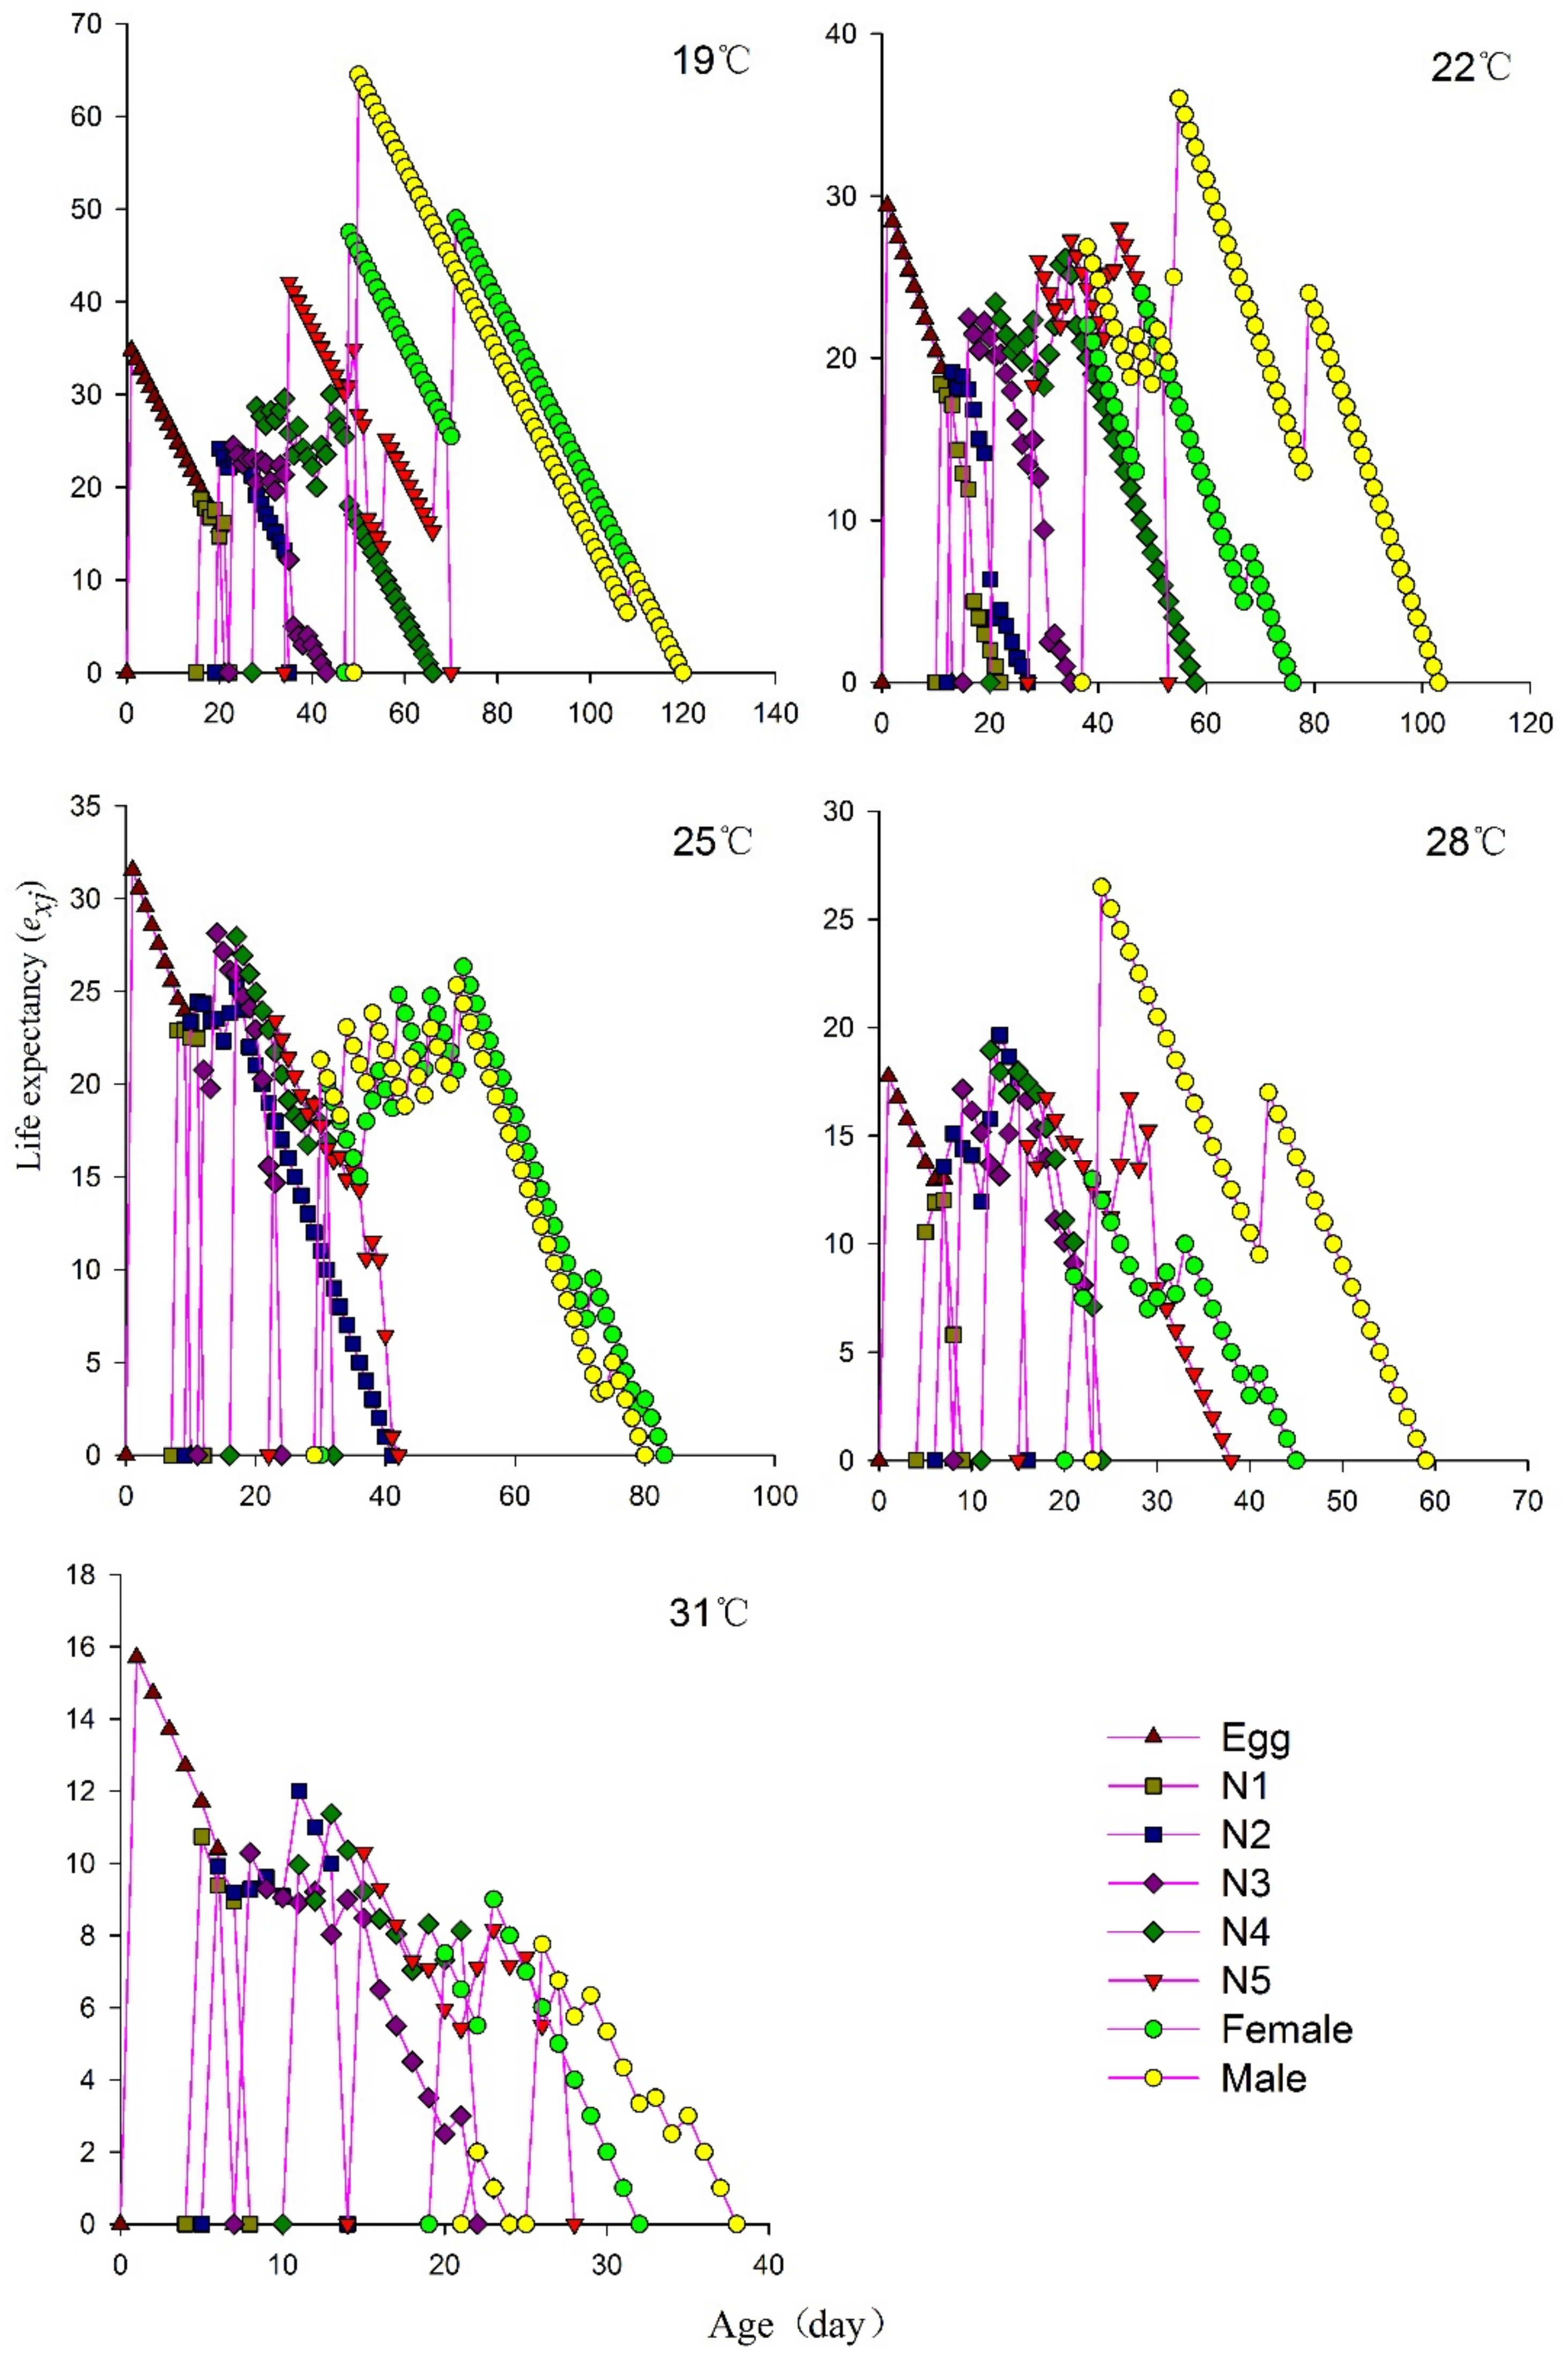
3.5. Age–Stage-Specific Life Expectancy

The exj value of a given stage decreased with increasing temperature and within the same temperature, decreased with increasing age. The highest adult female life expectancy was at 19 °C (49.00 d) and the lowest was at 31 °C (9.00 d) (Figure 4). Similarly, the highest adult male life expectancy was at 19 °C (64.50 d) and the lowest at 31 °C (7.80 d) (Figure 4).

3.6. Age–Stage-Specific Reproductive Values

Age–stage reproductive values (vxj) gradually increased with increasing age (x) and stage (j) (Figure 5). The first vxj values of adult females were found at 48.00 d, 38.00 d, 31.00 d, 21.00 d, and 20.00 d when tested at five temperatures between 19 and 31 °C, respectively. Additionally, the highest vxj values of adult females occurred at 72.00 d (28.06 d−1), 49.00 d (31.10 d−1), 53.00 d (23.24 d−1), 34.00 d (11.51 d−1), and 24.00 d (26.00 d−1) of age at the different temperatures (Figure 5).

3.7. Population Parameters at Different Temperatures

The mean generation time (T) was longest (86.76 ± 0.04 d) at 19 °C and shortest (27.50 ± 0.02 d) at 31 °C (Table 3). Only at 22 °C and 25 °C were the finite rate of increase (λ) values greater than 1 (indicating an increasing population). The intrinsic rate of increase (r = 0.01 ± 0.02 d−1) and finite rate of increase (λ = 1.01 ± 0.02 d−1) were significantly higher at 25 °C compared to other temperatures (r: F = 9.73, df = 4, p < 0.05; λ: F = 14.99, df = 4, p < 0.05). The lower r value (−0.02 ± 0.01 d−1) and λ value (0.98 ± 0.02 d−1) were at 31 °C. The highest net reproductive rate (R0 = 2.36 ± 1.69 offspring) was at 25 °C, while the lowest R0 value (0.60 ± 0.31) was at 31 °C (Table 3).

3.8. Effect of Temperature on Population Parameters

The population trend index values (I) were >1 at 22, 25, and 25 °C but were <1 at 19 and 31 °C, which indicated that the population increased at temperatures in the 22, 25, and 25 °C range but decreased at higher or lower temperatures trend under the experimental temperature conditions. The population trend index (I) was significantly different among temperatures (F = 66.65, df = 4, p < 0.05). The highest (I) value was at 7.89 at 25 °C (Table 4).

4. Discussion

Temperature is the most important environmental factor determining the rate of development and reproduction of arthropods [33], affecting the immature time, longevity, fecundity, and survival rates of arthropods [34]. Information regarding the population stage structure and dynamics is useful in pest management. The objective of this study was to determine the effects of temperature on the growth and development of R. pedestris in the Huang-Huai-Hai region population. We studied the minimal temperature threshold and measured the effective accumulated temperature (number of required day degrees) of R. pedestris, as well as the effects of temperature on the development period and survival rate of each stage of R. pedestris. Under our test conditions, R. pedestris completed all of its developmental stages at temperatures from 19 to 31 °C. Previously, Ahn et al. [18] reported that R. pedestris females successfully developed from egg to adult at temperatures from 17.9 to 36.1 °C, but that populations failed to complete its development at 15.9 °C. Chen et al. [19] found that R. pedestris (populations were collected from the northeast of China, Jingyu county, Hunjiang City, Jilin Province, where the temperature is lower than Cangzhou) failed to complete its growth and development at 16 °C and was unable to lay eggs at 32 °C in testing at 16, 20, 24, and 32 °C. The Chinese R. pedestris population therefore can be assumed to be able to complete it whole life cycle and lay eggs at temperatures from 16 to 32 °C. In our study, the developmental period, preadult (= total immature stage) period, adult longevity, adult preoviposition period (APOP), and total preoviposition period (TPOP) were all significantly shorter at 31 versus 19 °C. The longest APOP and TPOP periods occurred at 19 °C (32.00 d, 80.00 d), differing from the values reported by Ahn et al. [23], who found that the longest APOP and TPOP values in that study were at 24 ± 4 °C (9.9 d, 59.1 d). In our study, the shortest APOP and TPOP periods at 31 °C (4.00 d, 24.00 d), which were shorter than the 5.3 d and 39.5 d values observed at an average 24 ± 6 °C fluctuating temperature [23], indicating that females do not require long periods to develop sexual maturity, when low temperatures were not constant providing. This suggests that fluctuating temperatures can be beneficial to R. pedestris populations. Similarly, the parasitoid Diaphorencyrtus aligarhensis (Shafee, Alam, and Argarwal) (Hymenoptera: Encyrtidae) that required the number of degree-days for completion of development were 21% lower under fluctuating temperature regimens compared with constant temperatures [35]. Given that fluctuating temperatures are closer to field conditions, they are likely more reliable should be considered in future laboratory tests.
In our study, we used the linear regression method to calculate the developmental threshold temperature and effective accumulated temperature (number of required day degrees). We found that the lower developmental threshold was 13.44 °C for R. pedestris, which was lower than that found for the Korea population (14.1 °C) [18]. The developmental threshold temperature was lowest for the second instar and was highest in the fifth instar. Our findings are partially consistent with those of Chen et al. [19], who found that the lowest developmental threshold temperature occurred in the third instar and the highest in the fifth instar nymph. The effective accumulated temperature (total number of required day degrees) for preimaginal R. pedestris was 231.21 degree-days in our study. It was shorter than for the Korea population (336.7 degree-days for the immature stage) [23]. Our data predict there should be three generations of R. pedestris at Cangzhou based on the yearly effective accumulated temperature of 1757.5 °C [36], using the formula of Ma and Jiang [37]. Field records have confirmed that there are three generations per year of R. pedestris in the Huang-Huai-Hai region and that these generations overlap in soybean fields [38].
The life tables are helpful tools to study the effects of environmental factors on pest population dynamics and are useful for prediction and pest management [39]. Our study presents, for the first time, the fecundity and two-sex life table parameters of a Chinese population of R. pedestris at different temperatures. The population trend index (I) was >1 when the temperature was at 22~28 °C. The fecundity in our study highest (58.00 eggs per female) and the population trend index (I) reached 7.89 at 25 °C. However, the population trend index (I) < 1 at 19 and 31 °C, and the population of R. pedestris should decrease at these temperatures. The mean generation time (T) was shortest at 31 °C due to shorter development time for the immature stages. However, low oviposition rates at 31 °C lead to a low net reproductive rate at this temperature. The annual extreme daily mean temperature was increased in the past three years in Cangzhou [36], with the global mean surface air temperature that has risen substantially [40], and the mean temperature could be higher in the future, so it can be predicted that the R. pedestris population will be decrease and degenerate when mean temperature rises to 31 °C, as based on our research results. Outhwaite et al. (2022) report that historical climate warming and intensive agricultural land use is associated with reductions of almost 50% in the abundance and 27% in the number of species within insect assemblages relative to those in less-disturbed habitats with lower rates of historical climate warming [41]. In our study, R0 was highest (2.36) at 25 °C but much lower than Hu et al. [42], who reported the R0 was 50.53 at 24 °C ± 1 °C with soybean pods as the food. This difference shows that diet and other factors besides temperature can influence population growth.
Riptortus pedestris is a widely distributed serious pest of soybean, causing outbreaks in the Huang-Huai-Hai region of China, which is the main soybean-production area of China. Understanding the development and fecundity of the local bean bug population in Cangzhou, China allows for the better prediction of R. pedestris populations. Based on our developmental threshold temperature of 13.44 °C, and the effective accumulated temperature of 582.04 degree-days, the population growth and dynamics can be predicted using the population trend index. The results of the present study will help support IPM actions taken against R. pedestris, although other factors such as photoperiod, humidity, feeding, density, and their interactions may also influence population size.

Author Contributions

J.-P.Z., S.-S.S. and Y.G. conceived and designed the experiments. X.-Y.T., X.-H.L. and Y.-L.H. conducted the experiments. X.-Y.T., W.-B.L., M.Y.A. and Z.-J.W. analyzed the data. J.-P.Z. and S.-S.S. obtained the funding for the study. All authors contributed to writing and editing of the manuscript. All authors have read and agreed to the published version of the manuscript.

Funding

This research was funded by China Agriculture Research System of MOF and MARA (grant no. CARS04), and China’s donation to the CABI Development Fund (VM10051).

Institutional Review Board Statement

Not applicable.

Data Availability Statement

The data presented in this study is available on request from the corresponding author.

Acknowledgments

Jinping Zhang was also supported by CABI with core financial support from its member countries (see http://www.cabi.org/about-cabi/who-we-work-with/key-donors/, accessed on 1 August 2022).

Conflicts of Interest

The authors declare no conflict of interest.

References

  1. Shi, S.S. Soybean Pest Comprehensive Prevention and Control Technology and Technology; Jilin Publishing Group Co.: Changchun, China, 2013. [Google Scholar]
  2. Kim, G.H.; Ahn, Y.J.; Cho, K.Y. Effect of diflubenzuron on longevity and reproduction of adult bean bug (Hemiptera: Alydidae). J. Econ. Entomol. 1992, 85, 664–668. [Google Scholar] [CrossRef]
  3. Tabuchi, K.; Moriya, S.; Ishizaki, M. Locomotion ability variation among instars of the bean bug, Riptortus pedestris (Fabricius) (Heteroptera: Alydidae) nymphs. Environ. Entomol. 2007, 36, 871–877. [Google Scholar] [CrossRef] [PubMed]
  4. Parvathy, V. Ecological Perspectives and Host Plant Resistance Studies of Pod Feeders in Field Bean, Lablab purpureus (L.) Sweet. Bachelor’s Thesis, Acharya N. G. Ranga Agricultural University, Pradesh, India, 2011. [Google Scholar]
  5. Zhang, X.X.; Wang, M.; Wu, T.T.; Wu, C.X.; Jiang, B.J.; Guo, C.H.; Han, T.F. Physiological and molecular studies of staygreen caused by pod removal and seed injury in soybean. Crop J. 2016, 4, 435–443. [Google Scholar] [CrossRef]
  6. Xu, H.; Zhao, J.J.; Li, F.Q.; Yan, Q.; Meng, L.; Li, B.P. Chemical polymorphism regulates the attractiveness to nymphs in the bean bug Riptortus pedestris. J. Pest Sci. 2020, 94, 463–472. [Google Scholar] [CrossRef]
  7. Chen, Q.E.; Bai, J.K. Atlas of Soybean Diseases and Insects in China; Jilin Technical Science Press: Changchun, China, 1987. [Google Scholar]
  8. Gao, Y.; Shi, S.S.; Xu, M.L.; Cui, J. Current research on soybean integrated pest management in China. Oil Crop Sci. 2018, 3, 215–227. [Google Scholar]
  9. Gao, Y.; Chen, J.H.; Shi, S.S. Research progress on soybean stink bug (Riptortus pedestris). Chin. J. Oil Crop Sci. 2019, 41, 804–815. [Google Scholar]
  10. Li, Y.Q.; Wang, Y.X. Causes and countermeasures for reluctant ripen and few pods of soybean in Wuyanog county in 2010. Mod. Agric. Technol. 2012, 1, 117–118. [Google Scholar]
  11. Hua, F.J.; Zhang, K.; Cao, P.P.; Wang, Y.Z.; Gao, F.J.; Wang, C.Y. Influence factors and prevention measures of podding without pea in summer soybean. Shandong Agric. Sci. 2019, 51, 156–162. [Google Scholar]
  12. Hassall, C.; Thompson, D.J.; French, G.C.; Harvey, I.F. Historical changes in the phenology of British odonata are related to climate. Glob. Chang. Biol. 2007, 13, 83–95. [Google Scholar] [CrossRef]
  13. Khadioli, N.; Tonnang, Z.E.H.; Muchugu, E.; Ong’amo, G.; Achia, T.; Kipchirchir, I.; Kroschel, J.; Le Ru, B. Effect of temperature on the phenology of Chilo partellus (Swinhoe) (Lepidoptera, Crambidae) simulation and visualization of the potential future distribution of C. partellus in Africa under warmer temperatures through the development of life-table parameters. Bull. Entomol. Res. 2014, 104, 809–822. [Google Scholar]
  14. Régnière, J.; Powell, J.; Bentz, B.; Nealis, V. Effects of temperature on development, survival and reproduction of insects: Experimental design, data analysis and modeling. J. Insect Physiol. 2012, 58, 634–647. [Google Scholar] [CrossRef] [PubMed]
  15. Zhou, Z.S.; Guo, J.Y.; Michaud, J.P.; Li, M.; Wan, F.H. Variation in cold hardiness among geographic populations of the ragweed beetle, Ophraella communa LeSage (Coleoptera: Chrysomelidae), a biological control agent of Ambrosia artemisiifolia L. (Asterales: Asteraceae), in China. Biol. Invasions 2011, 13, 659–667. [Google Scholar] [CrossRef]
  16. Yang, Q.; Liu, J.P.; Yang, Y.Z.; Lu, Y.H. Transcriptome analysis of Propylaea quatuordecimpunctata L. (Coleoptera: Coccinellidae) under high temperature stress. Agriculture 2022, 12, 1088. [Google Scholar]
  17. Ma, L.; Gao, S.; Wen, J.; Zong, S.; Xu, Z. Effective accumulated temperature and developmental threshold temperature for Semanotus bifasciatus (Motschulsky) in Beijing. For. Stud. China 2008, 10, 125–129. [Google Scholar] [CrossRef]
  18. Ahn, J.J.; Choi, K.S.; Koh, S. Effects of temperature on the development, fecundity, and life table parameters of Riptortus pedestris (Hemiptera: Alydidae). Appl. Entomol. Zool. 2018, 54, 63–74. [Google Scholar] [CrossRef]
  19. Chen, J.H.; Cui, J.; Tang, J.W.; Bi, R.; Zhang, J.P.; Shi, S.S. Effects of temperature on the growth and development of Riptortus pedestris Fabricius. Chin. J. Oil Crop Sci. 2018, 40, 579–584. [Google Scholar]
  20. Ji, Y.; Li, G.; Zhou, C.; Yin, S. Influence of temperature on the development and reproduction of Cinara cedri (Hemiptera: Aphidoidea: Lachninae). Bull. Entomol. Res. 2021, 111, 579–584. [Google Scholar] [CrossRef]
  21. Ali, M.Y.; Naseem, T.; Arshad, M.; Ashraf, I.; Rizwan, M.; Tahir, M.; Rizwan, M.; Sayed, S.; Ullah, M.I.; Khan, R.R.; et al. Host-plant variations affect the biotic potential, survival, and population projection of Myzus persicae (Hemiptera: Aphididae). Insects 2021, 12, 375. [Google Scholar] [CrossRef]
  22. Ali, S.; Li, S.; Jaleel, W.; Khan, M.M.; Wang, J.; Zhou, X. Using a two-sex life table tool to calculate the fitness of Orius strigicollis as a predator of Pectinophora gossypiella. Insects 2020, 11, 275. [Google Scholar] [CrossRef]
  23. Ahn, J.J.; Choi, K.S. Population parameters and growth of Riptortus pedestris (Fabricius) (Hemiptera: Alydidae) under fluctuating temperature. Insects 2022, 13, 113. [Google Scholar] [CrossRef]
  24. Li, D.M.; Wang, M.M. Rapid development starting point estimates and effective accumulated temperature method research. Insect Knowl. 1986, 23, 184–187. [Google Scholar]
  25. Li, T.L.; Wang, Y.Q.; Ma, J.F.; Liu, L.; Hao, Y.T.; Dong, C.; Gan, Y.J.; Dong, Z.P.; Wang, Q.Y. The effects of temperature on the development of the moth Athetis lepigone, and a prediction of field occurrence. J. Insect Sci. 2013, 13, 1–13. [Google Scholar]
  26. Chi, H. Two Sex–MS Chart: A Computer Program for the Age-Stage, Two-Sex Life Table Analysis. Available online: https://www.researchgate.net/publication/267522110_Age-stage_two-sex_life_table_Theory_data_analysis_and_application (accessed on 28 February 2020).
  27. Efron, B.; Tibshirani, R.J. An Introduction to the Bootstrap; Chapman and Hall: New York, NY, USA, 1993. [Google Scholar]
  28. Mou, D.F.; Lee, C.C.; Smith, C.L.; Chi, H. Using viable eggs to accurately determine the demographic and predation potential of Harmonia dimidiata (Coleoptera: Coccinellidae). J. Appl. Entomol. 2015, 139, 579–591. [Google Scholar] [CrossRef]
  29. Chi, H.; Liu, H. Two new methods for the study of insect population ecology. Bull. Inst. Zool. Acad. Sin. 1985, 24, 225–240. [Google Scholar]
  30. Chi, H. Life-table analysis incorporating both sexes and variable development rates among individuals. Environ. Entomol. 1988, 17, 26–34. [Google Scholar] [CrossRef]
  31. Goodman, D. Optimal Life Histories, Optimal Notation, and the Value of Reproductive Value. Am. Nat. 1982, 119, 803–823. [Google Scholar] [CrossRef]
  32. Tuan, S.J.; Lee, C.C.; Chi, H. Population and damage projection of Spodoptera litura (F.) on peanuts (Arachis hypogaea L.) under different conditions using the age-stage, two-sex life table. Pest Manag. Sci. 2014, 70, 805–813. [Google Scholar] [PubMed]
  33. Yang, H.M.; Macoris, M.L.G.; Galvani, K.C.; Andrighetti, M.T.M.; Wanderley, D.M.V. Assessing the effects of temperature on the population of Aedes aegypti, the vector of dengue. Epidemiol. Infect. 2009, 137, 1188–1202. [Google Scholar] [CrossRef] [PubMed]
  34. Du, Y.L.; Guo, H.M.; Sun, S.L. Effects of temperature on growth, development, and reproduction of peach borer. Chin. J. Entomol. 2012, 55, 561–569. [Google Scholar]
  35. Milosavljević, I.; McCalla, K.A.; Ratkowsky, D.A.; Hoddle, M.S. Effects of constant and fluctuating temperatures on development rates and longevity of Diaphorencyrtus aligarhensis (Hymenoptera: Encyrtidae). J. Econ. Entomol. 2019, 112, 1062–1072. [Google Scholar] [CrossRef]
  36. Available online: https://m.tianqi.com/qiwen/city_cangzhou/?ivk_sa=1024320u (accessed on 1 September 2022).
  37. Ma, B.; Jiang, H.Y. Effective accumulated temperature law and its application. Heilongjiang Sci. Technol. Inf. 2007, 20, 161. [Google Scholar]
  38. Xie, H.; Chen, L.J.; Han, J.; Wang, C. Damage characteristics and control methods of Riptortus pedestris in soybean. Soybean Sci. Technol. 2016, 6, 11–13. [Google Scholar]
  39. Chi, H. Timing of control based on the stage structure of pest populations: A simulation approach. J. Econ. Entomol. 1990, 83, 1143–1150. [Google Scholar] [CrossRef]
  40. Field, C.B.; Barros, T.F.; Stocker, D.; Qin, D.J.; Dokken, K.L.; Ebi, M.D.; Mastrandrea, K.J.; Mach, G.K.; Plattner, S.K.; Allen, M.; et al. (Eds.) Managing the risks of extreme events and disasters to advance climate change adaptation. In A Special Report of Working Groups I and II of the Intergovernmental Panel on Climate Change; Cambridge University Press: Cambridge, UK; New York, NY, USA, 2012; 582p. [Google Scholar]
  41. Charlotte, L.O.; Peter, M.; Tim, N. Agriculture and climate change are reshaping insect biodiversity worldwide. Nature 2022, 605, 97–102. [Google Scholar]
  42. Hu, Y.L.; Tian, X.Y.; Chen, L.; Ding, N.; Li, X.F.; Gao, Y.; Shi, S.S. Analysis of fertility and population trend of experimental population of Riptortus pedestris fed on soybean pods. Chin. J. Oil Crop Sci. 2022, 44, 460–466. [Google Scholar]
Figure 1. Insect rearing device used in the study, pink area is the moistened cotton to keep the soybean seed humidity, the yellow circle is the moistened soybean seed for R. pedestris feeding.
Agriculture 12 01505 g001
Figure 2. Age–stage-specific survival rates (sxj) of R. pedestris at different temperatures. Note: N1–N5 represent first, second, third, fourth, and fifth instars, respectively.
Agriculture 12 01505 g002
Figure 3. Age-specific survival (lx), age–stage-specific fecundity (fx), age-specific fecundity (mx), and age-specific maternity (lxmx) of Riptortus pedestris at different temperatures.
Agriculture 12 01505 g003
Figure 4. Life expectancy (exj) of each age–stage group of Riptortus pedestris at different temperatures. Note: N1–N5 represents first, second, third, fourth, and fifth instar, respectively.
Agriculture 12 01505 g004
Figure 5. Reproductive value (vxj) of each age–stage group of Riptortus pedestris at different temperatures. Note: N1–N5 represents first, second, third, fourth, and fifth instar, respectively.
Agriculture 12 01505 g005
Table 1. Developmental periods of Riptortus pedestris reared at different temperatures.
Developmental Stage Developmental Period (Days)
19 °C22 °C25 °C28 °C31 °C
Egg17.25 ± 0.11 a11.03 ± 0.02 b8.63 ± 0.06 c5.93 ± 0.04 d5.10 ± 0.04 d
First instar3.78 ± 0.08 a3.04 ± 0.08 a2.43 ± 0.08 b1.93 ± 0.05 c1.39 ± 0.06 c
Second instar4.70 ± 0.36 a4.43 ± 0.20 a3.34 ± 0.20 a2.26 ± 0.25 b2.17 ± 0.18 b
Third instar5.79 ± 0.54 a5.33 ± 0.40 a3.51 ± 0.24 a3.23 ± 0.37 b2.67 ± 0.31 b
Fourth instar9.78 ± 0.74 a6.93 ± 0.58 b5.83 ± 0.27 b4.17 ± 0.38 c4.53 ± 0.23 c
Fifth instar16.50 ± 2.05 a11.67 ± 0.97 b8.89 ± 0.56 b6.90 ± 0.64 c6.57 ± 0.41 c
Egg to adult55.00 ± 3.66 a42.44 ± 1.34 b34.53 ± 0.67 c25.40 ± 0.91 d24.43 ± 0.98 d
Female longevity95.50 ± 24.50 a64.00 ± 8.33 b51.73 ± 5.38 c33.83 ± 3.25 d27.50 ± 4.50 e
Male longevity114.50 ± 5.50 a64.83 ± 8.91 b55.38 ± 6.43 c50.50 ± 4.91 d31.80 ± 2.44 e
APOP32.00 ± 0.09 a8.00 ± 0.71 b7.50 ± 0.31 c5.00 ± 0.05 d4.00 ± 0.34 e
TPOP80.00 ± 0.29 a46.00 ± 0.70 b43.30 ± 1.35 c30.00 ± 0.07 d24.00 ± 0.82 e
Fecundity24.00 ± 11.83 d45.00 ± 15.36 b58.00 ± 28.59 a30.00 ± 9.77 c23.00 ± 11.09 d
Data are presented as mean ± SE. Different small letters in the same row indicate significant differences at p < 0.05. SEs were estimated by 100,000 bootstrap resampling.
Table 2. Developmental threshold and effective accumulative temperature of Riptortus pedestris.
Developmental StageDevelopmental Threshold Temperature (°C)Effective Accumulative Temperature (Degree-Days)Coefficient of Variation (cv)
Egg13.31 ± 0.00 b95.91 ± 0.07 ef0.06 ± 0.00 e
First instar11.74 ± 0.21 bc29.78 ± 0.44 h0.08 ± 0.01 d
Second instar11.61 ± 0.60 bc40.93 ± 2.38 gh0.12 ± 0.06 c
Third instar10.43 ± 1.36 c54.83 ± 6.82 g0.09 ± 0.03 d
Fourth instar10.57 ± 0.27 bc82.20 ± 1.64 f0.09 ± 0.00 d
Fifth instar11.78 ± 0.23 bc118.82 ± 1.69 d0.04 ± 0.01 e
Nymph10.91 ± 0.35 bc260.51 ± 1.83 b0.12 ± 0.05 c
Female adult16.21 ± 0.13 a114.22 ± 2.35 de0.18 ± 0.02 b
Male adult17.13 ± 0.42 a147.35 ± 5.79 c0.47 ± 0.05 a
Generation13.44 ± 0.05 b582.04 ± 0.05 a0.04 ± 0.05 e
Data are presented as mean ± SE. Different small letters in the same row indicate significant differences at p < 0.05. SEs were estimated by 100,000 bootstrap resampling.
Table 3. Population parameters of Riptortus pedestris at different temperatures.
Temperature °C
1922252831
Net reproductive rate (R0)0.63 ± 0.32 b1.52 ± 0.77 ab2.36 ± 1.69 a0.79 ± 0.40 b0.60 ± 0.31 b
Mean generation
time T (d)
86.76 ± 0.04 a53.55 ± 0.09 b56.44 ± 2.04 b41.34 ± 9.86 c27.50 ± 0.02 d
Intrinsic rate of
increase r (per day)
−0.01 ± 0.01 b0.01 ± 0.01 a0.01 ± 0.02 a−0.01 ± 0.01 b−0.02 ± 0.01 b
Finite rate of increase
λ (per day)
0.99 ± 0.01 b1.01 ± 0.01 a1.01 ± 0.02 a0.99 ± 0.01 b0.98 ± 0.02 b
Data are presented as mean ± SE. Different small letters in the same row indicate significant differences at p < 0.05. SEs were estimated by 100,000 bootstrap resampling.
Table 4. Effects of temperature on the life table parameters of Riptortus pedestris.
Number of Individuals Entering the Next Stage
Developmental Stage19 °C22 °C25 °C28 °C31 °C
Egg100.0 ± 0.00 a100.0 ± 0.00 a100.0 ± 0.00 a100.0 ± 0.00 a100.0 ± 0.00 a
First instar82.35 ± 0.61 c90.32 ± 0.64 b95.45 ± 0.59 a92.31 ± 1.12 b83.33 ± 0.78 c
Second instar49.41 ± 6.38 c75.27 ± 6.59 a81.13 ± 4.08 a61.54 ± 1.21 b79.16 ± 7.56 a
Third instar41.18 ± 7.20 c48.17 ± 1.91 bc60.45 ± 3.83 a47.69 ± 6.61 bc58.33 ± 2.43 ab
Fourth instar26.08 ± 3.09 c34.62 ± 2.51 b52.50 ± 3.44 a32.31 ± 5.78 b34.72 ± 2.16 b
Fifth instar12.35 ± 0.51 d21.07 ± 6.86 c47.73 ± 8.65 a27.69 ± 8.06 b23.61 ± 9.19 bc
Adult5.49 ± 1.87 d13.55 ± 2.75 bc30.23 ± 0.92 a15.39 ± 3.57 b9.72 ± 0.94 cd
Female ratio0.50 ± 0.61 a0.33 ± 0.73 b0.58 ± 1.01 a0.6 ± 0.54 a0.29 ± 0.37 b
Number of eggs laid per female24.00 ± 11.83 d45.00 ± 15.36 b58.00 ± 28.59 a30.00 ± 9.77 c23.00 ± 11.09 e
Number of eggs expected in the following generation65.88 ± 3.65 c259.35 ± 18.73 b789.00 ± 23.78 a277.02 ± 19.19 b64.83 ± 6.38 c
Population trend index (I)0.66 ± 0.72 c2.59 ± 1.23 b7.89 ± 2.34 a2.77 ± 0.50 b0.65 ± 0.23 c
Data are presented as mean ± SE. Different small letters in the same row indicate significant differences at p < 0.05. SEs were estimated by 100,000 bootstrap resampling.
Publisher’s Note: MDPI stays neutral with regard to jurisdictional claims in published maps and institutional affiliations.

