Article

Sentinel-2 Satellite Imagery-Based Assessment of Soil Salinity in Irrigated Rice Fields in Portugal

by
Romeu Gerardo
1,2 and
Isabel P. de Lima
1,2,*
1
Department of Civil Engineering, Faculty of Sciences and Technology, University of Coimbra, Rua Luís Reis Santos, 3030-788 Coimbra, Portugal
2
MARE—Marine and Environmental Sciences Centre/ARNET—Aquatic Research Network, University of Coimbra, 3030-790 Coimbra, Portugal
*
Author to whom correspondence should be addressed.
Agriculture 2022, 12(9), 1490; https://doi.org/10.3390/agriculture12091490
Submission received: 2 August 2022 / Revised: 10 September 2022 / Accepted: 12 September 2022 / Published: 17 September 2022
(This article belongs to the Special Issue Agriculture: 10th Anniversary)

Abstract

:
Salinization is a major soil degradation threat in irrigated lands worldwide. In Portugal, it affects several pockets of irrigated agricultural areas, but the spatial distribution and intensity of soil salinity are not well known. Unlike conventional approaches to appraise soil salinity, remote sensing multispectral data have great potential for detecting, monitoring, and investigating soil salinity problems in agricultural areas. This study explores the assessment of soil salinity in irrigated rice cultivation fields using two types of multispectral-based indices calculated from Sentinel-2 satellite imagery: (i) vegetation indices (Normalized Difference Vegetation Index, Green Normalized Difference Vegetation Index, Generalized Difference Vegetation Index and Soil Adjusted Vegetation Index), to monitor the indirect effect of salinity on rice growth; and (ii) salinity indicators, namely those based on visible and near-infrared bands (Normalized Difference Salinity Index) and on shortwave infrared bands (Salinity Index ASTER). The data are for the Lower Mondego Valley (Central Portugal) and the period 2017–2018. Results revealed that salinity indices can be used for mapping soil salinity and constitute a valuable soil salinity assessment tool in rice cultivation areas affected by salinity issues. As there is less reported inventorying of spatial extent of such degradation in irrigated agricultural areas of Portugal, this innovative approach allowed by remote sensing technology can add to understanding the spatial extent of such areas and undertaking more such studies spatially and temporally.

1. Introduction

Soil salinity is considered one of the major factors affecting the interaction between plants and soil, due to its significant negative impact on the availability of soil nutrients and crop yields [1,2]. It is also one of the most hazardous soil degradation processes.
Many geological (e.g., pedogenesis), geomorphological (e.g., elevation gradients), meteorological (e.g., rainfall, air temperature), hydrological/hydrogeological (e.g., evapotranspiration, groundwater depth and quality) and management (e.g., irrigation and agronomic practices) factors potentially affect the levels of soil salinity in irrigated lands—e.g., [3,4,5,6]. In particular, some agricultural practices contribute significantly to the salinization of agricultural lands: a combination of poor land management and unsustainable irrigation practices cause changes in soil and vegetation cover and, ultimately, loss of vegetation and agricultural productivity [7,8,9,10,11,12].
Due to the negative impact of salinization on soil fertility and agricultural production, much attention has been dedicated to finding ways to preserve soil quality and reclaim saline soils. A first step is assessing the spatial extent and severity of soil and water salinity in affected areas. For example, mapping of the spatial distribution of soil salinity in irrigated croplands (e.g., rice fields) is important for irrigation and drainage management and for identifying water and environmental policies that safeguard the sustainability of farming systems [13,14,15].
Although conventional methods, such as field surveys and laboratory analyses, are able to provide accurate soil salinity mapping, such methods are time-consuming, costly and labor intensive, especially for large-scale surveys. Recent advances in the application of remote sensing technology in mapping and monitoring degraded lands, especially salt-affected soils, have shown that these technologies are helpful for enhancing the speed of execution, accuracy and cost effectiveness of those tasks. Remote sensing techniques have several advantages over conventional field sampling and electromagnetic induction methods for measuring soil salinity, such as their large areal coverage, frequent revisiting times and low cost: several studies have shown, e.g., that (i) salinity at or near the soil surface (≈top 0.05–0.1 m layer) can be identified over large regions using remote sensing tools [16], and (ii) satellite data and remote sensing techniques have the potential to monitor soil salinity more efficiently and more economically than other conventional approaches [16,17,18,19].
In particular, Multispectral Instrument (MSI) imagery has already proven to be a promising tool for assessing soil salinity and, ultimately, for producing electrical conductivity (EC) maps. The European Space Agency’s (ESA) Sentinel-2 is one of the examples of this technology that provides 10 m to 60 m spatial resolution data collected over a wide electromagnetic spectrum range, including visible (V), near-infrared (NIR), short wave infrared (SWIR), and four red-edge (RE) bands; these data are available as free data to users and cover a wide range of spatiotemporal imaging acquisitions. The Sentinel-2 satellite provides high-resolution optical images (i.e., at 10 m spatial resolution) and global coverage of the Earth’s land surface, every 5 days [20]. These attributes make Sentinel’s multispectral imagery a potential tool for environmental monitoring and can be useful for monitoring surface soil salinity and assessing soil management [21,22].
In recent years, several salinity indicators have been developed to detect soil salt-affected areas from satellite imagery [16,23,24,25], which are mostly based on the spectral signature of saline soils in different bands of the satellite sensors. Such salinity indices (SI’s), which could be used as direct salinity indicators, highlight the spectral reflectance of salt crusts on the soil surface. Multi-temporal remote sensing data covering a wide range of the electromagnetic spectrum [2,26,27,28] have been used in several studies, especially to calculate soil salinity indicators based on V and NIR reflectance data [2,27,29,30,31]. More recently, SWIR reflectance data have likewise been used for this purpose [32,33]. However, vegetation indices (VI´s) can also be applied to indirectly assess saline soils via the adverse effects of soil salinity on crop growth and plant stress. Among others, Bannari et al. (2008) [34] have assessed the negative impact of the salts existing in the soil on vegetation by applying the widely used Normalized Difference Vegetation Index.
Salinity has been a threat to the fresh water and coastal lowlands of rice production areas in Portugal (e.g., in the Lezíria Grande island, in the Tagus River, and in the Mondego, Sado and Lis Valleys’ lowlands), where about 180 million kilograms of rice are produced yearly [35]. These areas have a Mediterranean climate influenced by the proximity of the Atlantic Ocean. The relatively flat terrain enhances the vulnerability of the rice fields to seawater intrusion. Hence, the potential of Sentinel-2-based tools for assessing salinity problems deserves investigation to improve water and soil resources management and conservation, as well as the sustainability of agriculture production, at the local and regional scales. Portugal is the fourth rice producer of the European Union (EU), accounting for about 6% of the EU rice production [36].
The aim of this study is to contribute to better understanding the potential of remote sensing satellite data to characterize soil salinity in agricultural fields. The study focuses on soil salinity-prone rice cultivation areas located in coastal regions, in central Portugal, and it uses two types of multispectral-based indices calculated from Sentinel-2 satellite imagery: (i) vegetation indices and (ii) salinity indices, namely those based on V and NIR bands and on SWIR bands. Results revealed that salinity indices can be used for mapping soil salinity and constitute a valuable soil salinity assessment tool in rice cultivation areas affected by salinity issues. Data on soil salinity in the study areas, in the Mondego river catchment, are very scarce: the better understanding of salinity in those areas is key to adequately and sustainably manage rice fields and irrigation and drainage water.

2. Materials and Methods
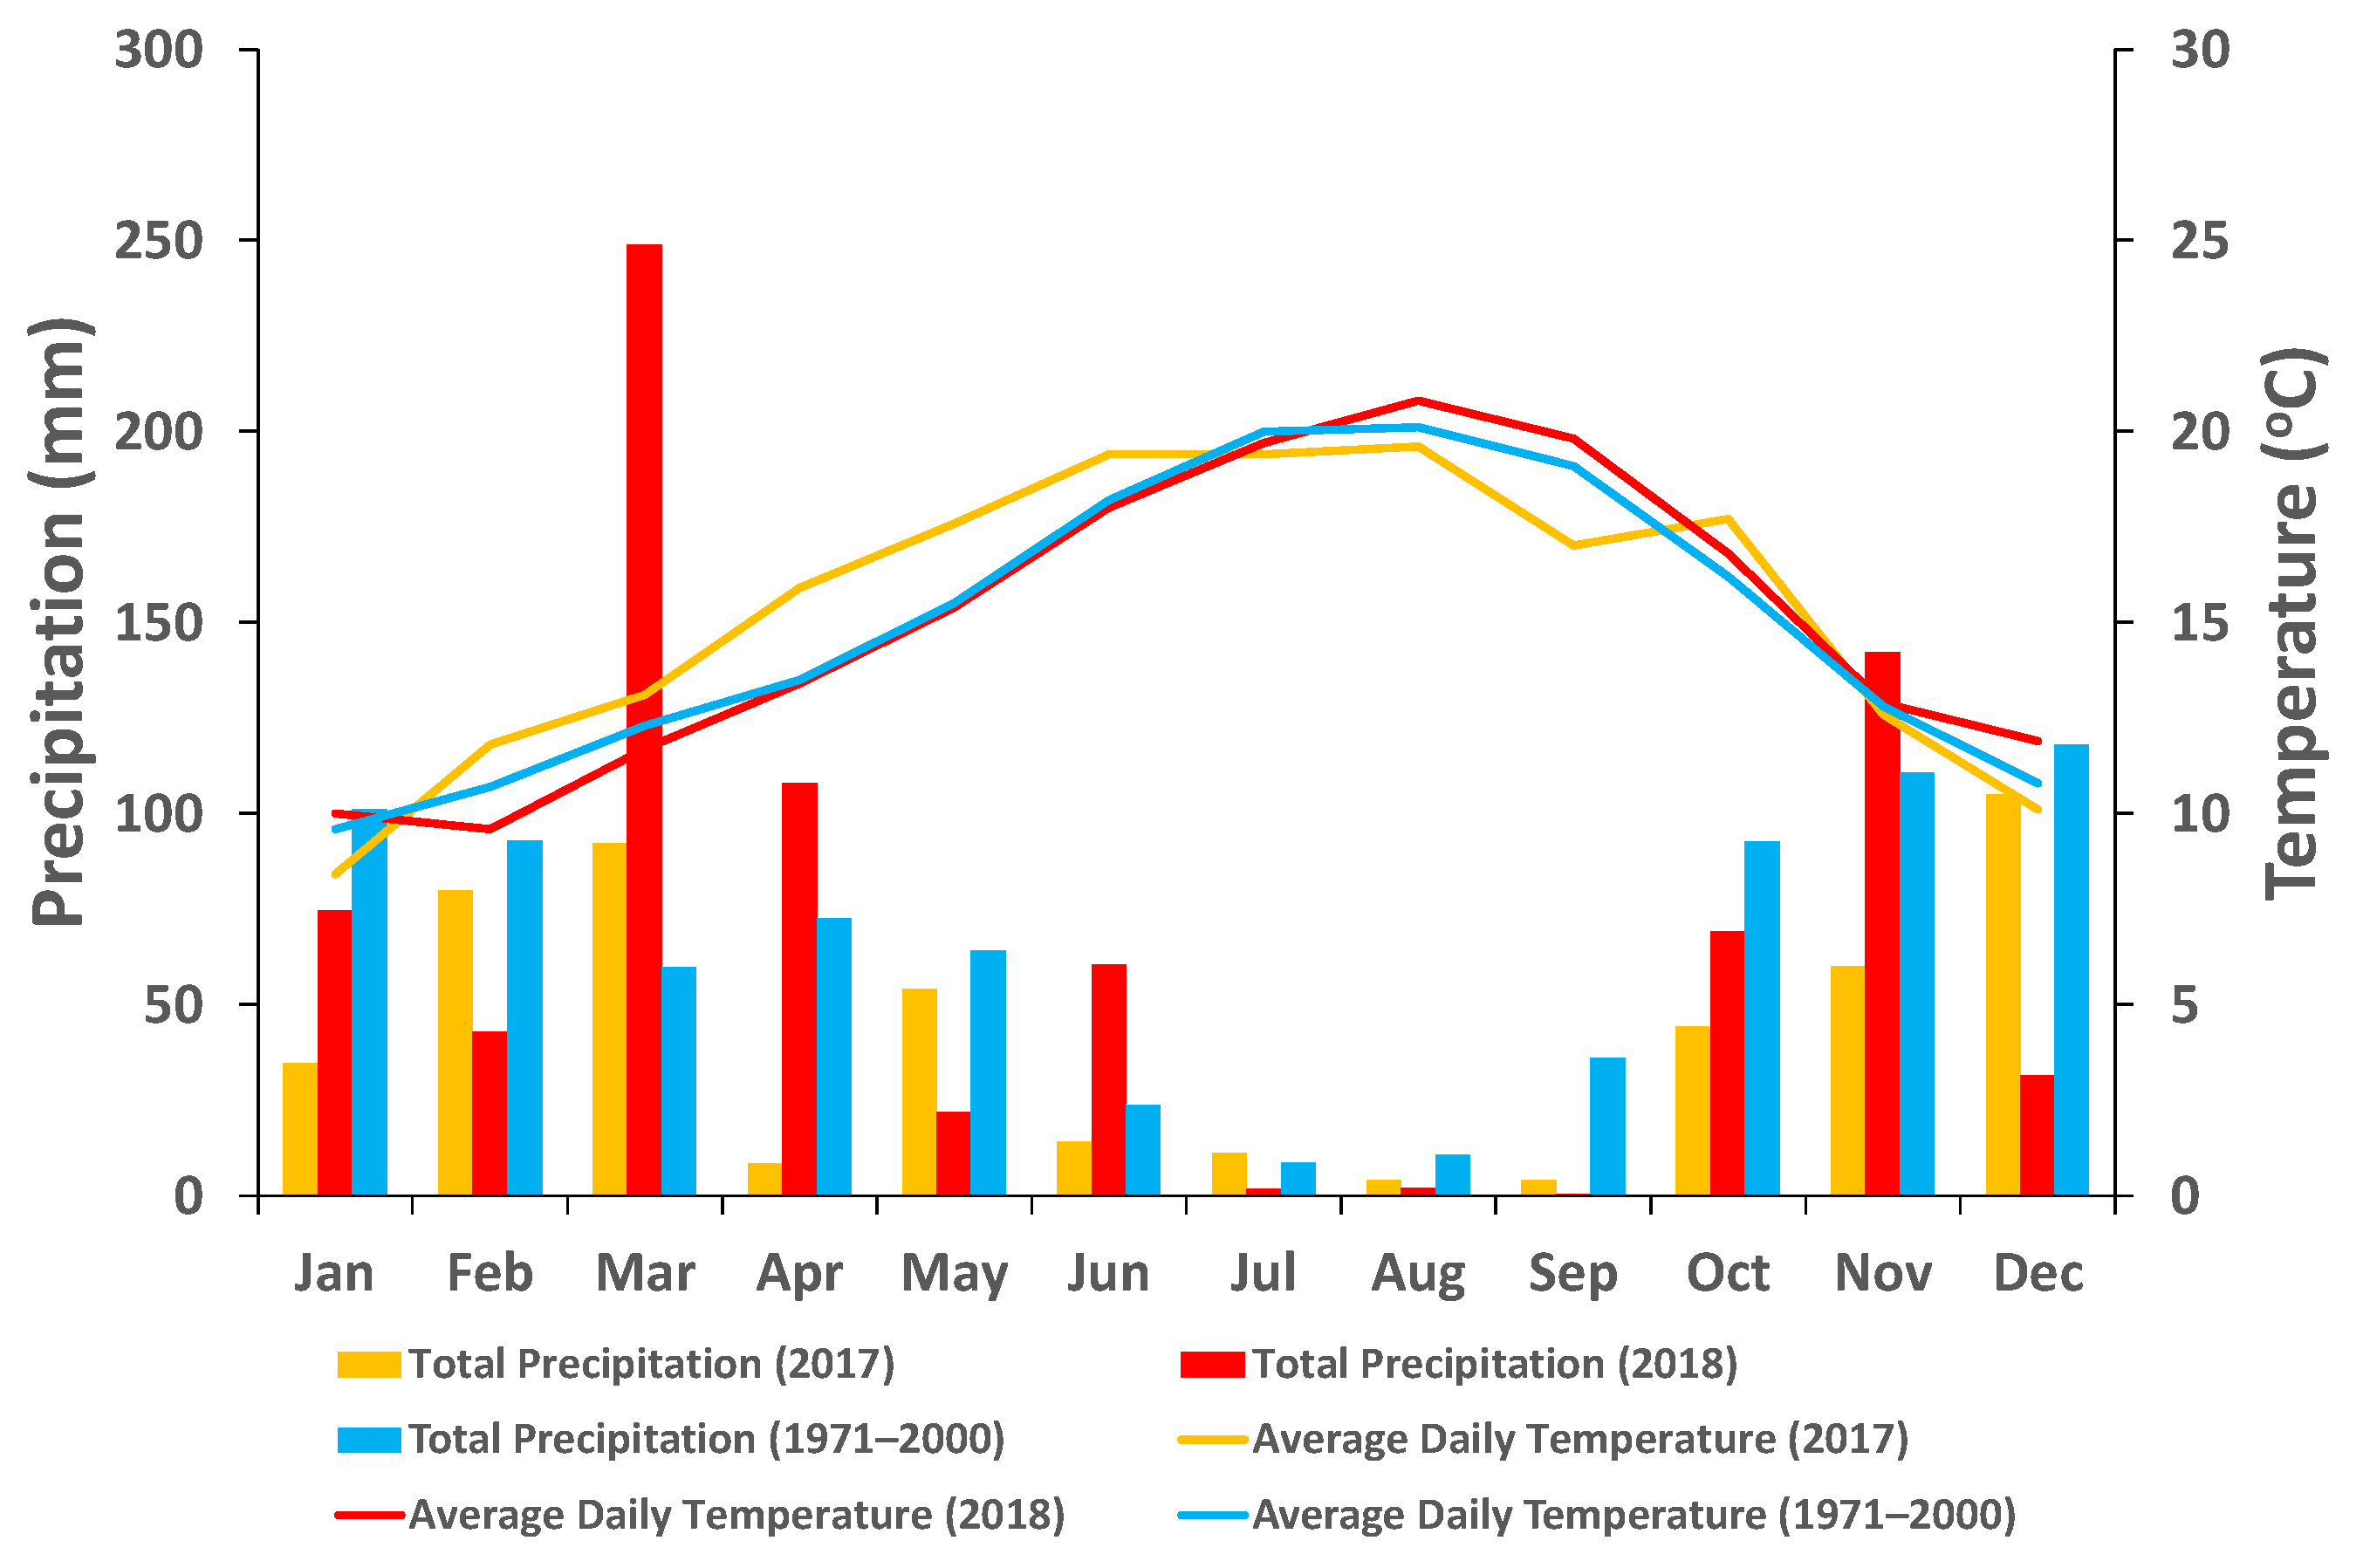
2.1. Study Areas

This study focuses on two rice cultivation lowland areas located in the River Mondego catchment: “Quinta do Canal” and “Pranto”, near the Atlantic Ocean, in the center of Portugal (Figure 1), and dedicates particular attention to two rice field plots, one from each of these areas. In these rice cultivation areas, the rice produced has a long grain, of the variety Ariete, subspecies Oryza sativa L. spp. japonica; commercially, it is known as “Carolino” rice. Direct wet seeding is applied, and the irrigation of the rice fields is by continuous flooding.
Quinta do Canal: Quinta do Canal is a farm predominantly dedicated to rice cultivation, composed of 71 rice fields (coordinates: 40° 6′ 53.3″ N, 8° 48′ 7.95″ W). The area, which constitutes one irrigation unit (Bloco 1) of LMID (Figure 1), is located on the left bank of the Mondego River, in the downstream part of the Lower Mondego Valley. Quinta do Canal is bounded to the north by the Mondego River, to the south by the Pranto River and to the west by the Mondego river estuary. The area is protected by dikes against high river discharges and tides. The farm covers a rice cultivation area of ≈332 ha, where the average rice field plots’ area is about 4.7 ha. The selected rice plot (Figure 1a) has an area of ≈1.6 ha. At the study site, irrigation water is supplied by a main irrigation canal that uptakes water from the Mondego River near the city of Coimbra, about 32 km upstream of this irrigation unit. In Quinta do Canal, the rice fields’ drainage water collected by the surface drainage system that consists of widely spaced open ditches is discharged by gravity to River Pranto, which is controlled by tidal gates.
Pranto: Pranto River is the most downstream left-bank tributary of the Mondego River. The plot field selected in this rice cultivation area (coordinates: 40°5′48.60″ N, 8°47′12.27″ W), of ≈1.6 ha (Figure 1b), is included in an irrigation unit (1200 ha) of the LMID. On average, the size of the rice fields in the Pranto irrigation unit is smaller than in Quinta do Canal, because the Pranto irrigation unit has not experienced yet any type of land reparcelling, which was carried out at other irrigation unit of LMID. The study area is skirted at its northern boundary by the Pranto River and at its western boundary by the Mondego River estuary. In these downstream lowlands, the Pranto River is affected by tidal water level variations. Excess rainfall from the study area is discharged by gravity during the low tides, which often leads to drainage constraints during excessive precipitation events. Thus, the area is prone to waterlogging and soil salinization risk caused by shallow saline groundwater that arise from the proximity to the Atlantic Ocean and the estuarine tides. The water available for irrigation is pumped directly from the Pranto River by the local farmers and conveyed by a collective irrigation system that consists of open ditches, which are also used for drainage. The water circulation (and re-use) negatively impacts on the quality of the water that is used to irrigate the fields. Thus, expectedly, the quality of the irrigation water applied in this Pranto cultivation area is worse than the quality of the water that is used for irrigating Quinta do Canal.
In general, in the Quinta do Canal and Pranto agricultural area, soils have Holocene alluvial origin and high agricultural value. In the Lower Mondego region, one finds silt-loam soils, upstream, and silt-clay-loam soils, downstream, although there are also sandy soils—e.g., [37]. Near the coast, in the lower lands, heavy soils are dominant, which, combined with shallow groundwater levels, leads to drainage problems and increased soil salinization risk. This risk is enhanced by low rainfall and high evaporation/evapotranspiration in summer—e.g., [38,39,40].
According to the Köppen–Geiger climate classification, the climate in the study area (Quinta do Canal and Pranto) is temperate with dry and mild summers (Csb). For the periods 1971–2000, 2017 and 2018, air temperature and precipitation data from the nearest weather station (meteorological station of Monte Real (Leiria); coordinates: 39°49′52″ N, 8°53′14″ W) are presented in Table 1 and Figure 2.
During the period from January to April (roughly, second half of winter and beginning of spring), which precedes the rice cultivation season that typically starts in early May, precipitation was below the 1971–2000 climate normal in 2017, whereas in 2018 precipitation exceeded that climate normal by approximately 87% (Table 1). In the same 4-month period, precipitation was higher by 120% in 2018 than in 2017 and air temperature was higher in 2017 than in 2018. Thus, the period January–April was drier and warmer in 2017 than in 2018. For the Quinta do Canal plot sowing dates were 8 May in 2017 and 12 May in 2018, and for the Pranto plot they were 12 May in 2017 and 23 May in 2018.

2.2. Remote Sensing Data

2.2.1. Sentinel-2 Data Processing

The Sentinel-2 MSI mission is composed of two twin satellites, Sentinel-2A and Sentinel-2B, launched in June 2015 and March 2017, respectively. The constellation offers a revisiting time of 5 days under the same viewing angle, with a swath of 290 km. Five spectral bands were used in this study (Table 2). The spatial resolution of the data is 10 m for the V and NIR bands and 20 m for the SWIR bands. Sentinel-2 satellite imagery for the periods from 4 April to 25 October 2017 (13 images) and from 5 May to 27 October 2018 (19 images) were downloaded from the Copernicus Open Access Hub European Space Agencies (ESA SciHub) [20]; the cloud cover of these images was less than 15%, but they were always cloud-free for the two study plots. Sentinel-2 satellite data processing and cartographic materials’ creation were carried out in QGIS 3.6.0 Geographic Information System.

2.2.2. Satellites’ Data Based Calculations: Vegetation and Salinity Indices

The use of VI’s for studying soil salinity, and not only SI’s, is explained by the fact that stressed vegetation could be a surrogate for the presence of salts in soils, since salt-affected soils usually give way to poorly vegetated areas. Thus, reflectance from vegetation has been used as an indirect indicator for soil salinity detection and mapping [43,44,45,46]. Four selected remote sensing-based VI’s (Normalized Difference Vegetation Index (NDVI), Green Normalized Difference Vegetation Index (GNDVI), Generalized Difference Vegetation Index (GDVI) and Soil Adjusted Vegetation Index (SAVI)) were used to monitor vegetation conditions in areas of high salinization risk. All four indices are based on data from reflectance of the V and NIR bands (Table 2 and Table 3).
Alongside this, dedicated soil salinity indices, namely the Normalized Difference Salinity Index (NDSI) and the Salinity Index ASTER (ASTER_SI), have also been derived from Sentinel-2 satellite data. The NDSI calculation is based on data from V and NIR bands, whereas the ASTER_SI uses data from SWIR bands (Table 2 and Table 3). For ASTER_SI, pre-processed Sentinel-2 images were downloaded and then resampled at a spatial resolution of 10 m.
The selected indices are briefly described below. They all present advantages and limitations, depending on their application purpose:
NDVI: The Normalized Difference Vegetation Index values can vary with soil use, plant phenologic stage, hydrologic soil condition and typical weather in a given area. These properties make NDVI a valuable tool for evaluating vegetation covers, including rice crop, as well as for classifying and investigating vegetation dynamics and phenology [54,55]. As the plants’ photosynthetic process is carried out mainly by plant leaves, and solar radiation in the visible region (0.40 μm to 0.72 μm) is mostly absorbed by photosynthetic pigments, high NDVI values (i.e., values approaching +1) indicate vigorous vegetation, with high photosynthetic activity, and dense vegetation cover. In contrast, lower values of NDVI values indicate weak/sparse vegetation cover. In general, values of NDVI in the vicinity of zero indicate barren areas (e.g., rock, sand) [56].
GNDVI: The Green Normalized Difference Vegetation Index is similar to NDVI except that instead of the red spectrum it assesses the green spectrum in the range 0.54–0.57 μm. This index is thus derived from the Green and NIR spectral bands and it has been found to be more sensitive to chlorophyll content than NDVI. It allows us to estimate the photosynthetic activity of the vegetation cover [57,58], to determine moisture content and nitrogen concentration in plant leaves and canopy, and to assess less vigorous and aged vegetation [59,60,61]. GNDVI values between −1 and 0 are associated with the presence of water or bare soil.
GDVI: The Generalized Difference Vegetation Index has been used to complement the information in other vegetation indices, mainly for research in dry areas [27]. Due to its higher sensitivity and amplified dynamic range manifested in sparsely vegetated areas, GDVI is more sensitive to dryland biomes such as rangeland and woodland than other VI’s [22,27,62,63]. In contrast, when applied to densely vegetated areas, it shows low sensitivity and saturation. This index has also great potential to assess soil salinity [27].
SAVI: The Soil Adjusted Vegetation Index (SAVI) was developed by Huete (1988) [52] to eliminate soil-induced variation in the vegetation spectral signal. This is particularly important for observed areas exhibiting sparse canopy covers, for which analysis is likely biased by the presence of different soil backgrounds. SAVI uses the Red and NIR bands, together with an empirical parameter L (Table 3). Huete (1988) [52] has shown that, in the calculation of SAVI (Table 3), the empirical parameter L = 0.5 permits the best adjustment, i.e., to minimize the secondary backscattering effect of canopy-transmitted soil background reflected radiation; this study adopted L = 0.5. Although SAVI is not a direct salinity index, it is expected that SAVI negative values indicate high soil salinity [46]. Similar to other studies that take SAVI as a salinity index—e.g., [43,64], in this study SAVI is grouped with the (other) SI’s studied.
NDSI: The Normalized Difference Salinity Index is an indicator of soil salinity. Values of NDSI approaching +1 are associated with high soil salinity [46,65]. Studies reveal that the Red and NIR bands (Table 3), which are used to calculate NDSI, are the most sensitive to the soil’s ions that cause salinity—e.g., [66].
ASTER_SI: The Salinity Index ASTER, proposed by Bannari et al. (2008) [34], is based on SWIR bands and was applied in different studies using data from Aster, Landsat-ETM+ and Sentinel-2 satellites. It can be used for distinguishing between different soil salinity contents—e.g., [65,67]. Values of ASTER_SI approaching +1 indicate low soil salinity. Bannari et al. (2008, 2016) [34,68] demonstrated that the SWIR bands are more sensitive than other bandwidths to categorize soil salinity, particularly slight and moderate salinity in irrigated agricultural lands.

2.3. Rationale and Analysis Approach

Although rice tolerance to salt depends on genotype and management practices, soil and water salinity is one of the major constraints affecting rice production worldwide—e.g., [69,70,71]. In coastal areas, such as the study areas, salinity can be associated with high sea levels as they bring saline water further inland and expose more rice growing areas to salty condition. However, arid and semi-arid zones, characterized by low precipitation and high evaporation, are usually the most affected due to the limited lixiviation of salts from the soil profile, which results in increased salt accumulation—e.g., [72].
Several studies show that the advance of seawater into the downstream sections of the Lower Mondego drainage network (Section 2.1), caused by sea level rise, will increase salinity of local rivers and groundwater near the coast, enhancing already existing soil salinization problems—e.g., [73,74] in a region where sea water intrusion has already been an issue for a long time because of the topography of the area.
The use of Sentinel-2 satellite imagery for soil salinity assessment has been studied in recent years [21,75]. Multispectral remote sensing data have been applied in soil salinity studies because of their large coverage area, easy access, and relatively good spatial and spectral resolution of the images [76,77]. In agricultural irrigation areas, the application of vegetation and salinity indices is increasing, and constitutes an effective method of soil salinity evaluation [33,78], including in rice cultivated areas [22,79,80].
To explore salinity conditions in the study areas and their eventual impact on rice crop, vegetation indices NDVI, GNDVI and GDVI were used to create VI’s time series for each study plot area, for 2017 and 2018. Only the rice cultivation period, which occurs between May and October, was considered. Typically, in this period, the fields are flooded at the time of sowing (usually, early May) and the flooding is interrupted 2–3 weeks before harvest (usually, early October). During the rice crop season, the rice vegetation cover grows and reaches a maximum (at the rice age of approximately three months) and then gradually decreases until harvest time.
The field plots’ vegetation indices’ temporal profiles reflect the variation in the different average spatial conditions at the plot scale, over time, including the conditions of the rice plant during its growth and development—e.g., [55]. The growth and development of the rice plant can be divided into two phases, vegetative and reproductive, which can be subdivided themselves in different stages—e.g., [81]. The vegetative phase embraces the period from germination to the beginning of panicle development inside the main stem, whereas the reproductive phase concerns the growth and development of the plant from the end of the vegetative phase to the beginning of the maturity phase that starts when rice grains first become firm. These phases complement each other to produce a rice plant that can absorb sunlight and convert that energy into rice grain. In more detail, the growth stages found in the vegetative phase are emergence, seedling development, tillering and internode elongation, in the reproductive phase are prebooting, booting, heading and grain filling, and finally grain maturity. The duration of each one of these stages depends on rice variety, environmental conditions and agronomic management practices. In general, the rice growth stages for Portuguese rice agriculture have the following typical durations, starting from sowing: vegetative phase: 0–60 days; reproductive phase: 60–85 days; and maturity phase: 85–130/140 days—e.g., [82].
Several studies explored the potential of two prominent dedicated salinity indices (NDSI and ASTER_SI) and the most commonly used indirect salinity index (SAVI) for soil salinity assessment in paddy fields [46,83,84]. In this study, these indices were selected to specifically identify (i) salt-affected agricultural soils and (ii) expected differences in salinity levels before and after the rice crop season, for 2017 and 2018 and for both selected rice fields. The analysis focused on the surface soil salinity and the spatial distribution and average values of the SI’s were explored. Usually, in the study areas, the rice crop season runs from May to October, when harvest takes place, with rice reaching its maximum growth in July–August. To guarantee that the analysis of the soil surface would not be biased by the presence of vegetation cover, only conditions of bare soil were investigated; the corresponding selected dates are presented in Table 4.
In addition, potential impacts of soil salinity (identified from SI’s) on rice development (assessed using VI’s) and yield were explored. Salinity can reduce yield production in rice crops—e.g., [85]. The establishment of simple cause-effect relations using remote sensing indicators—e.g., [86] could contribute to enable the assessment of the impact of salinity on rice production in areas where this problem needs attention. However, the effect of salinity on rice is many fold, leading to delay in seed setting, inhibition of germination, difficulties in crop establishment and leaf area development, decrease in dry matter production, and even sterility [72].
Presently, different approaches are being used to predict rice yields from remotely sensed data. The correlation between the spectral reflectance of rice crop and crop yield is widely accepted and used for rice yield predictions—e.g., [87]. The following relation between the value of the NDVI during the rice reproductive stages of booting and heading (about 60–70 days after sowing), which is considered the peak of the rice-growing season, and rice yield was proposed by Siyal et al. (2015) [88] as a predictive model of rice yield and will be used in this study as a reference for differences in yield, since no field data are available:
Crop   Yield   ( tons   h a 1 ) = 23.641 × NDVI 10.343

3. Results and Discussion

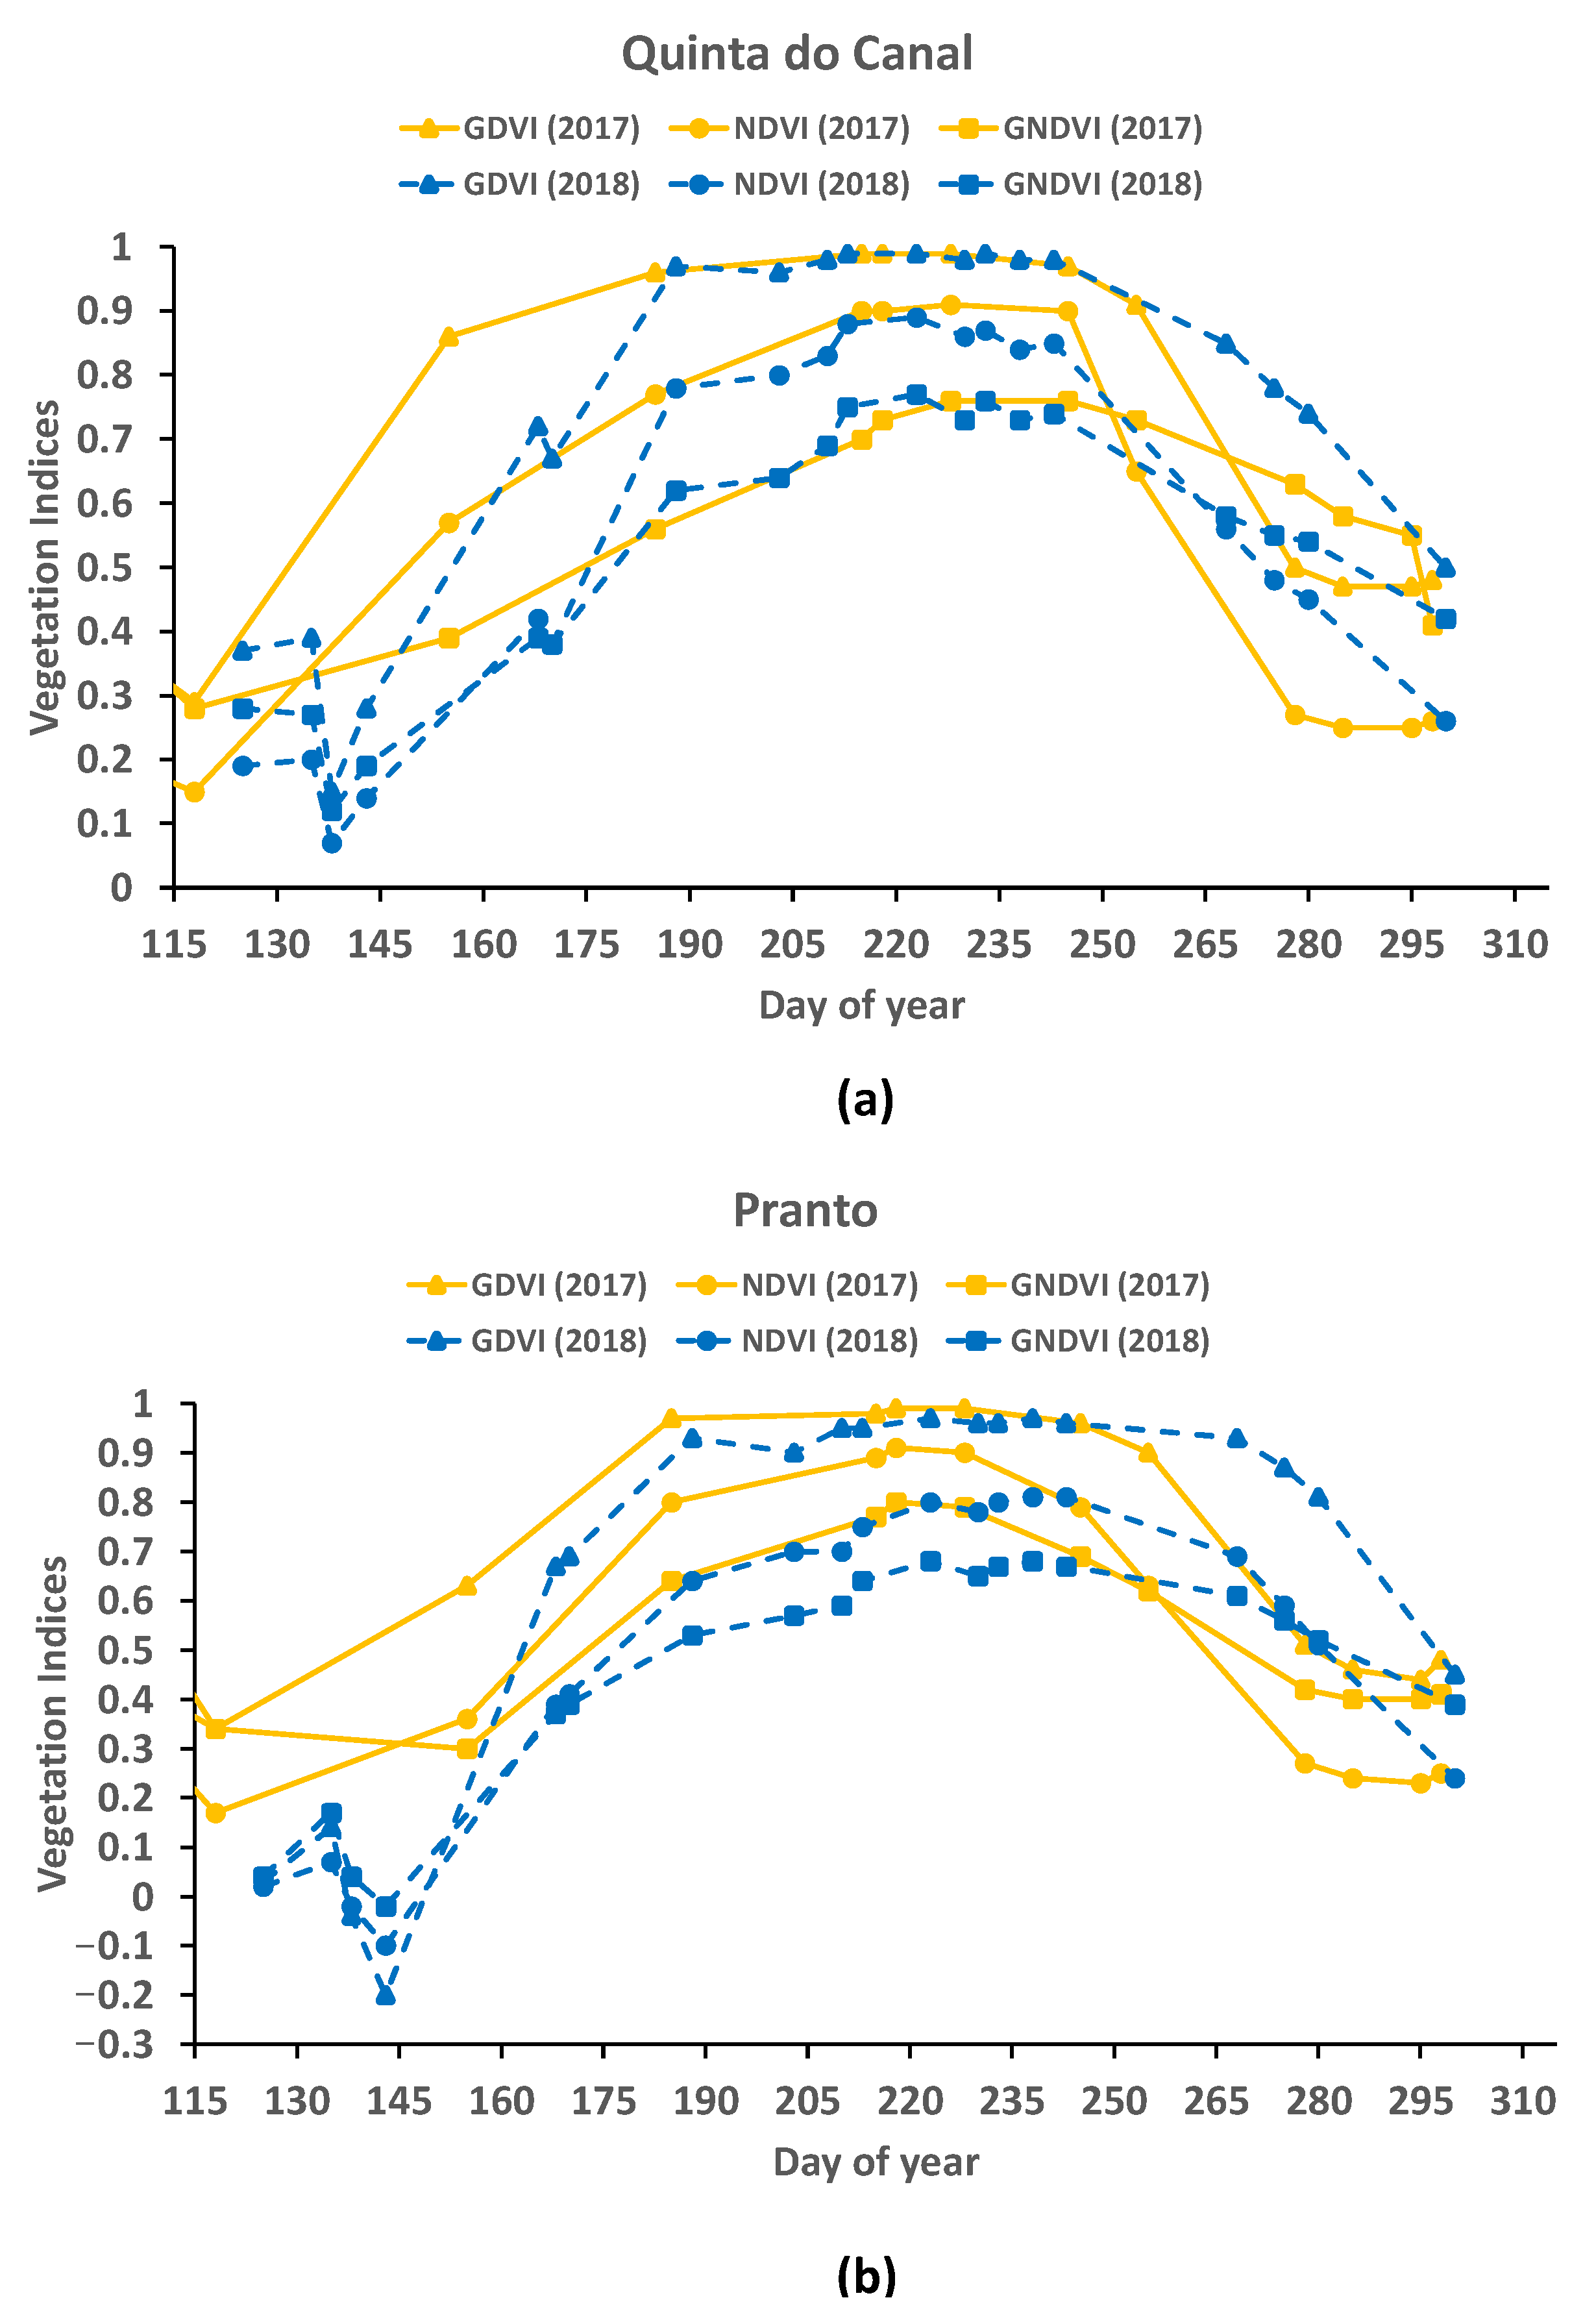
3.1. Temporal Variation in Vegetation Indices

For the 2017 and 2018 rice growing seasons (Section 2.1), Figure 3 shows the temporal variation of the NDVI, GNDVI and GDVI plot average values estimated from Sentinel-2 satellite data (Section 2.2.1) for the selected rice fields in Quinta do Canal (Figure 3a) and Pranto (Figure 3b). Results revealed that the number of satellite images that were available during the rice-growing period allows us to perceive well the rice crop life cycle.
The field plots’ vegetation indices’ profiles in Figure 3 reveal the different rice growing conditions and the different rice crop phases (vegetative phase, reproduction phase and maturity phase). In this figure, the lowest VI’s values, around zero, are observed in the initial phase of the rice crop cultivation; these values are expected to be related to the flooding of the fields close to the crop (wet) sowing. The highest VI’s are reached in August and reflect the greenness peak of rice, which is attained during the heading stage. Towards the end of the cultivation period, the VI’s values decrease until the plant reaches full maturation and is harvested, which usually occurs in the beginning of October, in the Lower Mondego region. In irrigated rice fields, especially in early periods of the cultivation period, irrigation water over the fields (due to flooding irrigation) is expected to play an important role in the spectral (mixed) signal obtained for rice fields.
Comparison of the 2017 and 2018 weather conditions prior and during the rice growing period showed that, as expected, they likely had an important role in plant establishment and growth, for all field plots. The year 2017 registered high air temperatures (roughly until June/July) and low precipitation (i.e., below normal), whereas in 2018 high precipitation was observed (i.e., above normal), in particular during March and May (Figure 2). For the Quinta do Canal field plot, the VI’s values attained in 2017 and 2018 at the plot scale were similar, which can be explained by the controlled irrigation conditions and agronomic management found at this site (Figure 3a). On the other hand, for the Pranto cultivation area conditions are overall more variable and less favorable with regard, e.g., to the availability of good quality irrigation water, which is expected to affect rice development and production. These factors likely explain the important differences in VI’s values found for the Pranto rice field plot between 2017 and 2018 (Figure 3b), which indicate the vulnerability of the Pranto River rice cultivation area to environmental variability.
The plots’ VI’s maximum values attained for the selected rice fields of Quinta do Canal and Pranto during the whole rice cultivation season are presented in Table 5. For Quinta do Canal, where irrigation and drainage management is superior and more effective [89], the VI’s maximum values differed little between these two years (Figure 3a) in comparison to the results obtained for the Pranto plot. The difference goes up to −15% for the Pranto plot and the GNDVI. GDVI is the only index that does not capture differences in the maximum development of the rice plant between the two years, which is a manifestation of its low sensitivity and saturation when applied to densely vegetated areas. However, saturation is also found for NDVI. All VI’s profiles calculated for both study plots (Figure 3) reveal that the growing stages were delayed in 2018 in relation to 2017.

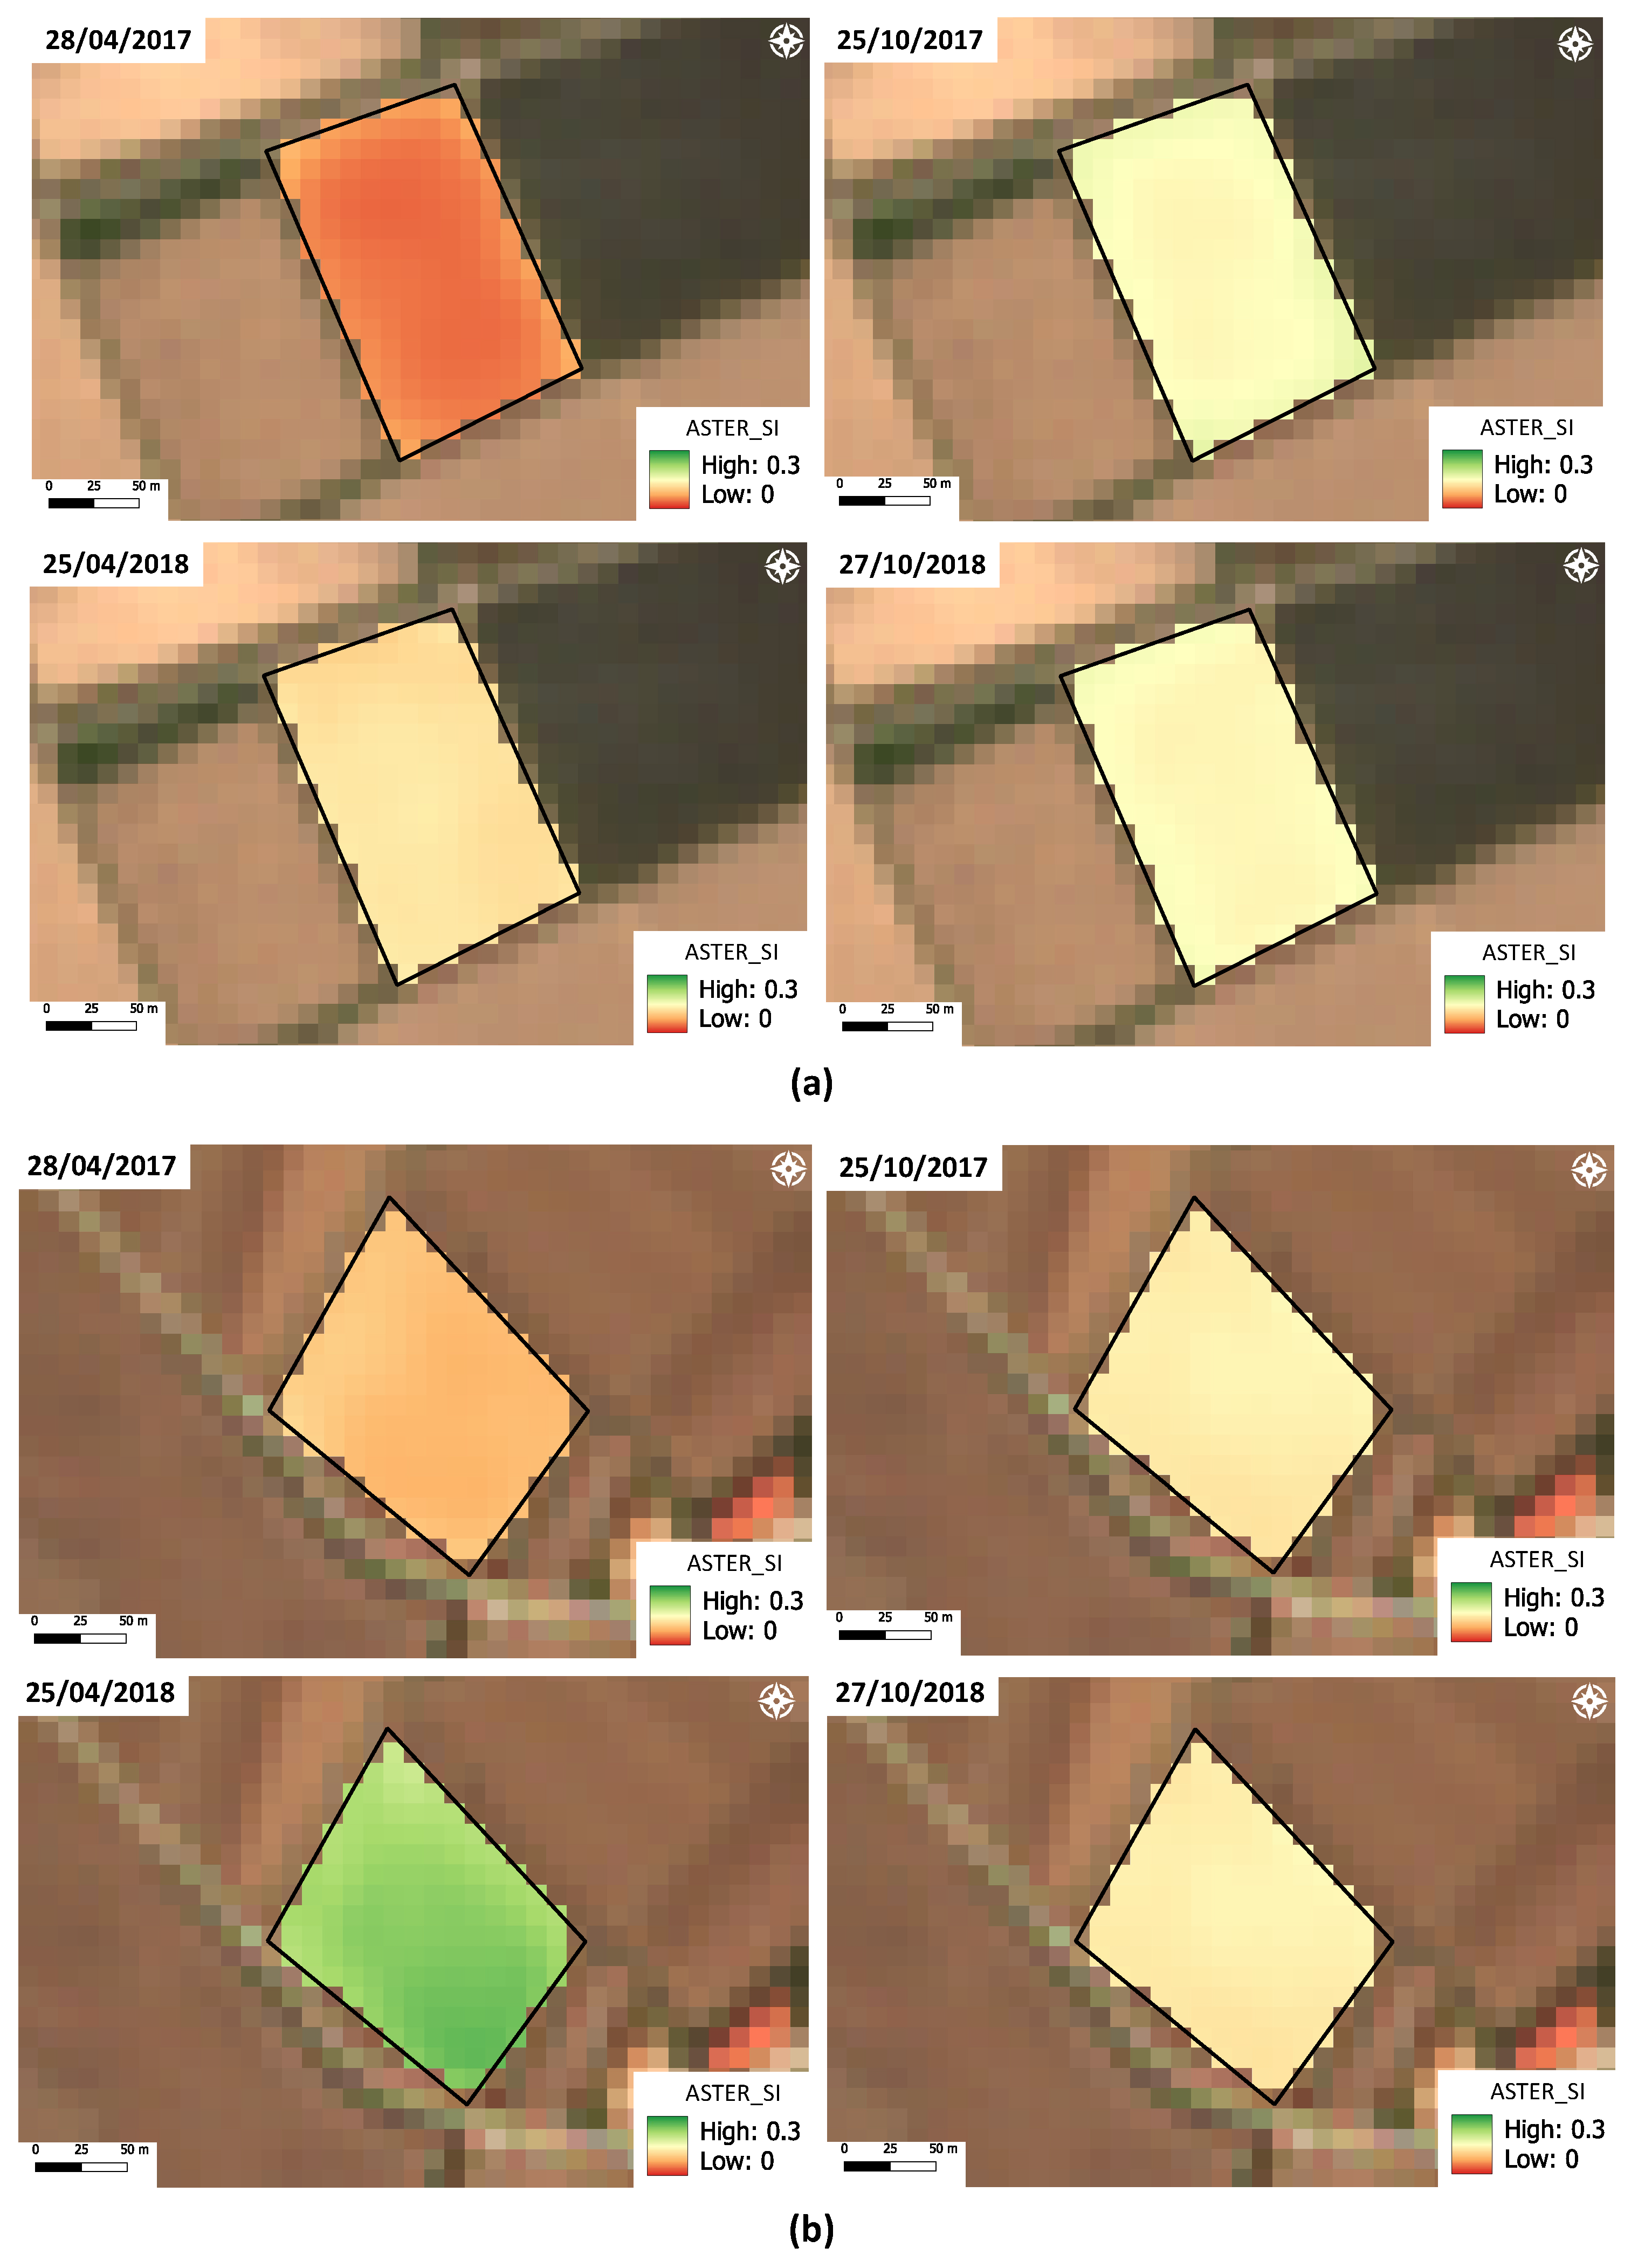
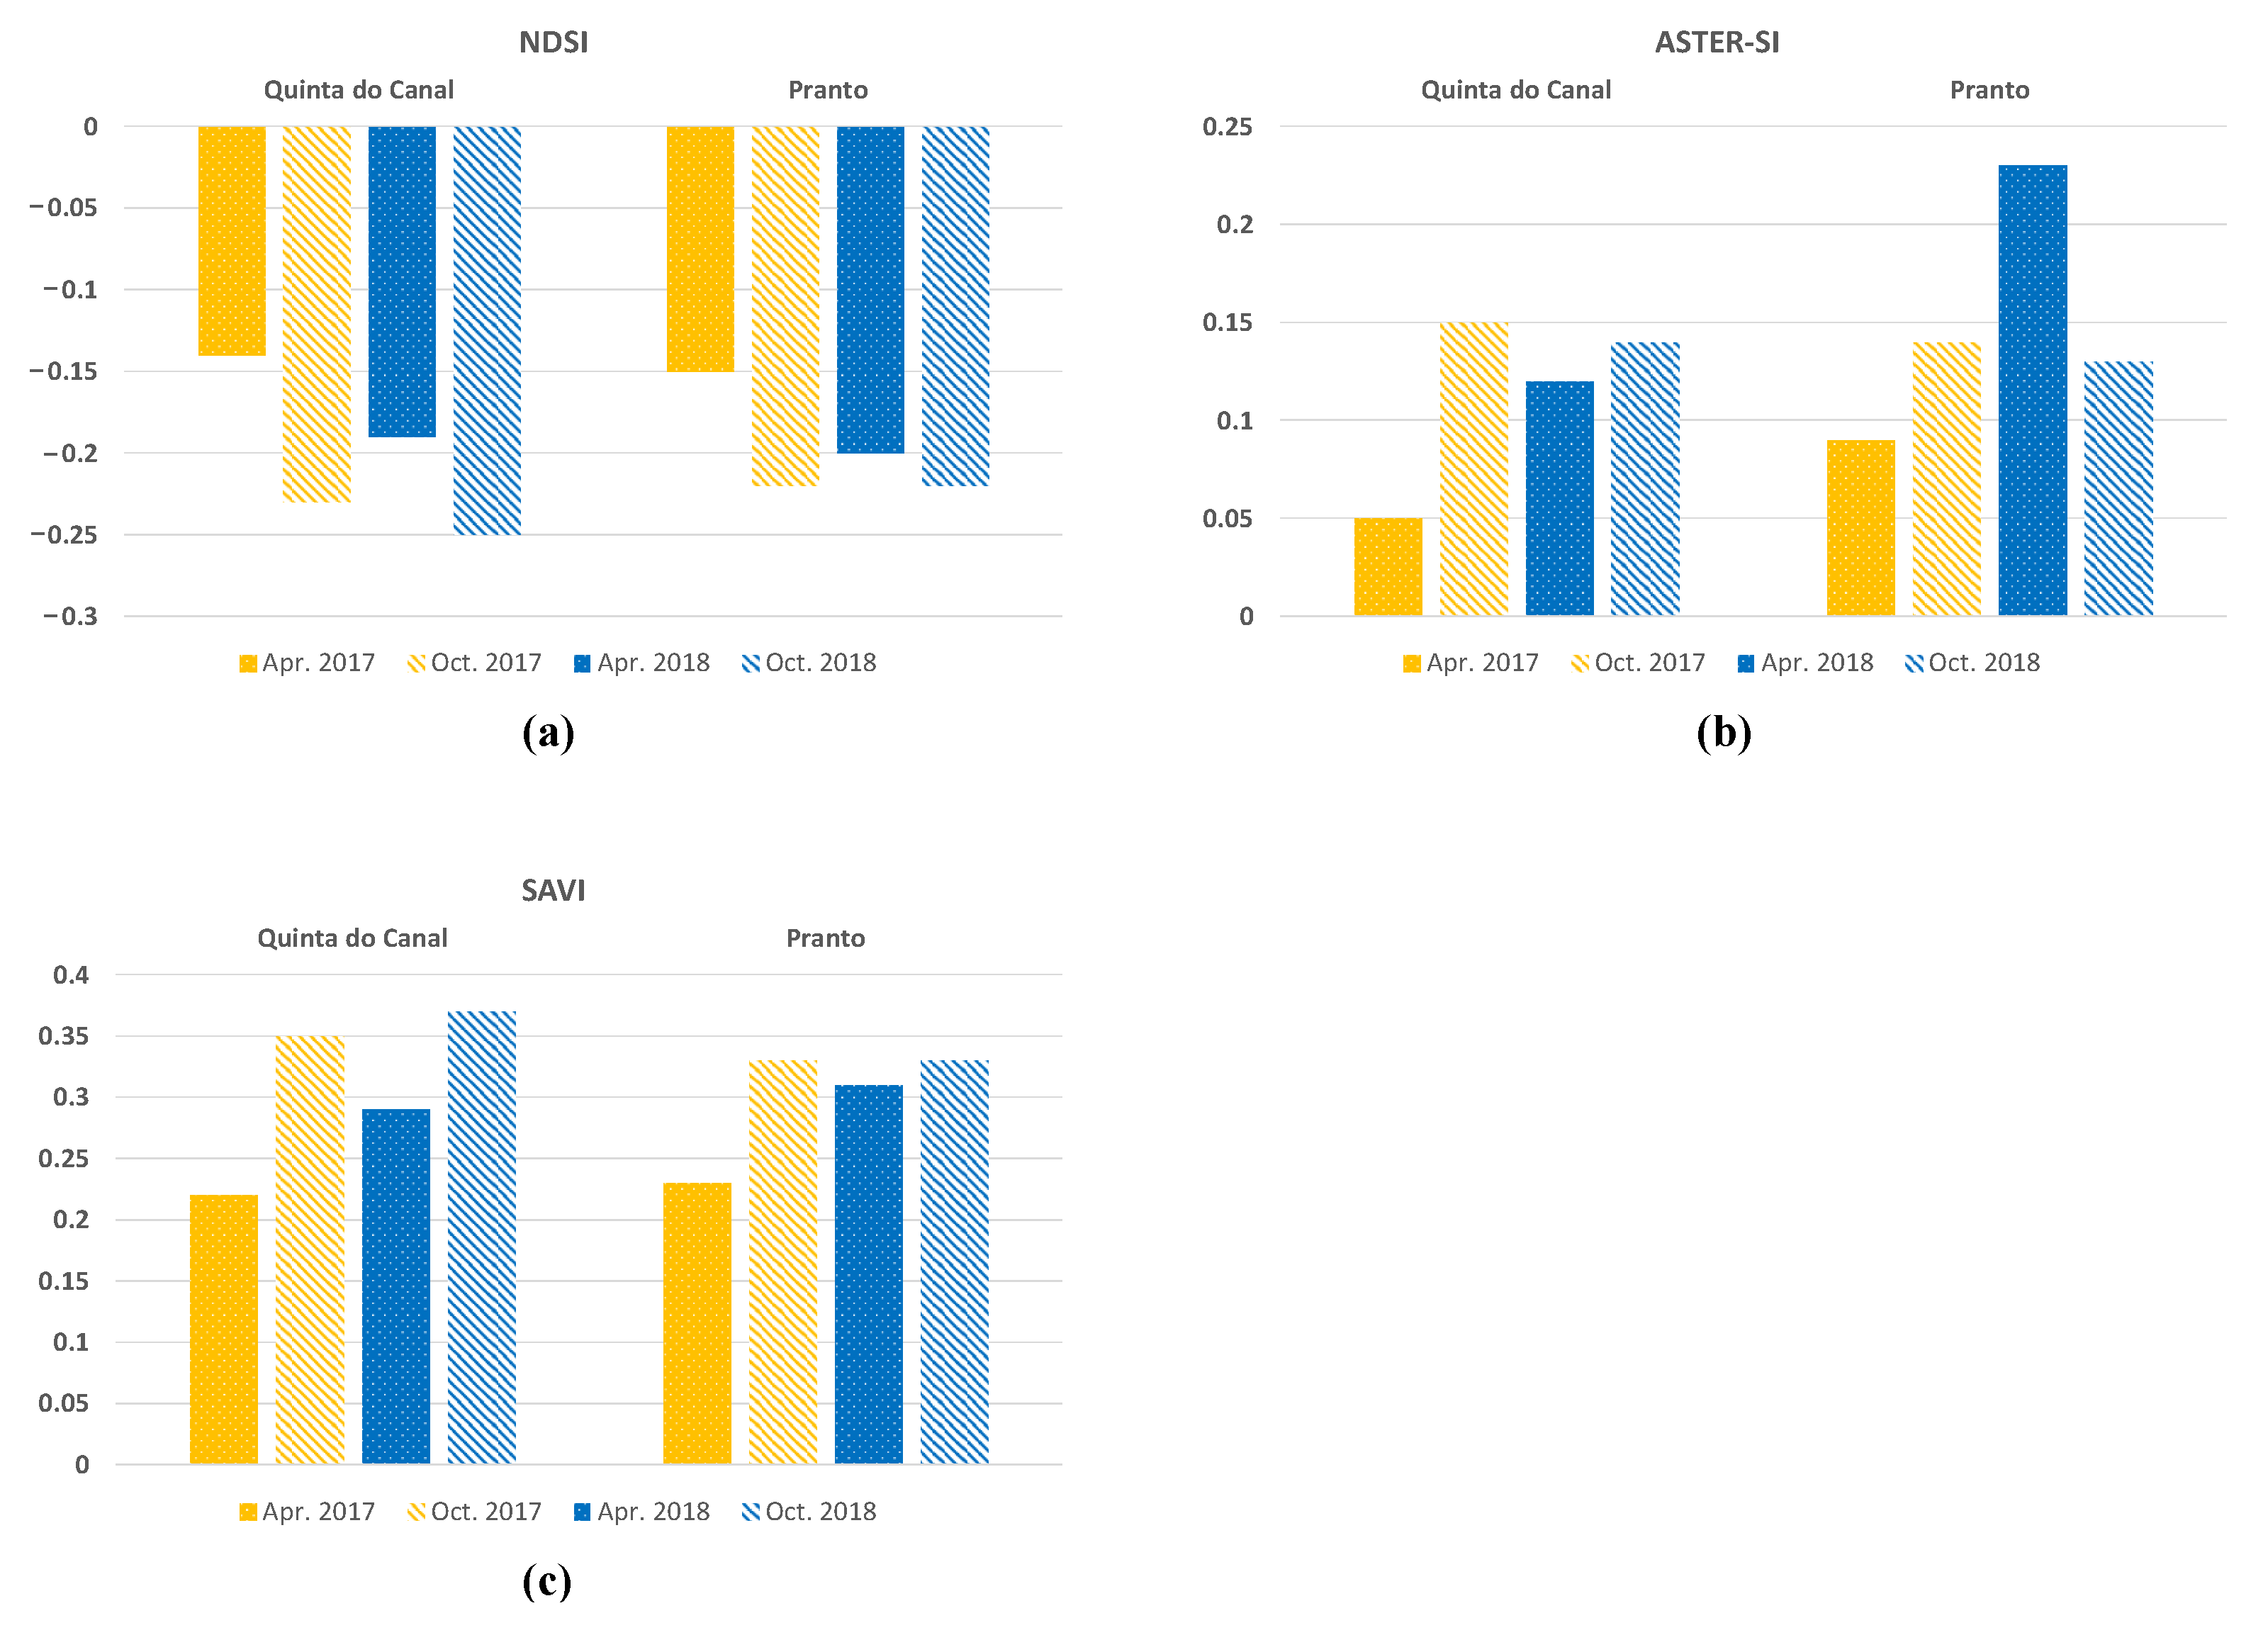
3.2. Soil Salinity Assessed from Sentinel-2 Satellite Data

Salinity indices maps of the topsoil were also generated by analyzing Sentinel-2 satellite imagery for the two years studied, 2017 and 2018 (Figure 4, Figure 5 and Figure 6). These maps portray a better knowledge of the spatial distribution of the soil conditions in the study areas, before and after the 2017 and 2018 rice crop seasons, and of the soil salinity dynamics.
The NDSI maps (Figure 4) show that the rice fields’ NDSI pixel values are between −0.1 and −0.5. At a glance, these maps reveal a decrease in this salinity index, across the 2017 and 2018 rice cultivation season, at both fields’ plots. Thus, it indicates an overall reduction of the topsoil salinity in the rice fields at the end of the crop season, in relation to the beginning of the season (Table 6), which suggests an active role of the rice crop cultivation/irrigation in the salt leaching of the topsoil.
However, for 2018, the Pranto rice field (Figure 4b (iii) and (iv)) shows only a small reduction in the value of NDSI. This could be partly explained by the weather conditions observed in the beginning of 2018 (above normal precipitation), in concurrence with the fact that both the downstream section of the Pranto River and the Pranto agricultural area are affected by tidal water level variations, due to the proximity to the Atlantic Ocean, which strongly control water inflows and outflows in this area.
Overall, high discharges in the drainage network and high groundwater levels could likely explain a less effective salt leaching than would otherwise be expected from the rice continuous flooding irrigation. However, the fact that the Pranto river scarcely provides water for rice irrigation forces water circulation in the existing open ditches that serve both irrigation and drainage purposes, aiming at the re-use of water, which deteriorates the quality of the water available for irrigation and thereby intensifies the risk of increasing salt concentration in this area. However, data on irrigation water quality are not available, which does not allow us to interpret the results in a more refined way regarding the impact of the poor water quality on the condition of the soil regarding the presence of salts.
The ASTER_SI maps in Figure 5, for the Quinta do Canal and Pranto study plots, reveal spatial variability in soil salinity conditions at the plot scale, which is the largest at the Quinta do Canal plot in 28 April 2017 (Table 6) and with ASTER_SI pixel values varying between 0 and +0.25, considering all the maps. In agreement with the NDSI results, the ASTER_SI reveals an increasing trend, in both years, which indicates also a decrease in topsoil salinity in the study areas, between the time before and after the rice cultivation period. However, the Pranto rice field shows a different behavior in 2018, a deviation that has also been signaled by the NDSI.
In Figure 5b (iii) and (iv), analysis of the ASTER_SI shows even an increase in the topsoil salinity in the Pranto field that is expectedly related to previous flood events triggered by high precipitation during March and April, which was discussed earlier. High runoff that usually inundates the agricultural fields and poor field drainage could be partly held responsible for the presence of a persistently shallow salty water table and could therefore explain the slow start and development of the rice crop in this area, in 2018 (Figure 3b). This different behaviour revealed by the ASTER_SI in relation to NDSI and SAVI (discussed below) could be explained by the higher sensitivity to soil salinity variations of the SWIR bands that are applied in calculating ASTER_SI, as shown in previous studies—e.g., [68]. The NDSI, ASTER_SI and SAVI results also show that the soil salinity condition of the Quinta do Canal were aggravated during the 2017/2018 rainy season. For the Pranto field, NDSI and SAVI reveal also a slight salinity increase, whereas ASTER_SI suggests a decrease in the topsoil salinity level during the wet season. There are no data available on water management practices in these plots outside the rice cultivation season that could assist in interpreting results.
Figure 6 shows the spatial distribution of the SAVI pixel values for the Quinta do Canal and Pranto areas, which are between 0 and +0.7, among the four images. Although SAVI is not a direct salinity index, it uses the Red and NIR bands, which are the most sensitive to the soil’s ions that cause salinity—e.g., [66]. Thus, since this index is calculated here for bare topsoil, it is expected that an increase in this index traduces also a reduction of soil salinity, similarly to NDSI. Once more, and in agreement with the previous results, this index signals that at both sites the salinity of the soil surface was higher at the beginning of the 2018 rice cultivation season than in 2017. Similar to NDSI, SAVI indicates that the salinity conditions were about the same at the end of the 2018 season as in the beginning of that season. ASTER_SI was the only index that suggested that the salinity conditions could have even been aggravated during the 2018 season, which was already discussed.
Figure 7 shows, at the plot scale, the average values of the salinity indices obtained for both rice crop fields, for 2017 and 2018, before and after the rice crop season. The corresponding selected dates are presented in Table 4. For Quinta do Canal, results suggest a decreasing trend in the topsoil salinity as a result of the rice cultivation and (flooding) irrigation period. However, a more modest decrease is found for the Pranto rice field, before and after the cultivation season, and there is also a smaller season-reduction in the topsoil salinity in comparison to the Quinta do Canal rice field. For 2018, comparison of the ASTER_SI values obtained for the Pranto plot before and after the rice cultivation season even suggests that there could have been an increase in soil surface salinity during that period (Figure 7b).
The mean and the coefficient of variation (CV, in %) of the pixels’ salinity indices are presented in Table 6, for the selected dates (Table 4). Lower CV values of the salinity indices could indicate smaller micro relief and topography effects at the plot scale, and vice versa. However, whereas the values of the CV’s obtained for NDSI and SAVI are very similar, which could be founded on the fact that both indices use the Red and NIR bands, for ASTER_SI (calculated from SWIR bands) the CV values are much smaller. Nevertheless, the trend pattern is consistent between all indices. The only strong deviation is for the Quinta do Canal plot at the beginning of the 2017 season, with ASTER_SI displaying a much larger CV than for the other calculations involving the same index. In addition, overall, the CV’s are higher for the field plot of Quinta do Canal than for the Pranto field plot, which indicates stronger spatial variability (see Figure 4, Figure 5 and Figure 6). Moreover, results show that, for all cases, the spatial variation in soil surface salinity revealed by the SI’s diminishes after the rice growing seasons.
Thus, in general, the results obtained for the satellite-based salinity indices NDSI, ASTER_SI and SAVI revealed that they have the potential to respond to variations in soil conditions, allowing us to discriminate between different soil salinity conditions in rice cultivated areas, even in areas without severe soil salinity problems. This behavior was particularly revealed by ASTER_SI, the only index that uses SWIR bands, among the indices investigated. This attribute justifies that this index reveals a sharper response to soil surface salinity, in relation to the other indices, as demonstrated by Bannari et al. (2008, 2016) [34,68] for other land and agricultural conditions.

3.3. Soil Salinity and Rice Cultivation Outcomes

In this study, and due to lack of data on rice yields, the predictive rice production model in Equation (1) was adopted for exploring the effect of soil salinity in reducing rice yields at the study sites. For this purpose, the relevant NDVI values were estimated from the available Sentinel-2 imagery and are presented in Table 7. According to the model, in 2017 the estimated rice yield (Table 7) was higher for the Pranto field plot than for the Quinta do Canal field plot (≈8% higher), whereas the opposite was predicted for 2018 (≈23% lower). Between 2017 and 2018, the estimated rice yield decrease was ≈4% for the Quinta do Canal field plot and ≈31% for the Pranto field plot, according to the model. Differences in yield could be expected from the different maximum values of NDVI attained in each of these years and plots (Table 5), but because this index tends to saturate, the NDVImax is not a good yield indicator. On the other hand, possible circumstantial multispectral signal variations on a specific date could mask reflectance by the rice plants and introduce an unquantifiable bias in the yield estimation when using the model in Equation (1). It is thus important to investigate these effects further and to use this type of model cautiously.
However, the main goal of applying a rice yield predictive model in this study was to highlight the impact that salinity can have on rice yield. With that in mind, and revisiting the calculated SI values, ASTER_SI indicated that the worse salinity condition of the soil surface was for the Pranto plot in 2018, which suggests that salinity might have negatively affected the rice growth and development in that plot (see the VI’s profiles in Figure 3), and therefore very likely also the yield, as predicted by the model (Table 7). Records show that due to Pranto river high discharges in the 2018 Spring, caused by excess rainfall, and the deficient drainage, the study area was affected by persistent inundation of the fields. The poor quality of the water and the season typical high temperature might have contributed to the higher soil surface salinity in the Pranto plot, in the beginning of the 2018 cultivation period.
According to the SI’s, the soil surface salinity found for the Quinta do Canal plot is also higher in the beginning of the cultivation season in 2018 than in 2017, and again the estimated relevant NDVI and yield is lower in 2018. However, the difference in salinity, and its level, is much less pronounced for Quinta do Canal than for the Pranto plot.
This application of a predictive rice production model is exploratory but further shows the potential usefulness of the Sentinel-2 data for agriculture. Local data would allow us to develop a VI remote sensing-based predictive production model validated for the local conditions, which could nevertheless involve NDVI or another (more suitable) VI. Further steps are being taken towards this goal, which also involves ground truth measurements.

3.4. Research Limitations and Development Perspectives

Recent advances in remote sensing introduced by the use of new satellites, such as Sentinel-2, have opened the way to applying new techniques for characterizing and monitoring soils and the vegetation cover. In particular, these new techniques can be applied to study soil salinity and its impact on crop production, with soil salinity being an important environmental risk hazard that can occur by natural or human-induced processes, namely in agricultural areas. In general, there is a lack of data on soil salinity, which strongly hampers identifying problem areas and defining suitable soil and agronomic management practices. Such data have been so far obtained relying on conventional monitoring approaches, which are time-consuming and costly, so resources are seldom allocated to this end.
This study shows that innovative multispectral-based products obtained from Sentinel-2 satellite imagery offer a cost effective and reliable way to obtain space-time data on soil salinity at an unprecedented high spatial and temporal resolution, and over large areas. By providing nearly real-time information, remote sensing Sentinel-2 products are time-efficient and easily accessible tools that can help local farmers or farm managers and environmental agencies to assess and monitor soil salinity across large spatial scales and time frames and better understand its dynamics, for example, in rice crop cultivation areas, which was the focus in this study.
These innovative observational tools have a broader applicability in agriculture. However, definitions of monitoring protocols and best practices are still missing, which need to be developed and adapted to the different environments and types of vegetation cover. Future work will be dedicated to characterizing soil surface salinity based on proximal observations and ground sampling, which will allow us to clarify the relationships between the satellite data and multispectral-based indicators from data on the ground truth.

4. Conclusions

Main results of this study on soil salinity assessment in irrigated rice fields show that:
(i)
The satellite-based salinity indices explored (NDSI, ASTER_SI and SAVI) are sensitive to variations in soil conditions, allowing us to discriminate between different soil salinity conditions in rice cultivated areas, even in areas without severe soil salinity problems. This behavior was particularly revealed by ASTER_SI, the only index that uses SWIR bands, among the indices investigated. This index seems to have a sharper response to soil surface salinity, in relation to those other indices;
(ii)
The increased capability of the Sentinel-2 satellite imagery in giving detailed information at the plot scale about the salinity status of soils and status of the vegetation cover is a valuable asset in environmental monitoring and agriculture, and for mapping soil salinity in rice cultivation areas affected by salinity issues;
(iii)
The ability of Sentinel-2 satellite imagery-based indices to capture rice crop and soil conditions at relevant spatial scales, and the frequent satellite’s revisit times, allows us to appraise rice crop growth at the plot scale and estimate crop yields in salinity affected areas;
(iv)
The suitability of VI’s and SI’s need to be determined on a case-to-case basis, in order to reduce the uncertainty in studying the impact of salinity on rice plant canopies, rice crop evolution during the cultivation period and rice yields;
(v)
The remote sensing approach explored in this study on soil salinity assessment offers a valuable tool for undertaking more such studies spatially and temporally and, thus, intensifying the inventorying of spatial extent of such degradation in irrigated agricultural areas of Portugal and other regions where this problem is a potential environmental risk hazard and less reported.

Author Contributions

Both authors contributed equally to the study conception and design, material preparation, data collection, data analysis and writing of the manuscript. All authors have read and agreed to the published version of the manuscript.

Funding

The research described in this paper was supported by Fundação para a Ciência e a Tecnologia (FCT), grant PRIMA/0006/2018 (project MEDWATERICE: Towards a sustainable water use in Mediterranean rice-based agro-ecosystems), with the support of PRIMA Programme (PRIMA-Section-2018; Topic: 1.1.3: Irrigation technologies and practices).

Institutional Review Board Statement

Not applicable.

Data Availability Statement

The Sentinel-2 data are available via the Copernicus Open Access Hub (https://scihub.copernicus.eu/, accessed on 6 November 2021).

Conflicts of Interest

The authors declare no conflict of interest.

References

  1. Asfaw, E.; Suryabhagavan, K.V.; Argaw, M. Soil salinity modeling and mapping using remote sensing and GIS: The case of Wonji sugar cane irrigation farm. Ethiopia. J. Saudi Soc. Agric. Sci. 2018, 17, 250–258. [Google Scholar] [CrossRef]
  2. Gorji, T.; Sertel, E.; Tanik, A. Monitoring soil salinity via remote sensing technology under data scarce conditions: A case study from Turkey. Ecol. Indic. 2017, 74, 384–391. [Google Scholar] [CrossRef]
  3. Elnaggar, A.A.; Noller, J.S. Application of remote-sensing data and decision-tree analysis to mapping salt-affected soils over large areas. Remote Sens. 2010, 2, 151–165. [Google Scholar] [CrossRef]
  4. Akramkhanov, A.; Martius, C.; Park, S.; Hendrickx, J. Environmental factors of spatial distribution of soil salinity on flat irrigated terrain. Geoderma 2011, 163, 55–62. [Google Scholar] [CrossRef]
  5. Scudiero, E.; Skaggs, T.H.; Corwin, D.L. Regional scale soil salinity evaluation using Landsat 7, western San Joaquin Valley, California, USA. Geoderma Reg. 2014, 2–3, 82–90. [Google Scholar] [CrossRef]
  6. Vermeulen, D.; Niekerk, A.V. Machine learning performance for predicting soil salinity using different combinations of geomorphometric covariates. Geoderma 2017, 299, 1–12. [Google Scholar] [CrossRef]
  7. Metternicht, G.I.; Zinck, J.A. Remote sensing of soil salinity: Potentials and constraints. Remote Sens. Environ. 2003, 85, 1–20. [Google Scholar] [CrossRef]
  8. Masoud, A.A.; Koike, K. Arid land salinization detected by remotely-sensed land cover changes: A case study in the Siwa region, NW Egypt. J. Arid Environ. 2006, 66, 151–167. [Google Scholar] [CrossRef]
  9. Gorji, T.; Tanik, A.; Sertel, E. Soil salinity prediction, monitoring and mapping using modern technologies. Procedia Earth Planet. Sci. 2015, 15, 507–512. [Google Scholar] [CrossRef]
  10. Corwin, D.L.; Scudiero, E. Review of soil salinity assessment for agriculture across multiple scales using proximal and/or remote sensors. In Advances in Agronomy; Sparks, D.A., Ed.; Elsevier: Amsterdam, The Netherlands, 2019; Volume 158, 130p. [Google Scholar] [CrossRef] [Green Version]
  11. Gopalakrishnan, T.; Kumar, L. Linking long-term changes in soil salinity to paddy land abandonment in Jaffna Peninsula, Sri Lanka. Agriculture 2021, 11, 211. [Google Scholar] [CrossRef]
  12. Zhu, K.; Sun, Z.; Zhao, F.; Yang, T.; Tian, Z.; Lai, J.; Zhu, W.; Long, B. Relating hyperspectral vegetation indices with soil salinity at different depths for the diagnosis of winter wheat salt stress. Remote Sens. 2021, 13, 250. [Google Scholar] [CrossRef]
  13. Lambert, J.J.; Southard, R.J. Distribution of Saline and Alkaline Soils in the San Joaquin Valley: A Map of Valley Soils; University of California Division of Agriculture and Natural Resources: Oakland, CA, USA, 1992. [Google Scholar]
  14. Letey, J. Soil salinity poses challenges for sustainable agriculture and wildlife. Calif. Agric. 2000, 54, 43–48. [Google Scholar] [CrossRef]
  15. Welle, P.D.; Mauter, M.S. High-resolution model for estimating the economic and policy implications of agricultural soil salinization in California. Environ. Res. Lett. 2017, 12, 094010. [Google Scholar] [CrossRef]
  16. Allbed, A.; Kumar, L. Soil salinity mapping and monitoring in arid and semi-arid regions using remote sensing technology: A review. Adv. Remote Sens. 2013, 2, 373–385. [Google Scholar] [CrossRef]
  17. Garcia, L.; Eldeiry, A.; Elhaddad, A. Estimating soil salinity using remote sensing data. In Proceedings of the 2005 Central Plains Irrigation Conference, Sterling, CO, USA, 16–17 February 2005; pp. 1–10. [Google Scholar]
  18. Morshed, M.M.; Islam, M.T.; Jamil, R. Soil salinity detection from satellite image analysis: An integrated approach of salinity indices and field data. Environ. Monit. Assess. 2016, 188, 119. [Google Scholar] [CrossRef] [PubMed]
  19. Taghadosi, M.M.; Hasanlou, M.; Eftekhari, K. Soil salinity mapping using dual-polarized SAR Sentinel-1 imagery. Int. J. Remote Sens. 2018, 40, 237–252. [Google Scholar] [CrossRef]
  20. European Space Agency (ESA). Scihub. 2021. Available online: https://scihub.copernicus.eu/dhus/#/home (accessed on 6 November 2021).
  21. Taghadosi, M.M.; Hasanlou, M.; Eftekhari, K. Retrieval of soil salinity from Sentinel-2 multispectral imagery. Eur. J. Remote Sens. 2019, 52, 138–154. [Google Scholar] [CrossRef]
  22. Ramos, T.B.; Castanheira, N.; Oliveira, A.R.; Paz, A.M.; Darouich, H.; Simionesei, L.; Farzamian, M.; Gonçalves, M.C. Soil salinity assessment using vegetation indices derived from Sentinel-2 multispectral data. Application to Lezíria Grande, Portugal. Agric. Water Manag. 2020, 241, 106387. [Google Scholar] [CrossRef]
  23. Elhag, M. Evaluation of different soil salinity mapping using remote sensing techniques in arid ecosystems, Saudi Arabia. J. Sens. 2016, 2016, e7596175. [Google Scholar] [CrossRef] [Green Version]
  24. Alexakis, D.D.; Daliakopoulos, I.N.; Panagea, I.S.; Tsanis, I.K. Assessing soil salinity using WorldView-2 multispectral images in Timpaki, Crete, Greece. Geocarto Int. 2018, 33, 321–338. [Google Scholar] [CrossRef]
  25. Rafik, A.; Ibouh, H.; Fels, A.E.A.E.; Eddahby, L.; Mezzane, D.; Bousfoul, M.; Amazirh, A.; Ouhamdouch, S.; Bahir, M.; Gourfi, A.; et al. Soil salinity detection and mapping in an environment under water stress between 1984 and 2018 (Case of the largest oasis in Africa-Morocco). Remote Sens. 2022, 14, 1606. [Google Scholar] [CrossRef]
  26. Madani, A.A. Soil salinity detection and monitoring using Landsat data: A case study from Siwa Oasis, Egypt. GISci. Remote Sens. 2005, 42, 171–181. [Google Scholar] [CrossRef]
  27. Wu, W.; Mhaimeed, A.S.; Al-Shafie, W.M.; Ziadat, F.; Dhehibi, B.; Nangia, V.; De Pauw, E. Mapping soil salinity changes using remote sensing in Central Iraq. Geoderma Reg. 2014, 2, 21–31. [Google Scholar] [CrossRef]
  28. Vermeulen, D.; Niekerk, A.V. Evaluation of a WorldView-2 image for soil salinity monitoring in a moderately affected irrigated area. J. Appl. Remote Sens. 2016, 10, 026025. [Google Scholar] [CrossRef]
  29. Lobell, D.B.; Lesch, S.M.; Corwin, D.L.; Ulmer, M.G.; Anderson, K.A.; Potts, D.J.; Doolittle, J.A.; Matos, M.R.; Baltes, M.J. Regional-scale assessment of soil salinity in the Red River Valley using multi-year MODIS EVI and NDVI. J. Environ. Qual. 2010, 39, 35–41. [Google Scholar] [CrossRef] [PubMed]
  30. Platonov, A.; Noble, A.; Kuziev, R. Soil salinity mapping using multi-temporal satellite images in agricultural fields of Syrdarya Province of Uzbekistan. In Developments in Soil Salinity Assessment and Reclamation: Innovative Thinking and Use of Marginal Soil and Water Resources in Irrigated Agriculture; Shahid, S.A., Abdelfattah, M.A., Taha, F.K., Eds.; Springer: Dordrecht, The Netherlands, 2013; pp. 87–98. [Google Scholar] [CrossRef]
  31. Scudiero, E.; Skaggs, T.H.; Corwin, D.L. Regional-scale soil salinity assessment using Landsat ETM + canopy reflectance. Remote Sens. Environ. 2015, 169, 335–343. [Google Scholar] [CrossRef]
  32. Bannari, A.; El-Battay, A.; Bannari, R.; Rhinane, H. Sentinel-MSI VNIR and SWIR bands sensitivity analysis for soil salinity discrimination in an arid landscape. Remote Sens. 2018, 10, 855. [Google Scholar] [CrossRef]
  33. Al-Gaadi, K.A.; Tola, E.; Madugundu, R.; Fulleros, R.B. Sentinel-2 images for effective mapping of soil salinity in agricultural fields. Curr. Sci. 2021, 121, 384–390. [Google Scholar] [CrossRef]
  34. Bannari, A.; Guedon, A.M.; El-Harti, A.; Cherkaoui, F.Z.; El-Ghmari, A. Characterization of slightly and moderately saline and sodic soils in irrigated agricultural land using simulated data of advanced land imaging (EO-1) sensor. Commun. Soil Sci. Plant Anal. 2008, 39, 2795–2811. [Google Scholar] [CrossRef]
  35. INE. Main Crops Yield (kg/ha) by Geographic Localization (Agrarian Region) and Specie; Annual; Instituto Nacional de Estatística, I.P.: Lisboa, Portugal, 2019; Available online: http://www.ine.pt (accessed on 5 July 2021).
  36. USDA. Portuguese Rice Imports Pick up as Production Declines; USDA Gain Report; United States Department of Agriculture: Washington, DC, USA, 2017; p. 13.
  37. Cunha, P.P.; Campar, A.; Ramos, A.; Cunha, L.; Dinis, J. Geomorphology and coastal dynamics of the Figueira da Foz region. In Proceedings of the Sixth International Conference on Geomorphology, Zaragoza, Spain, 7–11 September 2005; Available online: http://hdl.handle.net/10316/15165 (accessed on 31 August 2022).
  38. Castro, P.; Freitas, H. Fungal biomass and decomposition of Spartina maritima leaves in the Mondego salt marsh (Portugal). Hydrobiologia 2000, 428, 171–177. [Google Scholar] [CrossRef]
  39. Gonçalves, M.C.; Martins, J.C.; Ramos, T.B. A salinização do solo em Portugal. Causas, extensão e soluções. Rev. Ciênc. Agrár. 2015, 38, 574–586. [Google Scholar] [CrossRef]
  40. Rodrigues, E.T.; Alpendurada, M.F.; Ramos, F.; Pardal, M.A. Environmental and human health risk indicators for agricultural pesticides in estuaries. Ecotoxicol. Environ. Saf. 2018, 150, 224–231. [Google Scholar] [CrossRef] [PubMed]
  41. IPMA. Boletins Climatológicos. 2022. Available online: https://www.ipma.pt/pt/publicacoes/boletins.jsp?cmbDep=cli&cmbTema=pcl&idDep=cli&idTema=pcl&curAno=-1 (accessed on 1 July 2022).
  42. IPMA. Normais. Ficha Climatológica. 2022. Available online: https://www.ipma.pt/bin/file.data/climate-normal/cn_71-00_MONTE_REAL_BASE_AEREA.pdf (accessed on 1 July 2022).
  43. Allbed, A.; Kumar, L.; Aldakheel, Y.Y. Assessing soil salinity using soil salinity and vegetation indices derived from IKONOS high-spatial resolution imageries: Applications in a date palm dominated region. Geoderma 2014, 230, 1–8. [Google Scholar] [CrossRef]
  44. Laiskhanov, S.U.; Otarov, A.; Savin, I.Y.; Tanirbergenov, S.I.; Mamutov, Z.U.; Duisekov, S.N.; Zhogolev, A. Dynamics of soil salinity in irrigation areas in South Kazakhstan. Pol. J. Environ. Stud. 2016, 25, 2469–2475. [Google Scholar] [CrossRef]
  45. Elhag, M.; Bahrawi, J.A. Soil salinity mapping and hydrological drought indices assessment in arid environments based on remote sensing techniques. Geosci. Instrum. Methods Data Syst. 2017, 6, 149–158. [Google Scholar] [CrossRef]
  46. Nguyen, K.A.; Liou, Y.A.; Tran, H.P.; Hoang, P.P.; Nguyen, T.H. Soil salinity assessment by using near-infrared channel and Vegetation Soil Salinity Index derived from Landsat 8 OLI data: A case study in the Tra Vinh Province, Mekong Delta, Vietnam. Prog. Earth Planet. Sci. 2020, 7, 1. [Google Scholar] [CrossRef]
  47. Rouse, J.W., Jr.; Haas, R.H.; Schell, J.A.; Deering, D.W.; Harlan, J.C. Monitoring the Vernal Advancement and Retrogradation (Green Wave Effect) of Natural Vegetation; NASA/GSFCT Type III Final Report 1; Remote Sensing Center, Texas A&M University: College Station, TX, USA, 1974. [Google Scholar]
  48. Gitelson, A.A.; Merzlyak, M.N. Spectral reflectance changes associated with autumn senescence of Aesculus hippocastanum L. and Acer platanoides L. leaves. Spectral features and relation to chlorophyll estimation. J. Plant Physiol. 1994, 143, 286–292. [Google Scholar] [CrossRef]
  49. Gitelson, A.A.; Merzlyak, M.N. Signature analysis of leaf reflectance spectra: Algorithm development for remote sensing of chlorophyll. J. Plant Physiol. 1996, 148, 494–500. [Google Scholar] [CrossRef]
  50. Gitelson, A.A.; Kaufman, Y.J.; Merzlyak, M.N. Use of a green channel in remote sensing of global vegetation from EOS-MODIS. Remote Sens. Environ. 1996, 58, 289–298. [Google Scholar] [CrossRef]
  51. Wu, W. The Generalized Difference Vegetation Index (GDVI) for land characterization. In Proceedings of the 8th ISSC (International Soil Sciences Congress), Izmir, Turkey, 15–17 May 2012. [Google Scholar]
  52. Huete, A.R. A Soil-Adjusted Vegetation Index (SAVI). Remote Sens. Environ. 1988, 25, 295–309. [Google Scholar] [CrossRef]
  53. Khan, N.M.; Guevara, V.V.; Vato, V.; Vhiozawa, S. Assessment of hydrosaline land degradation by using a simple approach of remote sensing indicators. Agric. Water Manag. 2005, 77, 96–109. [Google Scholar] [CrossRef]
  54. Chen, D.; Huang, J.; Jackson, T.J. Vegetation water content estimation for corn and soybeans using spectral indices derived from MODIS near- and short-wave infrared bands. Remote Sens. Environ. 2005, 98, 225–236. [Google Scholar] [CrossRef]
  55. de Lima, I.P.; Jorge, R.G.; de Lima, J.L.M.P. Remote sensing monitoring of rice fields: Towards assessing water saving irrigation management practices. Front. Remote Sens. 2021, 2, 762093. [Google Scholar] [CrossRef]
  56. Shabou, M.; Mougenot, B.; Chabaane, Z.; Walter, C.; Boulet, G.; Aissa, N.; Zribi, M. Soil clay content mapping using a time series of Landsat TM Data in semi-arid lands. Remote Sens. 2015, 7, 6059–6078. [Google Scholar] [CrossRef]
  57. Gitelson, A.A.; Merzlyak, M.N. Remote sensing of chlorophyll concentration in higher plant leaves. Adv. Space Res. 1998, 22, 689–692. [Google Scholar] [CrossRef]
  58. Candiago, S.; Remondino, F.; De Giglio, M.; Dubbini, M.; Gattelli, M. Evaluating multispectral images and vegetation indices for precision farming applications from UAV images. Remote Sens. 2015, 7, 4026–4047. [Google Scholar] [CrossRef]
  59. Shanahan, J.F.; Holland, K.H.; Schepers, J.S.; Francis, D.D.; Schlemmer, M.R.; Caldwell, R. Use of a crop canopy reflectance sensor to assess corn leaf chlorophyll content. ASA Spec. Publ. 2003, 66, 135–150. [Google Scholar] [CrossRef]
  60. Ge, Y.; Atefi, A.; Zhang, H.; Miao, C.; Ramamurthy, R.K.; Sigmon, B.; Yang, J.; Schnable, J.C. High-throughput analysis of leaf physiological and chemical traits with VIS–NIR–SWIR spectroscopy: A case study with a maize diversity panel. Plant Methods 2019, 15, 66. [Google Scholar] [CrossRef] [PubMed] [Green Version]
  61. Fertu, C.; Dobrota, L.M.; Balasan, D.L.; Stanciu, S. Monitoring the vegetation of agricultural crops using drones and remote sensing-comparative presentation. Sci. Pap. Manag. Econ. Eng. Agric. Rural. Dev. 2021, 21, 249–254. [Google Scholar]
  62. Wu, W.; Zucca, C.; Dessena, L.; Mulas, M. Using SPOT imagery to assess the effectiveness of combating desertification in Marrakech, Morocco. In Proceedings of the Second International Conference on Agro-Geoinformatics (Agro-Geoinformatics), Fairfax, VA, USA, 12–16 August 2013. [Google Scholar] [CrossRef]
  63. Taghadosi, M.M.; Hasanlou, M. Trend analysis of soil salinity in different land cover types using Landsat time series data (case study Bakhtegan Salt Lake). Int. Arch. Photogramm. Remote Sens. Spatial Inf. Sci. 2017, XLII-4/W4, 251–257. [Google Scholar] [CrossRef]
  64. Nouri, H.; Borujeni, S.C.; Alaghmand, S.; Anderson, S.J.; Sutton, P.C.; Parvazian, S.; Beecham, S. Soil salinity mapping of urban greenery using remote sensing and proximal sensing techniques; the case of Veale Gardens within the Adelaide Parklands. Sustainability 2018, 10, 2826. [Google Scholar] [CrossRef]
  65. Konukcu, F.; Gowing, J.W.; Rose, D.A. Dry drainage: A sustainable solution to waterlogging and salinity problems in irrigation areas? Agric. Water Manag. 2006, 83, 1–12. [Google Scholar] [CrossRef]
  66. Rengasamy, P.; Chittleborough, D.; Helyar, K. Root-zone constraints and plant-based solutions for dryland salinity. Plant Soil 2003, 257, 249–260. [Google Scholar] [CrossRef]
  67. Abuelgasim, A.; Ammad, R. Mapping soil salinity in arid and semi-arid regions using Landsat 8 OLI satellite data. Remote Sens. Appl. Soc. Environ. 2019, 13, 415–425. [Google Scholar] [CrossRef]
  68. Bannari, A.; Guédon, A.M.; El-Ghmari, A. Mapping slight and moderate saline soils in irrigated agricultural land using advanced land imager sensor (EO-1) data and semi-empirical models. Commun. Soil Sci. Plant Anal. 2016, 47, 1883–1906. [Google Scholar] [CrossRef]
  69. Maas, E.V.; Hoffman, G.J. Crop salt tolerance—Current assessment. J. Irrig. Drain. Eng. 1977, 103, 114–134. [Google Scholar] [CrossRef]
  70. Flowers, T.J.; Yeo, A.R. Variability in the resistance of sodium-chloride salinity within rice (Oryza Sativa L.) varieties. New Phytol. 2004, 88, 363–373. [Google Scholar] [CrossRef]
  71. Reddy, I.N.B.L.; Kim, B.-K.; Yoon, I.-S.; Kim, K.-H.; Kwon, T.-R. Salt tolerance in rice: Focus on mechanisms and approaches. Rice Sci. 2017, 24, 123–144. [Google Scholar] [CrossRef]
  72. Ghosh, B.; Ali, M.D.N.; Gantait, S. Response of rice under salinity stress: A review update. J. Res. Rice 2016, 4, 167. [Google Scholar] [CrossRef]
  73. Mendes, J.; Ruela, R.; Picado, A.; Pinheiro, J.P.; Ribeiro, A.S.; Pereira, H.; Dias, J.M. Modeling dynamic processes of Mondego Estuary and Óbidos Lagoon using Delft3D. J. Mar. Sci. Eng. 2021, 9, 91. [Google Scholar] [CrossRef]
  74. Lopes, C.L.; Sousa, M.C.; Ribeiro, A.; Pereira, H.; Pinheiro, J.P.; Vaz, L.; Dias, J.M. Evaluation of future estuarine floods in a sea level rise context. Sci. Rep. 2022, 12, 8083. [Google Scholar] [CrossRef] [PubMed]
  75. Wang, J.; Ding, J.; Yu, D.; Ma, X.; Zhang, Z.; Ge, X.; Teng, D.; Li, X.; Liang, J.; Lizaga, I.; et al. Capability of Sentinel-2 MSI data for monitoring and mapping of soil salinity in dry and wet seasons in the Ebinur Lake region, Xinjiang, China. Geoderma 2019, 353, 172–187. [Google Scholar] [CrossRef]
  76. Wang, J.; Ding, J.; Yu, D.; Teng, D.; He, B.; Chen, X.; Ge, X.; Zhang, Z.; Wang, L.; Yang, X.; et al. Machine learning-based detection of soil salinity in an arid desert region, Northwest China: A comparison between Landsat-8 OLI and Sentinel-2 MSI. Sci. Total Environ. 2020, 707, 136092. [Google Scholar] [CrossRef] [PubMed]
  77. Ma, G.; Ding, J.; Han, L.; Zhang, Z.; Ran, S. Digital mapping of soil salinization based on Sentinel-1 and Sentinel-2 data combined with machine learning algorithms. Reg. Sustain. 2021, 2, 177–188. [Google Scholar] [CrossRef]
  78. Davis, E.; Wang, C.; Dow, K. Comparing Sentinel-2 MSI and Landsat 8 OLI in soil salinity detection: A case study of agricultural lands in coastal North Carolina. Int. J. Remote Sens. 2019, 40, 6134–6153. [Google Scholar] [CrossRef]
  79. Moussa, I.; Walter, C.; Michot, D.; Boukary, I.A.; Nicolas, H.; Pichelin, P.; Guéro, Y. Soil Salinity assessment in irrigated paddy fields of the niger valley using a four-year time series of sentinel-2 satellite images. Remote Sens. 2020, 12, 3399. [Google Scholar] [CrossRef]
  80. Fiorillo, E.; Di Giuseppe, E.; Fontanelli, G.; Maselli, F. Lowland rice mapping in Sédhiou Region (Senegal) using sentinel 1 and sentinel 2 data and random forest. Remote Sens. 2020, 12, 3403. [Google Scholar] [CrossRef]
  81. Dunand, R.; Saichuk, J. Rice growth and development. In Louisiana Rice Production Handbook; Saichuk, J., Ed.; Louisiana State University Agricultural Center: Baton Rouge LA, USA, 2009. [Google Scholar]
  82. Figueiredo, N.; Merino, R.; Prazeres, A.; Fareleira, P.; Vargues, A.; Carranca, C.; Marques, P.; Pereira, J.; Goufo, P.; Trindade, H.; et al. O Cultivo do Arroz e a Resposta do Agrossistema às Alterações Ambientais de Temperatura e Dióxido de Carbono; Dossiê Técnico; Vida Rural: Madrid, Spain, 2013; pp. 28–31. Available online: http://hdl.handle.net/10400.11/2588 (accessed on 26 July 2022).
  83. Maki, M.; Sritumboon, S.; Srisutham, M.; Yoshida, K.; Homma, K.; Sukchan, S. Impact of changes in the relationship between salinity and soil moisture on remote sensing data usage in northeast Thailand. Hydrol. Res. Lett. 2022, 16, 54–58. [Google Scholar] [CrossRef]
  84. Li, Z.; Li, Y.; Xing, A.; Zhuo, Z.; Zhang, S.; Zhang, Y.; Huang, Y. Spatial prediction of soil salinity in a semiarid oasis: Environmental sensitive variable selection and model comparison. Chin. Geogr. Sci. 2019, 29, 784–797. [Google Scholar] [CrossRef]
  85. Clermont-Dauphina, C.; Suwannangb, N.; Grunbergerc, O.; Hammeckera, C.; Maeght, J.L. Yield of rice under water and soil salinity risks in farmers’ fields in northeast Thailand. Field Crops Res. 2010, 118, 289–296. [Google Scholar] [CrossRef]
  86. Allbed, A.; Kumar, L.; Sinha, P. Soil salinity and vegetation cover change detection from multi-temporal remotely sensed imagery in Al Hassa Oasis in Saudi Arabia. Geocarto Int. 2018, 33, 830–846. [Google Scholar] [CrossRef]
  87. Chang, K.W.; Shen, Y.; Lo, J.C. Predicting rice yield using canopy reflectance measured at booting stage. Agron. J. 2005, 97, 872–878. [Google Scholar] [CrossRef]
  88. Siyal, A.A.; Dempewolf, J.; Becker-Reshef, I. Rice yield estimation using Landsat ETM plus data. J. Appl. Remote Sens. 2015, 9, 095986. [Google Scholar] [CrossRef]
  89. de Lima, I.; Jorge, R.G.; de Lima, J.L.M.P. Remote sensing based tools to assess risk in rice agriculture. In Geografia, Riscos e Protecção Civil; Nunes, A., Amaro, A., Vieira., A., de Castro, F.V., Félix, F., Eds.; RISCOS—Associação Portuguesa de Riscos, Prevenção e Segurança: Coimbra, Portugal, 2021; Volume 1, pp. 317–326. [Google Scholar] [CrossRef]
Figure 1. Location map of the selected rice field plots inserted in the Lower Mondego Irrigation District (LMID; blue area), in Portugal: (a) Quinta do Canal and (b) Pranto (adapted from Google Earth 2021).
Agriculture 12 01490 g001
Figure 2. Average daily temperature and monthly precipitation in the meteorological station of Monte Real (Leiria, Portugal) for the periods 1971–2000, 2017 and 2018 [41,42].
Agriculture 12 01490 g002
Figure 3. Temporal variation of NDVI, GNDVI and GDVI average values in 2017 and 2018 calculated for the selected irrigated rice field plots at (a) Quinta do Canal (Figure 1a), sowing dates: 128 (2017) and 132 (2018); and (b) Pranto valley (Figure 1b), sowing dates: 132 (2017) and 143 (2018), using available Sentinel-2 satellite imagery.
Agriculture 12 01490 g003
Figure 4. Spatial distribution of NDSI in the selected field plots: (a) Quinta do Canal and (b) Pranto. The samples are from Spring and Autumn of 2017 (top panels) and 2018 (bottom panels), before and after the rice crop cultivation period (left and right panels, respectively).
Agriculture 12 01490 g004
Figure 5. Spatial distribution of ASTER_SI in the selected field plots: (a) Quinta do Canal and (b) Pranto. The samples are from the Spring and Autumn of 2017 (top panels) and 2018 (bottom panels), before and after the rice crop cultivation period.
Agriculture 12 01490 g005
Figure 6. Spatial distribution of SAVI in the selected field plots: (a) Quinta do Canal and (b) Pranto. The samples are from the Spring and Autumn of 2017 (top panels) and 2018 (bottom panels), before and after the rice crop cultivation period.
Agriculture 12 01490 g006
Figure 7. Appraisal of soil salinity in Quinta do Canal and Pranto using (a) NDSI, (b) ASTER_SI and (c) SAVI, before and after the rice crop cultivation season 2017 and 2018.
Agriculture 12 01490 g007
Table 1. Temperature and precipitation data for the study region and the periods 1971–2000 [41], 2017 and 2018 [42]. The data are from the meteorological station of Monte Real (Leiria, Portugal).
PeriodMonthly Precipitation (mm)Average Daily Temperature (°C)Total Precipitation (Jan.–Apr.)
MinMaxMinMax(mm)
1971–20008.5 (Jul)118.1 (Dec)9.6 (Jan)20.1 (Aug)253.8
20174.1 (Aug)104.9 (Dec)8.4 (Jan)19.6 (Aug)215.3
20180.5 (Sep)248.9 (Mar)10 (Jan)20.8 (Aug)474.5
Table 2. Sentinel-2 satellite data spectral bands selected, and imagery spatial resolution.
Band IDSpectral RegionCenter Wavelength (nm)Band Width (nm)Spatial Resolution (m)
B3Green (G)5603510
B4Red (R)6653010
B8Near Infrared (NIR)84211510
B11Short Wave Infrared (SWIR1)16109020
B12Short Wave Infrared (SWIR2)219018020
Table 3. Vegetation and salinity indices derived from Sentinel-2 satellite imagery. The R, G, NIR and SWIR bands are described in Table 2 and L is an empirical parameter.
IndicesEquationIndex RangeReferences
Normalized Difference
Vegetation Index
NDVI = ( NIR R ) ( NIR + R ) [−1,+1][47]
Green Normalized
Difference Vegetation Index
GNDVI = ( NIR G ) ( NIR + G ) [−1,+1][48,49,50]
Generalized Difference
Vegetation Index
GDVI = ( NIR 2 R 2 ) ( NIR 2 + R 2 ) [−1,+1][51]
Soil Adjusted
Vegetation Index
SAVI = ( NIR R ) ( NIR + R + L ) ( 1 + L ) [−1.5,+1.5], for L = 0.5[52]
Normalized Difference
Salinity Index
NDSI = ( R NIR ) ( R + NIR ) [−1,+1][53]
Salinity Index ASTER ASTER _ _ SI = ( SWIR 1 SWIR 2 ) ( SWIR 1 + SWIR 2 ) [−1,+1][34]
Table 4. Soil salinity appraisal calendar at the Quinta do Canal and Pranto rice fields: date and calendar day (day of the year: DOY) corresponding to the acquisition of Sentinel-2 (S2) satellite data for 2017 and 2018, before and after the rice cultivation period, for the condition of bare soil.
YearSentinel-2 MissionDateDOY
2017S2-A28 April118
S2-A25 October298
2018S2-B25 April115
S2-A27 October300
Table 5. Vegetation Indices’ maximum values attained during the 2017 and 2018 rice cultivation seasons at the plot scale, for the Quinta do Canal and Pranto rice fields, and respective percentage variation.
IndexQuinta do CanalPranto
20172018% Variation20172018% Variation
NDVImax0.910.89−2.2%0.910.81−11.0%
GNDVImax0.760.771.3%0.800.68−15.0%
GDVImax0.990.990%0.990.97−2.0%
Table 6. NDSI, ASTER_SI and SAVI for the selected rice field plots of Quinta do Canal and Pranto: mean and coefficient of variation (CV) for specific dates in Spring and Autumn that illustrate the conditions before and after the rice cultivation period in 2017 and 2018.
Field PlotsDateNDSIASTER_SISAVI
MeanCV (%)MeanCV (%)MeanCV (%)
Quinta do Canal28 April 2017−0.1426.40.0518.00.2225.5
25 October 2017−0.2322.60.154.70.3522.0
25 April 2018−0.1933.70.124.20.2933.1
27 October 2018−0.2516.80.143.60.3717.0
Pranto28 April 2017−0.1516.00.097.80.2315.7
25 October 2017−0.228.60.141.40.338.2
25 April 2018−0.2027.00.236.10.3126.5
27 October 2018−0.2216.80.133.10.3316.7
Table 7. Quinta do Canal and Pranto rice field plots’ NDVI values ≈ 65 days after sowing (NDVI65) estimated from Sentinel-2 satellite imagery and rice yield estimated using the predictive model proposed by Siyal et al. (2015) [89]. The data are for 2017 and 2018.
YearField PlotsNDVI65Estimated Rice Yield (ton ha−1)
2017Quinta do Canal0.818.7
Pranto0.849.4
2018Quinta do Canal0.798.4
Pranto0.716.4
Publisher’s Note: MDPI stays neutral with regard to jurisdictional claims in published maps and institutional affiliations.

