Article

Calibration of Discrete Element Model Parameters of Soil around Tubers during Potato Harvesting Period

1
Nanjing Institute of Agricultural Mechanization, Ministry of Agriculture and Rural Affairs, Nanjing 210014, China
2
Graduate School of Chinese Academy of Agricultural Sciences, Beijing 100083, China
*
Authors to whom correspondence should be addressed.
Agriculture 2022, 12(9), 1475; https://doi.org/10.3390/agriculture12091475
Submission received: 29 July 2022 / Revised: 25 August 2022 / Accepted: 9 September 2022 / Published: 16 September 2022

Abstract

:
To address the fact that existing studies may not be able to accurately describe the discrete element parameters of the soil during the potato harvesting period and to improve the accuracy of the potato harvesting equipment simulation studies, this study was conducted on the soil around the harvested potato tubers in the field. The simulation parameters of the discrete element model of soil were determined by the soil stacking angle test and soil block shear crushing test with the actual test measurements as the target. Based on a series of experimental designs, the factors affecting the stacking angle were the static friction coefficient and the rolling friction coefficient between soil particles; and the rolling friction coefficient between soil and steel. The factors affecting the maximum shear damage force were normal stiffness and shear stiffness per unit area. The quadratic regression equations were established and solved to obtain the optimal discrete element simulation parameters. The results can provide more realistic and reliable parameters for the construction of soil simulation models of potato fields during harvesting and for the discrete element simulation of soil-touching components of potato harvesting equipment. It can also further enrich the parameter data of soil discrete element simulation models and provide a reference for related research

1. Introduction

With the development of computer technology and discrete element methods, more and more scholars are conducting experimental studies with the help of discrete element simulation. The discrete element method is widely used in the geotechnical, transportation, and agricultural fields [1,2,3,4]. Especially in agricultural research, the materials are mostly discrete particles such as seeds, soils, etc. The discrete element method can visually and reliably reflect the interaction process between the object of study and the machine. It can provide a great convenience for the design and optimization of agricultural machinery [5,6]. To ensure the accuracy and reliability of the simulation model, the selected discrete element parameters need to be calibrated. The discrete element simulation parameters include basic parameters such as intrinsic parameters, contact parameters, and additional parameters for different contact models. It is important to select models and parameters according to different material properties [7]. Therefore, several studies have also been conducted for parameter calibration tests for material properties.
There are broadly two common methods of calibrating discrete element parameters. The first one is to test for each needed parameter separately and then calibrate those parameters directly. Liu et al. [8] performed a simulation parameter calibration of the miniature potato. They successively established the collision restitution coefficient measurement model and the friction coefficient measurement model. The corresponding models were built in EDEM 2018, and each parameter was calibrated one by one. Yu et al. [9] combined bench tests and simulation tests to calibrate the discrete element parameters of Panax notoginseng seeds by crash drop test, slope slip test, and slope roll test. The second is to calibrate multiple simulation parameters at once by one or several other response values. Liu et al. [10] calibrated the discrete element parameters of wheat based on stacking tests. They screened out several significant factors affecting the stacking angle and then obtained the calibration results by the response surface method. Ma et al. [11] calibrated the parameters through a series of experiments using the measured and simulated errors of the repose angle and stacking angle of alfalfa seeds as response values. Horabik et al. [12] calibrated parameters of discrete elements of wheat in grain storage systems based on experimental data of loading and unloading cycles of individual wheat grain.
There are also more parameter calibration tests related to agricultural soil models, and different contact models are selected for testing according to different soil types. Bahrami et al. [13] performed calibration tests on soil based on a plate sinkage test using the hysteretic spring-linear cohesion contact model and validated it in combination with direct shear tests. Liu et al. [14] used the Hertz–Mindlin with EEPA contact model for discrete element calibration of parameters related to clayey soil with the angle of repose as the response value. Wu et al. [15] used the Hertz–Mindlin with JKR contact model for cohesive soils. The effects of JKR surface energy, recovery coefficient, etc., on the stacking angle and the results of parameter calibration were obtained. Research on soil discrete elements has been relatively well established, mostly with a particular type of soil as the test subject. For example, most of the studies on sandy soils and sandy loam soils were simulated using the Hertz–Mindlin model because the adhesion between such soils is relatively small. While there is a certain adhesion between clayey soil particles, most of them are studied by the Hertz–Mindlin with JKR or EEPA models. The results have some reference significance for the selection of simulation model parameters for different crops and different seasons. However, there is still a slight impact on the accuracy of the simulation model. Although some studies are focusing on the effect of different moisture contents on the characteristics of soil parameters, the correspondence between the moisture content and the soil conditions in the field is not clear. In addition, few calibrations of soil parameters have been seen for different plants in different seasons. Few studies have been conducted on the parameters of the soil during the potato harvest period. In order to ensure a more realistic discrete element simulation model of potato harvesting equipment, a calibration of the soil parameters to improve the accuracy of the parameters is of great interest.
In summary, in order to solve the problem that the results of existing studies may not accurately simulate the soil during the potato harvesting period, we studied the soil during the potato harvesting period and conducted parameter calibration tests to obtain discrete element parameters that are more applicable to the soil during the potato harvesting period. We used sandy loam soil in the potato growing region as the test object. The actual measurements of the soil parameters were carried out. The Hertz–Mindlin model and Hertz–Mindlin with the bond model were used to establish the soil grains stacking angle and soil block shear crushing model in EDEM 2018 software, respectively. We conducted a series of simulations targeting the actual measurements to obtain soil-related discrete element parameters. It is expected that this study will provide reliable parameters for discrete element simulation models for the design and optimization of soil touching parts for potato harvesting machines. It can also enrich the data of soil discrete element parameters and provide a reference for related research.

2. Materials and Methods

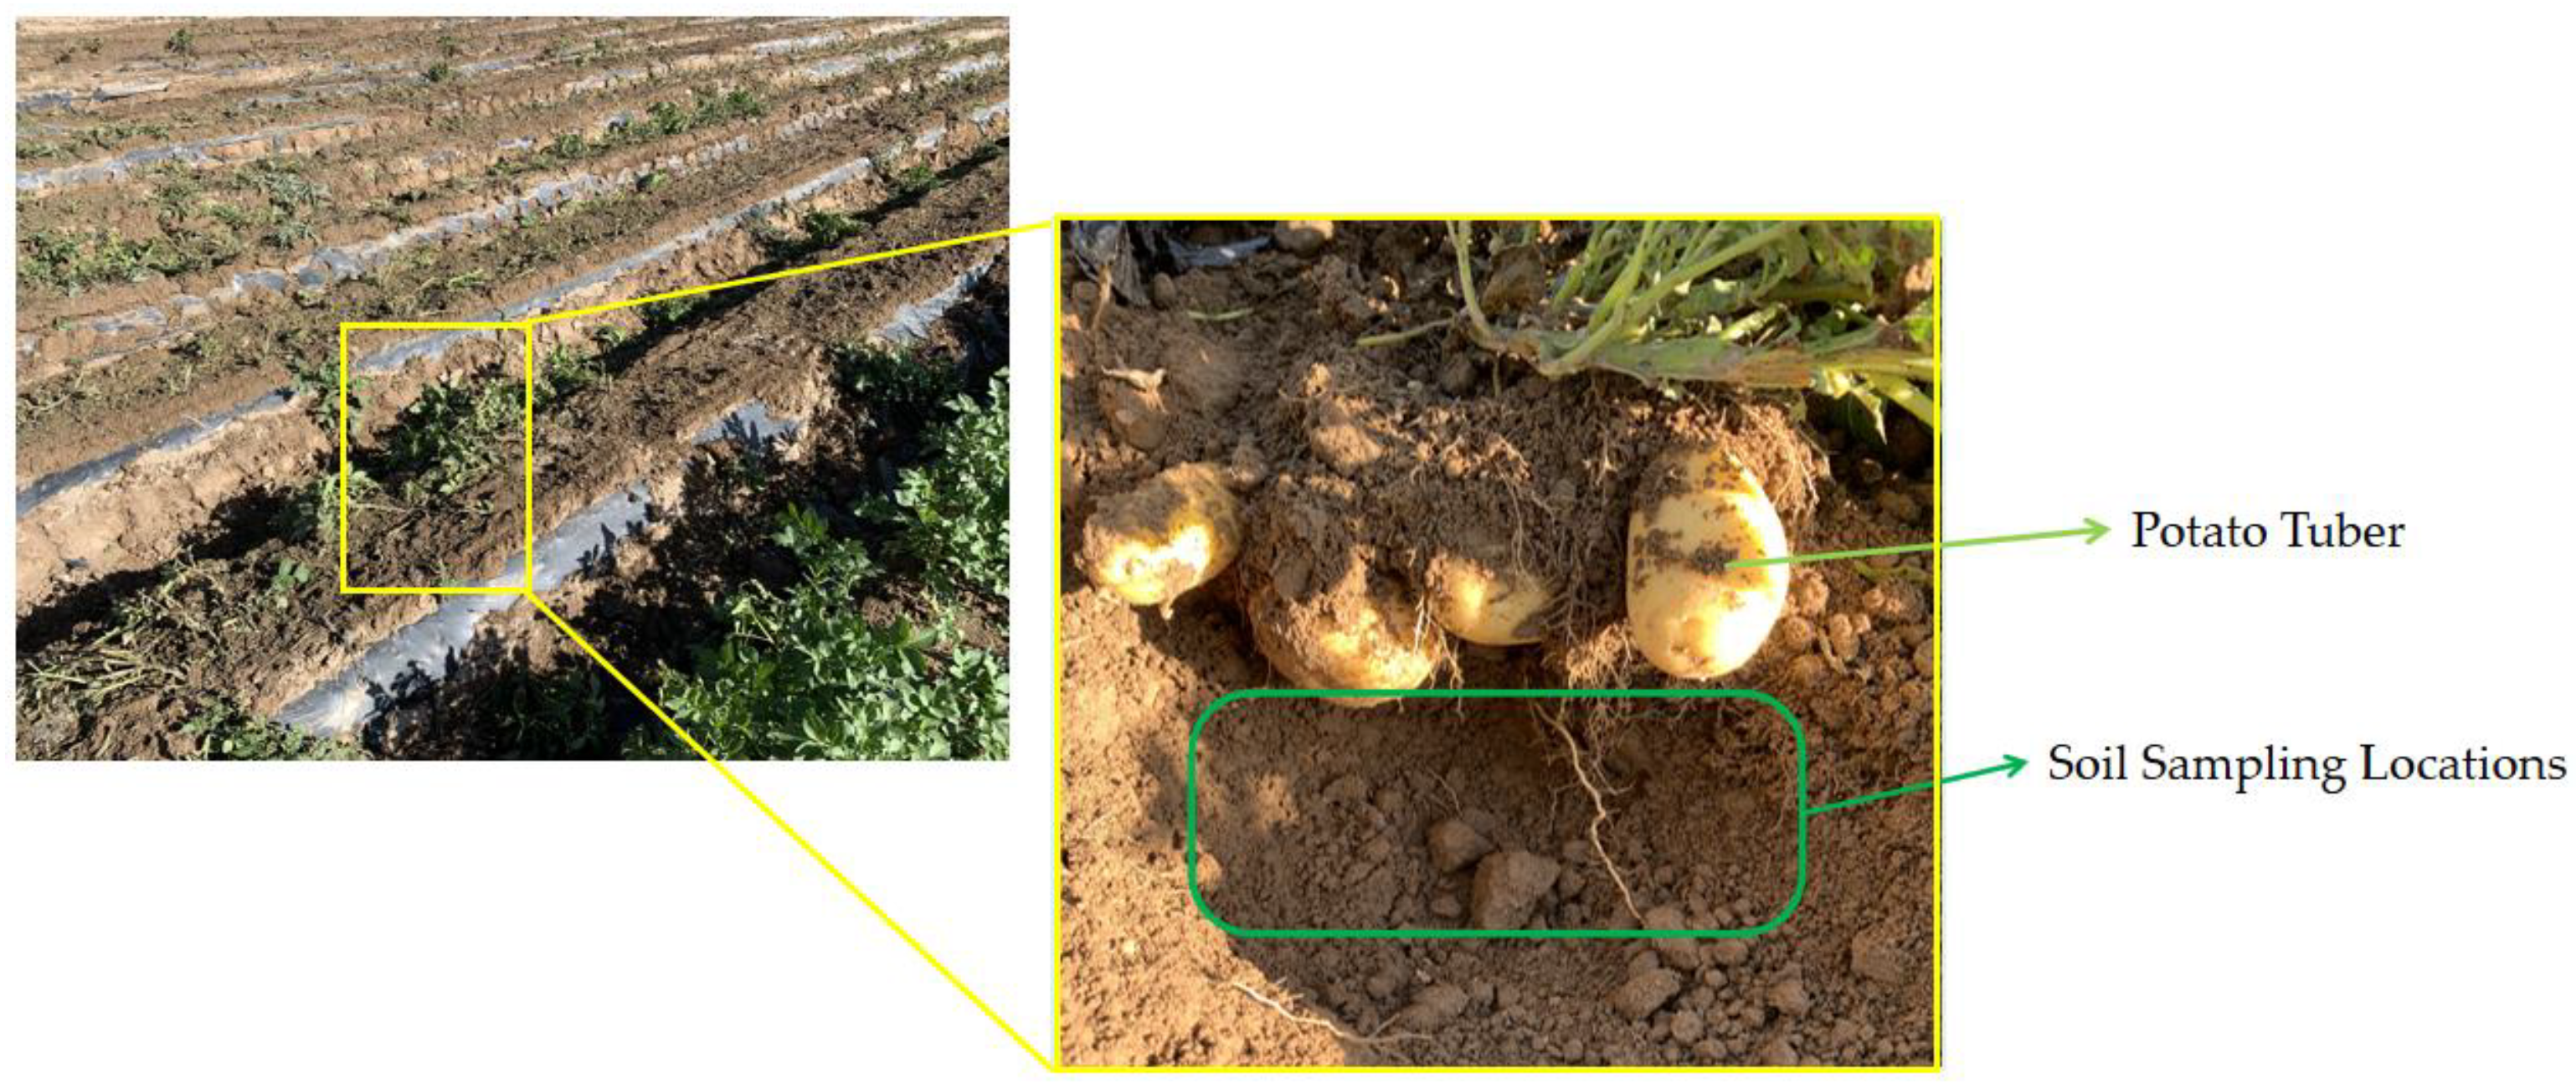
2.1. Soil for Testing and Its Sampling Method

The experiment was conducted on the soil around the potato tubers during the harvest period. The soil type is sandy loam, and the sampling site is in Huining County, Gansu Province. The potatoes are planted in mid-April, with machine seeding and mulching after the machine ridging. The harvest time is from September to October each year. The ridge shape of the field was measured during the harvest period, and a ridge height of 200 mm, a ridge bottom width of 500 mm, and a plant spacing of 350 mm were obtained. Tubers were produced at 15–20 mm from the surface of the top of the ridge. Sampling was conducted in the field by hand digging in a five-point sampling method to collect soil around the potato tubers for a series of experiments, and the soil sampling location is shown in Figure 1. The particle size distribution of the sample can be measured after sieving the soil: 54.66% of the mass with a particle size less than 4 mm, 19.88% with a particle size between 4 and 7 mm, and 25.47% with a particle size greater than 7 mm. The density of the samples was measured and calculated to be 1100 kg·m−3, with a coefficient of variation of 3.19%. The measured water content of the soil was 15.38%, and its coefficient of variation was 4.60%.

2.2. The Parameter Calibration Method for the Soil Stacking Angle

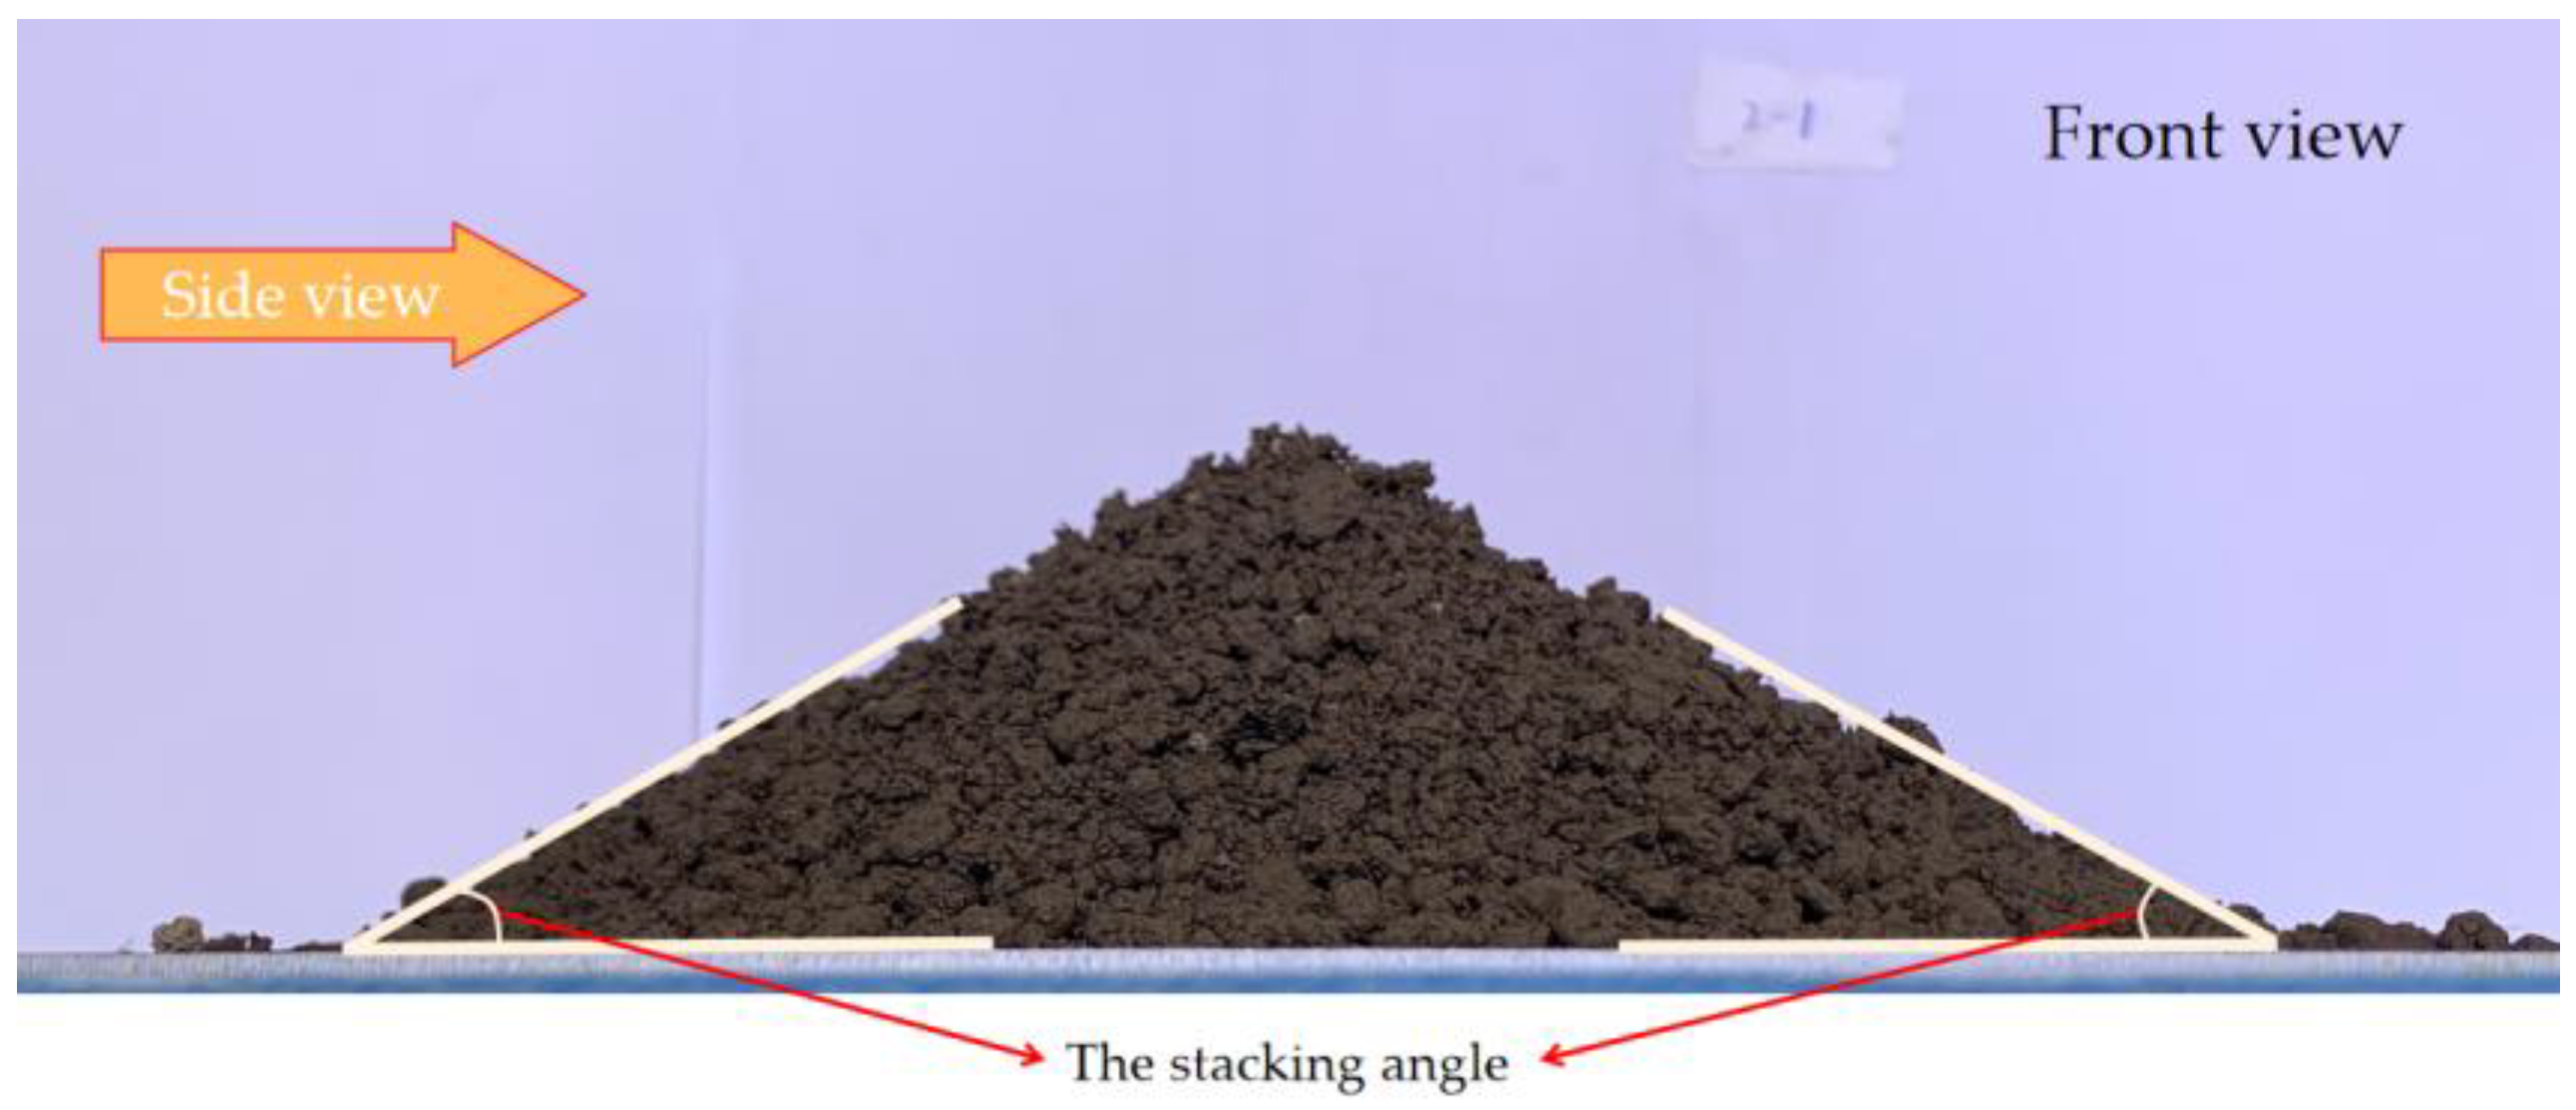
2.2.1. Practical Experiments of Soil Stacking Angle

When performing the discrete element parameter calibration, the magnitude of the stacking angle is often used as the response value for the material’s intrinsic parameters and contact parameters [16,17,18]. In this experiment, the stacking angle of the soil was obtained by using the cylinder lifting method. After sieving the soil samples, most of the fine-grained soil grains with a size less than 7 mm were spherical. Those larger than 7 mm were mostly large soil blocks. Therefore, soil grains less than 7 mm in diameter were put into a steel cylinder with an inner diameter of 100 mm and a height of 160 mm as the test object. The cylinder was fixed on the UTM6503 (SHENZHEN SUNS TECHNOLOGY STOCK Co., Ltd., Shenzhen, China) electronic universal testing machine (capacity: 5 kN, Grade: 0.5, power: 0.4 kW), and a square steel plate was placed on the bottom of the cylinder. During the test, the cylinder filled with soil grains was lifted upwards, so that the grains of the sample were stacked on the steel plate below and showed a certain stacking angle. The camera was kept horizontal and photographed and recorded from the front view direction and the side view direction, respectively. After processing the obtained images, the specific degree of each stacking angle can be obtained. Two stacking angles can be obtained for each direction, and the front view direction of the soil stacking angle after an experiment was shown in Figure 2. The average value of four stacking angles can be obtained in one test as the result of that test. The actually measured stacking angle of 25.73° with a coefficient of variation of 2.20% can be obtained by repeating the test 10 times.

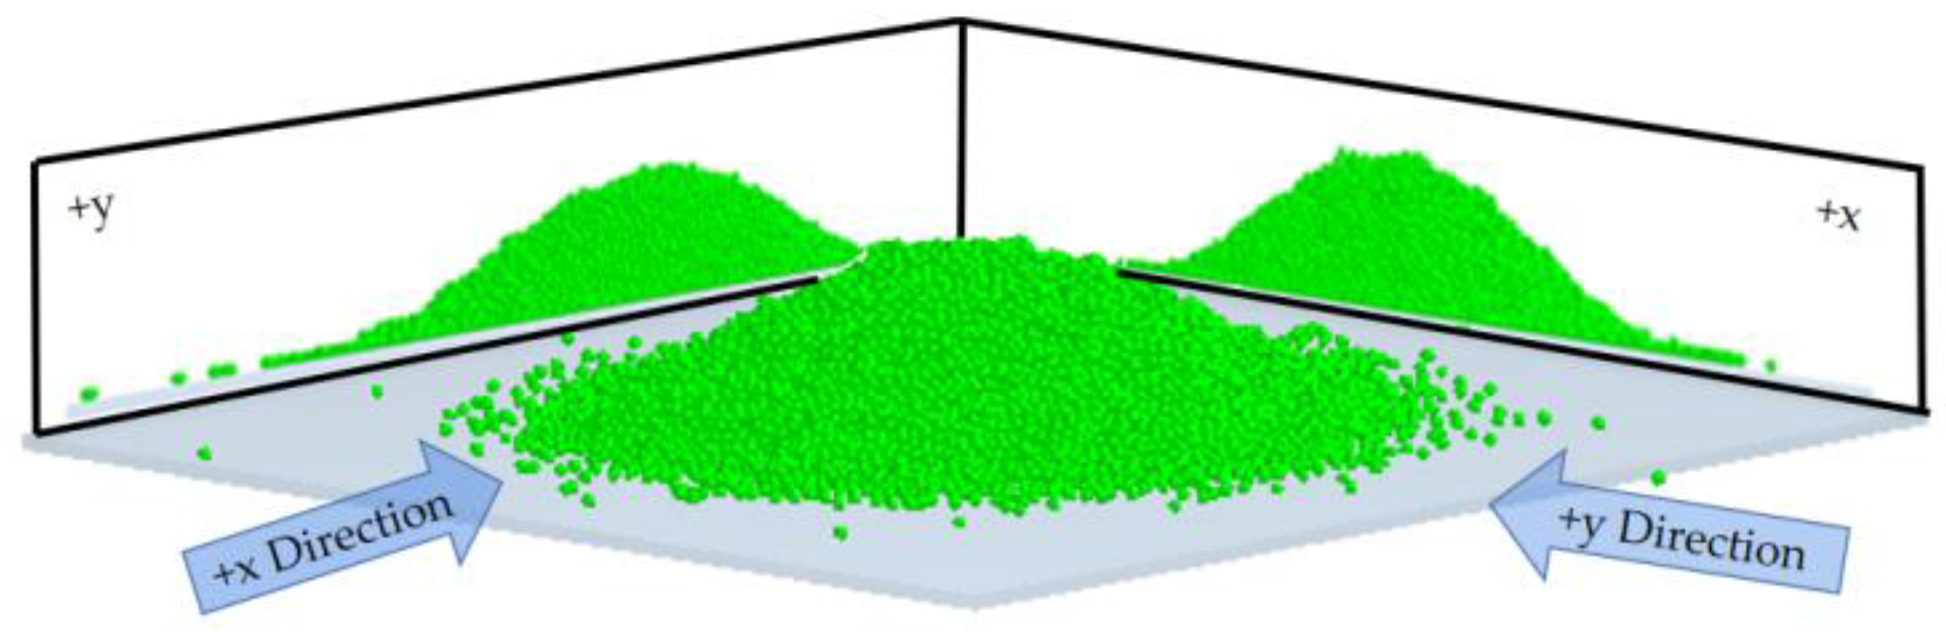
2.2.2. Discrete Element Model of Soil Stacking Angle

The soil type used in this experiment was sandy loam, so the Hertz–Mindlin model was selected for the simulation of soil stacking angle. The forces and motions of soil grains in this model can be decomposed into normal motion between particles, tangential motion between particles, and rolling motion between particles when performing simulation calculations. The magnitude of the angle during stacking would be influenced by the contact parameters between the particles. The range of parameters used in the simulation experiments is shown in Table 1, where the soil density was the actual measurement and the ranges of the other parameters were obtained by reviewing the literature [14,19,20]. The table can be used as the basis for subsequent parameter calibration tests.
A square steel plate was created in EDEM software, and a cylinder with the same inner diameter of 100 mm and height of 160 mm was created above the plate as the actual test. The radius of the soil grains was set to 4 mm, and the same mass as the actual soil was generated by the static factory. When the particles inside the cylinder had been stabilized, the cylinder was lifted so that the soil grains flowed out of the cylinder to form a stacking angle. The stacking angles obtained from the simulation were saved as pictures from both +x and +y directions, as shown in Figure 3. As in the actual test, the degree of the stacking angle can be derived after image processing, and the average value of the four angles was used as the result of one test.

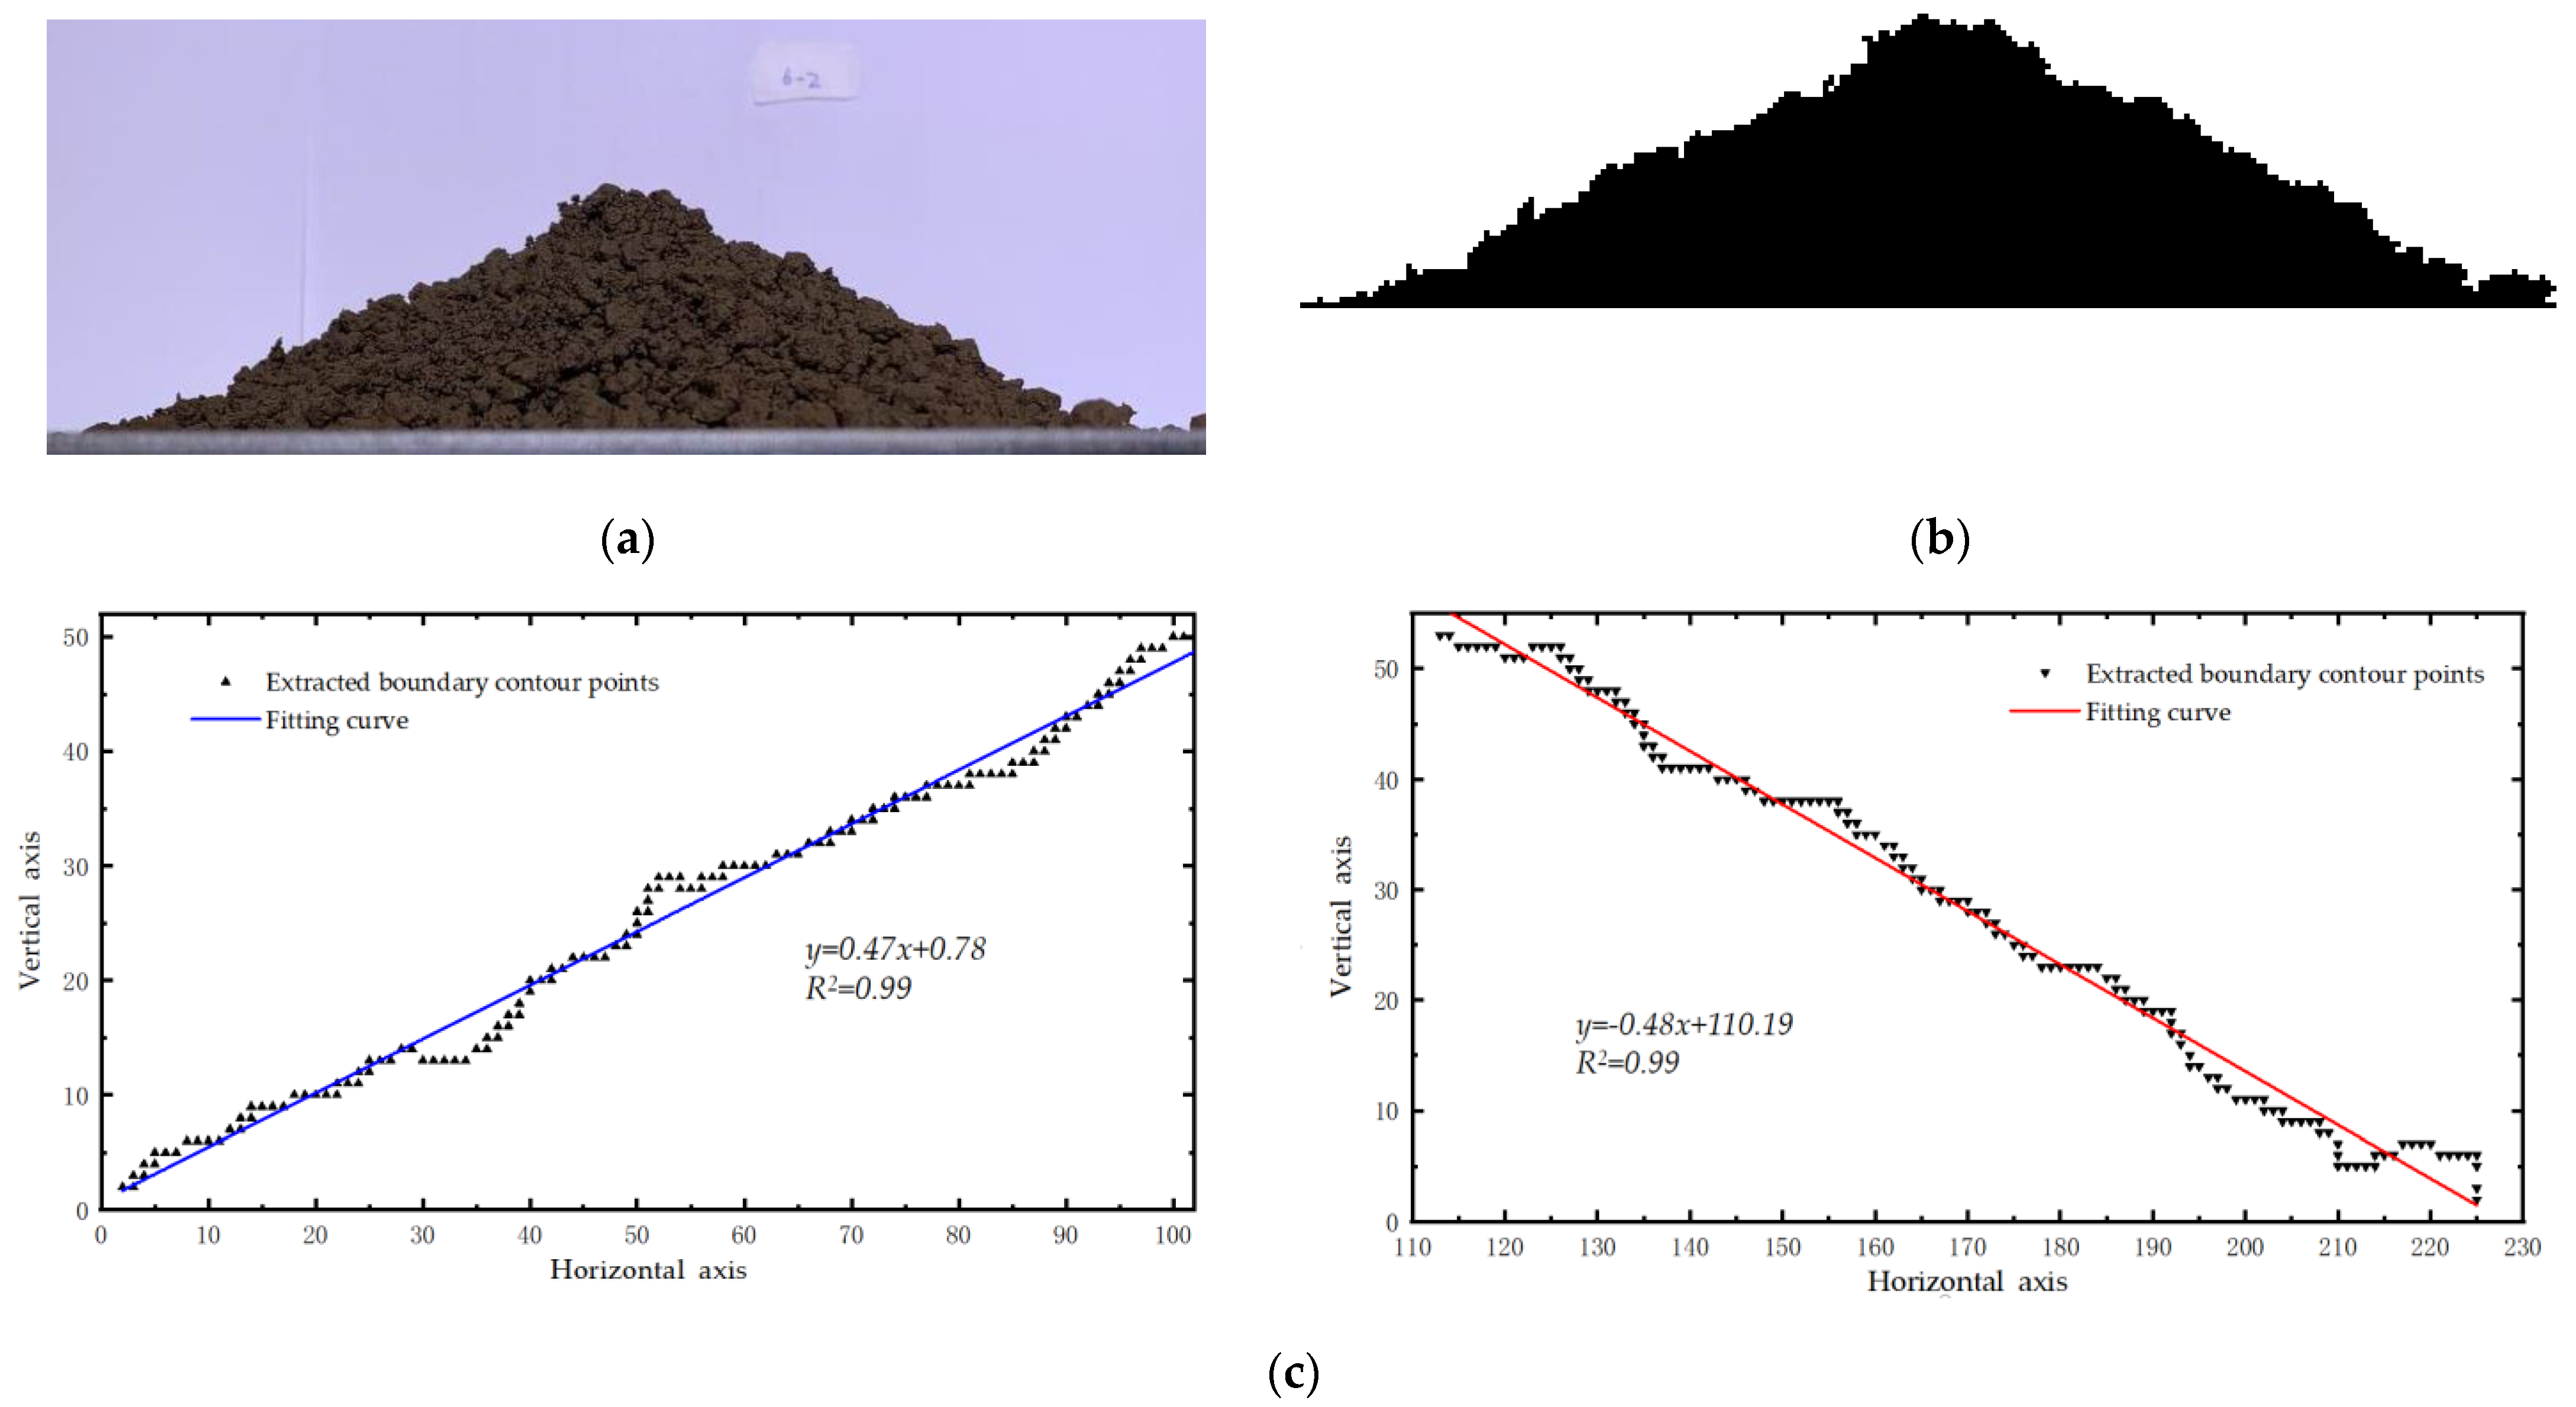
2.2.3. Measurement Method for Degree of Stacking Angle

The captured images were processed by MATLAB 9.0. The first step is to grayscale the image. The matrix of pixel points in the image is assigned and calculated to change the color of the pixel points to achieve grayscale. Then binarization is performed so that each pixel point in the image appears black or white. Finally, the X-Y coordinate points of a set of image boundaries are derived by boundary extraction. The obtained coordinate data are segmented according to the ascending and descending trends, and the linear fit is performed for each of the two segments. The slope of the fitted line can be derived, and the degree of the stacking angle can be calculated. Figure 4 showed a picture of the stacking angle results obtained from an actual test and the process of image processing and curve fitting to it.

2.3. The Parameter Calibration Method for the Soil Block Shear Crushing

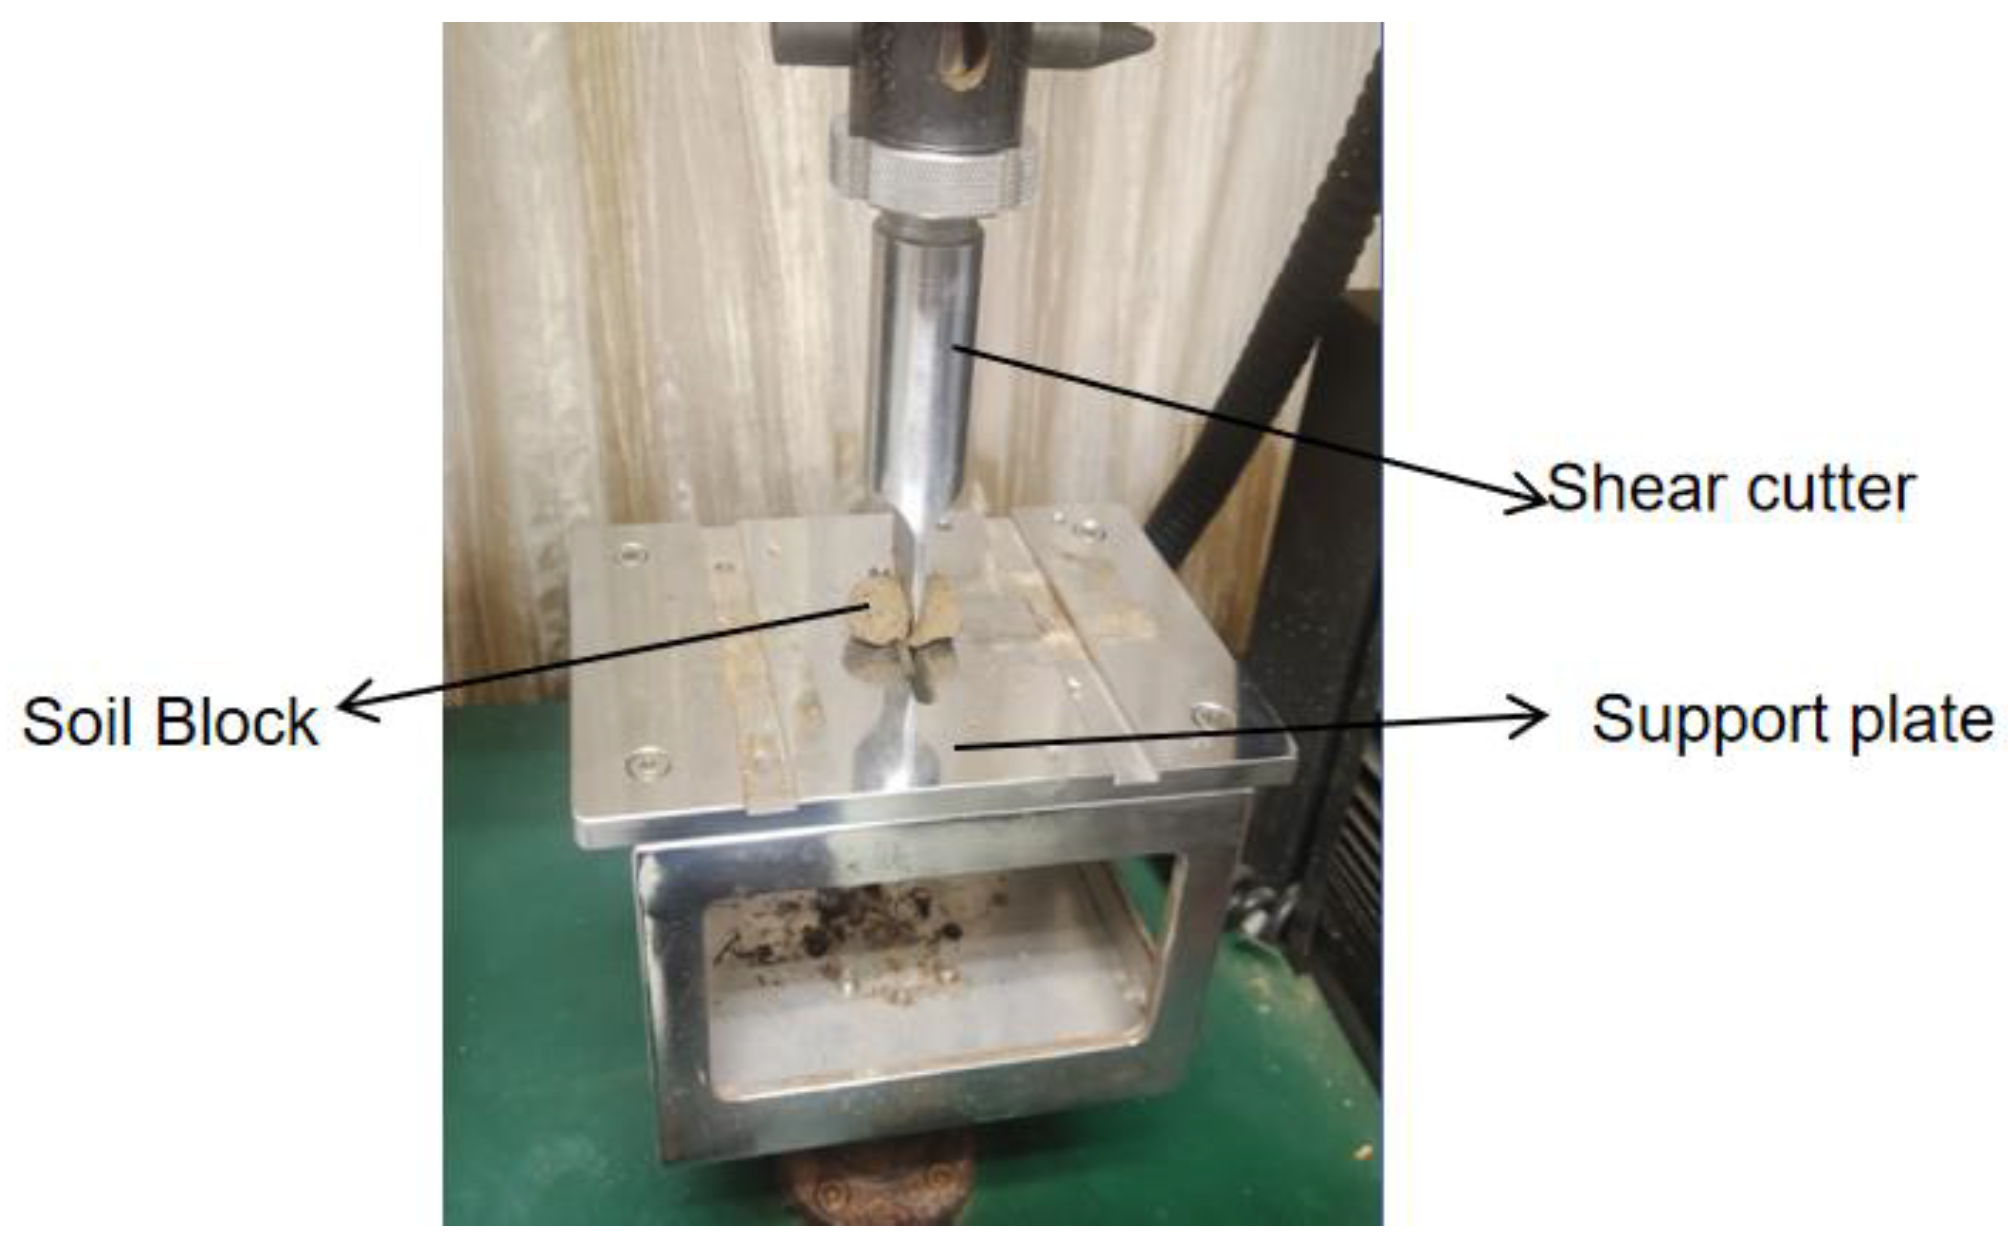
2.3.1. Practical Test of Soil Block Shear Crushing

The maximum crushing force was obtained by shear crushing to the trimmed soil block using an electronic universal testing machine. After sieving the soil samples obtained from the field around potatoes, those larger than 7 mm were mostly irregularly shaped soil blocks. To improve the reliability of the test results, the soil block needs to be trimmed with a utility knife to allow for repeat tests. A set of rectangular soil blocks of 25 ± 1 mm in length, 15 ± 0.2 mm in width, and 10 ± 0.2 mm in thickness were obtained. The rectangular soil block samples were sheared by the UTM6503 electronic universal testing machine. A speed of 5 mm/min was selected for loading to derive the maximum crushing force during shearing, as shown in Figure 5. After averaging the results of the five replicate tests, the maximum crushing force of the soil block can be obtained as 3.61 N with a coefficient of variation of 13.84%.

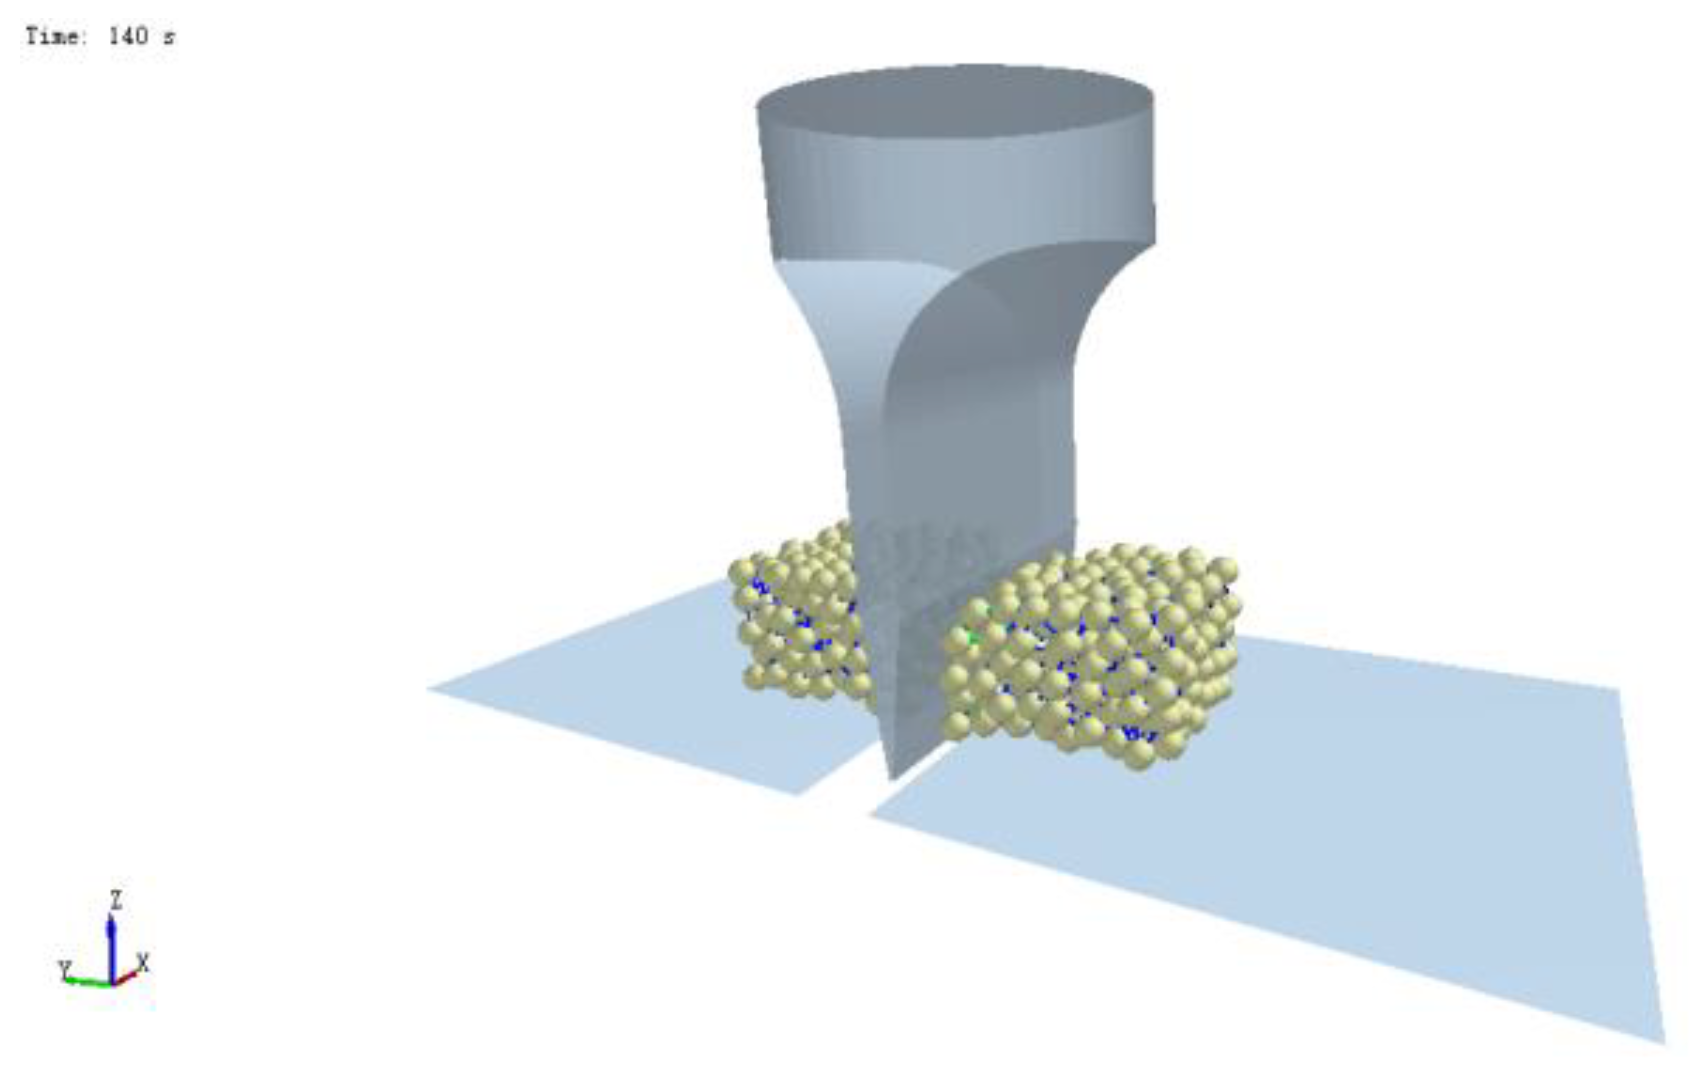
2.3.2. Discrete Element Model for Soil Block Shear

In the discrete element study related to potato harvesting machinery, digging, potato-soil separation, and other links can break up large soil blocks. The Hertz–Mindlin model does not allow for particle fragmentation. It is necessary to bond small soil grains by attaching a bond model to form a large soil block with a certain strength. The bond is removed when the parameter of the bond between the particles reaches the set value, and thus the block is broken. So, the Hertz–Mindlin with bonding model was used to perform discrete element simulation of the soil block shear crushing process. A rectangular body of 25 mm in length and 15 mm in width and 10 mm in thickness was created in EDEM. The interior was filled with small soil grains of 2 mm diameter with an additional bond between the soil grains. The shear cutter was modeled by SolidWorks 2018 and imported into EDEM, with the cutter position set directly above the middle of the soil block. Two support plates were established symmetrically with the cutter as the center and their spacing was 5 mm. The cutter speed was set vertically downward with a speed of 5 mm/min. The time step was set to 1.7 × 10⁻⁵ s for simulation calculation. The maximum crushing force during soil fragmentation was obtained. The discrete element simulation model built was shown in Figure 6.

2.4. Experimental Design for Parameter Calibration

2.4.1. Calibration of Intrinsic Parameters and Contact Parameters—By Stacking Angle Test

(1)
The screening test: The Regular Two-Level Factorial Design experiment was design by the Design-Expert 12.0 software. The density of soil, the density of steel, and Poisson’s ratio of steel for the simulation model were set according to Table 1. The remaining 8 factors with a certain range (X1 to X8) were screened for significance. According to the range of the given parameters, the upper limit value of each parameter was considered as the high level and the lower limit value was considered as the low level, which was coded as shown in Table 2 below. Discrete element simulation calculations of soil grains stacking angle were performed for a total of 16 trials. The effects analysis of the experimental results was performed.
(2)
The steepest ascent test: Based on the results of the Regular Two-Level Factorial Design test, the steepest ascent test was performed on the screened main factors to determine the interval where the optimal values were located. Intermediate values were taken for other parameters with the low significance of effects in the test. Parameters with significant effects were gradually changed according to equal amounts, in five groups. The simulation test of the soil stacking angle was conducted, and the relative error values of the stacking angle obtained from the simulation test and the actual test results were recorded. The interval with the smallest error range was determined according to the trend of the error values, and the range where the optimal values of the main influencing parameters are located was derived.
(3)
The response surface test: Using the soil stacking angle as the response value Y1, the Box–Behnken Design test was performed by Design-Expert software based on the results of Regular Two-Level Factorial Design test and Steepest Ascent test. The interactions between the factors were analyzed, and the corresponding regression models were developed to derive the optimal set of parameters that satisfy the measured degrees. The high level (+1), low level (−1), and center point (0) of the significant parameters correspond to the upper and lower limits and median values of the range where the optimal values are located in the climbing ascent test. The values of the remaining insignificant factors were the same as those of the steepest ascent test. Analyses of variance were performed on the experimental results, and the corresponding regression equations could be derived.

2.4.2. Calibration of Bonding Parameters—By Shear Crushing Test

According to the simulation calculation principle of the additional bond model, the four influencing factors that affect the fragmentation of the soil block are normal stiffness per unit area between the soil, shear stiffness per unit area between the soil, critical normal stress between the soil, and critical shear stress between the soil. Using the maximum force of soil block shear crushing Y2 as the response value, the four-factor, three-level response surface experimental design based on Box–Behnken Design principles was conducted. The range values of the four bonding parameters were determined concerning existing literature [21,22], and the values of the high and low levels, the center point of each parameter were coded as shown in Table 3 below. The intrinsic and contact parameters required for the simulation model are adopted from the results of the stacking angle test. Simulation calibration test of soil block crushing test was carried out. The design center group was 5 groups, and the total was 30 groups. The results of the experiments were analyzed by ANOVA and the corresponding regression equations could be derived.

3. Results

3.1. Results of Soil Stacking Angle Parameter Calibration Tests

3.1.1. Significance Screening Test for the Effect of Factors

Eight parameters affect the soil stacking angle: Poisson’s ratio of the soil X1, shear modulus of the soil X2, coefficient of restitution between the soil X3, coefficient of static friction between the soil X4, coefficient of rolling friction between the soil X5, coefficient of restitution between steel and soil X6, coefficient of static friction between steel and soil X7, and coefficient of rolling friction between steel and soil X8. These factors were used for screening the significance of the effects. The experimental design and results obtained according to the principle of Regular Two-Level Factorial Design are shown in Table 4.
The effect of each parameter can be obtained after effects analysis of the experimental results as shown in Table 5. The factors affecting the soil stacking angle in order of significance were: X4, X5, X8, X3, X7, X1, X6, X2. Only X4, X5, X8 had a significant effect on the stacking angle, while the other parameters had little effect. Only three significant parameters were considered in the subsequent steepest ascent test, and the other five non-significant parameters were taken at the intermediate level, which means X1 was taken as 0.30, X2 was taken as 1.0 × 10⁶ Pa, X3 was taken as 0.50, X6 was taken as 0.16, and X7 was taken as 0.60.

3.1.2. Significance Screening Test for the Effect of Factors

The steepest ascent test was performed for the significance parameters X4, X5, and X8 screened by the Regular Two-Level Factorial Design test. The effects of all three on the degree of stacking angle were positive. So, the parameter values were designed as equal increments, and the stacking angle simulation tests were conducted separately. The degree of the stacking angle and error values of each experiment were obtained. The designed test and results are shown in Table 6.
As the values of coefficient of static friction between the soil X4, coefficient of rolling friction between the soil X5, and coefficient of rolling friction between steel and soil X8 simultaneously increased, the degree of stacking angles for the simulation test also increased, gradually reaching the real measured value and exceeding it. The relative error values between the simulation test and the actual test results showed a decreasing and then increasing trend. The third group of tests had the smallest relative error values. Therefore, the data from the third group of tests were used as the center point, and the data from the second and fourth groups were used as the low and high levels, respectively, for the subsequent response surface tests.

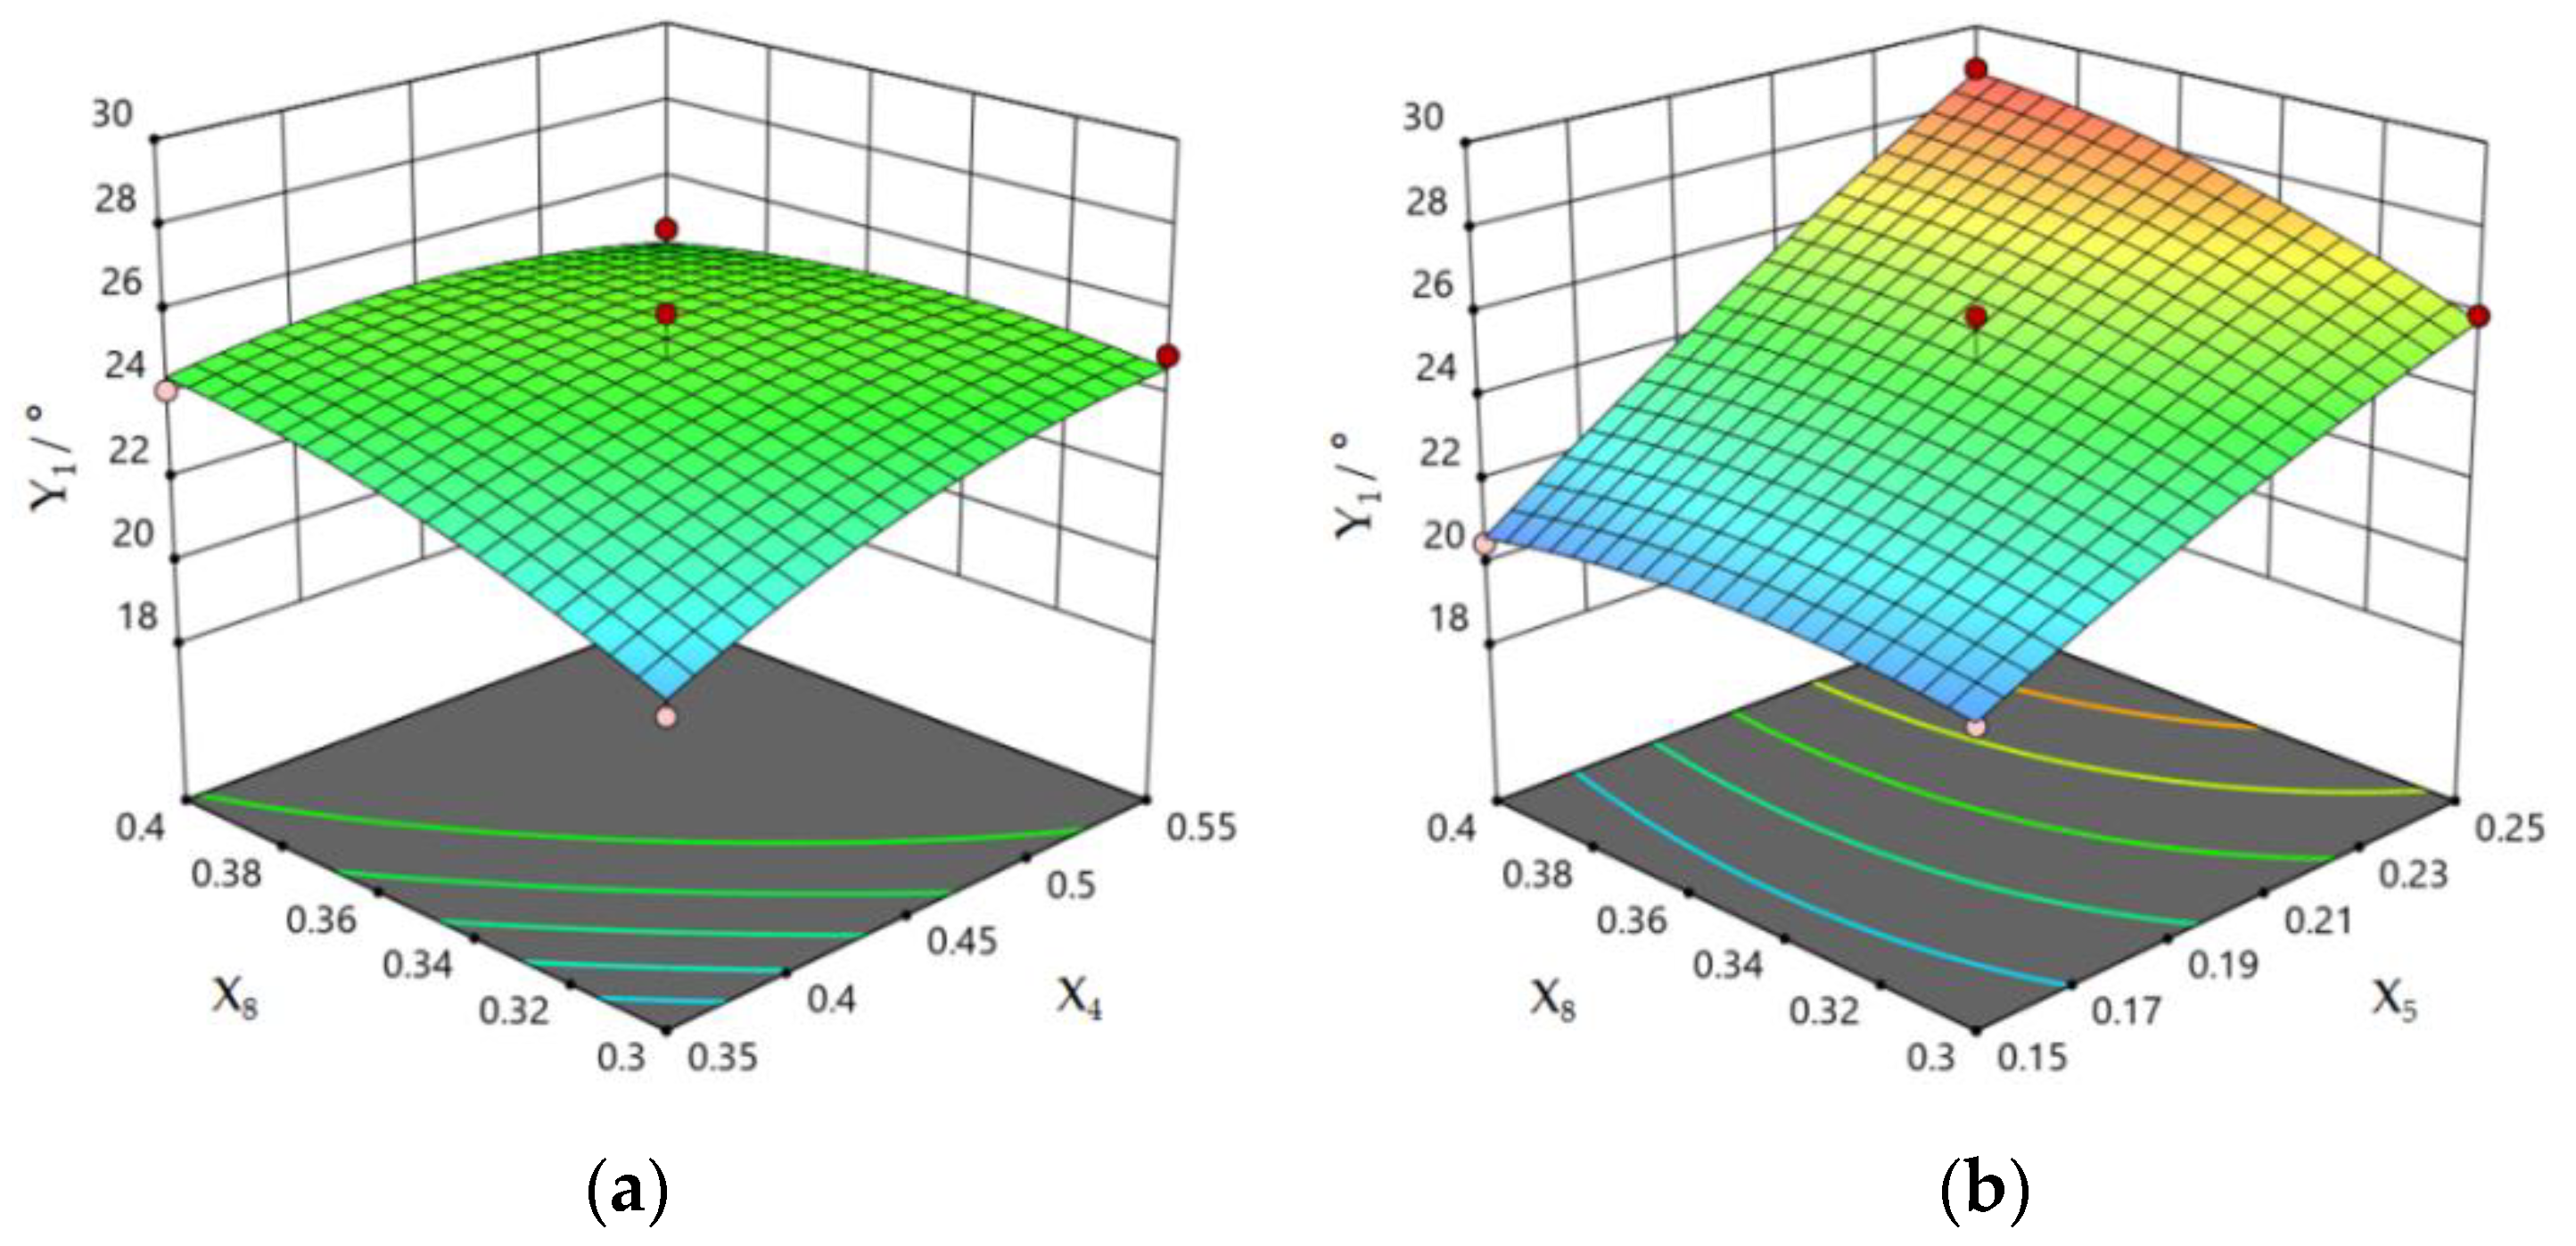
3.1.3. Three-Factor Response Surface Test

A total of 17 groups of Box–Behnken Design tests were conducted with the response value of stacking angle Y1 and the three obtained significant influencing factors X4, X5, and X8 as factors in the range of their high and low level, and the results are shown in Table 7. The experimental results were analyzed and fitted by Design-Expert software to establish a quadratic regression model of soil particle accumulation angle with three significant parameters. The quadratic polynomial equation was obtained as Equation (1):
Y 1 = 139.67 X 4 + 28.73 X 5 + 169.79 X 8 71.00 X 4 X 5 170.00 X 4 X 8 + 332.00 X 5 X 8 64.80 X 4 2 119.20 X 5 2 209.20 X 8 2 49.70
The R2 of this model is 0.975 and the adjusted R2 is 0.944, both of which are close to 1, indicating the reliability of the fit of this quadratic model is high. The adeq precision of 19.76 is greater than 4, indicating that the model has good accuracy. The results of the analysis of variance (ANOVA) performed on the test are shown in Table 8. The p value for this model is less than 0.01 based on the results of the analysis, indicating that the relationship between the stacking angle Y1 and X4, X5, and X8 expressed by the model is highly significant. The p value of the Lack of Fit is 0.5247 greater than 0.05, which is not significant, indicating a good model fit. All of the coefficients of static friction between the soil X4, the coefficient of rolling friction between the soil X5, and the coefficient of rolling friction between steel and soil X8 have significant effects on the degree of the stacking angle. The effects of X4 and X5 are highly significant. The effects of the interaction terms X4X8 and X5X8 are significant.
The significant effects of the interaction between different factors on the stacking angle are shown in Figure 7. The value of the stacking angle is smallest when both coefficient of static friction between the soil X4 and coefficient of rolling friction between the soil X5 decrease. When the coefficient of rolling friction between steel and soil X8 is larger, the stacking angle is more significantly influenced by the coefficient of rolling friction between the soil X5. The actually measured degree of the stacking angle was used as the target, and the quadratic full model Equation (1) was solved by the constraint solver tool. The values of X4, X5, and X8 were 0.542, 0.213, and 0.336, respectively. The results were substituted into the discrete element model of the stacking angle, and simulation tests were conducted to verify the reliability and accuracy. The average value of the stacking angle of the soil grains was 25.75° obtained by repeating the test three times. The relative error of the result to the actual measured value is 0.98%. The results of the simulation test were close to the actual result, indicating that the calibration results of the intrinsic parameters and contact parameters between soil grains, using the soil stacking angle number as the test index, were reliable.

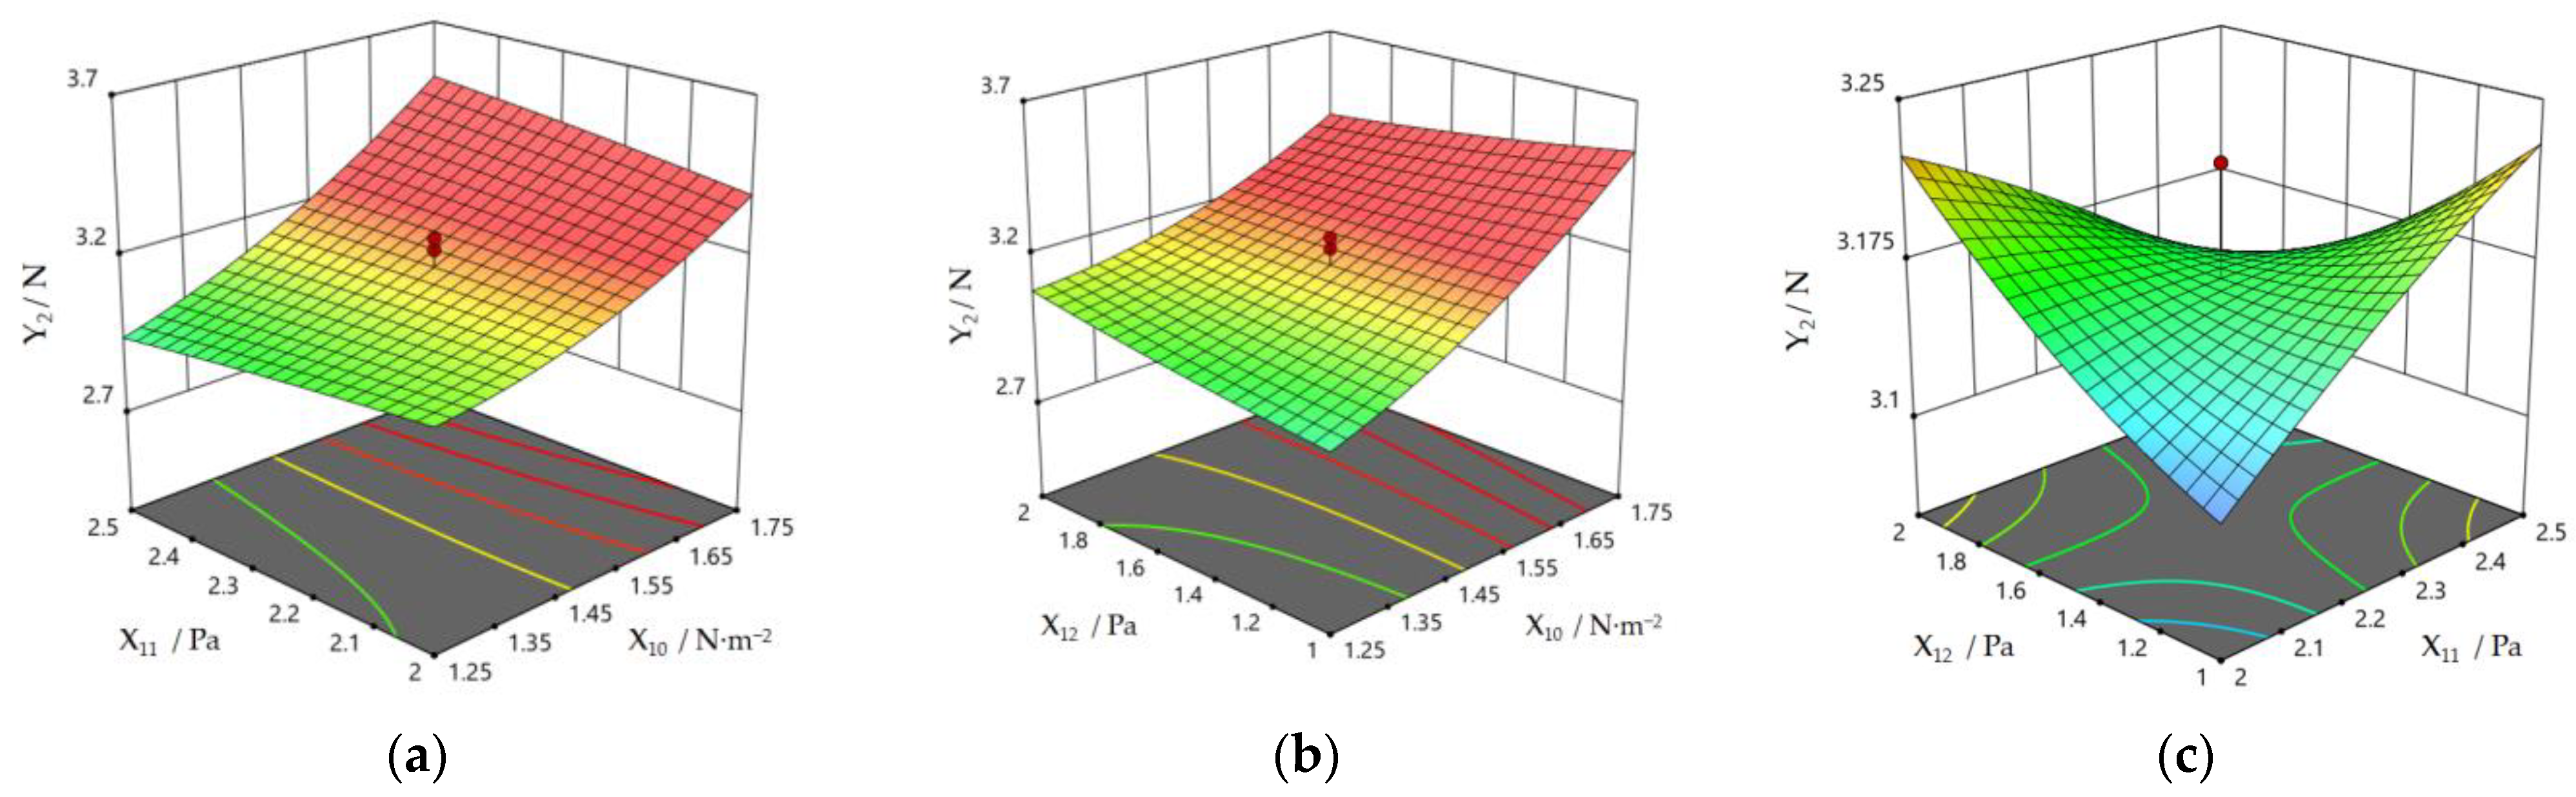
3.2. Results of Soil Blocks Shear Crushing Parameter Calibration Tests

The results of the stacking angle calibration test were used as the parameters of the Hertz–Mindlin model for the block shearing test. The four bond parameters normal stiffness per unit area X9, shear stiffness per unit area X10, critical normal stress X11, and critical shear stress X12 of the additional bond model were parameter calibrated using the maximum crushing force in shear Y2 as the response value. Response surface tests were performed according to Box–Behnken Design, and the results were obtained as in Table 9. The test results were fitted analytically to establish a quadratic regression model of the maximum crushing force and four parameters, and the quadratic polynomial equation was obtained as in Equation (2):
Y 2 = 3.79 0.02 X 9 3.60 X 10 0.72 X 11 + 1.79 X 12 + 0.13 X 9 X 10 + 0.19 X 9 X 11 0.03 X 9 X 12 + 0.90 X 10 X 11 0.55 X 10 X 12 0.44 X 11 X 12 + 0.03 X 9 2 + 1.00 X 10 2 0.10 X 11 2 + 0.04 X 12 2
The R2 of this model is 0.974, and the adjusted R2 is 0.949, both of which are close to 1. The adeq precision of 24.53 is greater than 4, indicating that the model is fitted with high reliability and good accuracy. The results of the analysis of variance performed on the test are shown in Table 10. The p value of this model is less than 0.01, indicating that the relationship between the maximum crushing force Y2 expressed by this model and X9, X10, X11, and X12 is highly significant. The p value of Lack of Fit is 0.1418 greater than 0.05, which is not significant, and the model fits well. It can be used for analysis and optimization. The effects of normal stiffness per unit area X9 and shear stiffness per unit area X10 between soil grains on the maximum crushing force Y2 were highly significant. In addition, the critical normal stress X11 and critical shear stress X12 between the particles were not significant for Y2. The interaction terms X10X11, X10X12, and X11X12 had a significant effect on Y2, and the squared term X102 also had a significant effect. The effects of the other terms were not significant.
The significant effect of the interaction term on the maximum shear crushing force Y2 is shown in Figure 8. The maximum crushing force Y2 is more significantly influenced by the shear stiffness per unit area X10 when the critical normal stress X11 is larger. When the critical shear stress X12 is small, the maximum crushing force Y2 is more significantly influenced by the shear stiffness per unit area X10. Although the critical normal stress X11 and the critical shear stress X12 by themselves have no significant effect on Y2, there is a significant interaction between the two. The actual measured value of the maximum crushing force in shear was used as the target for solving the quadratic full model. The values of X9, X10, X11, and X12 were obtained as 2.86 × 10⁶ N·m−2, 1.64 × 10⁶ N·m−2, 2.42 × 10⁵ Pa, and 1.47 × 10⁵ Pa, respectively, by solving Equation (2) with the constraint solver tool. The values of the bonding parameters obtained from the solution were substituted into the discrete element model of soil block shear for simulation tests to verify the reliability and accuracy of the results. The maximum crushing force of soil block shear can be obtained after repeating the test three times as 3.56 N, and the relative error with the result of the actual test is 1.37%. The simulation test result was close to the actual measured value, indicating that the bond parameters obtained from the calibration were more reliable.

4. Discussion

The stacking angle was used for the calibration of the parameters of the discrete element simulation. The coefficient of static friction and rolling friction between soil were the main parameters affecting the stacking angle. This result is similar to the experimental study conducted by Wang et al. [23]. Hao et al. [24] conducted experiments on the calibration of simulation parameters for sandy loam soil planted for Ma yam, and they found that the static and rolling friction coefficients between the particles had the greatest effect after screening tests and developed a dual objective calibration. Fan [20] found that the rolling friction coefficient between soil and steel had a more significant effect on the degree of the soil stacking angle during the calibration of the soil discrete element parameters. Combined with the results of the above literature, it can be concluded that this test is more reliable with the static friction and rolling friction coefficient between soil and the rolling friction coefficient between soil and steel as the influencing parameters. When the coefficient of friction between the soil particles is larger, it will be subject to greater resistance when sliding down during the formation of the stacking angle, and it is not easy to fall and produce a downward trend. The increased rolling friction coefficient between soil and steel plate will impede the movement of the soil particles which are in contact with the plate. Therefore, the combined effect of the three would significantly change the soil stacking angle.
In recent years, many scholars have performed discrete element calibrations for adhesion between soil particles [25,26]. Bahrami et al. [13] used the hysteretic spring-linear cohesion contact model to investigate the plate sinkage test in cohesive soils, and the most affecting parameters governing the stress-sinkage behavior of the plate sinkage test were derived. Wu et al. [27] used uniaxial confined compression and unconfined for compressive strength tests to calibrate the DEM parameters. In addition, a penetration test and sweep cultivation test were used for verification. Xie et al. [28] also used the same test principle of unconfined compressive strength for the calibration of soil parameters. Most of the available studies were conducted using cylindrical specimens for compression to obtain the test results. In order to make the discrete element parameters of the soil blocks closer to the actual situation and to make the calibrated results a better guide for the discrete element simulation of soil-mechanical action during potato harvesting, the soil blocks obtained from field sampling were selected for shearing. The actual measurement should be repeated to ensure the accuracy of the test. Uniformity in the shape and size of the soil blocks is required. While the trimmed blocks were smaller in size, it was finally decided to calibrate with the maximum shear crushing force. The coefficient of variation of the shear crushing force was larger in the actual test. There might have been still some differences in the internal structure of the soil blocks. The internal pores and the water molecules in the soil [29] influence the adhesive attraction between soil particles. The test results found that the normal stiffness and tangential stiffness have a significant effect on the shear crushing force. Discrete element parameter calibration of soil mechanical properties by uniaxial compression was performed by Shi [30]. Both tangential stiffness and normal phase stiffness have an effect on the peak of the axial pressure curve, and both are positively correlated with the peak of the pressure curve. The results of their single-factor simulation tests are similar to those of this test.
It is important to know how to effectively remove the soil during mechanical potato harvesting. Research on soil for the harvest period is of interest for the design and optimization of digging mechanisms and potato–soil separation devices and other soil-touching components of harvesting machines. The key to ensuring the accuracy of the discrete element simulation test is that each parameter of the selected model is accurate and reliable. The soil stacking angle test can accurately obtain the soil intrinsic parameters and contact parameters, while the soil block shear crushing test can accurately obtain the parameters required for the bond model. This paper combined results of previous studies with actual measurements of basic physical properties of soil in the field during potato harvest. The parameters were calibrated by discrete element simulation. The results can provide effective support for discrete element simulation of potato harvesting equipment. The accuracy of the simulation model can be improved, but there are still some limitations. This test was conducted by hand excavation for soil sampling, which could be crushing the firmness of the soil in the field. Soil samples were relatively loose. The soil discrete element parameters obtained from the tests conducted in this way have little effect on the simulation model of the potato–soil separation and other mechanisms, but may have some effect on the excavation components. In addition, there is a wide range of soil types where potatoes can be grown. There are significant differences in soil viscosity and friction coefficient for different soil types. Soil properties in the field also vary somewhat for different water contents. Due to the limitations of the test conditions, this experiment was conducted only for sandy loam soil with a water content of 15.38%, and further studies will be conducted subsequently. In future research related to soil parameter calibration, it may be possible to consider launching relevant parameter calibration and research for multiple soil types which different crops are grown in and calibrate different periods such as sowing and harvesting periods separately to achieve accurate discrete element soil parameters for different applications scenarios. The database of discrete element soil parameters can be further enriched.

5. Conclusions

(1)
The distribution of soil grain size around potato tubers at the harvest period measured in the test was 54.66% for the size less than 4 mm, 19.88% between 4 and 7 mm, and 25.47% greater than 7 mm. The density of the soil was 1100 kg·m−3, and the moisture content was 15.38%. The mean value of the soil stacking angle was 25.73°. The mean value of the maximum shear crushing force of the block was 3.61 N.
(2)
Based on the discrete element simulation tests, it was determined that the Poisson’s ratio of the soil, shear modulus of the soil, coefficient of restitution between soil particles, coefficient of restitution between steel and soil, and coefficient of static friction between steel and soil had a small effect on the stacking angle. The values of each parameter were 0.3, 1 × 10⁶ Pa, 0.5, 0.16, and 0.6, respectively. The coefficient of static friction between the soil, coefficient of rolling friction between the soil, and coefficient of rolling friction between steel and soil had significant effects on the stacking angle. The response surface test was carried out, and the quadratic regression model was solved by using the actual test-measured stacking angle number as the target value. The coefficient of static friction between soil particles of 0.542, the coefficient of rolling friction between the soil of 0.213, and the coefficient of rolling friction between soil and steel of 0.336 were solved. Simulation tests were conducted with the optimized parameters, and the relative error between the simulation results and the actual measured values was 0.98%.
(3)
A simulation test of soil block shear crushing was established based on the additional Bond model. Simulation tests were performed for four bonding parameters: normal stiffness per unit area, shear stiffness per unit area, critical normal stress, and critical shear stress according to the response surface method. A quadratic regression model was developed with the actual measured values of shear crushing force as the target and optimized for a solution. The values of the four parameters were 2.86 × 10⁶ N·m−2, 1.64 × 10⁶ N·m−2, 2.42 × 10⁵ Pa, and 1.47 × 10⁵ Pa, respectively. The optimized parameters were tested in simulation, and the relative error between the simulation results and the actual measured values was 1.37%.
The test results can provide important support for the simulation test of discrete elements of soil-touching components such as the digging mechanism and the potato–soil separation mechanism in potato harvesting equipment, which can improve the accuracy and reliability of the simulation model. It can also provide some reference for the calibration of discrete elements of soil-related parameters. The results can further enrich the calibration methods and soil-related physical parameters and provide some reference for other research.

Author Contributions

Conceptualization, Y.L. and Z.H.; methodology, F.W.; software, Y.L. and J.F.; validation, W.L. and L.S.; formal analysis, Y.L.; investigation, Y.L.; resources, F.W.; data curation, J.F.; writing—original draft preparation, Y.L. and H.Y.; writing—review and editing, Y.L. and W.L.; visualization, Y.L.; supervision, Z.H.; project administration, Z.H.; funding acquisition, H.Y. and L.S. All authors have read and agreed to the published version of the manuscript.

Funding

This research was funded by the Central Public Interest Scientific Institution Basal Research Fund, grant number S202110-01, S202110-02, S202110-03.

Institutional Review Board Statement

Not applicable.

Informed Consent Statement

Not applicable.

Data Availability Statement

The data collected in this research are available when be required.

Conflicts of Interest

The authors declare no conflict of interest.

References

  1. Shi, G.; Li, J.; Ding, L.; Zhang, Z.; Ding, H.; Li, N.; Kan, Z. Calibration and Tests for the Discrete Element Simulation Parameters of Fallen Jujube Fruit. Agriculture 2022, 12, 38. [Google Scholar] [CrossRef]
  2. Shi, S.; Gao, L.; Cai, X.; Yin, H.; Wang, X. Effect of tamping operation on mechanical qualities of ballast bed based on DEM-MBD coupling method. Comput. Geotech. 2020, 124, 103574. [Google Scholar] [CrossRef]
  3. Nigmetova, A.; Masi, E.; Simonin, O.; Dufresne, Y.; Moureau, V. Three-dimensional DEM-CFD simulation of a lab-scale fluidized bed to support the development of two-fluid model approach. Int. J. Multiphas. Flow 2022, 156, 104189. [Google Scholar] [CrossRef]
  4. Cheng, H.; Shuku, T.; Thoeni, K.; Yamamoto, H. Probabilistic calibration of discrete element simulations using the sequential quasi-Monte Carlo filter. Granul. Matter 2018, 20, 11. [Google Scholar] [CrossRef]
  5. Zhao, H.; Huang, Y.; Liu, Z.; Liu, W.; Zheng, Z. Applications of Discrete Element Method in the Research of Agricultural Machinery: A Review. Agriculture 2021, 11, 425. [Google Scholar] [CrossRef]
  6. Li, J.; Jiang, X.; Ma, Y.; Tong, J.; Hu, B. Bionic design of a potato digging shovel with drag reduction based on the discrete element method (DEM) in clay soil. Appl. Sci. 2020, 10, 7096. [Google Scholar] [CrossRef]
  7. Fang, W.; Wang, X.; Han, D.; Chen, X. Review of Material Parameter Calibration Method. Agriculture 2022, 12, 706. [Google Scholar] [CrossRef]
  8. Liu, W.; He, J.; Li, H.; Li, X.; Zheng, K.; Wei, Z. Calibration of Simulation Parameters for Potato Minituber Based on EDEM. Trans. Chin. Soc. Agric. Mach. 2018, 49, 125–135. [Google Scholar]
  9. Yu, Q.; Liu, Y.; Chen, X.; Sun, K.; Lai, Q. Calibration and Experiment of Simulation Parameters for Panax notoginseng Seeds Based on DEM. Trans. Chin. Soc. Agric. Mach. 2020, 51, 123–132. [Google Scholar]
  10. Liu, F.; Zhang, J.; Li, B.; Chen, J. Calibration of parameters of wheat required in discrete element method simulation based on repose angle of particle heap. Trans. Chin. Soc. Agric. Eng. 2016, 32, 247–253. [Google Scholar]
  11. Ma, W.; You, Y.; Wang, D.; Yin, S.; Huan, X. Parameter Calibration of Alfalfa Seed Discrete Element Model Based on RSM and NSGA-Ⅱ. Trans. Chin. Soc. Agric. Mach. 2020, 51, 136–144. [Google Scholar]
  12. Horabik, J.; Wiącek, J.; Parafiniuk, P.; Bańda, M.; Kobyłka, R.; Stasiak, M.; Molenda, M. Calibration of discrete-element- method model parameters of bulk wheat for storage. Biosyst. Eng. 2020, 200, 298–314. [Google Scholar] [CrossRef]
  13. Bahrami, M.; Naderi-Boldaji, M.; Ghanbarian, D.; Ucgul, M.; Keller, T. Simulation of plate sinkage in soil using discrete element modelling: Calibration of model parameters and experimental validation. Soil Tillage Res. 2020, 203, 104700. [Google Scholar] [CrossRef]
  14. Liu, H.; Zhang, W.; Ji, Y.; Qi, B.; Li, K. Parameter calbration of soil particles in annual rice-wheat region based on discrete element method. J. Chin. Agric. Mechanizat. 2020, 41, 153–159. [Google Scholar]
  15. Wu, T.; Huang, W.; Chen, X.; Ma, X.; Han, Z.; Pan, T. Calibration of discrete element model parameters for cohesive soil considering the cohesion between particles. J. South China Agric. Univ. 2017, 38, 93–98. [Google Scholar]
  16. Shi, L.; Zhao, W.; Sun, W. Parameter calibration of soil particles contact model of farmland soil in northwest arid region based on discrete element method. Trans. Chin. Soc. Agric. Eng. 2017, 33, 181–187. [Google Scholar]
  17. Han, S.; Qi, J.; Kan, Z.; Li, Y.; Meng, H. Parameters Calibration of Discrete Element for Deep Application of Bulk Manure in Xinjiang Orchard. Trans. Chin. Soc. Agric. Mach. 2021, 52, 101–108. [Google Scholar]
  18. Liao, Y.; Liao, Q.; Zhou, Y.; Wang, Z.; Jiang, Y.; Liang, F. Parameters Calibration of Discrete Element Model of Fodder Rape Crop Harvest in Bolting Stage. Trans. Chin. Soc. Agric. Mach. 2020, 51, 73–82. [Google Scholar]
  19. Ji, L.; Xie, H.; Yang, H.; Wei, H.; Yan, J.; Shen, H. Simulation analysis of potato drysoil cleaning device based on EDEM-Recurdyn coupling. J. Chin. Agric. Mechanizat. 2021, 42, 109–115. [Google Scholar]
  20. Fan, Y. Research on Potato Digging Mechanism Based on Discrete Element Method and Design of Bionic Shovel. Ph.D. Thesis, Shenyang Agricultural University, Shenyang, China, 2020. [Google Scholar]
  21. Zhao, J. Simulation and Experimental Investigation of Potato Digging Shovel Working Resistance Based on Discrete Element Method. Master’s Thesis, Shenyang Agricultural University, Shenyang, China, 2017. [Google Scholar]
  22. Wei, Z.; Su, G.; Li, X.; Wang, F.; Sun, C.; Meng, P. Parameter optimization and Test of Potato Harvester Wavy Sieve Based on EDEM. Trans. Chin. Soc. Agric. Mach. 2020, 51, 109–122. [Google Scholar]
  23. Wang, X.; Hu, H.; Wang, Q.; Li, H.; He, J.; Chen, W. Calibration Method of Soil Contact Characteristic Parameters Based on DEM Theory. Trans. Chin. Soc. Agric. Mach. 2017, 48, 78–85. [Google Scholar]
  24. Hao, J.; Wei, W.; Huang, P.; Qin, J.; Zhao, J. Calibration and experimental verification of discrete element parameters of oil sunflower seeds. Trans. Chin. Soc. Agric. Eng. 2021, 37, 36–44. [Google Scholar]
  25. De Pue, J.; Di Emidio, G.; Verastegui Flores, R.D.; Bezuijen, A.; Cornelis, W.M. Calibration of DEM material parameters to simulate stress-strain behaviour of unsaturated soils during uniaxial compression. Soil Tillage Res. 2019, 194, 104303. [Google Scholar] [CrossRef]
  26. De Pue, J.; Lamandé, M.; Cornelis, W. DEM simulation of stress transmission under agricultural traffic Part 2: Shear stress at the tyre-soil interface. Soil Tillage Res. 2020, 203, 104660. [Google Scholar] [CrossRef]
  27. Wu, Z.; Wang, X.; Liu, D.; Xie, F.; Ashwehmbom, L.G.; Zhang, Z.; Tang, Q. Calibration of discrete element parameters and experimental verification for modelling subsurface soils. Biosyst. Eng. 2021, 212, 215–227. [Google Scholar] [CrossRef]
  28. Xie, F.; Wu, Z.; Wang, X.; Liu, D.; Wu, B.; Zhang, Z. Calibration of discrete element parameters of soils based on unconfinedcompressive strength test. Trans. Chin. Soc. Agric. Eng. 2020, 36, 39–47. [Google Scholar]
  29. Li, B. Reducing Force and Tillage Performance of a Subsoiler Based on the Discrete Element Method. Ph.D. Thesis, Northwest A&F University, Yangling, China, 2016. [Google Scholar]
  30. Shi, L.; Wu, J.; Zhao, W.; Sun, W.; Zhang, F.; Sun, B. Establish ment and parameter verification of farmland soil model in uniaxial compression based on discrete element method. J. China Agric. Univ. 2015, 20, 174–182. [Google Scholar]
Figure 1. Sampling location for test soil.
Agriculture 12 01475 g001
Figure 2. The front view direction of the soil stacking angle.
Agriculture 12 01475 g002
Figure 3. Simulation model of the soil stacking angle.
Agriculture 12 01475 g003
Figure 4. Image processing and fitting process of stacking angle. (a) The result of the soil stacking angle obtained from the test. (b) The result of the stacking angle after image processing. (c) The result of curve fitting after boundary extraction.
Agriculture 12 01475 g004
Figure 5. The soil block shear crushing test.
Agriculture 12 01475 g005
Figure 6. Discrete element simulation model of soil block shear crushing.
Agriculture 12 01475 g006
Figure 7. Effect of the interaction between factors on the degree of stacking angles: (a) response surface under factors X4 and X8; (b) response surface under factors X5 and X8.
Agriculture 12 01475 g007
Figure 8. Effect of the interaction between factors on the maximum crushing force: (a) response surface under factors X11 and X10; (b) response surface under factors X10 and X12; and (c) response surface under factors X11 and X12.
Agriculture 12 01475 g008
Table 1. Test factors and levels.
ParameterValueParameterValue
Density of the soil/kg·m−31100Density of the steel/kg·m−37810
Poisson’s ratio of the soil0.20~0.40Poisson’s ratio of the steel0.30
Shear modulus of the soil/Pa0.80~1.20 × 106Shear modulus of the steel/Pa8.01 × 1010
Coefficient of Restitution between the soil0.10~0.90Coefficient of Restitution between steel and soil0.08~0.24
Coefficient of Static Friction between the soil0.25~0.65Coefficient of Static Friction between steel and soil0.40~0.80
Coefficient of Rolling Friction between the soil0.10~0.30Coefficient of Rolling Friction between steel and soil0.25~0.45
Table 2. The Code table of Regular Two-Level Factorial Design experiment.
ParameterValue
−1 (Low Level)+1 (High Level)
Intrinsic parametersPoisson’s ratio of the soil X10.200.40
Shear modulus of the soil X2/Pa8.00 × 1051.20 × 106
Contact parametersCoefficient of Restitution between the soil X30.100.90
Coefficient of Static Friction between the soil X40.250.65
Coefficient of Rolling Friction between the soil X50.100.30
Coefficient of Restitution between steel and soil X60.080.24
Coefficient of Static Friction between steel and soil X70.400.80
Coefficient of Rolling Friction between steel and soil X80.250.45
Table 3. The Code table of soil block shear crushing response surface test.
The Bonding ParametersValue
−101
Normal stiffness per unit area between the soil X9/N·m−22.00 × 1062.50 × 1063.00 × 106
Shear stiffness per unit area between the soil X10/N·m−21.25 × 1061.50 × 1061.75 × 106
Critical normal stress between the soil X11/Pa2.00 × 1052.25 × 1052.50 × 105
Critical shear stress between the soil X12/Pa1.00 × 1051.50 × 1052.00 × 105
Table 4. Regular Two-Level Factorial Design and Experiment Results.
No.X1X2X3X4X5X6X7X8Stacking Angle/°
10.200.800.900.650.300.080.400.4530.92
20.401.200.100.250.100.240.800.2514.31
30.201.200.100.650.300.080.800.2524.78
40.200.800.100.250.100.080.400.2513.83
50.201.200.100.250.300.240.400.4519.23
60.401.200.900.650.300.240.800.4529.71
70.400.800.900.650.100.080.800.2515.65
80.201.200.900.250.100.080.800.4515.36
90.201.200.900.650.100.240.400.2517.88
100.401.200.900.250.300.080.400.2515.12
110.200.800.900.250.300.240.800.2515.66
120.400.800.100.650.300.240.400.2523.19
130.400.800.100.250.300.080.800.4519.24
140.200.800.100.650.100.240.800.4518.41
150.401.200.100.650.100.080.400.4518.66
160.400.800.900.250.100.240.400.4517.29
Table 5. The effects analysis of the experimental results.
TermStdized EffectSum of SquaresContributionOrder of the Significance
X1−0.360.530.13%6
X20.110.050.01%8
X30.742.210.54%4
X46.15151.0436.82%1
X55.81134.9132.89%2
X60.270.280.07%7
X7−0.380.560.14%5
X83.5550.4112.29%3
Table 6. The steepest ascent test and the results.
No.X4X5X8Stacking Angle/°Relative Error
10.250.100.2515.9937.87%
20.350.150.3020.6719.68%
30.450.200.3523.807.49%
40.550.250.4028.8912.25%
50.650.300.4533.1528.84%
Table 7. The stacking angle response surface test and results.
No.X4X5X8Y1/°
10.550.200.3024.98
20.450.200.3524.88
30.450.200.3524.42
40.550.200.4024.66
50.350.150.3520.01
60.550.150.3521.57
70.450.150.4020.49
80.450.200.3524.59
90.450.150.3020.88
100.550.250.3527.16
110.450.250.3025.98
120.450.250.4028.91
130.350.200.4024.15
140.350.200.3021.07
150.350.250.3527.02
160.450.200.3525.97
170.450.200.3524.57
Table 8. Variance analysis of the stacking angle test regression model.
SourceSum of SquaresdfMean SquareF-Valuep-ValueSignificant
Model103.26911.4730.70<0.0001**
X44.6814.6812.530.0095**
X585.28185.28228.17<0.0001**
X83.5113.519.390.0182*
X4X50.5010.50411.350.2836
X4X82.8912.897.730.0273*
X5X82.7612.767.370.0300*
X421.7711.774.730.0661
X520.3710.371.000.3505
X821.1511.153.080.1226
Residual2.6270.37
Lack of Fit1.0430.350.880.5247
Pure Error1.5840.39
Cor Total105.8816
Note: p < 0.01 (highly significant, **), p < 0.05 (significant, *).
Table 9. The soil blocks shear response surface test and results.
No.X9/106 N·m−2X10/106 N·m−2X11/105 PaX12/105 PaY2/N
13.001.752.501.004.18
22.501.502.251.503.10
32.001.752.502.003.07
42.501.502.251.503.15
52.001.252.501.002.61
62.501.502.250.503.11
72.501.002.251.503.01
83.001.252.002.003.57
92.001.252.002.002.78
102.501.502.251.503.12
112.501.502.751.503.13
123.001.752.002.003.71
132.001.252.502.002.63
143.001.252.502.003.23
152.001.752.002.003.07
162.501.502.251.503.15
173.001.252.001.003.23
182.001.252.001.002.63
192.501.501.751.503.12
202.502.002.251.503.78
212.001.752.001.003.18
223.001.252.501.003.33
233.001.752.001.003.80
242.501.502.251.503.26
253.001.752.502.003.80
262.001.752.501.003.20
272.501.502.252.503.27
281.501.502.251.502.55
293.501.502.251.503.80
302.501.502.251.503.22
Table 10. Variance analysis of the soil block shear test regression model.
SourcedfMean SquareF-Valuep-ValueSignificant
Model140.3139.85<0.0001**
X912.80356.60<0.0001**
X1011.27162.50<0.0001**
X1110.000.050.8314
X1210.000.000.9494
X9X1010.000.550.4709
X9X1110.011.180.2954
X9X1210.000.210.6500
X10X1110.056.480.0223**
X10X1210.089.750.0070**
X11X1210.056.170.0253**
X9210.000.150.7034
X10210.1113.580.0022**
X11210.000.130.7249
X12210.000.430.5228
Residual150.01
Lack of Fit100.012.710.1418
Pure Error50.00
Cor Total29
Note: p < 0.01 (highly significant, **).
Publisher’s Note: MDPI stays neutral with regard to jurisdictional claims in published maps and institutional affiliations.

