Article

Effects of Organic Fertilization Rates on Surface Water Nitrogen and Phosphorus Concentrations in Paddy Fields

Nanjing Institute of Environmental Science, Ministry of Ecology and Environment, Nanjing 210042, China
*
Author to whom correspondence should be addressed.
Agriculture 2022, 12(9), 1466; https://doi.org/10.3390/agriculture12091466
Submission received: 23 August 2022 / Revised: 9 September 2022 / Accepted: 12 September 2022 / Published: 14 September 2022
(This article belongs to the Special Issue Soil Sustainability and Fertility Enhancement)

Abstract

:
Inappropriate organic fertilizer application may cause serious environmental risks, especially nitrogen (N) and phosphorus (P) losses. To achieve a win–win for high yield and environmental protection in organic agriculture, it was essential to demonstrate the relationship between the organic fertilizer input, rice yields, and risks of N and P losses. Based on a rice and green manure cropping rotation field experiment in the Yangtze River Delta of China, the effects of organic fertilization rates on the dynamics of surface water N and P concentrations and rice grain yields were determined. The results showed that the N (total N, ammonium-nitrogen, nitrate-nitrogen) and P (total P and dissolved P) concentrations in surface water immediately and greatly reached the highest values 1 day after basal fertilization and topdressing fertilization. Then, the N and P concentrations sharply decreased and were maintained at a relatively low level. The initial 3 and 7 days after organic fertilization were the high-risk periods for controlling N and P runoff losses. The surface water N and P concentrations had a positive correlation with the organic fertilization rate in high-risk periods. Besides, the effects of organic fertilization on surface water P concentrations existed longer than those of N concentrations. The rice grain yields increased with the increase in organic fertilization rates, but high organic fertilizer input (>225 kg N per hectare) did not increase the grain yield. Meanwhile, the high organic fertilizer input had the highest risks for N and P losses. Therefore, in organic rice farming, organic fertilization rates with 150~200 kg N per hectare are the optimal organic fertilizer input, with relatively high grain yields and low N and P losses.

1. Introduction

Agricultural non-point-source pollution has become a major factor for surface water and groundwater pollution in China [1]. Nitrogen (N) and phosphorus (P) losses from agricultural systems to the surrounding water bodies are serious threats to the water quality and atmosphere environment, causing eutrophication and environmental deterioration [2,3]. In 2010–2014, the average rate of anthropogenic N discharge to fresh water was 14.5 ± 3.1 megatons per year in China, which was about 2.7-fold more than the estimated ‘safe’ N discharge threshold (5.2 ± 0.7 megatons of N per year) [4]. Among them, agricultural systems from croplands are responsible for about 35%. Likewise, P runoff and leaching losses from croplands to freshwaters were also sizable [5]. Rice is one of the most important cereal crops, and rice yields have increased substantially in China during the past six decades [6]. The increased rice yield in China was largely dependent on heavy investments in fertilizers. However, current excessive fertilizer application did not significantly increase crop yields, but led to a larger N and P discharge into the environment [7,8]. Environmental problems induced by the overuse of fertilizers also take place in the Yangtze River Delta of China [2]. Paddy fields are one of the main sources of nutrient losses in this region, owing to the excessive input of chemical and organic fertilizers, alternating flooding, and draining management in this area [9,10]. Thus, these regions, with their large anthropogenic N and P emissions and dense water networks, are at high risk for ecosystem damage [4,5]. The periphytic algae community structure, a health indicator for ecosystems, at inflow rivers in this area also revealed that N and P were the driving environment variables at the basin scale [11].
Organic agriculture has developed rapidly in China over the past three decades due to the increasing domestic and international demand for organic products [12]. The application of manure-based compost in agricultural land not only solves environmental problems produced by large amounts of manure [13], but also recycles valuable nutrients and improves the soil nutrient balance and soil structure [14]. More importantly, organic farming practices often improve food safety and quality, reduce nutrient losses [15], and enhance biodiversity [16]. Compared to conventional farming systems, organic farming systems reduce the need for inorganic fertilizer [17] and N or P losses through surface runoff [3,18]. China’s “14th Five-Year Plan”, a road map for the nation’s development from 2021–2025, still focuses on strengthening the protection and utilization of agricultural resources, the prevention and control of agricultural non-point-source pollution, the protection and restoration of agricultural ecology, and building a green and low-carbon agricultural industrial chain. Manure is one of the main sources of N and P runoff losses [19], and organic farming systems still have eutrophication potential and acidification potential. N and P runoff losses are influenced by several factors, such as soil, climate (rainfall regimes) [10], and agricultural practices [20]. Among them, the fertilization rate is a key factor. It was demonstrated in the subtropical hilly region of China that N and P runoff losses increased significantly with increased chemical fertilization rates [21]. However, less information is available about the correlation between the organic fertilization rate and the environmental impact. In developing organic farming systems, a reasonable organic fertilization rate is vital to produce high yields with low negative environmental impacts.
Paddy fields can serve as a sink for N and P, including through the harvesting of crops, denitrification, and storage in agricultural soils, but paddy fields with higher fertilizers and improper water management become a potential source for pollution. As paddy fields are ponded water on the soil’s surface, N and P losses predominantly occur through surface runoff rather than leaching, due to a plow pan that prevents downward water infiltration [10,22]. Thus, monitoring N and P status in the surface water is of great importance for the assessment and control of N and P runoff losses from paddy fields [23,24]. Wang et al. studied the surface water P dynamics under two application rates of P fertilizer and one rate of combined fertilizer and manure P [25]. The total P and dissolved P in the surface water significantly increased with the increased P application, especially during the first two weeks. Recently, Liu et al. reported that the paddy water N and P concentrations were reported to be negatively correlated with the number of days after chemical fertilizer application [21]. The paddy water N and P concentrations rapidly reached the highest peak, and then decreased within 5–10 days and 5–15 days after fertilizer application. So, the periods entail high risks for N and P losses. Organic fertilizer applications have been accepted as an economic solution to maintain yields and relieve environmental pressure. Nowadays, organic farming systems are common in the Yangtze River Delta of China [26]. In our previous study, it was shown that compared to chemical fertilizer, organic fertilizer could reduce N losses by 19–54% [27]. Several previous studies have compared the differences in N and P losses between conventional chemical fertilizers and organic fertilizer applications [21,25]. Nevertheless, the effects of organic fertilization rates on the environmental risks of N and P losses are still poorly understood. Thus, it is necessary to clarify the relationship between organic fertilizer inputs, rice yields, and risk for N and P losses. These results could provide a theoretical basis for the rational application of organic fertilizers to achieve a win–win situation of high yields and environmental protection in organic agriculture.
In this study, we investigate the effects of organic fertilization rates on the dynamic changes of the N and P concentrations in paddy field surface water in Jiangsu Province of the Yangtze River Delta. The surface water N and P changes would provide some references for the optimized organic fertilization strategy to achieve a high grain yield with low risks of N and P losses from paddy fields.

2. Materials and Methods

2.1. Site Description

A two-year (2017–2018) field experiment was conducted in an organic farm at Yaxi town, Gaochun District, Nanjing, Jiangsu Province, China (31°26′31″ N, 119°8′52″ E). The site is located in one of the most important rice-planting areas of China, the Yangtze River Delta. The local climate is the typical subtropical humid monsoon, with a mean annual temperature of 15.9 °C, mean annual precipitation of 1157 mm, and a mean sunshine duration of more than 1973 h. The wettest months were from June to August. The slope of this region is gentle (1°). The daily mean temperature and mean precipitation during the experimental period in 2017 and 2018 are shown below.
The experimental hydromorphic paddy soil has a silty clay loam texture. Before the experiment, the topsoil properties measured at a depth of 0–20 cm were as follows: pH 6.82, electrical conductivity 0.10 dS m−1, organic matter 24.44 g kg−1, total N (TN) 1.47 g kg−1, total P (TP) 0.54 g kg−1, Olsen-P 20.44 mg kg−1, and available potassium (AK) 107.25 mg kg−1.

2.2. Experiment Design

The experimental design consisted of a completely randomized block with 15 plots (5 treatments × 3 replicates, plot area 8.0 m × 5.0 m). Each plot was enclosed with a field bund up to a height of 0.30 m. The anti-seepage film was inserted in soils down to a depth of 1.0 m at the edges of the bunds to prevent surface and lateral water movement. All plots were separated by 1.0 m to avoid edge effects. In each plot, the rice was cultivated with flat-plot planting without ridges.
The organic fertilizer used in this study was swine-manure-based compost, which was purchased from a commercial organic fertilizer company, Jiangyin Lianye Bioscience & Biotechnology Co., Ltd., China. This compost, developed by Nanjing Agricultural University, was produced by composting swine manure by solid-state fermentation with the inoculation of Bacillus amyloliquefaciens [28,29]. The compost after fermentation reached the content of N + P2O5 + K2O = 8%, effective living bacteria ≥20 million g−1, and organic matter ≥20%. The chemical characteristics of the organic fertilizer were further determined as follows: organic matter 337.44 g kg−1, TN 30.25 g kg−1, TP 28.30 g kg1, total potassium (TK) 20.26 g kg−1, and pH 6.61. Treatments included five organic fertilization rates. Organic fertilizer applied at rates of 2.5, 5, 7.5, and 10 tons per hectare (ha−1) had N contents of 75, 150, 225, and 300 kg N ha−1, respectively (named N75, N150, N225, and N300). No fertilizer treatment (named N0) was used as the control.
Rice and green manure cropping rotations were used in this experiment. Chinese milk vetch (Astragalus sinicus L.) was used as the green manure for its adaptability to cold and wet paddy soil systems. Ten days before the harvest of rice (in October), equal amounts of Chinese milk vetch seeds were spread onto each plot. One month before rice transplanting (in May), fresh vetch straw from each plot was returned to the original plots by mixing the plot mechanically at a depth of 20 cm in the surface soil, and then flooding it to a depth of 5 cm. The rice growing season is from June to October, and the milk vetch growing season is from October to May in the following year. The rice used was a Japonica rice (Oryza sativa L.) variety, “Nanjing 46”, which was widely cultivated in the Yangtze River Delta of China. The rice transplanting date was carried out 1 day after basal fertilization (BF) on 22 June 2017 and 15 June 2018, according to the rice cultivar used and the local producer’s recommendation. Organic fertilizer was applied in two splits. Sixty percent of the organic fertilizer was applied as basal fertilizer on 21 June 2017 and 14 June 2018, and the remaining forty percent was used as the topdressing fertilizer at the panicle initiation stage on 9 August 2017 and 2 August 2018. At harvest (31 October 2017, and 24 October 2018), the crop grain in each field plot was sampled and air-dried to determine the grain yield. The water level was maintained at about 5 cm in each plot by regular irrigation. Plots were drained when the water depth exceeded 10 cm after rainfall. Other agricultural practices remained the same as the local agronomic practices.

2.3. Sampling and Chemical Analysis of Surface Water in the Paddy Fields

The surface water covering the paddy fields from each plot was carefully collected in new polystyrene tubes. To avoid disturbance of the surface water, the sampling tubes tied to a long stick dipped gently into the surface water. Each composite surface water sample consisted of 3 samples taken randomly at 9:00 a.m. Surface water samples were collected 1, 3, 5, 7, and 9 days after BF and topdressing fertilization (TF). Besides, we collected the surface water samples at the tillering stage (24 days after BF), elongation stage (1 day after BF), booting stage (28 days after TF), and heading stage (44 days after TF). Surface water samples were timely homogenized and stored at −18 °C until analysis.
Concentrations of TN, ammonium-nitrogen (NH4+-N), and nitrate-nitrogen (NO3-N) in surface water were determined using a continuous flow AutoAnalyzer (AA3, Bran and Luebbe, Germany) after digestion with a K2S2O8-NaOH solution. The concentrations of TP and dissolved P (PO43–-P) in surface water were measured using the molybdenum blue method [30] by a spectrophotometer (SpectraMax Plus 384, Molecular Devices, San Jose, CA, USA) after digestion with a K2S2O8 solution. Surface water samples were filtered through 0.45 μm membrane filters before the determination of the NH4+-N, NO3-N, and PO43–-P concentrations, while no filtration was needed when the TN and TP concentrations were measured.

2.4. Statistical Analysis

Data represent means ± standard deviations (SD) of three biological replicates. Data were statistically analyzed using a two-way analysis of variance (ANOVA) followed by the least significant difference (LSD) multiple range test (p < 0.05). The relationship between surface water N and P concentrations and the days after BF or TF was fitted using an exponential function. Pearson’s correlation coefficients were used to test the relationships between organic fertilization rates and surface water N and P concentrations. All statistical analyses were performed using SPSS statistics 22.0 (IBM Corporation, New York, NY, USA).

3. Results

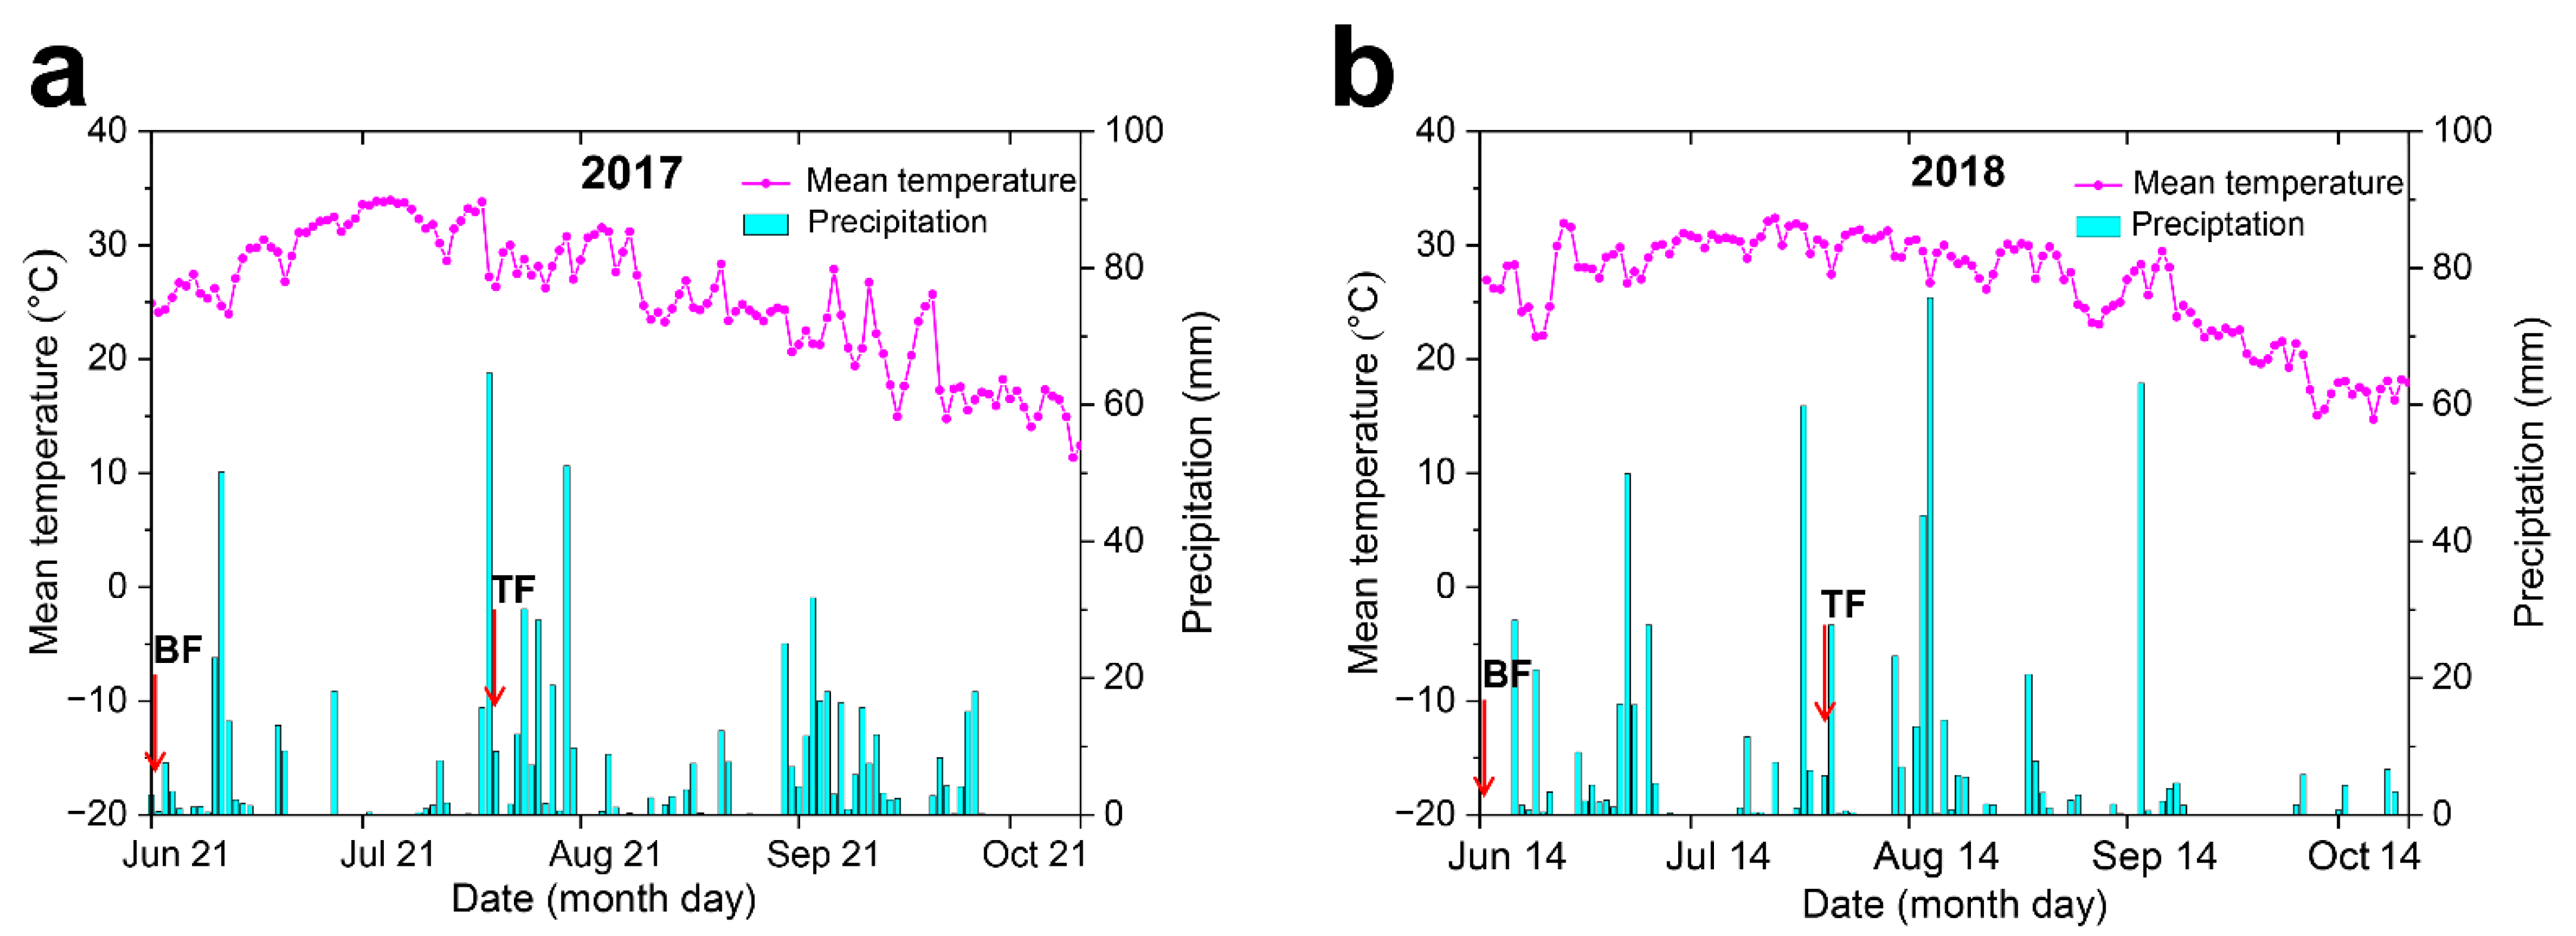
3.1. Temperature and Rainfall in the Rice-Growing Season

Temperature conditions in the rice-growing season in 2017 and 2018 were similar in the experimental region. The average temperature in this period was 25.4 °C in 2017 and 26.3 °C in 2018 (Figure 1). However, the rain events were more intense and frequent in 2017 compared with 2018. The total rainfall depth in the rice-growing season in 2017 was 700 mm, much higher than that in 2018 (643 mm). In addition, 23 rainfall events (rainfall intensity >10 mm/d) occurred in 2017, while only 16 rainfall events occurred in 2018.

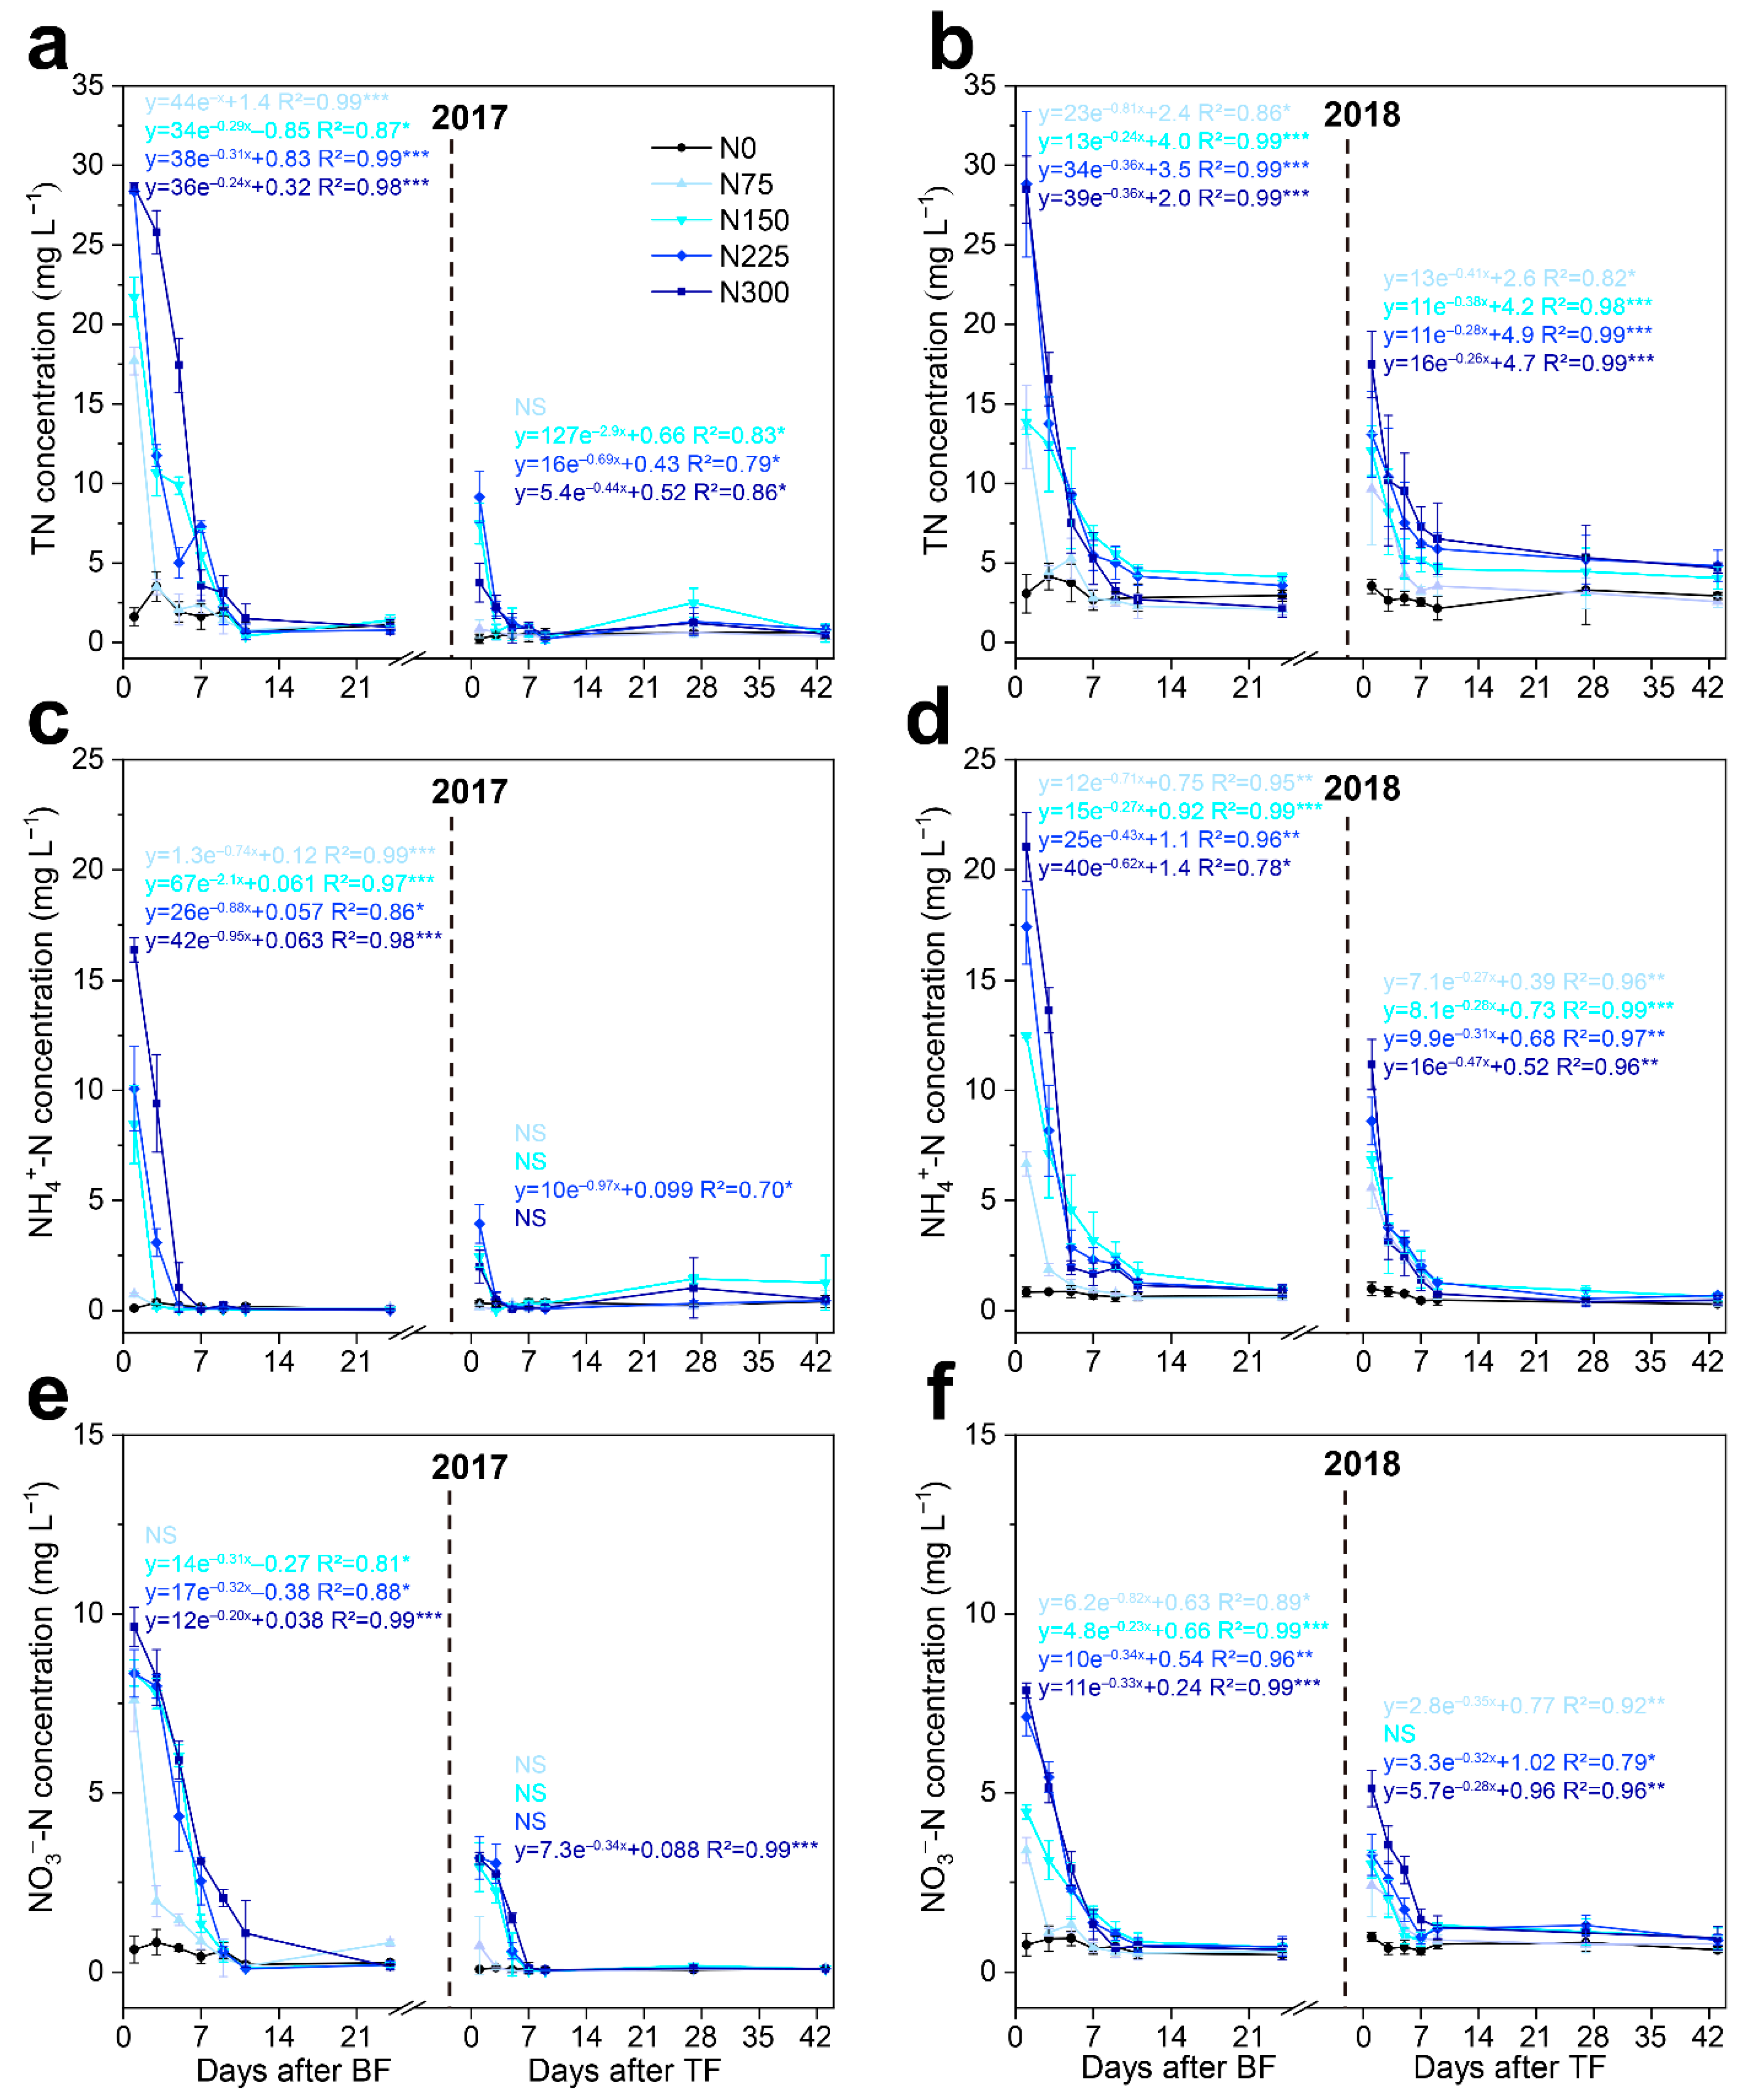
3.2. Dynamics of N Concentrations in Surface Water under Different Organic Fertilization Rates

Dynamics of TN, NH4+-N, and NO3-N concentrations in surface water displayed a similar pattern under organic fertilizer applications in the two-year field experiments. (Figure 2). Without organic fertilizer application (N0), the TN, NH4+-N, and NO3-N concentrations were relatively low and stable in the range of 0.23−4.2 mg L1, 0.10−0.98 mg L−1, and 0.07−0.93 mg L−1, respectively. In contrast, the N concentrations in surface water were severely influenced by the organic fertilizer application. One day after BF, the TN, NH4+-N, and NO3-N concentrations in surface water all quickly reached the highest values regardless of fertilization rates. The surface water TN concentrations were 17.71, 21.72, 28.36, and 28.65 m L−1 under N75, N150, N225, and N300, respectively. The values were 11.0 to 17.8-fold higher than that under the N0 treatment. Similarly, the NH4+-N and NO3-N concentrations on that day were all much higher than those in the N0 treatment. One day after TF, the N concentrations in the surface water reached the other peak. The N concentrations in the surface water began to decrease from 1 day after BF and TF. These N concentrations reached the low values and kept stable in the successive 3−11 days. Under organic fertilization applications, a significant exponential relationship could be observed between the surface water N concentrations and time after BF or TF in the majority of treatments from 2017−2018. Both NH4+-N and NO3-N were the main components of TN for all treatments. However, the drops of NH4+-N concentrations were faster than those of TN and NO3-N concentrations under organic fertilizer applications.

3.3. Dynamics of P Concentrations in Surface Water under Different Organic Fertilization Rates

Dynamics of TP and PO43–-P concentrations in surface water showed a similar pattern to those of N concentrations (Figure 3). The TP and PO43–-P concentrations immediately reached the highest values 1 day after BF and TF. Under the highest organic fertilizer input (N300), the TP and PO43–-P concentrations also reached the highest values (12.5−14 mg L−1), while these values without organic fertilizer inputs were only 0.16−0.25 mg L−1. Then, the TP and PO43–-P concentrations in surface water sharply declined. The TP and PO43–-P concentrations stayed stable at a low level 3–7 days after BF. The decrease in TP and PO43–-P concentrations after BF was quicker than that after TP. The significant exponential relationship between TP and PO43–-P concentrations in surface water and time after BF or TF were also obtained under organic fertilizer applications. In our study, the PO43–-P was the main component of TP, accounting for more than 55%.

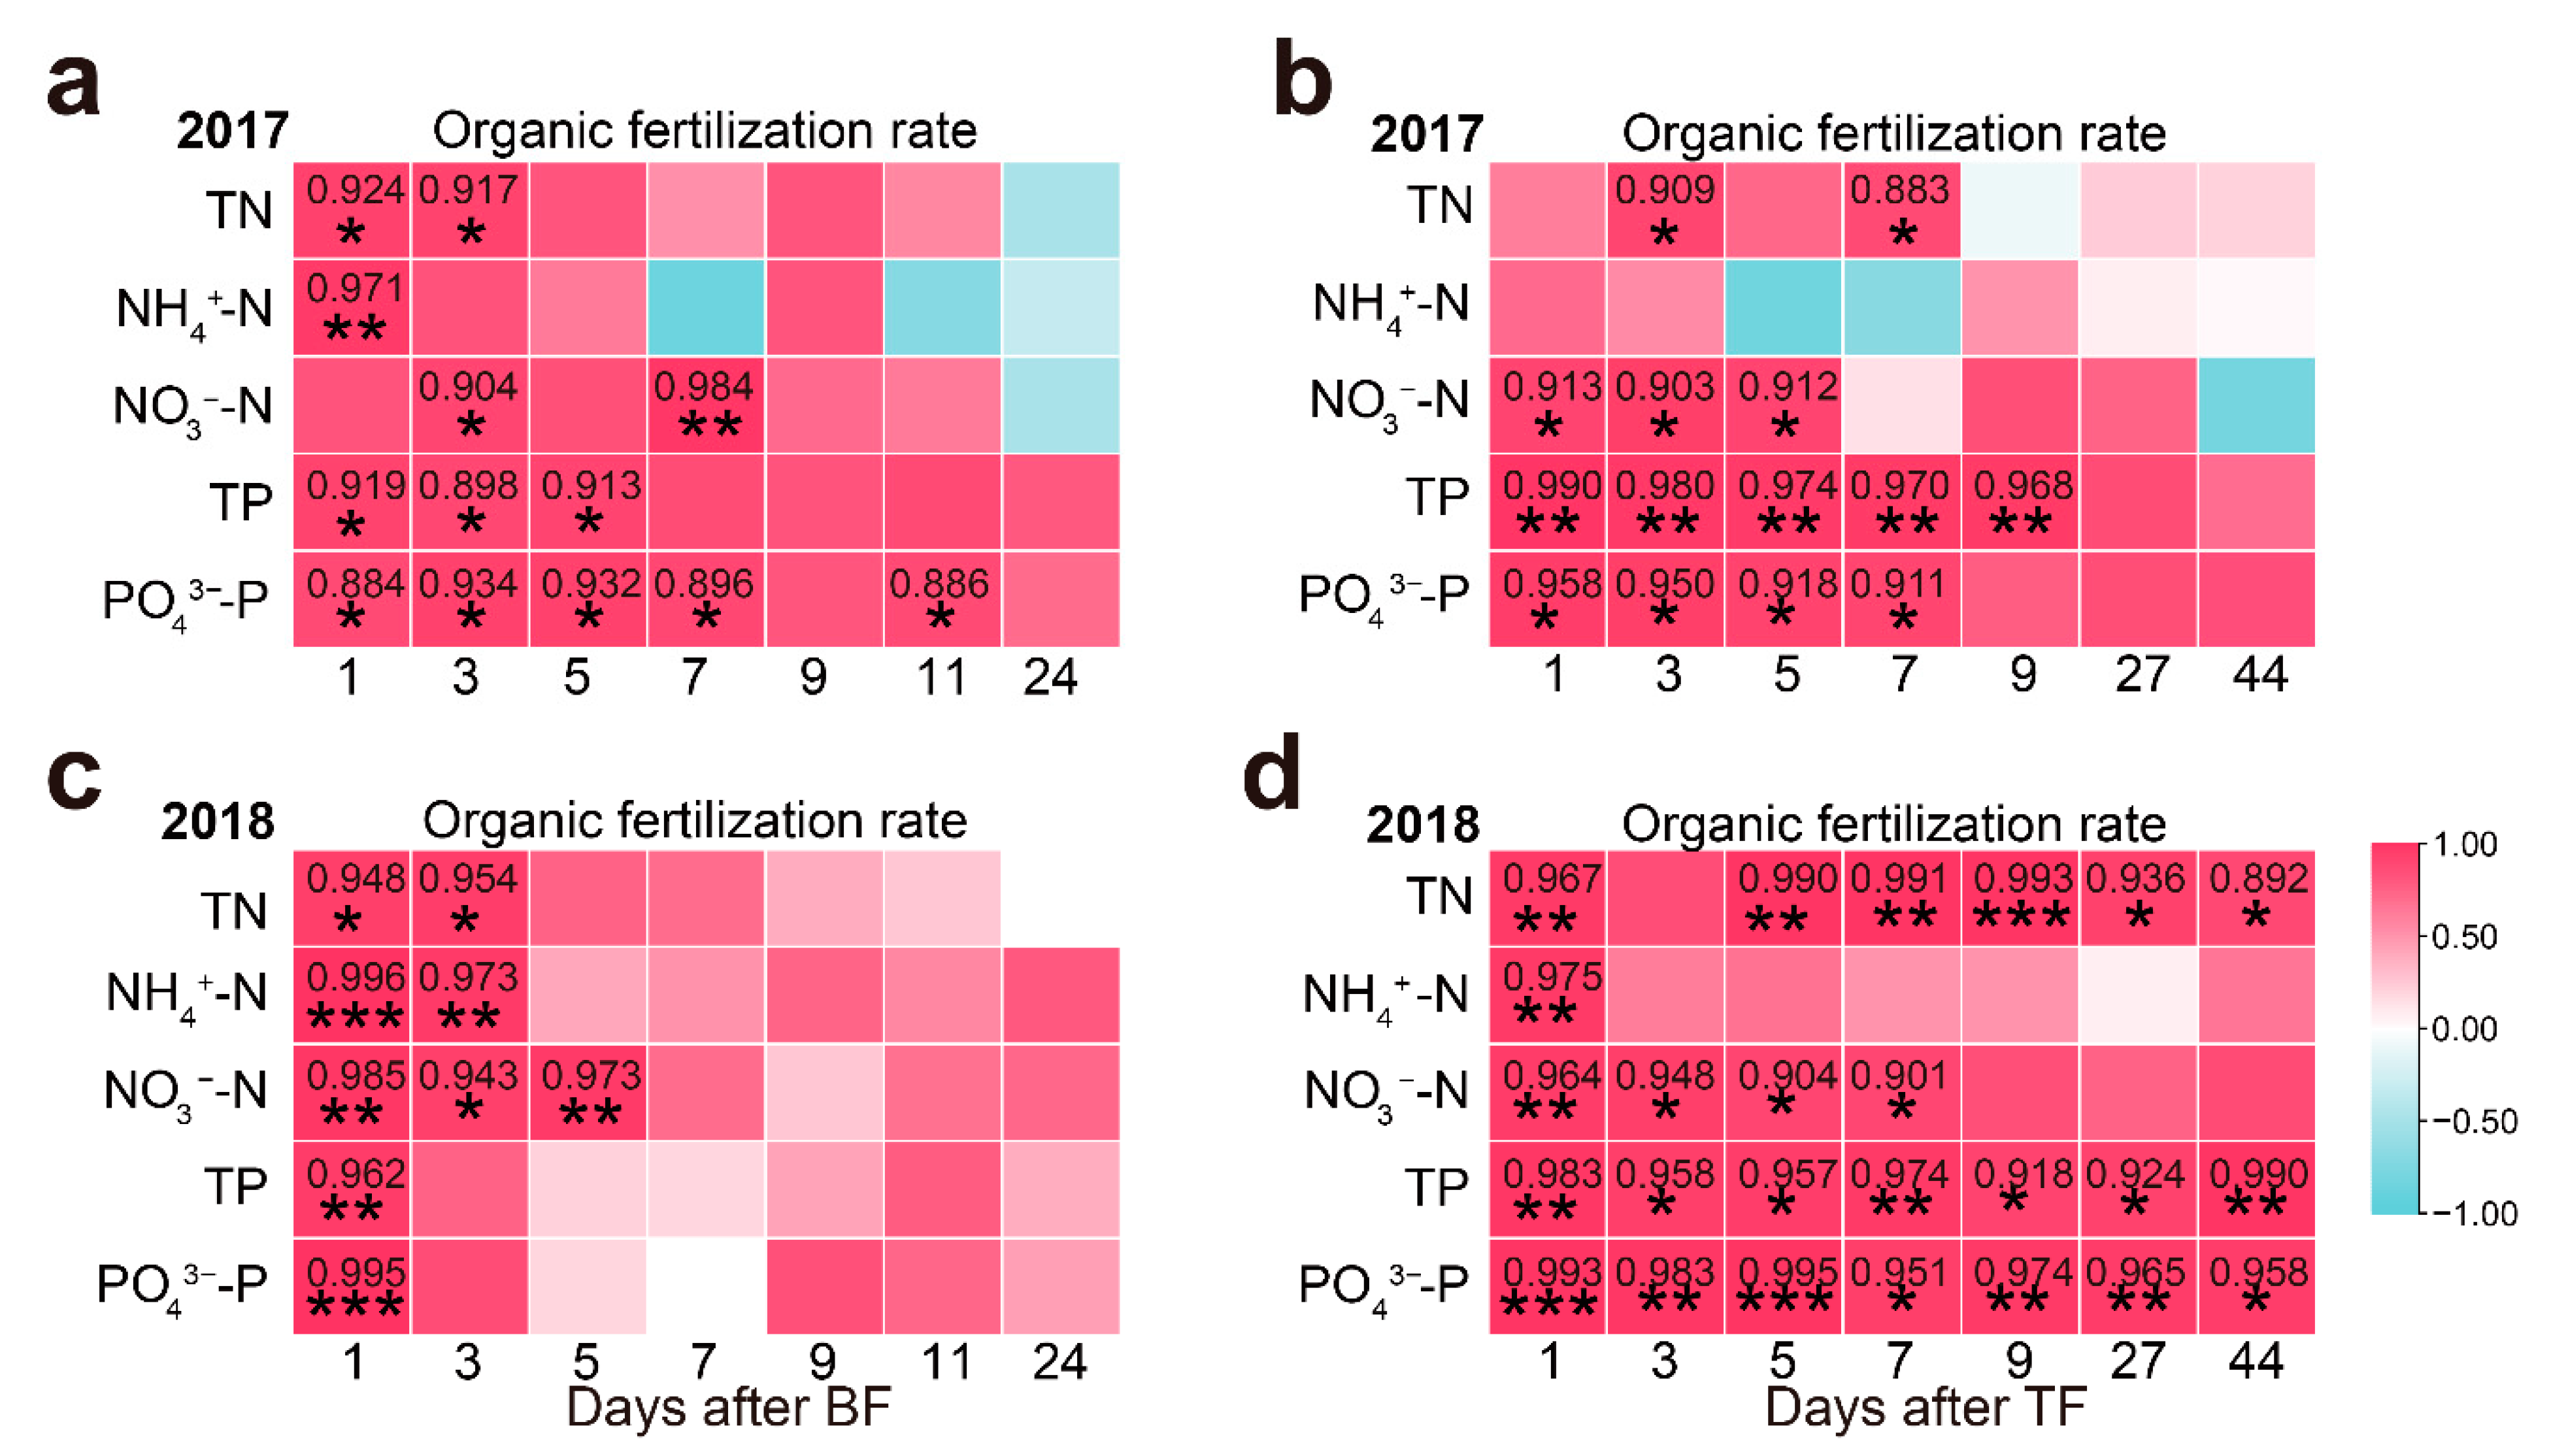
3.4. Correlation between Organic Fertilization Rates and Surface Water N/P Concentrations

Pearson’s correlation coefficients between organic fertilization rates and surface water N or P concentrations at each sampling time are shown in Figure 4. The correlations between organic fertilization rates and surface water N or P concentrations gradually became weak after the organic fertilizer application. A total of 1–3 days after BF and TF, almost all of the N and P concentrations tested in the surface water displayed a significant and positive correlation with the organic fertilization rate. This means that the N and P concentrations in the surface water increased with the increased rates of organic fertilization in these periods. The surface water N and P concentrations in the N300 treatment were the highest in all treatments. Five days after BF and TF, the correlations between organic fertilization rates and N concentrations (TN, NH4+-N, or NO3-N) were much weaker than before. However, the P concentrations (TP or PO43–-P) still positively correlated with the organic fertilization rates, especially in days after TF. In 2017, the P concentrations were significantly and positively correlated with the organic fertilization rate 1–7 days after TF. In 2018, the surface water P concentrations showed significant and positive correlations with organic fertilization rates in every sampling day after TF. The surface water TP concentrations in 44 days after TF were 0.32, 0.83, 1.44, and 1.68 mg L−1 under N75, N150, N225, and N330, respectively, which are still significantly higher than that under N0 (0.05 mg L−1). It was indicated that the effect of the organic fertilization rate on the surface water P concentrations was greater and longer than that on the surface water N concentration. In addition, the correlations between organic fertilization rates and N or P concentrations in surface water in 2018 were stronger than those in 2017. Particularly, the TN, TP, and PO43–-P concentrations continuously had a positive correlation with the organic fertilization rate 1–44 days after TF in 2018. With repeated fertilization, the influence induced by the organic fertilization rates was enhanced. In sum, the N and P concentrations in the surface water were significantly and directly affected by the amounts of fertilizer applied 1–3 and 1–7 days after fertilization application, respectively.

3.5. Relationship of Grain Yields, Surface Water N and P concentrations, and Organic Fertilization Rates

In the two-year field experiments, organic fertilizer application significantly increased grain yields by 25–63% compared with N0 (Figure 5a). In 2017, grain yields increased with the increase in organic fertilizer input. The grain yield in 2017 had a significant and positive relationship with the organic fertilization rate (r = 0.9383, p = 0.0182). N225 and N300 treatments reached the highest grain yield, 8.15 and 8.18 ton ha−1, respectively. A linear relationship between grain yield and organic fertilization rate was obtained (y = 0.011x + 5.3, p < 0.05). In 2018, grain yields obtained under different organic fertilization rates had a similar tendency as those in 2017, but the positive relationship between them in 2018 was not significant (r = 0.7686, p = 0.1289). The highest grain yield was obtained under the N150 treatment, with a value of 7.29 ton ha−1. In addition, the grain yields in the N225 and N300 treatments slightly decreased, but the differences between N150, N225, and N300 were not significant. Grain yields showed a polynomial relationship with the organic fertilization rate in 2018 (y = −4.9 × 10−5x2 + 0.020x + 5.2, p < 0.05). According to this fitting line, organic fertilization rates of 175~225 kg N ha−1 had high grain yields of approximately 7.2 ton ha−1. Therefore, high organic fertilizer input (>225 kg N ha−1) did not increase the rice grain yield, and even had negative effects on the final rice grain yields. Considering the environmental risks of N and P losses, we evaluated the relationship between the organic fertilization rate and the average surface water N and P concentrations in the high-risk period. In the 1–3 and 1–7 days after fertilization, the average surface water N and P concentrations showed a linear relationship with the organic fertilization rate (p < 0.05) (Figure 5b,c). This means that in the high-risk period of N and P runoff losses, the surface water N and P levels significantly increased with the organic fertilization rate. Taken together, organic fertilization rates with 150~200 kg N ha−1 are suggested as the proper rates, with relatively high grain yield and low N and P runoff losses.

4. Discussion

4.1. Days Immediately after Organic Fertilization were a High-Risk Period of N and P Losses

Dynamic analysis demonstrated that the surface water N and P concentrations in the paddy field responded immediately and dramatically to the application of organic fertilizers (Figure 2 and Figure 3). The surface water N and P concentrations reached high levels during the initial 3 and 7 days after BF and TF, respectively. It was noted that the increases in N and P concentrations induced by the TF were much lower than those induced by the BF. This is probably due to the lower amount of the topdressing fertilizer compared to the basal fertilizer. Similar change patterns in the surface water N and P concentrations were also observed in the chemical [21] or combined chemical and organic fertilization [25]. Under different chemical N and P fertilization, the surface water N and P concentrations rapidly reached the highest peaks and then decreased within 5–10 days and 5–15 days after fertilization. Under combined chemical and manure fertilization, surface water TP and dissolved P in paddy fields reached the highest values immediately after BF and subsequently declined sharply within about 10 days [25]. Previous research had indicated that the N and P runoff losses are predominantly affected by fertilization and rainfall [22,31]. We also observed that the N concentrations in the initial 1–7 days after TF in 2017 were much lower than those in 2018. This was probably due to the continuous and heavy rainfall that occurred in the periods of topdressing application in 2017. In the 7 days after TF, the average rainfall in 2017 was 12.67 mm, much higher than the 4.95 mm in 2018 (Figure 1). In that week in 2017, there were five rainy days, while there were only two rainy days then in 2018. Consistently, the exponential relationships between the surface water NH4+-N and NO3-N concentrations and time after TF in 2017 were not significant, which may be due to the heavy rainfall during these days. Thus, rainfall had a huge effect on the dynamic changes in the surface water N concentrations. At this time, if heavy rainfall occurs, a large amount of ammonium nitrogen and nitrate nitrogen in the rice field will be lost with runoff. In our study, 3 and 7 days after BF and TF are considered as the high-risk periods of N and P runoff losses, respectively. In organic farms’ practices, it was still important to avoid fertilization before high-intensity rainfall according to the short-range weather forecast.

4.2. Surface Water N and P Concentrations were Positively Related with Organic Fertilization Rate

Correlation analysis revealed that the surface water N and P concentrations were positively related to the organic fertilization rate, particularly in the early period after fertilization (Figure 4). Under chemical N and P fertilization, both the surface water N and P concentrations and N and P runoff losses significantly increased with an increased chemical fertilization rate in paddy fields [21,32]. Thus, both with chemical and organic fertilizer application, the fertilization rate is another contributing factor to the amount of N and P runoff losses. Excessive fertilization probably increases the risk of N and P runoff losses. Meta-analysis of N runoff loss rates in the Yangtze River Basin also demonstrated that the runoff depth and fertilizer application rate are the main controls of paddy fields [33]. It was noted that N leaching and ammonia volatilization also contribute to the N loss from the paddy field [4,22]. The rate and accumulative amounts of ammonia volatilization increased with the increasing N fertilization rate [34]. Further investigation is required to quantify and characterize the effects of the organic fertilization rate on N and P losses, including runoff, leaching, and ammonia volatilization. In addition, we found that the correlations between the P concentration and organic fertilization rate were more significant and exist longer than those between the N concentration and organic fertilization rate. Organic fertilizers usually had higher P content than chemical fertilizers [12]. Likewise, the organic fertilizer used in this study has high contents of total P (28.30 g·kg−1), so large amounts of organic fertilizer input also bring massive TP into paddy fields. A large fraction of P is immobilized in the form of particulates in paddy fields because phosphates can be easily adsorbed and immobilized by soil minerals, or formed organically through biotic processes [35]. Previous studies had demonstrated that compared with chemical fertilizers, organic fertilizers had similar P losses and even higher P losses [12,27]. Therefore, over-organic fertilization probably leads to a much higher P load and P losses. P could be easily overaccumulated in soils, but the immobilized P could not be taken up by plants. For the limited and non-renewable phosphate rock reserves [5], it is necessary to exploit legacy P reserves in soils.

4.3. Proper Organic Fertilization Rate with High Yield and Low Environmental Risk

Fertilizers mainly provide N and P nutrients for crop growth and development. Conventional farms’ practices in intensive agricultural areas of China had a high annual application rate of about 300 kg N ha−1, with a grain yield of about 8.0 ton ha−1 [7,36,37]. Chen et al. estimated that the ratio of N loss via surface runoff to total N input exceeded 20% under 300 kg N ha−1 in a two-season paddy field experiment in Jiangsu Province, China [8]. Overfertilization could not significantly increase crop yields but lead to low fertilizer utilization efficiency and enormous nutrient losses [7,38,39]. Seriously, excessive use of nitrogen inhibited grain filling of inferior grains, resulting in a significant decrease in rice yields and grain appearance and nutritional quality [40]. Organic agriculture is operated without pesticides, herbicides, and inorganic fertilizers and has been promoted as a more environmentally friendly alternative to intensive conventional agriculture in China [12,16]. Although organic crop yields were usually 10−15% lower than conventional yields, the comprehensive environmental benefits of organic agriculture were assumed to be higher than those of conventional agriculture [12]. Thus, it is a challenge to achieve a balance between yields and environmental benefits. In our study, we recommend organic fertilization rates of 150~200 kg N ha−1 for relatively high production and low risks of N and P losses. Organic fertilizer rates higher than 200 kg N ha−1 do not significantly increase the grain yield, but induce high risks of N and P losses. These results were consistent with some previous studies. Using the same rice variety “Nanjing 46”, an excellent variety for organic cultivation, in Jiangsu Province of China, the number of panicles and grain yielded was also increased with the organic fertilization rate, and the rice yield (7.59 ton ha−1) under a high organic fertilization rate of 218.4 N kg ha−1, was not significantly higher than the rice yield (7.07 ton ha−1) under the medium organic fertilization rate of 160.8 N kg ha−1 [41]. Under the high fertilization rate, organic farming loses its environmental performance [42]. During the initial conversion period to organic farming, newly converted organic farmers increase the use of organic fertilizers to compensate for potential yield losses, which will increase N and P discharge. In two-year field experiments, we also observed that the correlations between the organic fertilization rate and N and P concentration in 2018 were higher than that in 2017. This implies that repeated applications of compost increase the N and P accumulation in paddy fields. Besides, continuous application of organic fertilizers, such as chicken and pig manure, likely increased the concentrations of heavy metal concentrations (zinc, copper, cadmium, and mercury) in soils and rice grain, posing a risk to the ecosystem and human health [43].

5. Conclusions

In our two-year field experiment, the significant exponential relationships between the surface water N and P concentrations and the number of days after BF were observed under an organic fertilizer application. These surface water N and P concentrations were significantly and positively correlated with the organic fertilization rate 1–3 and 1–7 days after BF and TF, respectively. Excessive organic fertilizer input (>225 kg N ha−1) did not increase the rice grain yield, but increased the environmental risks of N and P runoff losses. Thus, organic fertilization rates with 150~200 kg N ha−1 have been suggested as the proper organic fertilization rate for sustainable agricultural production.

Author Contributions

Conceptualization, Y.X. and Q.C.; methodology, Q.C.; software, M.L. and L.W.; resources, Y.X. and J.Z.; writing—original draft preparation, M.L. and Q.C.; writing—review and editing, M.L., Y.W., S.H., Y.Y., Y.L. and L.W.; supervision, Y.X. and J.Z.; funding acquisition, M.L. All authors have read and agreed to the published version of the manuscript.

Funding

This research was funded by the Central Public-Interest Scientific Institution Basal Research Fund (GYZX210514) and the Central Public-Interest Scientific Institution Basal Research Fund (ZX2022QT043).

Institutional Review Board Statement

Not applicable.

Informed Consent Statement

Not applicable.

Data Availability Statement

Data are contained within the article.

Acknowledgments

The authors thank Wei Tian and Li Gao from the Nanjing Institute of Environmental Science for their assistance with the experiments. The authors also thank Yonglan Xi from the Jiangsu Academy of Agriculture Sciences for their help and discussion. We are also grateful to the reviewers for their useful comments and suggestions for improving the final manuscript.

Conflicts of Interest

The authors declare no conflict of interest.

References

  1. Sun, B.; Zhang, L.; Yang, L.; Zhang, F.; Norse, D.; Zhu, Z. Agricultural non-point source pollution in China: Causes and mitigation measures. Ambio 2012, 41, 370–379. [Google Scholar] [CrossRef] [PubMed]
  2. Qi, D.; Wu, Q.; Zhu, J. Nitrogen and phosphorus losses from paddy fields and the yield of rice with different water and nitrogen management practices. Sci. Rep. 2020, 10, 9734. [Google Scholar] [CrossRef] [PubMed]
  3. Cui, N.; Cai, M.; Zhang, X.; Abdelhafez, A.A.; Zhou, L.; Sun, H.; Chen, G.; Zou, G.; Zhou, S. Runoff loss of nitrogen and phosphorus from a rice paddy field in the east of China: Effects of long-term chemical N fertilizer and organic manure applications. Glob. Ecol. Conserv. 2020, 22, e01011. [Google Scholar] [CrossRef]
  4. Yu, C.Q.; Huang, X.; Chen, H.; Godfray, H.C.J.; Wright, J.S.; Hall, J.W.; Gong, P.; Ni, S.Q.; Qiao, S.C.; Huang, G.R.; et al. Managing nitrogen to restore water quality in China. Nature 2019, 567, 516–520. [Google Scholar] [CrossRef]
  5. Liu, X.; Sheng, H.; Jiang, S.; Yuan, Z.; Zhang, C.; Elser, J.J. Intensification of phosphorus cycling in China since the 1600s. Proc. Natl. Acad. Sci. USA 2016, 113, 2609–2614. [Google Scholar] [CrossRef]
  6. Xu, L.; Yuan, S.; Man, J. Changes in rice yield and yield stability in China during the past six decades. J. Sci. Food Agric. 2020, 100, 3560–3569. [Google Scholar] [CrossRef]
  7. Ju, X.T.; Xing, G.X.; Chen, X.P.; Zhang, S.L.; Zhang, L.J.; Liu, X.J.; Cui, Z.L.; Yin, B.; Christie, P.; Zhu, Z.L.; et al. Reducing environmental risk by improving N management in intensive Chinese agricultural systems. Proc. Natl. Acad. Sci. USA 2009, 106, 3041–3046. [Google Scholar]
  8. Chen, K.; Yu, S.; Ma, T.; Ding, J.; He, P.; Li, Y.; Dai, Y.; Zeng, G. Modeling the water and nitrogen management practices in paddy fields with HYDRUS-1D. Agriculture 2022, 12, 924. [Google Scholar] [CrossRef]
  9. Liu, X.; Wang, H.; Zhou, J.; Chen, Z.; Lu, D.; Zhu, D.; Deng, P. Effect of nitrogen root zone fertilization on rice yield, uptake and utilization of macronutrient in lower reaches of Yangtze River, China. Paddy Water Environ. 2017, 15, 625–638. [Google Scholar] [CrossRef]
  10. He, S.; Li, F.; Liang, X.; Li, H.; Wang, S.; Jin, Y.; Liu, B.; Tian, G. Window phase analysis of nutrient losses from a typical rice-planting area in the Yangtze river delta region of China. Environ. Sci. Eur. 2020, 32, 10. [Google Scholar] [CrossRef]
  11. Hu, Y.; Zhang, J.; Huang, J.; Hu, S. Environmental drivers and aquatic ecosystem assessment of periphytic algae at inflow rivers in six lakes over the Yangtze River Basin. Water 2022, 14, 2184. [Google Scholar] [CrossRef]
  12. Meng, F.; Qiao, Y.; Wu, W.; Smith, P.; Scott, S. Environmental impacts and production performances of organic agriculture in China: A monetary valuation. J. Environ. Manag. 2017, 188, 49–57. [Google Scholar] [CrossRef] [PubMed]
  13. Bernal, M.P.; Alburquerque, J.A.; Moral, R. Composting of animal manures and chemical criteria for compost maturity assessment. A review. Bioresource Technol. 2009, 100, 5444–5453. [Google Scholar] [CrossRef] [PubMed]
  14. Tian, W.; Wang, L.; Li, Y.; Zhuang, K.; Li, G.; Zhang, J.; Xiao, X.; Xi, Y. Responses of microbial activity, abundance, and community in wheat soil after three years of heavy fertilization with manure-based compost and inorganic nitrogen. Agric. Ecosyst. Environ. 2015, 213, 219–227. [Google Scholar] [CrossRef]
  15. Tuomisto, H.L.; Hodge, I.D.; Riordan, P.; Macdonald, D.W. Does organic farming reduce environmental impacts?—A meta-analysis of European research. J. Environ. Manag. 2012, 112, 309–320. [Google Scholar]
  16. Bengtsson, J.; Ahnstöm, J.; Weibull, A.-C. The effects of organic agriculture on biodiversity and abundance: A meta-analysis. J. Appl. Ecol. 2005, 42, 261–269. [Google Scholar] [CrossRef]
  17. Kang, S.W.; Seo, D.C.; Kim, S.Y.; Cho, J.S. Utilization of liquid pig manure for resource cycling agriculture in rice-green manure crop rotation in South Korea. Environ. Monit. Assess 2020, 192, 323. [Google Scholar] [CrossRef]
  18. Chen, G.; Yuan, J.; Chen, H.; Zhao, X.; Wang, S.; Zhu, Y.; Wang, Y. Animal manures promoted soil phosphorus transformation via affecting soil microbial community in paddy soil. Sci. Total Environ. 2022, 831, 154917. [Google Scholar] [CrossRef]
  19. Hao, Z.; Zhang, X.; Gao, Y.; Xu, Z.; Yang, F.; Wen, X.; Wang, Y. Nitrogen source track and associated isotopic dynamic characteristic in a complex ecosystem: A case study of a subtropical watershed, China. Environ. Pollut. 2018, 236, 177–187. [Google Scholar] [CrossRef]
  20. Liu, J.; Zuo, Q.; Zhai, L.M.; Luo, C.Y.; Liu, H.B.; Wang, H.Y.; Liu, S.; Zou, G.Y.; Ren, T.Z. Phosphorus losses via surface runoff in rice-wheat cropping systems as impacted by rainfall regimes and fertilizer applications. J. Integr. Agric. 2016, 15, 667–677. [Google Scholar] [CrossRef]
  21. Liu, J.; Ouyang, X.; Shen, J.; Li, Y.; Sun, W.; Jiang, W.; Wu, J. Nitrogen and phosphorus runoff losses were influenced by chemical fertilization but not by pesticide application in a double rice-cropping system in the subtropical hilly region of China. Sci. Total Environ. 2020, 715, 136852. [Google Scholar] [CrossRef] [PubMed]
  22. Zhao, X.; Zhou, Y.; Min, J.; Wang, S.; Shi, W.; Xing, G. Nitrogen runoff dominates water nitrogen pollution from rice-wheat rotation in the Taihu Lake region of China. Agric. Ecosyst. Environ. 2012, 156, 1–11. [Google Scholar] [CrossRef]
  23. Kamruzzaman, M.; Hwang, S.; Choi, S.; Cho, J.; Song, I.; Song, J.; Jeong, H.; Jang, T.; Yoo, S. Evaluating the impact of climate change on paddy water balance using APEX-paddy model. Water 2020, 12, 852. [Google Scholar] [CrossRef]
  24. Savic, R.; Stajic, M.; Blagojević, B.; Bezdan, A.; Vranesevic, M.; Nikolić Jokanović, V.; Baumgertel, A.; Bubalo Kovačić, M.; Horvatinec, J.; Ondrasek, G. Nitrogen and phosphorus concentrations and their ratios as indicators of water quality and eutrophication of the Hydro-System Danube-Tisza-Danube. Agriculture 2022, 12, 935. [Google Scholar] [CrossRef]
  25. Wang, K.; Zhang, Z.J.; Zhu, Y.M.; Wang, G.H.; Shi, D.C.; Christie, P. Surface water phosphorus dynamics in rice fields receiving fertiliser and manure phosphorus. Chemosphere 2001, 42, 209–214. [Google Scholar] [CrossRef]
  26. Liu, X.; Liu, Z.; Qian, Q.; Song, W.; Rogers, K.M.; Rao, Q.; Wang, S.; Zhang, Q.; Shao, S.; Tian, M.; et al. Isotope chemometrics determines farming methods and geographical origin of vegetables from Yangtze River Delta Region, China. Food Chem. 2021, 342, 128379. [Google Scholar] [CrossRef]
  27. Wang, L.; Zhao, X.; Gao, J.; Butterly, C.R.; Chen, Q.; Liu, M.; Yang, Y.; Xi, Y.; Xiao, X. Effects of fertilizer types on nitrogen and phosphorous loss from rice-wheat rotation system in the Taihu Lake region of China. Agric. Ecosyst. Environ. 2019, 285, 106605. [Google Scholar] [CrossRef]
  28. Tan, S.; Yang, C.; Mei, X.; Shen, S.; Raza, W.; Shen, Q.; Xu, Y. The effect of organic acids from tomato root exudates on rhizosphere colonization of Bacillus amyloliquefaciens T-5. Appl. Soil Ecol. 2013, 64, 15–22. [Google Scholar] [CrossRef]
  29. Chen, L.; Yang, X.; Raza, W.; Luo, J.; Zhang, F.; Shen, Q. Solid-state fermentation of agro-industrial wastes to produce bioorganic fertilizer for the biocontrol of Fusarium wilt of cucumber in continuously cropped soil. Bioresource Technol. 2011, 102, 3900–3910. [Google Scholar] [CrossRef]
  30. Lu, R.K. Soil and Agricultural Chemical Analysis Methods; Chinese Agriculture and Sciences Press: Beijing, China, 1999. [Google Scholar]
  31. Cao, D.; Cao, W.; Fang, J.; Cai, L. Nitrogen and phosphorus losses from agricultural systems in China: A meta-analysis. Mar. Pollut. Bull. 2014, 85, 727–732. [Google Scholar] [CrossRef]
  32. Qiao, J.; Yang, L.; Yan, T.; Xue, F.; Zhao, D. Nitrogen fertilizer reduction in rice production for two consecutive years in the Taihu Lake area. Agric. Ecosyst. Environ. 2012, 146, 103–112. [Google Scholar] [CrossRef]
  33. Zhang, Y.; Wu, H.; Yao, M.; Zhou, J.; Wu, K.; Hu, M.; Shen, H.; Chen, D. Estimation of nitrogen runoff loss from croplands in the Yangtze River Basin: A meta-analysis. Environ. Pollut. 2021, 272, 116001. [Google Scholar] [CrossRef] [PubMed]
  34. Yu, Q.; Ye, J.; Yang, S.; Fu, J.; Ma, J.; Sun, W.; Jiang, L.; Wang, Q. Effects of nitrogen application level on rice nutrient uptake and ammonia volatilization. Rice Sci. 2013, 20, 139–147. [Google Scholar] [CrossRef]
  35. Li, H.; Liu, J.; Li, G.; Shen, J.; Bergström, L.; Zhang, F. Past, present, and future use of phosphorus in Chinese agriculture and its influence on phosphorus losses. Ambio 2015, 44 (Suppl 2), S274–S285. [Google Scholar] [CrossRef]
  36. Zhang, C.; Li, W.; Zhao, Z.; Zhou, Y.; Zhang, J.; Wu, Q. Spatiotemporal variability and related factors of soil organic carbon in Henan province. Vadose Zone J. 2018, 17, 180109. [Google Scholar] [CrossRef]
  37. Wang, Y.; Zhao, X.; Wang, L.; Wang, Y.; Li, W.; Wang, S.; Xing, G. The regime and P availability of omitting P fertilizer application for rice in rice/wheat rotation in the Taihu Lake Region of southern China. J. Soils Sediments 2014, 15, 844–853. [Google Scholar] [CrossRef]
  38. Lv, Y.; Hu, Y.; Sun, F.; Huo, W.; Li, H.; Liu, L.; Yin, D.; Zheng, G.; Guo, X. Yield and resource utilization efficiency gap in early maturing Japonica rice cultivars under different management strategies—A different location investigation. Agriculture 2022, 12, 1010. [Google Scholar] [CrossRef]
  39. Chen, K.; Yu, S.e.; Ma, T.; Ding, J.; He, P.; Dai, Y.; Zeng, G. Effects of water and nitrogen management on water productivity, nitrogen use efficiency and leaching loss in rice paddies. Water 2022, 14, 1596. [Google Scholar] [CrossRef]
  40. Zhao, C.; Liu, G.; Chen, Y.; Jiang, Y.; Shi, Y.; Zhao, L.; Liao, P.; Wang, W.; Xu, K.; Dai, Q.; et al. Excessive nitrogen application leads to lower rice yield and grain quality by inhibiting the grain filling of inferior grains. Agriculture 2022, 12, 962. [Google Scholar] [CrossRef]
  41. Huang, L.; Yu, J.; Yang, J.; Zhang, R.; Bai, Y.; Sun, C.; Zhuang, H. Relationships between yield, quality and nitrogen uptake and utilization of organically grown rice varieties. Pedosphere 2016, 26, 85–97. [Google Scholar] [CrossRef]
  42. Marchand, S.; Guo, H. The environmental efficiency of non-certified organic farming in China: A case study of paddy rice production. China Econ. Rev. 2014, 31, 201–216. [Google Scholar] [CrossRef]
  43. Yang, X.; Li, Q.; Tang, Z.; Zhang, W.; Yu, G.; Shen, Q.; Zhao, F.J. Heavy metal concentrations and arsenic speciation in animal manure composts in China. Waste Manag. 2017, 64, 333–339. [Google Scholar] [CrossRef] [PubMed]
Figure 1. Daily precipitation and mean daily temperature during the two-year rice cultivation period in 2017 (a) and 2018 (b). Red arrows indicate the days for BF and TF.
Agriculture 12 01466 g001
Figure 2. Dynamic changes of TN (a,b), NH4+-N (c,d), and NO3-N concentrations (e,f) in surface water under different organic fertilization rates in 2017 and 2018. The BF was carried out on 21 June 2017 and 14 June 2018, respectively, and the TF was performed 50 days after BF on 9 August 2017 and 2 August 2018, respectively. The rice transplanting date was set 1 day after BF. Results are the mean of triplicates (n = 3), and error bars indicate standard deviations. Significant exponential relationships between the surface water N concentrations and time after BF or TF were shown (p < 0.05). In these functions, e is the natural constant (e ≈ 2.718). *, **, and *** indicate that the collection is significant at the 0.05, 0.01, and 0.001 levels, respectively. NS: Not significant (p > 0.05).
Agriculture 12 01466 g002
Figure 3. Dynamic changes of TP concentrations (a,b) and PO43–-P concentrations (c,d) in the surface water under different organic fertilization rates in 2017 and 2018. Results are the mean of triplicates (n = 3), error bars indicate standard deviations. Significant exponential relationships between the surface water P concentrations and time after BF or TF were shown (p < 0.05). In these functions, e is the natural constant (e ≈ 2.718). *, **, and *** indicate that the collection is significant at the 0.05, 0.01, and 0.001 levels, respectively. NS: Not significant (p > 0.05).
Agriculture 12 01466 g003
Figure 4. Heatmaps of Pearson’s correlation coefficients between organic fertilization rates and surface water N/P concentration at each sampling time in 2017 (a,b) and 2018 (c,d). *, **, and *** indicate that the collection coefficient is significant at the 0.05, 0.01, and 0.001 levels, respectively (2-tailed).
Agriculture 12 01466 g004
Figure 5. Relationship between the organic fertilization rate and rice grain yields (a), surface water average N concentration (b) and average P concentration (c) in the two-year field experiments. Each model fitting produces a highly significant model (p < 0.05). In (a), values are mean ± SD (n = 3), and different letters indicate significant differences between treatments (p < 0.05 by LSD multiple range test). Average N and P concentrations are means 1–3 and 1–7 days after BF and TF, respectively.
Agriculture 12 01466 g005
Publisher’s Note: MDPI stays neutral with regard to jurisdictional claims in published maps and institutional affiliations.

