
Diversification of Agricultural Output Intensity across the European Union in Light of the Assumptions of Sustainable Development

Abstract
:1. Introduction
2. Materials and Methods
3. Results and Discussion
- –
- Intermediate consumption costs per hectare of UAA: the observed effect size (rrb) was very big and the results in the EU-15 group were significantly higher than in the EU-13 group.
- –
- The number of full-time equivalents in agriculture per 100 ha of UAA: the observed effect size (rrb) was very big and the results were significantly higher in the EU-13 category than in the EU-15 category.
4. Conclusions
Author Contributions
Funding
Institutional Review Board Statement
Informed Consent Statement
Data Availability Statement
Conflicts of Interest
References
- Czyżewski, A.; Czyżewski, B. Research challenges for agricultural economics in the new paradigm. In Political Rents of European Farmers in the Sustainable Development Paradigm. International, National and Regional Perspective; Czyżewski, B., Ed.; PWN: Warsaw, Poland, 2016; pp. 18–27. [Google Scholar]
- Gołaś, M.; Sulewski, P.; Wąs, A.; Kłoczko-Gajewska, A.; Pogodzińska, K. On the way to sustainable agriculture—Eco-efficiency of Polish commercial farms. Agriculture 2020, 10, 438. [Google Scholar] [CrossRef]
- European Commission. CAP Context Indicators 2014–2020. 33. Farming Intensity. Available online: https://ec.europa.eu/info/sites/default/files/food-farming-fisheries/farming/documents/2019-context-indicators-fiches.pdf (accessed on 10 March 2022).
- Zegar, J.S. Contemporary Challenges in Agriculture; PWN: Warsaw, Poland, 2012. (In Polish) [Google Scholar]
- Kremen, C.; Miles, A. Ecosystem services in biologically diversified versus conventional farming systems: Benefits, externalities, and trade-offs. Ecol. Soc. 2012, 17, 40. [Google Scholar] [CrossRef]
- Żmija, D. Sustainable development of agriculture and rural areas in Poland. Econ. Stud. Sci. J. Univ. Econ. Katow. 2014, 166, 149–158. (In Polish) [Google Scholar]
- Magrini, A. Correction to: Assessment of agricultural sustainability in European Union countries: A group-based multivariate trajectory approach. AStA Adv. Stat. Anal. 2022. [Google Scholar] [CrossRef]
- Mori, K.; Christodoulou, A. Review of sustainability indices and indicators: Towards a new City Sustainability Index (CSI). Environ. Impact Assess. Rev. 2012, 32, 94–106. [Google Scholar] [CrossRef]
- Cataldo, R.; Crocetta, C.; Grassia, G.; Lauro, N.C.; Marino, M.; Voytsekhovska, V. Methodological PLS-PM Framework for SDGs System. Soc Indic. Res. 2021, 156, 701–723. [Google Scholar] [CrossRef]
- Krasowicz, S. Relationships between man and natural environment in the aspect of sustainable development. Probl. Inżynierii Rol. 2008, 1, 21–27. (In Polish) [Google Scholar]
- Radulescu, C.V.; Ioan, I. Sustainable development of Romanian agriculture within the context of European Union’s requirements. USV Ann. Econ. Public Adm. 2015, 15, 57–62. [Google Scholar]
- Oleszko-Kurzyna, B. Sustainable agriculture in the light of the European Union environmental requirements. Probl. World Agric. 2008, 4, 326–336. [Google Scholar]
- Hayati, D.; Ranjbar, Z.; Karami, E. Measuring agricultural sustainability. In Biodiversity, Biofuels, Agroforestry and Conservation Agriculture; Sustainable Agriculture Reviews; Lichtfouse, E., Ed.; Springer: Dordrecht, The Netherlands, 2010; pp. 73–100. [Google Scholar]
- Kelly, E.; Latruffe, L.; Desjeux, Y.; Ryan, M.; Uthes, S.; Diazabakana, A.; Dillon, E.; John Finn, J. Sustainability indicators for improved assessment of the effects of agricultural policy across the EU: Is FADN the answer? Ecol. Indic. 2018, 89, 903–911. [Google Scholar] [CrossRef]
- Czyżewski, A.; Staniszewski, J. Dilemmas of operationalising the paradigm of sustainable agricultural development using the concept of eco-efficiency. Probl. World Agric. 2018, 18, 44–56. (In Polish) [Google Scholar] [CrossRef]
- Bacon, C.; Getz, C.; Kraus, S.; Holland, K. The social dimensions of sustainability in diversified, industrial and hybrid farming systems. Ecol. Soc. 2012, 17, 41. [Google Scholar] [CrossRef]
- Guth, M.; Smędzik-Ambroży, K.; Czyżewski, B.; Stępień, S. The Economic Sustainability of Farms under Common Agricultural Policy in the European Union Countries. Agriculture 2020, 10, 34. [Google Scholar] [CrossRef]
- Pretty, J. Agricultural sustainability: Concepts, principles and evidence. Philos. Trans. R. Soc. B: Biol. Sci. 2008, 363, 447–465. [Google Scholar] [CrossRef] [Green Version]
- Nowak, A.; Krukowski, A.; Różańska-Boczula, M. Assessment of sustainability in agriculture of the European Union countries. Agronomy 2019, 9, 890. [Google Scholar] [CrossRef]
- Wrzaszcz, W.; Prandecki, K. Economic efficiency of sustainable agriculture. Probl. Agric. Econ. 2015, 343, 15–36. [Google Scholar] [CrossRef]
- Komorowska, D. Development of modern agriculture in the context of sustainable development goals. Village Agric. 2014, 3, 71–84. (In Polish) [Google Scholar]
- Keys, E.; McConnell, W.J. Global change and the intensification of agriculture in the tropics. Glob. Environ. Change 2005, 15, 320–337. [Google Scholar] [CrossRef]
- Głowacki, M. Regional differentiation of agriculture intensity in Poland. Pulawski Diary 2002, 130, 213–221. (In Polish) [Google Scholar]
- Kopiński, J. Tendencies of changes in agricultural production intensity in Poland in the aspect of potential environmental impacts. Probl. World Agric. 2011, 11, 95–104. (In Polish) [Google Scholar]
- Teillard, F.; Allaire, G.; Cahuzac, E.; Léger, F.; Maigné, E.; Tichit, M. A novel method for mapping agricultural intensity reveals its spatial aggregation: Implications for conservation policies. Agric. Ecosyst. Environ. 2012, 149, 135–143. [Google Scholar] [CrossRef]
- Barretto, A.; Berndes, G.; Sparovek, G.; Wirsenius, S. Agricultural intensification in Brazil and its effects on land-use patterns: An analysis of the 1975–2006 period. Glob. Change Biol. 2013, 19, 1804–1815. [Google Scholar] [CrossRef]
- Levers, C.; Butsic, V.; Verburg, P.H.; Müller, D.; Kuemmerle, T. Drivers of changes in agricultural intensity in Europe. Land Use Policy 2016, 58, 380–393. [Google Scholar] [CrossRef]
- Ruiz-Martinez, I.; Marraccini, E.; Debolini, M.; Bonari, E. Indicators of agricultural intensity and intensification: A review of the literature. Ital. J. Agron. 2015, 10, 74–84. [Google Scholar] [CrossRef]
- Lambin, E.F.; Rounsevell, M.D.A.; Geist, H.J. Are agricultural land-use models able to predict changes in land-use intensity? Agric. Ecosyst. Environ. 2000, 82, 321–331. [Google Scholar] [CrossRef]
- Sobczyński, T. Intensification and concentration of production and the economic and environmental sustainability of EU dairy and grain farms. Ann. Pol. Assoc. Agric. Agribus. Econ. 2011, 13, 154–159. [Google Scholar]
- Foley, J.A.; DeFries, R.; Asner, G.P.; Barford, C.; Bonan, G.; Carpenter, S.R.; Chapin, F.S.; Coe, M.T.; Daily, G.C.; Gibbs, H.K.; et al. Global Consequences of Land Use. Science 2005, 309, 570–574. [Google Scholar] [CrossRef]
- Bommarco, R.; Kleijn, D.; Potts, S.G. Ecological intensification: Harnessing ecosystem services for food security. Trends Ecol. Evol. 2013, 28, 230–238. [Google Scholar] [CrossRef]
- Von Lampe, M.; Willenbockel, D.; Ahammad, H.; Blanc, E.; Cai, Y.; Calvin, K.; Fujimori, S.; Hasegawa, T.; Havlik, P.; Heyhoe, E.; et al. Why do global long-term scenarios for agriculture differ? An overview of the AgMIP Global Economic Model Intercomparison. Agric. Econ. 2014, 45, 3–20. [Google Scholar] [CrossRef]
- Hunter, M.C.; Smith, R.G.; Schipanski, M.E.; Atwood, L.W.; Mortensen, D.A. Agriculture in 2050: Recalibrating targets for sustainable intensification. Bioscience 2017, 67, 386–391. [Google Scholar] [CrossRef]
- Snapp, S.S.; Gentry, L.E.; Harwood, R. Management intensity—not biodiversity—the driver of ecosystem services in a long-term row crop experiment. Agric. Ecosyst. Environ. 2010, 138, 242–248. [Google Scholar] [CrossRef]
- Steensland, A.; Zeigler, M. Productivity in agriculture for a sustainable future. In The Innovation Revolution in Agriculture. A Roadmap to Value Creation; Campos, H., Ed.; Springer: Cham, Switzerland, 2021; pp. 33–69. [Google Scholar]
- Nowak, A.; Janulewicz, P.; Krukowski, A.; Bujanowicz-Haraś, B. Diversification of the level of agricultural development in the member states of the European Union. Cah. Agric. 2016, 25, 55004. [Google Scholar] [CrossRef]
- Kijek, A.; Kijek, T.; Nowak, A.; Skrzypek, A. Productivity and its convergence in agriculture in new and old European Union member states. Agric. Econ. 2019, 65, 1–9. [Google Scholar] [CrossRef]
- De Roest, K.; Ferrari, P.; Knickel, K. Specialisation and economies of scale or diversification and economies of scope? Assessing different agricultural development pathways. J. Rural Stud. 2018, 59, 222–231. [Google Scholar] [CrossRef]
- Sadowski, A.; Wojtasiak, J. Production potential of agriculture in the countries of the European Union. Zagadnienia Doradz. Rol. 2019, 1, 5–19. (In Polish) [Google Scholar]
- Pawłowska-Tyszko, J.; Osuch, D.; Płonka, R. Standard 2020 Results Obtained by Farms Participating in the Polish FADN. Part I. Standard Results; IERiGŻ-PIB: Warsaw, Poland, 2021. (In Polish) [Google Scholar]
- Smędzik-Ambroży, K.; Rutkowska, M.; Kirbaş, H. Productivity of the Polish Agricultural Sector Compared to European Union Member States in 2004–2017 Based on FADN Farms. Ann. Pol. Assoc. Agric. Aribus. Econ. 2019, 21, 422–431. [Google Scholar] [CrossRef]
- Baráth, L.; Fertő, I. Productivity and convergence in European agriculture. J. Agric. Econ. 2016, 68, 228–248. [Google Scholar] [CrossRef]
- Ossowska, L.; Janiszewska, D. Employment and agricultural intensity of European Union countries. Probl. World Agric. 2018, 18, 238–247. [Google Scholar] [CrossRef]
- Matyka, M. Trends in consumption of mineral fertilizers in poland against the background of the European Union. Ann. Pol. Assoc. Agric. Aribus. Econ. 2013, 15, 237–241. [Google Scholar]
- Piwowar, A. Consumption of mineral fertilizers in the Polish agriculture trends and directions of changes. Agric. Sci. 2021, 11, 477–487. [Google Scholar] [CrossRef]
- Hossain, M.; Singh, V.P. Fertilizer use in Asian agriculture: Implications for sustaining food security and the environment. Nutr. Cycl. Agroecosyst. 2000, 57, 155–169. [Google Scholar] [CrossRef]
- Snyder, C.S.; Bruulsema, T.W.; Jensen, T.L.; Fixen, P.E. Review of greenhouse gas emissions from crop production systems and fertilizer management effects. Agric. Ecosyst. Environ. 2009, 133, 247–266. [Google Scholar] [CrossRef]
- Frische, T.; Egerer, S.; Matezki, S.; Pickl, C.; Wogram, J. 5-Point programme for sustainable plant protection. Environ. Sci. Eur. 2018, 30, 8. [Google Scholar] [CrossRef]
- Lawniczak, A.E.; Zbierska, J.; Nowak, B.; Achtenberg, K.; Grześkowiak, A.; Kanas, K. Impact of agriculture and land use on nitrate contamination in groundwater and running waters in central-west Poland. Environ. Monit. Assess. 2016, 188, 172. [Google Scholar] [CrossRef]
- Zalewski, A. Changes in the Value of Used Fertilizers and Plant Protection Products in the Countries of the European Union in the Years 2010–2018. Probl. World Agric. 2020, 20, 78–87. [Google Scholar] [CrossRef]
- Ciborowski, R. Technological innovations and the process of creating knowledge-based economy. In Sustainable Development of Knowledge-Based Economy; Poskrobko, B., Ed.; Higher School of Economics: Białystok, Poland, 2009; pp. 290–298. [Google Scholar]
- Sadłowski, A.; Wrzaszcz, W.; Smedzik-Ambroży, K.; Matras-Bolibok, A.; Budzyńska, A.; Angowski, M.; Mann, S. Direct payments and sustainable agricultural development—The example of Poland. Sustainability 2021, 13, 13090. [Google Scholar] [CrossRef]
- Smol, M. Transition to Circular Economy in the Fertilizer Sector—Analysis of Recommended Directions and End Users’ Perception of Waste-Based Products in Poland. Energies 2021, 14, 4312. [Google Scholar] [CrossRef]
- EUROSTAT. Agri-Environmental Indicator—Livestock Patterns. Available online: https://ec.europa.eu/eurostat/statistics-explained/index.php?title=Agri-environmental_indicator_-livestock_patterns#Livestock_density_at_EU_level_in_2016 (accessed on 18 August 2022).
- Kopiński, J. Agri-environmental effects of changes in agricultural production in Poland. Econ. Reg. Stud. 2015, 8, 5–18. [Google Scholar]
- Parzonko, A. Labour resources reserves in agriculture in Poland and possibilities of their use. Ann. Pol. Assoc. Agric. Agribus. Econ. 2016, 18, 292–297. [Google Scholar]
- Tarnowska, A. Productivity of Chosen Production Factors in Agriculture in the European Union in the Years 2005–2012. Ann. Pol. Assoc. Agric. Agribus. Econ. 2014, 16, 214–219. (In Polish) [Google Scholar]
- Zhang, L.; Hong, M.; Guo, X.; Qian, W. How Does Land Rental Affect Agricultural Labor Productivity? An Empirical Study in Rural China. Land 2022, 11, 653. [Google Scholar] [CrossRef]
- Pawlak, K.; Smutka, L.; Kotyza, P. Agricultural potential of the EU Countries: How far are they from the USA? Agriculture 2021, 11, 282. [Google Scholar] [CrossRef]
- Temme, A.J.A.M.; Verburg, P.H. Mapping and modelling of changes in agricultural intensity in Europe. Agric. Ecosyst. Environ. 2011, 140, 46–56. [Google Scholar] [CrossRef]
- Staniszewski, J. Attempting to measure sustainable intensification of agriculture in countries of the European Union. J. Environ. Prot. Ecol. 2018, 19, 949–957. [Google Scholar]
- West, P.C.; Gerber, J.S.; Peder, M.E.; Mueller, N.D.; Brauman, K.A.; Carlson, K.M.; Cassidy, E.S.; Johnston, M.; MacDonald, G.K.; Ray, D.K.; et al. Leverage points for improving global food security and the environment. Science 2014, 345, 325–327. [Google Scholar] [CrossRef]
- Davis, K.F.; Gephart, J.A.; Emery, K.A.; Leach, A.M.; Galloway, J.N.; D’Odorico, P. Meeting future food demand with current agricultural resources. Glob. Environ. Chang. 2016, 39, 125–132. [Google Scholar] [CrossRef]
- Góral, J.; Rembisz, W. Production in agriculture in the context of environmental protection. J. Agric. Econ. Ext. Rural Dev. 2017, 104, 7–21. [Google Scholar] [CrossRef] [Green Version]


| Member State | Nitrogen (N) Consumption in Mineral Fertilizers | Phosphate (P2O5) Consumption in Mineral Fertilizers | Potash (K2O) Consumption in Mineral Fertilizers | Cost of Using Plant Protection Products, Herbicides, Insecticides, and Pesticides |
|---|---|---|---|---|
| kg/ha | kg/ha | kg/ha | EUR/ha | |
| Austria | 78.7 | 20.3 | 23.7 | 45.1 |
| Belgium | 201.2 | 25.3 | 75.5 | 165.8 |
| Bulgaria | 90.1 | 16.8 | 8.4 | 31.3 |
| Croatia | 103.9 | 51.2 | 41.4 | 60.5 |
| Cyprus | 66.1 | 40.5 | 27.7 | 154.0 |
| Czechia | 131.1 | 18.4 | 11.6 | 59.9 |
| Denmark | 86.1 | 13.9 | 27.2 | 67.1 |
| Estonia | 52.6 | 11.8 | 16.7 | 23.2 |
| Finland | 63.5 | 11.4 | 15.5 | 36.0 |
| France | 111.1 | 20.9 | 23.2 | 105.2 |
| Germany | 134.4 | 21.5 | 35.4 | 93.6 |
| Greece | 53.5 | 16.5 | 13.3 | 40.0 |
| Hungary | 78.9 | 18.5 | 18.3 | 68.6 |
| Ireland | 163.0 | 47.9 | 107.4 | 15.2 |
| Italy | 62.5 | 18.6 | 13.7 | 60.8 |
| Latvia | 57.5 | 18.4 | 20.9 | 28.3 |
| Lithuania | 71.5 | 20.3 | 26.8 | 39.6 |
| Luxembourg | 211.8 | 17.5 | 15.9 | 60.9 |
| Malta | 55.1 | 9.1 | 12.7 | 53.4 |
| Netherlands | 206.2 | 14.0 | 41.0 | 211.3 |
| Poland | 96.1 | 31.1 | 44.3 | 65.8 |
| Portugal | 59.5 | 21.7 | 18.4 | 31.5 |
| Romania | 38.7 | 15.0 | 5.4 | 19.2 |
| Slovakia | 84.1 | 15.9 | 11.7 | 61.1 |
| Slovenia | 115.9 | 38.4 | 46.8 | 43.1 |
| Spain | 57.8 | 23.9 | 21.3 | 38.8 |
| Sweden | 68.7 | 10.8 | 12.3 | 31.9 |
| United Kingdom | 167.4 | 31.3 | 43.8 | 58.1 |
| Country | High Input Intensity | Medium Input Intensity | Low Input Intensity | |||
|---|---|---|---|---|---|---|
| 2010 | 2019 | 2010 | 2019 | 2010 | 2019 | |
| Belgium | 31.4 | 15.1 | 34.9 | 22.0 | 33.7 | 62.9 |
| Bulgaria | 45.1 | 72.0 | 25.2 | 14.8 | 29.7 | 13.2 |
| Czechia | 40.2 | 45.7 | 27.6 | 26.6 | 32.2 | 27.7 |
| Denmark | 34.1 | 27.3 | 36.2 | 31.9 | 29.7 | 40.8 |
| Germany | 37.7 | 42.5 | 34.1 | 29.1 | 28.2 | 28.4 |
| Estonia | 52.1 | 56.0 | 21.5 | 13.7 | 26.4 | 30.3 |
| Ireland | 32.6 | 40.0 | 31.4 | 28.8 | 36.0 | 31.2 |
| Greece | 32.1 | 28.8 | 32.5 | 31.5 | 35.4 | 39.7 |
| Spain | 36.3 | 40.8 | 29.0 | 30.4 | 34.7 | 28.8 |
| France | 33.7 | 37.4 | 33.9 | 29.7 | 32.4 | 32.9 |
| Croatia | 33.5 * | 52.9 | 34.1 * | 23.8 | 32.4 * | 23.3 |
| Italy | 33.7 | 33.8 | 30.8 | 31.0 | 35.5 | 35.2 |
| Cyprus | 34.2 | 17.0 | 33.6 | 31.3 | 32.2 | 51.7 |
| Latvia | 35.7 | 52.5 | 31.8 | 19.5 | 32.5 | 28.0 |
| Lithuania | 31.3 | 46.1 | 32.6 | 21.0 | 36.1 | 32.9 |
| Luxembourg | 39.7 | 50.4 | 34.5 | 21.1 | 25.8 | 28.5 |
| Hungary | 39.9 | 40.2 | 33.9 | 33.9 | 26.2 | 25.9 |
| Malta | 31.4 | 28.2 | 33.6 | 30.3 | 35 | 41.5 |
| Netherlands | 34.4 | 49.1 | 32.7 | 28.3 | 32.9 | 22.6 |
| Austria | 34.2 | 51.0 | 35.5 | 25.7 | 30.3 | 23.3 |
| Poland | 31.4 | 30.6 | 34.1 | 34.7 | 34.5 | 34.7 |
| Portugal | 32.7 | 40.5 | 30.0 | 30.8 | 37.3 | 28.7 |
| Romania | 33.0 | 72.3 | 34.0 | 20.1 | 33.0 | 7.6 |
| Slovenia | 34.4 | 31.8 | 35.9 | 32.4 | 29.7 | 35.8 |
| Slovakia | 48.7 | 54.9 | 24.3 | 20.5 | 27.0 | 24.6 |
| Finland | 30.3 | 26.4 | 30.8 | 36.8 | 38.9 | 36.8 |
| Sweden | 34.2 | 33.0 | 31.8 | 34.8 | 34.0 | 32.2 |
| United Kingdom | 32.2 | 32.3 | 33.8 | 33.1 | 34.0 | 34.6 |
| EU-28 | 35.7 | 41.0 | 31.9 | 27.4 | 32.4 | 31.6 |
| Variables | 95% CI | |||||
|---|---|---|---|---|---|---|
| U | p | rrb | Lower | Upper | ||
| Intermediate consumption costs per hectare of UAA | 41.00 | ** | 0.008 | −0.58 | −0.80 | −0.22 |
| Nitrogen (N) consumption in mineral fertilizers per ha | 69.00 | 0.201 | −0.29 | −0.63 | 0.13 | |
| Phosphate (P2O5) consumption in mineral fertilizers per ha | 96.00 | 0.964 | −0.02 | −0.42 | 0.40 | |
| Potash (K2O) consumption in mineral fertilizers per ha | 74.00 | 0.294 | −0.24 | −0.59 | 0.19 | |
| The number of full-time equivalents in agriculture per 100 ha of UAA | 145.00 | * | 0.029 | 0.49 | 0.10 | 0.75 |
| Cost of using plant protection products, herbicides, insecticides, and pesticides per ha | 82.00 | 0.496 | −0.16 | −0.53 | 0.27 | |
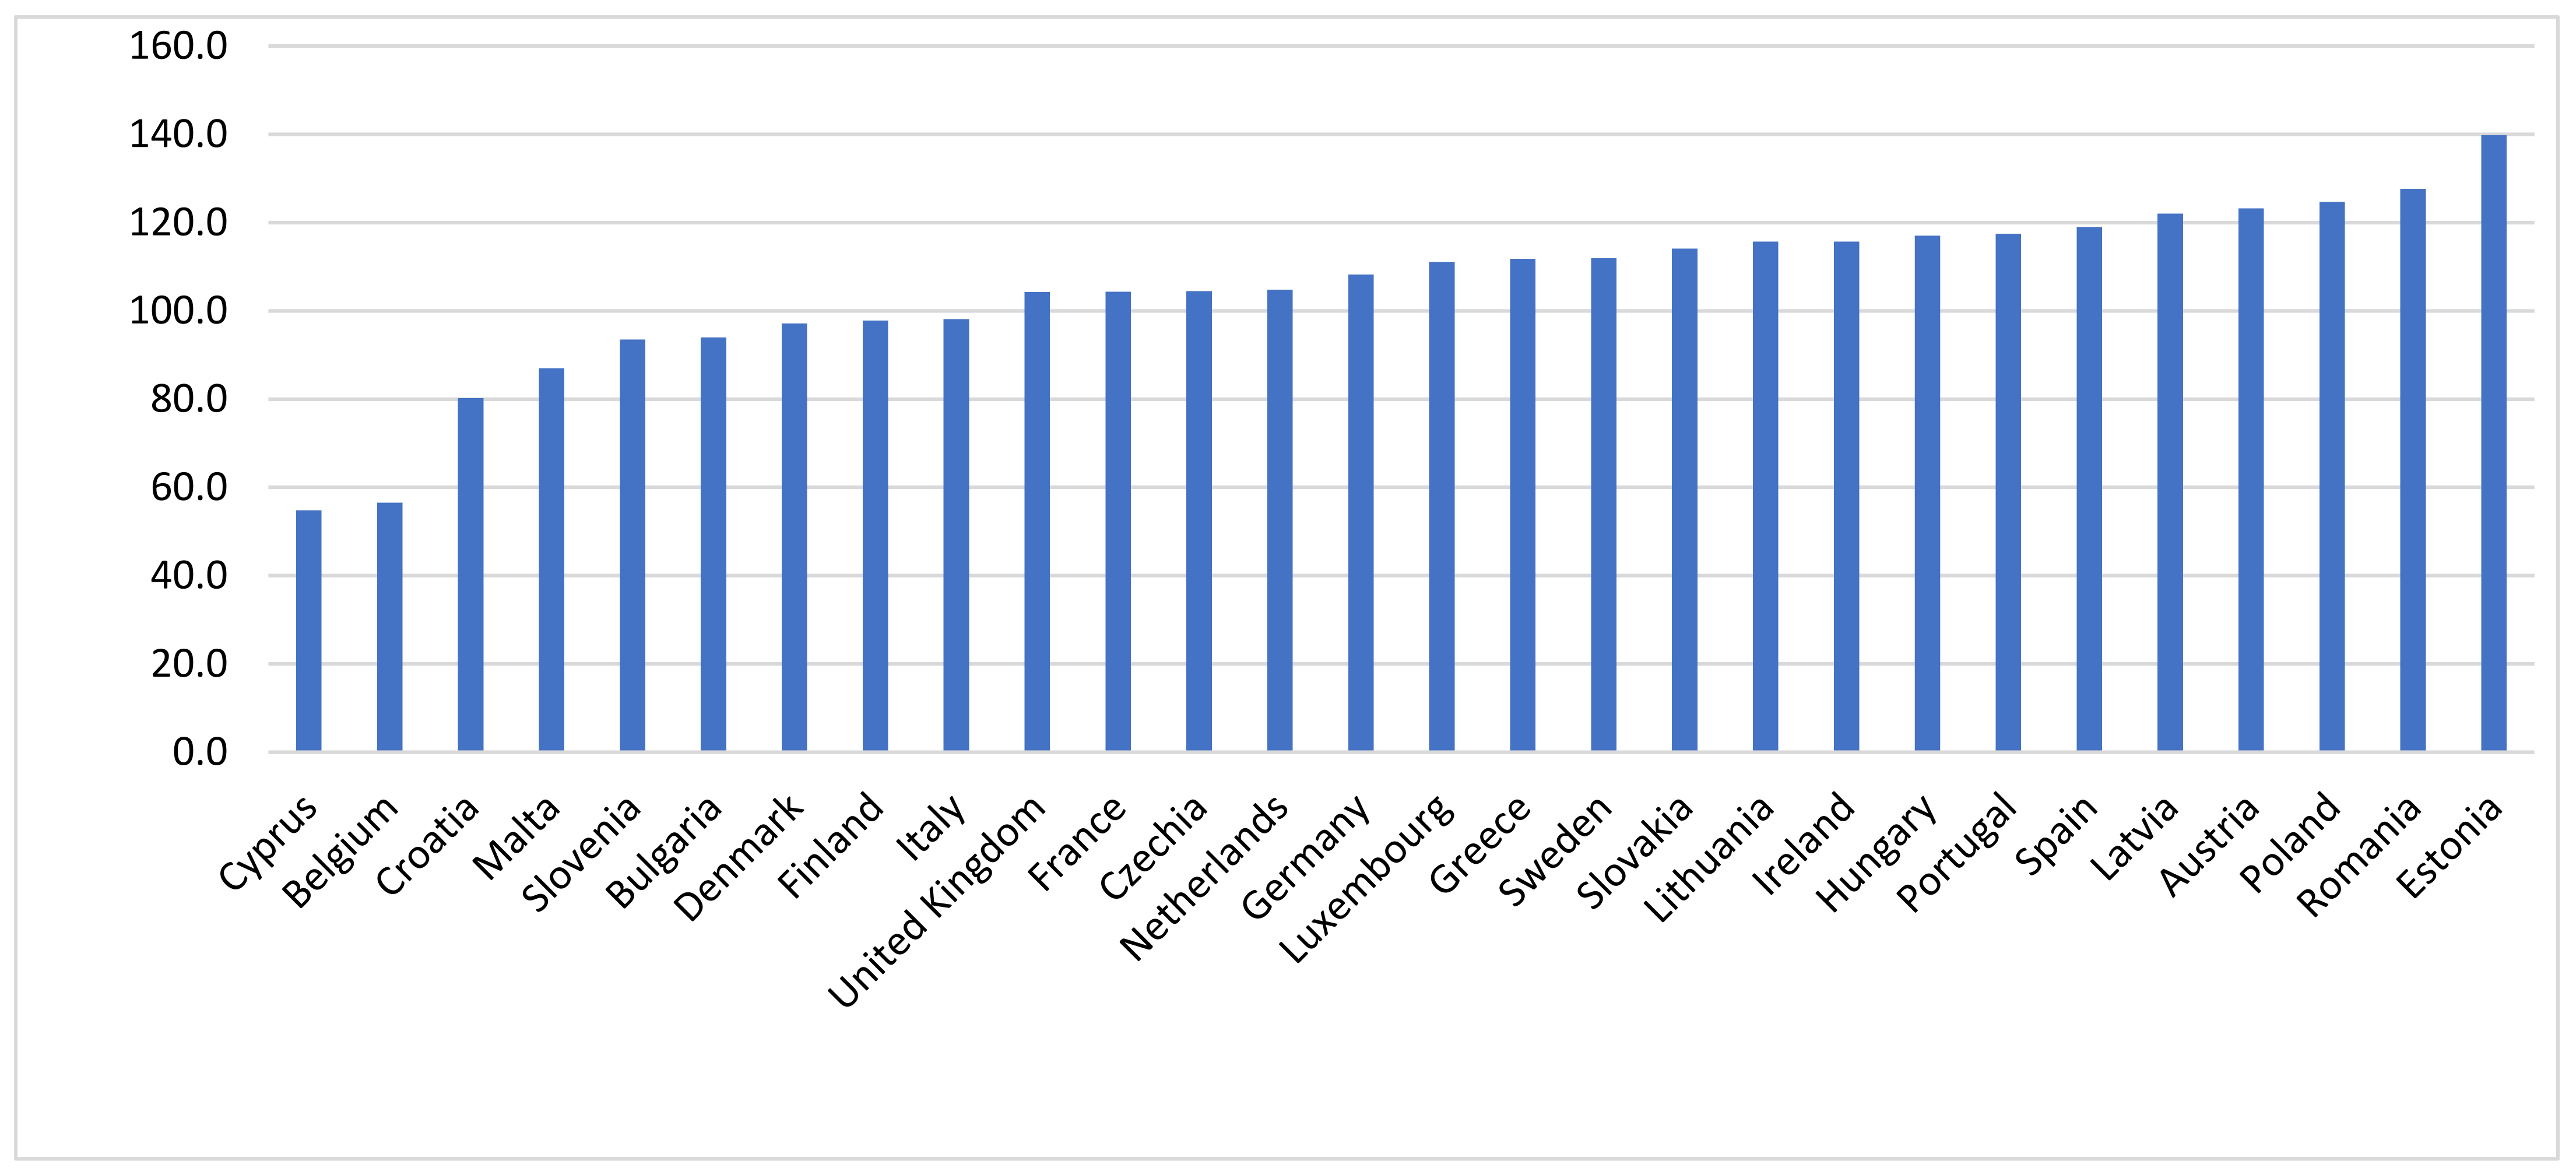
| Country | 2010 | 2019 | 2010–2019 | Dynamics (2010 = 100) |
|---|---|---|---|---|
| Austria | 1875.3 | 2482.1 | 2284 | 132.4 |
| Belgium | 5768.5 | 6464.8 | 6084.8 | 112.1 |
| Bulgaria | 690 | 724.1 | 697.3 | 104.9 |
| Croatia | 2135 | 1792.9 | 1883.4 | 84 |
| Cyprus | 5696.9 | 5992 | 5753.8 | 105.2 |
| Czechia | 1128.5 | 1286.5 | 1256.9 | 114 |
| Denmark | 3584.1 | 4477.2 | 3938.2 | 124.9 |
| Estonia | 647.3 | 926.8 | 780.8 | 143.2 |
| Finland | 1627.4 | 1687.2 | 1614.3 | 103.7 |
| France | 2257.3 | 2354.4 | 2326.5 | 104.3 |
| Germany | 2956.9 | 2953.4 | 2980.1 | 99.9 |
| Greece | 1874.6 | 2057.1 | 1959.5 | 109.7 |
| Hungary | 1121.9 | 1490.5 | 1343.6 | 132.9 |
| Ireland | 1274.3 | 1657.1 | 1456.1 | 130 |
| Italy | 3505.2 | 3318.6 | 3454.1 | 94.7 |
| Latvia | 488 | 676.8 | 586.1 | 138.7 |
| Lithuania | 699.9 | 883.8 | 834.3 | 126.3 |
| Luxembourg | 2389.9 | 2606.4 | 2517.7 | 109.1 |
| Malta | 10405.2 | 8910.2 | 9608.1 | 85.6 |
| Netherlands | 13,103.1 | 14,241.4 | 13,734.1 | 108.7 |
| Poland | 1343.3 | 1554.9 | 1464.5 | 115.8 |
| Portugal | 1752.5 | 1898.2 | 1809 | 108.3 |
| Romania | 995.5 | 1263.9 | 1115.8 | 127 |
| Slovakia | 916.5 | 1046.7 | 1051.8 | 114.2 |
| Slovenia | 2282.5 | 2481.7 | 2304.4 | 108.7 |
| Spain | 1653.3 | 2039.4 | 1831.8 | 123.4 |
| Sweden | 1622.4 | 1976.2 | 1769.4 | 121.8 |
| United Kingdom | 1310 | 1461.1 | 1390.2 | 111.5 |
| EU-28 | 2682.3 | 2882.3 | 2779.7 | 107.5 |
| Coefficient of variation (%) | 108.3 | 101.3 | 104.4 | - |
Publisher’s Note: MDPI stays neutral with regard to jurisdictional claims in published maps and institutional affiliations. |
© 2022 by the authors. Licensee MDPI, Basel, Switzerland. This article is an open access article distributed under the terms and conditions of the Creative Commons Attribution (CC BY) license (https://creativecommons.org/licenses/by/4.0/).
Share and Cite
Zakrzewska, A.; Nowak, A. Diversification of Agricultural Output Intensity across the European Union in Light of the Assumptions of Sustainable Development. Agriculture 2022, 12, 1370. https://doi.org/10.3390/agriculture12091370
Zakrzewska A, Nowak A. Diversification of Agricultural Output Intensity across the European Union in Light of the Assumptions of Sustainable Development. Agriculture. 2022; 12(9):1370. https://doi.org/10.3390/agriculture12091370
Chicago/Turabian StyleZakrzewska, Aneta, and Anna Nowak. 2022. "Diversification of Agricultural Output Intensity across the European Union in Light of the Assumptions of Sustainable Development" Agriculture 12, no. 9: 1370. https://doi.org/10.3390/agriculture12091370